


Crowdwork for young people
Risks and opportunities
Abstract
In recent years, crowdworking has emerged as a small but rapidly growing source of employment and income principally for young(er) people. Here, we build on previous work in identifying the determinants of crowdworkers’ earnings. We focus on the reasons why young crowdworkers earn significantly higher hourly wages than their older counterparts. We show that this is due to the higher returns to experience accruing to younger crowd-workers. Educational attainment does not explain this age-based differential, as education is a negligible factor in determining crowdworkers’ earnings. We also analyse why young women earn around 20% less than their male counterparts despite blind hiring. We confirm that this is partly explained by constraints on working time faced by women with children. The analysis also shows that ‘freely chosen’ crowd work - as opposed to, young people crowd-working because of a lack of alternative employment opportunities - is conducive to higher levels of job satisfaction. Moreover, young crowdworkers in middle income countries earn less than their counterparts in high income countries but report higher levels of job satisfaction. This is entirely attributable to the lower quality of their options outside of crowdwork.
Introduction
The internet has transformed many aspects of our lives including the way we communicate, the way we learn and the way people meet each other. Jobs have been no exception, with the internet modifying how people work and the jobs they perform. Some of these newly created jobs are part of the so-called “gig economy” and can be found on crowdsourcing platforms, online labour markets where employers and workers from all nationalities meet.1
The COVID-19 pandemic has accelerated an already growing trend, with companies exploiting the potential of a digital labour force and workers affected by curfews and lockdowns seeing online gigs as an opportunity to earn a living. In this context, the contribution of this paper, focused on working conditions on crowdsourcing platforms, is timelier than ever. The objective of this research can be bluntly summarized in the following question: “Can we foresee a future crowd workplace in which we would want our children to participate?” (Kittur et al. 2013, 1). Two indicators of working conditions are investigated in this paper, earnings and job satisfaction, which we have obtained from an International Labour Office (ILO) survey of crowdworkers.
Crowdsourcing platforms allow employers to post online tenders for small tasks which job seekers may accept. The advantage to employers is clear; instead of hiring an employee and bearing the risk that the person will not be needed or will not perform to the agreed standard, companies hire workers for a project or task, using piece-rate rewards that are only paid if the work is of the desired quality. If the work does not meet the employer’s expectations, they may choose to not pay the worker but keep the work. Moreover, workers in these platforms operate as own-account workers independently of how frequently they work for the same employer.2 This characteristic has lead authors like Berg (2016) or de Stefano (2016) to argue that crowdworking increases the number of workers excluded from fundamental rights.
However, crowdworking also has significant potentially positive attributes for workers. For instance, it allows for remote labour market access that is relatively discrimination free. This helps workers that suffer from discrimination in their local labour markets or whose circumstances require them to work from home. These, and other features, like self-management and the diversity of the tasks posted may have important beneficial implications for workers’ lives. Furthermore, crowdsourcing platforms provide access to relatively high paying tasks to people from developing countries, as emphasized by Thies et al. (2011) or Taeihagh (2017). Indeed, we present evidence showing that crowdsourcing platforms remunerate at internationally determined prices which are higher than many countries’ minimum or even average hourly wages. This means that workers from developing nations can, in principle, benefit significantly from crowdwork. The participation of workers from poor countries is, nevertheless, low; in spite of initiatives like mClerk, a platform for mobile crowdsourcing. 3 Lack of reliable connectivity and access to computers still pose significant entry barriers to workers in lower-income countries.
Despite the game-changing implications of crowdsourcing platforms’ earnings for workers in developing countries, the determinants of crowdwork earnings have seldom been explored. Literature on the topic has usually been more focused on the implications of crowdsourcing for employers. Examples of this employer-focused literature are to be found in research dealing with informational asymmetries between workers and employers and how it gives rise to a principal-agent problem. Research on cheating workers, malicious behaviour, and validation mechanisms for employers can be found in Difallah et al. (2012), Gadiraju et al. (2015) and Hirth et al. (2013). On the contrary, research on crowdwork earnings, either empirical or theoretical, is rather limited. An example of the former is Adams & Berg (2017), who, with the same ILO survey analysed here, used earnings from crowdsourcing platforms to estimate the gender-pay-gap of crowdworkers. At the theoretical level we find Horton & Chilton (2010), who calibrate the average hourly earnings for workers using the Amazon Mechanical Turk (AMT) platform.
The second contribution of this paper concerns the determinants of job satisfaction of workers using crowdsourcing platforms. This area has been investigated by Brawley et al. (2016) for workers registered on the AMT platform. Their study focused on the interactions between crowdworkers and the platforms they utilize. They conclude that some of the traditional determinants of job satisfaction do not apply to online platforms. In part, this is a direct consequence of the very nature of the micro-jobs: specifically, the freedom not to engage with unfair employers. Given the apparent freedom of choice it is hard to think crowdworkers would be deeply dissatisfied because the tasks and terms of work, in principle, are chosen by the crowdworkers themselves. The analysis presented here proposes a different approach, one that assesses the reasons for doing crowdwork (i.e. the circumstances of the person) as a determinant of crowdworkers’ satisfaction. In this regard, “freely chosen” crowdwork -as opposed to crowdwork being done due to the lack of available jobs- is found to increase workers satisfaction.
We focus on young people because they will be the ones who will benefit (or suffer) the most from crowdworking, but also because they tend to be more technologically savvy than adults. This technological aptitude makes them more likely to take full advantage of crowdsourcing platforms. Analysis confirms that young crowdworkers learn how to use online platforms faster and more efficiently than adults. This is, in turn, reflected in a positive youth/adult hourly wage differential in crowdwork. For young people, wages increase rapidly with experience in online tasks. In addition, due to young people’s poorer outside options, they find crowdwork more rewarding in terms of fairness of pay. Last but not least, young people are also more satisfied crowdworkers -other things being equal - than adults. This makes them ideal candidates to, in principle, be the main beneficiaries of crowdwork.
In what follows, after first describing the data used in the analysis, Section 2 analyses the determinants of crowdworkers’ earnings, whilst Section 3 focuses on the factors determining job satisfaction for workers on crowdsourcing platforms. Section 4 draws together some conclusions based upon the analyses.
Crowdwork and earnings
Data and descriptive statistics
This paper uses data from a global crowdwork survey carried out by the International Labour Office in November, 2015. The survey was taken by 999 respondents from 47 countries via either the Amazon Mechanical Turk (AMT) or Crowdflower.4
The information gathered by the ILO survey includes basic socio-demographic information (age, primary language, country of residence, educational attainment), questions about crowdwork employment (reasons for doing crowdwork, hours worked, earnings, tenure, skill mismatch) and some questions about other types of employment held by the respondent. It should be noted that the variable educational attainment is measured in terms of the highest qualification obtained rather than by years of schooling and that the various reasons for doing crowdwork are not mutually exclusive.
Of particular importance is the existence of a measure of wages (reported in 2015 US$) and hours worked, both reported on a weekly basis. There are two measures of hours worked, the first one only counts the hours of work actually paid (i.e., the time a person would spend filling out a survey if that were the given task). The second one also includes the time spent in searching for tasks, reviewing clients and other unpaid duties related to the job. Throughout the paper we use the latter measure when calculating the hourly wage so that crowdwork earnings can be compared with wages from salaried employment. For example, if an employee were to be paid US$ 100 for 8 hours and a crowdworker US$ 100 for 1 hour of work that requires 7 of preparation, it would not be accurate to say the crowdworker earns 8 times more. The hourly wage is calculated by taking weekly wages and dividing that figure by the total number of hours devoted to crowdworking tasks.
Table 1 provides mean values of the variables used in the analysis in Sections 3 and 4. In addition, Appendix A provides the same statistics by age group and by the purchasing power of a dollar in the crowdworkers’ countries of residence. The average hourly wage shown in Table 1 is strongly influenced by the large number of American ‘Turkers’ in the sample; these workers earn, on average, US$ 5.09 per hour, much higher than the US$ 1.95 per hour that workers from other countries earn. It is important to note that the variable AMT appearing in Table 1 denotes the crowdsourcing platform used by the respondent to fill in the survey, i.e. it is a binary variable since workers took the survey either in AMT or Crowdflower. Moreover, it does not preclude that a person is active on both platforms or indeed also on other platforms, although such incidence is rare in the dataset.
Statistics on job satisfaction are restricted to three rating categories, “neutral”, “satisfied” and “very satisfied.” The original question also allowed respondents to answer “dissatisfied” (6.6%) and very “dissatisfied” (0.9%) but due to their low prevalence they are put together with those who answered “neutral” (17.3%). The low prevalence of dissatisfied crowdworkers is not particularly surprising. As observed above, the amount of choice workers have, starting with whether to do crowdwork altogether or not, but also (and in contrast to other jobs) the choice over the number of hours spent working, the tasks performed and the timing of working hours points to why crowdworkers tend to not be dissatisfied.
Table 1. Descriptive statistics, mean value of each variable
|
Variable |
Other regions |
USA |
Variable |
Other regions |
USA |
|
|---|---|---|---|---|---|---|
|
Hourly wage |
3.74 |
4.09 |
Main job |
0.42 |
0.33 |
|
|
Weekly hours |
33.28 |
30.93 |
English |
0.79 |
0.65 |
|
|
Age |
36.46 |
33.24 |
AMT |
0.81 |
0.68 |
|
|
Tenure |
Under-qualified |
0.25 |
0.22 |
|||
|
<6 months |
0.27 |
0.23 |
Over-qualified |
0.33 |
0.38 |
|
|
6-12 months |
0.19 |
0.21 |
Reason for crowdworking |
|||
|
>12 months |
0.54 |
0.55 |
No employment available |
0.14 |
0.15 |
|
|
Education |
Only able to work at home |
0.23 |
0.12 |
|||
|
High school or less |
0.11 |
0.14 |
Prefers working at home |
0.47 |
0.41 |
|
|
Post-secondary |
0.37 |
0.29 |
Pay is better |
0.08 |
0.13 |
|
|
Tertiary |
0.52 |
0.57 |
Complement a second job |
0.47 |
0.51 |
|
|
Job satisfaction |
Cash while at school |
0.07 |
0.10 |
|||
|
Neutral/dissatisfied |
0.25 |
0.25 |
Leisure |
0.24 |
0.31 |
|
|
Satisfied |
0.57 |
0.53 |
It is fun |
0.41 |
0.46 |
|
|
Very satisfied |
0.18 |
0.22 |
Other |
0.13 |
0.06 |
|
|
Nº of obs. |
414 |
585 |
Nº of obs. |
414 |
585 |
|
Crowdworkers are highly educated compared to their compatriots. For example, more than 90% of Indian crowdworkers, aged 20-65, have a tertiary educational qualification, compared to 11% countrywide.5 The divergence in educational attainment is particularly noticeable for crowdworkers from developing countries (see Appendix A). This signals that there are restrictions in access to crowdworking platforms, perhaps due to computers being relatively expensive or because of lack of reliable internet connectivity. At the same time, this is also suggestive of where future crowdworkers might come from. If computers keep getting cheaper and reliable Internet connections become a reality in more developing countries, people with more meagre means, particularly in Africa, will have the potential to become crowdworkers.6
The reasons given for starting crowdwork by those surveyed range from a lack of other job opportunities to crowdwork being somewhere close to a hobby. These reasons can plausibly be thought of in terms of individual constraints, either at the personal level (e.g. family choices) or at the regional level (i.e. job market tightness, locally prevailing wages, etc.). Seen in this way, it is not surprising that crowdworkers living in richer countries -where alternative salaries are higher - are more likely to use crowdwork as a second job, rather than as their major source of income. Similarly, the proportion of young people (51%) using crowdsourcing platforms as the primary source of income is higher than for adults (28%). In poor countries, close to 30% of people surveyed chose crowdwork because they earn more than in other available jobs. This is practically non-existent in rich countries. (see Appendix A).
Overall, gender differences in the descriptive statistics are minor. One of the few exceptions concerns the proportion of women who chose crowdwork because they had to work at home, which is significantly higher than the corresponding proportion of males. Women in the sample are also slightly older (2.5 years more) and work longer hours (3 hours more).
Finally, the survey we gathered data from does not represent newbies to online platforms but rather seasoned crowdworkers. The majority of respondents reported having more than one year of experience in crowdworking. However, this statistic might have been influenced by the selection rule for survey participants; only those who, at the time of the survey, had completed at least 500 tasks in AMT or were deemed as a “Quality Worker” by Crowdflower could participate.
Wages in crowdsourcing platforms
The press has repeatedly noted that crowdwork earnings are extremely low.7 The research literature on crowdsourcing analyses whether a minimum wage should be imposed or directly wonders why workers do it at all.8 In this section we use global information on crowdworkers’ earnings contained in the ILO-SOC dataset to, precisely, find out whether or not the bad reputation crowdsourcing platforms have earned is justified. We do so by first testing whether the “law of one price” holds in crowdsourcing markets and, thus, whether we can speak in terms of a unified global labour market. This test is simple but at the same time powerful; unified pricing means that the utility from crowdworkers’ earnings depends exclusively on the cost of living in the workers’ residence country, thus disproportionately benefitting those living in developing countries.
Young people are another group that might find crowdsourcing platforms rather attractive. This is primarily due to the relatively poor employment options faced by young people, compared to older workers, in local labour markets. In particular, young people are more likely than adults to be unemployed and face higher degrees of uncertainty regarding their work contracts. Young people also have low expectations regarding present job security. This would make those aged 15-29 more content with the type of work offered by crowdsourcing platforms. (ILO, 2020) In addition, young people seem to have, on average, better problem-solving skills in technology-rich environments, potentially making them more productive than older workers when employed as crowdworkers.9 In sum, young people might benefit more than older workers from crowdwork because of their more limited outside options and their higher chance at excelling at this type of job. This also suggests that young people are more likely to report being content with the opportunities provided by crowdsourcing platforms.
Determining the impact of these and other factors – like education- on crowdwork earnings is the aim of the econometric model described in the following subsection.
Econometric model
In order to analyse the determinants of hourly wages in our cross-section of crowdworkers we propose a Mincerian equation whose dependent variable is the natural logarithm of hourly wages. The wage equation model is given by:
|
|
(1) |
where
With regards to the job-related characteristics, we specifically allowed for crowdworkers to earn a premium based on how long they have been crowdworking. We built three tenure intervals, less than 6 months, 6 to 12 months, and more than 12 months. We included the last two in the regression. We also included a binary variable called AMT to take the value 1 when the worker took the survey on Amazon Mechanical Turk and 0 for when taken on Crowdflower. On a related issue, we checked whether comments found on the internet about AMT employers discriminating in favour of US crowdworkers have an empirical basis.10 We did so by allowing for an interaction term, AMT*US, that takes the value 1 when the individual who took the survey in the Amazon Mechanical Turk was based in the United States. We also added a binary variable that takes the value 1 when the person is a native English speaker. We did this to make sure the model does not produce a false positive (higher AMT*US coefficient) in the discrimination test just because US crowdworker almost invariably would possess this skill.
Table 2. Crowdwork average hourly earnings, by region
|
Variable |
Other regions |
USA |
Variable |
Other regions |
USA |
|
|---|---|---|---|---|---|---|
|
XR/PPP ratio |
English |
1.91 |
5.10 |
|||
|
<1.2 |
1.14 |
5.09 |
AMT |
2.75 |
5.13 |
|
|
1.2-2.4 |
1.68 |
Na |
Tenure length |
|||
|
>2.4 |
2.30 |
Na |
<6 months |
1.94 |
4.30 |
|
|
Weekly hours |
6-12 months |
1.70 |
4.86 |
|||
|
<15 |
3.11 |
6.14 |
>12 months |
2.02 |
5.61 |
|
|
15-30 |
1.39 |
5.09 |
Education |
|||
|
>30 |
1.06 |
4.57 |
High school or less |
1.95 |
5.20 |
|
|
Age |
Post-secondary |
1.52 |
5.14 |
|||
|
20-29 years |
2.29 |
5.86 |
Tertiary |
2.05 |
5.02 |
|
|
30-65 years |
1.74 |
4.69 |
Among the individual characteristics included in the matrix
In other words, if the estimated coefficient is positive and statistically significant, we cannot reject the hypothesis that online employers price discriminate against crowdworkers based on their country of origin. Adding the XR/PPP ratio allows us to control for supply side effects that might interfere with the discrimination test just mentioned. Workers living in cheaper places may (through an efficiency wage effect) work harder because they are earning more goods and services than workers in more expensive locations, even if the nominal pay rate is identical. If that were to be the case, not adding the ratio could cause the coefficient on average wages to become positive when it should not, giving our data a false positive variable.
Likewise, Barnes et al. (2015) defend a similar argument by emphasizing that crowdworkers have a disposition for, and feel the need to, continuously improve their skills. This specification adds the following line to equation (1):
|
|
(2) |
where
The second issue deals with the effect of children on earnings when parents decide to work at home. This is modelled as a triple interaction with the help of a binary indicator that becomes active when the person does crowdwork because he/she prefers working from home. The female indicator and a binary variable takes the value 1 if there are children in the house. The coefficient
|
|
(3) |
where “nojob” means that the person does crowdwork because he/she could not find other employment and “home” means that the person does crowdwork because he/she prefers to work from home (reasons not mutually exclusive).
Results
The results from estimating all three specifications - Eq. (1) to Eq. (3) - can be found, in their order of appearance, in Table 3. The coefficients can be -roughly- interpreted as the percentage increase in wages when a variable is active/increased marginally because of the log-level modelling.
Table 3. Log hourly wage regressions
|
Variable |
Specification 1 |
Specification 2 |
Specification 3 |
|---|---|---|---|
|
Weekly hours |
-0.02*** |
-0.02*** |
-0.02*** |
|
Weekly hours2 |
0.00003*** |
0.00003*** |
0.00004*** |
|
Ratio XR-PPP |
0.04 |
-0.04 |
0.08 |
|
US$ Average wage |
-0.00005 |
-0.00005 |
-0.00002 |
|
Age |
-0.01*** |
0.04 |
-0.01*** |
|
Age2 |
-0.0006 |
||
|
Education (high school or less=0) |
|||
|
Post-secondary |
0.03 |
-0.03 |
-0.04 |
|
Tertiary |
-0.13 |
-0.13 |
-0.15* |
|
Tenure (<6 months=0) |
|||
|
6-12 months |
0.08 |
1.67* |
0.09 |
|
6-12 months*Age |
-0.08* |
||
|
6-12 months*Age2 |
0.0009 |
||
|
12+ months |
0.21*** |
1.49** |
0.23*** |
|
12+ months*Age |
-0.07 |
||
|
12+ months* Age2 |
0.0007 |
||
|
English |
0.09 |
0.09 |
0.08 |
|
Female |
-0.23*** |
-0.23*** |
-0.22*** |
|
AMT |
0.01 |
-0.02 |
-0.04 |
|
AMT*US |
1.61*** |
1.59*** |
1.62*** |
|
No other job |
-0.21** |
||
|
No other job*female |
0.11 |
||
|
Prefers home |
0.24*** |
||
|
Prefers home*female |
0.02 |
||
|
Prefers home*female*children |
-0.28*** |
||
|
R2 |
0.4985 |
0.5003 |
0.5091 |
|
Nº of observations |
999 |
Significance: ***at 1%, ** at 5%, *at 10%.
One of these constraints may well be related to the extra duties women face at home. For instance, male crowdworkers who work at home because they prefer it (variable ‘prefers home’ in Table 3) earn 24% more. This earnings’ premium is unaltered in the case of women without children at home but becomes negative (-4%, which results from subtracting 0.28 to 0.24 in Table 3) when female crowdworkers have children at home. One question remains open though, what is the channel between children and lower earnings? This could happen if, for instance, more rewarding tasks (in terms of hourly earnings) took longer to finish, thus, not allowing someone with other ongoing duties (i.e. childbearing) to take them.
Female crowdworkers, considering the preceding paragraph, might come across as low performers but this is not confirmed by the analysis. The proxy for ability (“no other job”) is associated with 21% lower earnings in the case of men, whilst the coefficient on the female interaction term is actually positive albeit not statistically significant. This suggests that women with fewer outside (local) opportunities are, if anything, more able than similarly positioned men. An obvious plausible explanation for this would be the existence of gender discrimination in local labour markets.
Figure 1: Return to hours worked
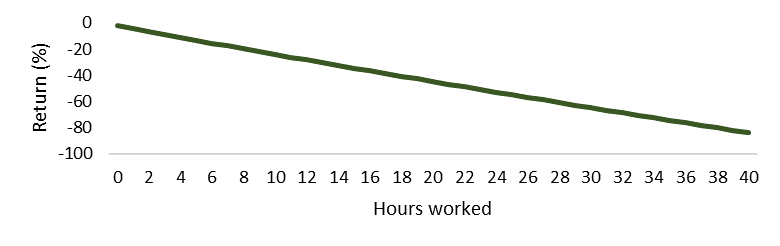
Figure 2: Returns to tenure in crowdwork, by age

Note: The graph shows the return to two levels of tenure, 6-12 months and more than 1 year, in comparison with crowdworkers with less than 6 months of experience in crowdwork whose return is normalized at zero.
The gains from experience, though, are not equally distributed among age groups. The second specification finds that young people can be regarded as being technologically savvy (see Figure 2, Returns to tenure levels by age). According to the marginal effects, younger people are not only faster at learning (shorter distance between the horizontal axis and the 6-12 months of tenure line), but also more effective since their returns are significantly larger than those of older workers for any tenure level.
The main consequence of a global market is the generation of losers and winners, the latter mainly arising in countries with a low cost of living. In order to identify the countries where crowdwork pay is more likely to be found attractive we define the ratio between the full time equivalent average monthly earnings in crowdwork, wc, and the average monthly salary in the country in 2015, wa, as follows: 13
|
|
(4) |
Here, it refers to the country, meaning we calculate the ratio for each of the countries represented in the data. Full time equivalent earnings are calculated by multiplying the average hourly earnings in crowdwork, US$ 1.95, by the number of hours that constitute a full-time week in each of the 47 countries under analysis.1415
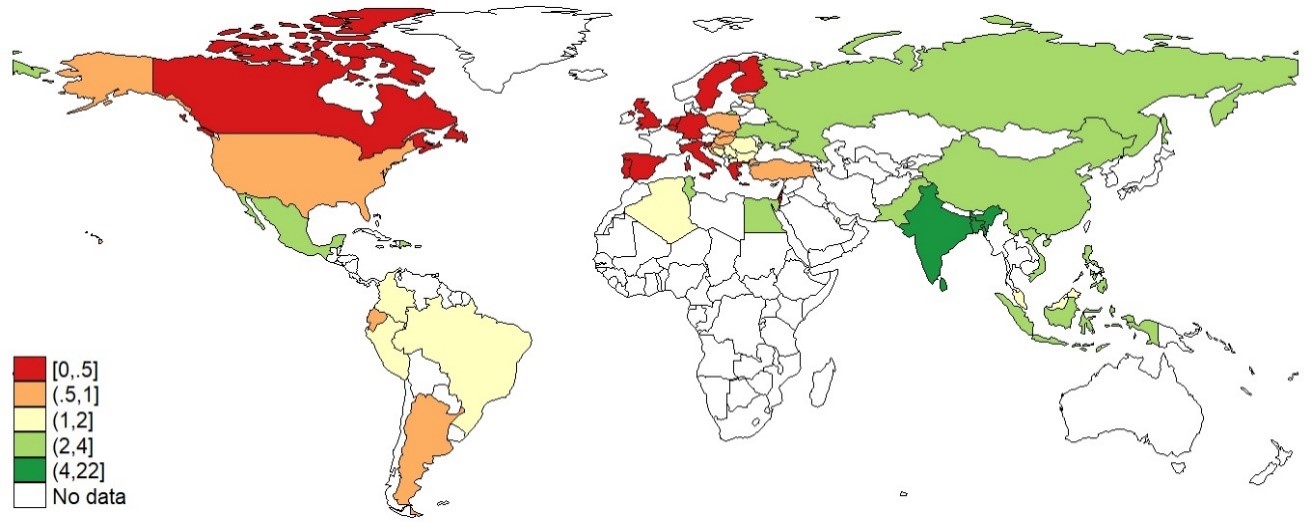
Figure 3: FTE Monthly average earnings in crowdwork to monthly average salary in the country
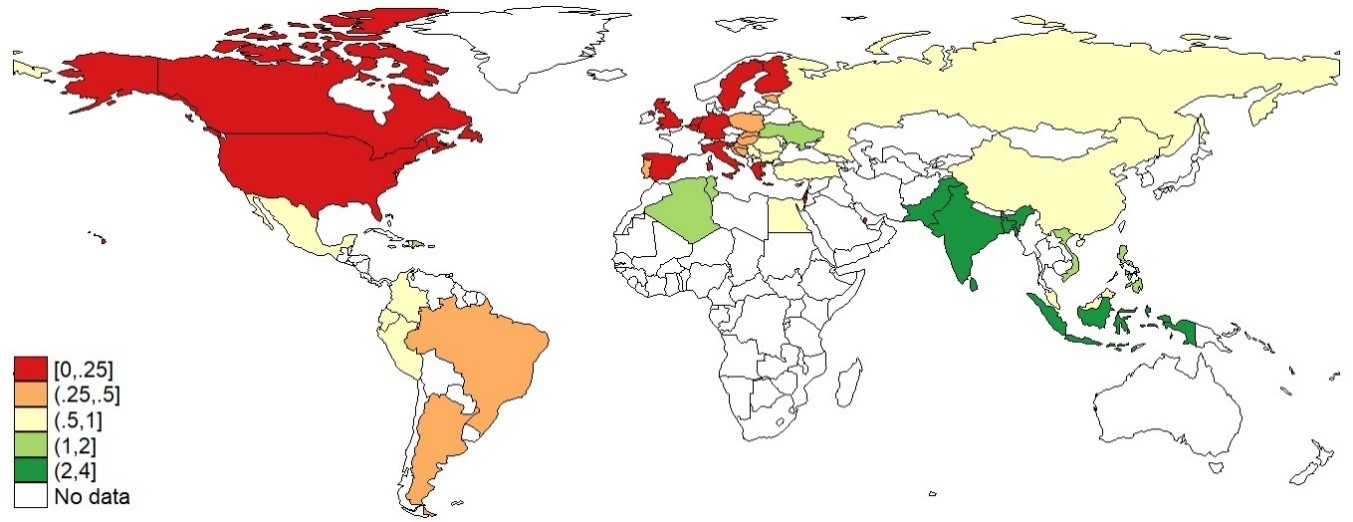
Source: Crowdwork earnings from the ILO-SOC dataset. Average wages from ILO (2016) and the ILO Labour Force Micro Database.
The ratio is plotted in a map (see Figure 3) where the green colour represents countries where crowdwork earnings are higher than the average salary of the country while the yellow/red colours denote the contrary.
According to the map, crowdworking would hardly allow workers in developed countries to earn a living. This is particularly acute in North America and among the richest members of the European Union, where the FTE monthly crowdwork earnings are less than 25% of the country’s average wage. In some countries (coloured in yellow and orange) crowdworking earnings would allow full time workers to live and, depending on the workers’ personal circumstances (outside options), they might even find crowdwork earnings attractive. But the true winners of crowdsourcing live in green coloured countries. Crowdworkers in Indonesia, India and Pakistan earn, at least, twice as much as the average employee in their respective countries.
Agreement over pay fairness is also widely different among respondents who come from lower- versus higher-income countries. For example, we find that the percentage of young people agreeing pay is fair is 31 percentage points higher among those living in the lowest HDI countries than among those living in the highest HDI countries. Last but not least, Table 4 also shows that crowdworking is better regarded by young people than by adults, irrespective of the degree of development of their country of residence.
Table 4: Percentage of respondents who agree that crowdworking pay is fair
|
|
|
|||
|---|---|---|---|---|
|
|
|
30-65 years |
|
30-65 years |
|
|
9.09 |
3.68 |
31.37 |
23.74 |
|
0.7-0.9 |
20.00 |
10.32 |
52.31 |
30.00 |
|
|
38.89 |
25.93 |
62.32 |
52.57 |
Determinants of job satisfaction
Crowdwork is characterized by a high degree of flexibility in when and how a person decides to work. But, it is also characterized by other, not so positive, aspects: lack of promotion opportunities, simple and repetitive tasks (that may lead to perceived over-qualification), relatively low pay and, above everything, an extreme short-termism that demands crowdworkers sign several contracts every day. All of the above-mentioned characteristics have the potential to affect -mostly negatively- crowdworkers’ job satisfaction. These factors prompt the question: who can benefit from crowdworking?
A partial answer can be extracted from Section 3, where it is shown that crowdwork pay is constant across countries.16 Thus, those living in developing countries are more likely to benefit from crowdwork. Despite the importance of monetary earnings for a family’s well-being, however, pay is by no means the only determinant of job satisfaction.17 Indeed, earnings might not even be one of the major determinants of job satisfaction. According to Morgan (2014), monetary compensation comes
Methodology
We assume the existence of an unobserved latent variable, , that reflects the job satisfaction of the
|
|
(5) |
where
Among the determinants contained in
In addition, we construct a conversion factor based on the ratio of the exchange rate to PPP for the country of residence of the crowdworker.18 The ratio XR/PPP provides the amount of local goods that a US dollar can buy, representing the international purchasing power of crowdworkers’ earnings. This variable adds a cross-country component and allows us to test whether living in a cheaper country (holding earnings constant) provides higher job satisfaction. It can also be part of a test (the other part being the nominal hourly pay rate) to ascertain whether workers’ satisfaction is linked to either the nominal or the real component of their earnings.
Finally, we allow for the reasons that led crowdworkers to join these platforms as potential determinants of job satisfaction. This is a different approach from the one followed by Brawley and Pury (2016) whose research is focused on the impact that online platforms’ characteristics have on crowdworkers’ job satisfaction. The rationale and the need for a paper focused on personal, as opposed to platform, characteristics is that the latter do not allow for a precise profiling of the winners and losers of crowdwork. Instead, the reasons for crowdworking tell us more about the kind of people doing these tasks and allow for future policy actions such as offering alternatives to those who are more likely to find themselves dissatisfied.
The percentage of respondents falling into each of the categories is shown in Table 5. Due to the low number of respondents in certain groups, those who answered, “very dissatisfied” and “dissatisfied” were grouped together with those who claimed to be “neutral”.19 The new variable has, thus, three options, “very dissatisfied”/ “dissatisfied”/ “neutral” (hereafter referred as “neutral” for brevity), “satisfied” and “very satisfied”, respectively denoted by .
Table 5: Percentage of respondents in each of the job satisfaction categories
|
|
|
|
|
|
|
|---|---|---|---|---|---|
|
|
0.82 |
6.73 |
16.83 |
54.05 |
21.57 |
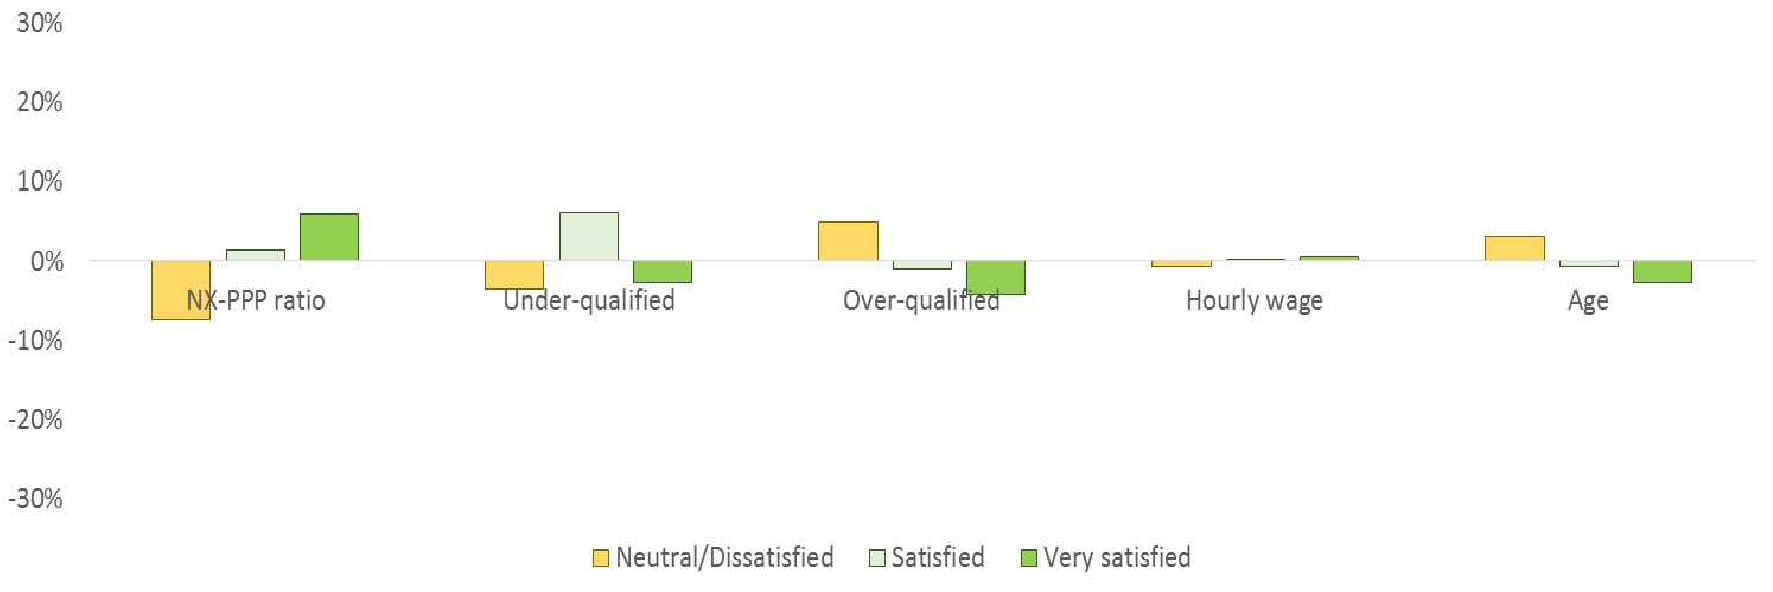
The group-specific percentage of respondents falling into each of the three job satisfaction levels is reported in Table 6. Overall, the percentage of workers falling into each of the satisfaction levels is intuitive. This suggests that choice is positively related to job satisfaction and, thus, is in line with the weak axiom of revealed preference. With respect to the reasons for doing crowdwork, the data shows that the highest proportion of very satisfied workers is found among those who argued that in crowdwork “pay is better” than in other available jobs and among those who find crowdworking “fun.” In turn, the highest proportion of neutral (including dissatisfied) crowdworkers is found among those who joined crowdsourcing platforms because “no other employment was available.” Among the rest of the variables, it is noteworthy to observe that those over-qualified and in more expensive countries (ratio XR/PPP
Table 6: Summary statistics, job satisfaction by sub-group
|
Satisfaction level |
|||
|---|---|---|---|
|
|
|
|
|
|
|
|||
|
|
0.30 |
0.56 |
0.14 |
|
|
0.14 |
0.61 |
0.25 |
|
|
0.14 |
0.45 |
0.40 |
|
|
0.25 |
0.57 |
0.18 |
|
|
0.25 |
0.53 |
0.22 |
|
|
0.22 |
0.58 |
0.20 |
|
|
0.29 |
0.54 |
0.17 |
|
|
|||
|
|
0.44 |
0.46 |
0.10 |
|
|
0.26 |
0.51 |
0.23 |
|
|
0.22 |
0.56 |
0.22 |
|
|
0.06 |
0.43 |
0.51 |
|
|
0.23 |
0.58 |
0.20 |
|
|
0.17 |
0.62 |
0.21 |
|
|
0.16 |
0.60 |
0.24 |
|
|
0.11 |
0.59 |
0.30 |
|
|
0.38 |
0.51 |
0.11 |
|
|
(6) |
Given the above stated information the probability that an individual (i) reports a job satisfaction level (j) is given by:
|
|
(7) |
where ∆ (•) represents the standard logistic cumulative distribution function, and and the model is estimated via maximum likelihood.
We carry out a Brant test as well as other Wald tests in order to test the parallel lines assumption. The results from the Brant tests are shown in Table 7. The p-value from the full model (column “All”) accepts that the entire model satisfies the parallel lines assumption. Still, three individual variables’ p-values (in bold) suggest that forcing the coefficients to be identical might not be correct. The source of these problems is better gauged when the test is performed on models for men and women separately; while in the model for the former group all variables satisfy the assumption, in the model for the latter group the parallel lines assumptions suffers a serious drawback. It not only showcases the same problem as the model for all workers does, but also is very close to rejecting the idea that the model meets the parallel lines assumption. The failure of the assumption is also accepted by the Wald tests suggested by Williams (2006), which also flags the same four variables in bold in Table 7.
Although the ordered logit appears to be excessively parsimonious for women, the multinomial logit (which allows each satisfaction level to have its own
Table 7: Brant test for the parallel lines assumption
|
p-value |
|||
|---|---|---|---|
|
Indicator |
|
|
|
|
|
0 |
|
0 |
|
|
0 |
0 |
0 |
|
|
|
|
0 |
|
|
0 |
0 |
0 |
|
|
0 |
0 |
0 |
|
|
0 |
||
|
|
0 |
||
|
|
0 |
0 |
0 |
|
|
|||
|
|
0 |
0 |
0 |
|
|
0 |
0 |
0 |
|
|
|
|
0 |
|
|
0 |
0 |
0 |
|
|
0 |
0 |
0 |
|
|
|
|
0 |
|
|
0 |
0 |
0 |
|
|
|
|
0 |
|
|
0 |
0 |
0 |
Notes: P-values lower than 0.1 signal that the variable/model may not satisfy the parallel lines assumption.
In order to take advantage of both modelling options we follow Williams (2016) and employ a partial proportional odds model. This model allows the coefficients to depend on the job satisfaction level as follows:
|
|
(8) |
where the parallel lines (constant coefficient) assumption is relaxed in the model for women for three of the potential determinants of job satisfaction, “prefers working from home”, “cash while at school” and “it is fun.” Moreover, because the parallel lines assumptions was only marginally accepted for the variable “under-qualified”, we also relax the assumption for this variable in both models, the one for men and the one for women. Results from both models (the ordered logit and the generalized ordered logit where the parallel lines assumption is partially relaxed) are presented. The ones from the ordered logit are presented as odd-ratios to understand the direction of change in a simpler way (and which is accurate for most variables). The results from the generalized ordered logit are presented as marginal effects for a deeper analysis of the non-linearities found for some explanatory variables.
In order to determine the marginal effects of the covariates on the probability of achieving a certain satisfaction level we use equation (6) which defines the probability,
|
|
(9) |
Then, we take the partial derivative of the probability with respect the
|
|
(10) |
Finally, the average marginal effect, AME, of the covariate on the
Results
Table 8 presents odd ratios which are simple and represent a reasonable approximation, however, it makes sense to go further and analyse the variables whose coefficients are marked in bold using the partial proportional odds model since for these variables, the parallel lines assumption is invalidated. Not doing so carries the risk of dismissing the importance of some variables as determinants of job satisfaction when they actually do play a role. Results from the PPO model in the form of marginal effects are shown in Figure 4, for men in graphs (a) and (c), and for women in graphs (b) and (d).
Table 8: Likelihood of reaching a higher job satisfaction tier, ordered logit odd-ratios
|
Odd ratios |
|||
|---|---|---|---|
|
Variable |
|
|
|
|
|
1 |
1 |
1 |
|
|
1 |
1 |
0 |
|
|
|
|
0 |
|
|
0 |
0 |
0 |
|
|
0 |
0 |
0 |
|
|
0 |
||
|
|
1 |
||
|
|
|||
|
|
0 |
0 |
0 |
|
|
0 |
0 |
0 |
|
|
|
|
1 |
|
|
3 |
5 |
2 |
|
|
1 |
1 |
1 |
|
|
|
|
0 |
|
|
1 |
0 |
1 |
|
|
|
|
2 |
|
|
0 |
0 |
0 |
|
pseudo-R2 |
0.1238 |
0.1339 |
0.1218 |
|
Nº of observations |
999 |
414 |
585 |
These three reasons are all related to the person’s (lack of) opportunities and attitudes towards work but at the same time they offer different connotations that enrich the analysis. For instance, the link between finding crowdworking fun and the person gaining a higher job satisfaction, although in line with current trends towards a “gamification” culture, it is more likely to be indirect than direct.20 That is to say, fun is rarely the sole objective for doing a job and should not be expected to trigger job satisfaction on its own. The indirect link could be based on the positive attitude showcased by those loving their jobs as explained in Kupka (2012), who argues that happiness at work is a powerful signal for caring, being passionate and being content with one’s reality. Caution should be exercised when interpreting the coefficient on “it is fun” for women; according to Figure 4 this factor has a slightly milder effect on women, with “satisfied” being a more likely outcome than “very satisfied.”21
The second reason that stands out as a job satisfaction determinant is the lack of professional opportunities. From a utility maximization perspective, a reduction in the number of professional options available would normally reduce job satisfaction -or keep it on the same level in the best case. Not having other alternatives has a strong negative correlation with crowdwork “fun” (the reason commented in the previous paragraph) with a correlation at -0.75 and both coefficients being statistically significant. 22 This suggests that not having other opportunities has further connotations. Using the example of the previous paragraph, a person who enjoys doing crowdwork (“it is fun”) might not be satisfied if, for instance, the job does not fulfil the worker’s career expectations.
We also find that workers have higher levels of job satisfaction whenever their crowdwork pay is higher than the one they would attain in their best outside option (the job that would pay the second highest among the worker’s available options). This variable has a strong negative correlation with the reason ‘no other employment available’ which is logical since the less jobs are available the lower the chances the person is able to find one that pays more than crowdwork.
Figure 4. Marginal effects on three satisfaction levels
|
|
|
|
|
|
|
|
|
|
|
|

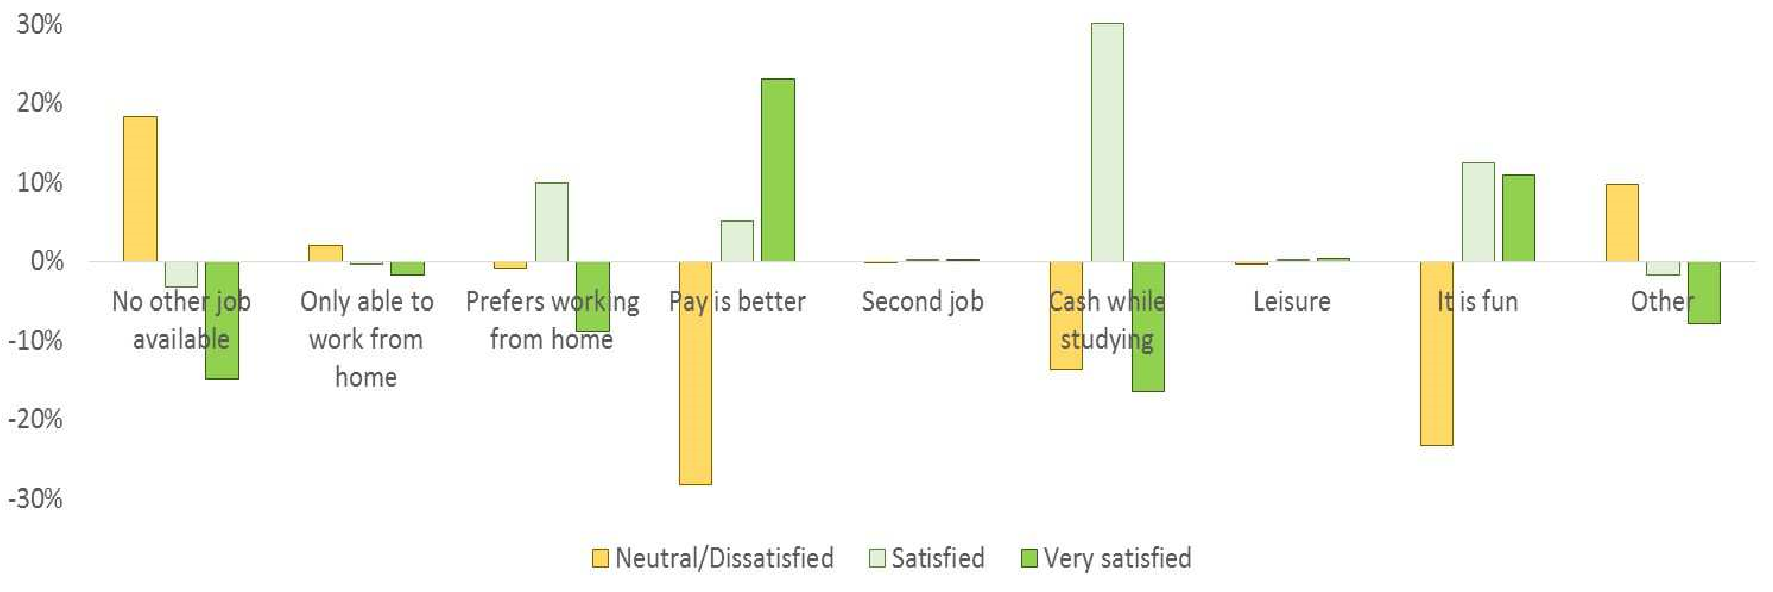

In fact, these two reasons (“no other job available” and “pay is better”) complement each other. The former can be interpreted as the set of choices’ size and the latter as the job satisfaction derived from having chosen the highest paying option.
At last, two reasons for women to do crowdwork that would have been dismissed as unimportant had we only looked at the results from the ordered logit (“prefers working at home” and “cash while going to school”), become statistically significant in Figure 4 (partial proportional odds model). In both cases women who argued those reasons showcase a milder, yet still positive, reaction in their job satisfaction level. These two, seemingly unrelated reasons, have one thing in common that could explain the milder link with job satisfaction: they reflect situations where the person is constrained (children or other dependents at home or difficulties paying for studies). In these situations, crowdwork, while not ideal, presents itself as a handy way to improve short-term economic challenges.
Conclusion
This paper contributes to the existing literature on crowdsourcing platforms by researching which sub-populations are more likely to achieve higher earnings and higher job satisfaction levels. Crowdsourcing is likely to continue growing and the COVID-19 pandemic may have accelerated even further this trend. Many employers have understood that telework is a possibility, and the next likely step would be to outsource some of tasks that can be performed online. Understanding how this growth can benefit its users and what risks need to be prevented should be an important policy issue that this paper aims at addressing.24
In order to do so, we estimate a Mincer equation for crowdworkers’ earnings. On this basis, we find evidence that supports the existence of a global crowdsourcing market with a unique price for labour at around US$ 1.95 an hour. The comparison between the global rate of crowdwork and the hourly wage of employees in lower and lower-middle income countries (US$ 0.80) explains why some authors find great potential in the development of these platforms for the well-being of workers in developing countries. 25
Regarding job satisfaction in crowdsourcing platforms we put the focus on the reasons that led workers to enrol in crowdsourcing platforms rather than, as Brawley and Pury (2016) did, on the characteristics of the platforms themselves. The aim is to produce a more accurate characterization of crowdsourcing platforms’ winners and losers. Results from this analysis highlight the role of choice as a determinant of job satisfaction. For example, crowdworkers are much more likely to be very satisfied when the platform pays more than the worker’s outside options or when the worker chose to do crowdwork while having other job opportunities.
At last, the results not only confirm the existence of learning in crowdsourcing platforms, as was highlighted in Margaryan (2016), but also detect marked differences in the returns to tenure of young people and their older counterparts, with the former being able to learn faster and more efficiently than the latter. In contrast, this paper finds that formal education plays no role in shaping the earnings of crowdworkers; in fact, we find that a higher educational attainment produces, if at all, lower levels of job satisfaction due to overqualification. It seems that current educational systems do not prepare people for the gig-economy, and the question for policymakers is: whether they should be preparing workers for this new economic model or not? 26
Appendices
Appendix A – Descriptive statistics
Table A.1: Descriptive statistics by age group.
|
|
|
|||||
|
|
|
|
|
|
|
|
|
|
4.49 |
3.65 |
Main job |
0.51 |
0.28 |
|
|
|
31.79 |
31.96 |
English |
0.71 |
0.71 |
|
|
|
25.64 |
39.55 |
AMT |
0.77 |
0.72 |
|
|
|
0.29 |
0.22 |
Under-qualified |
0.20 |
0.25 |
|
|
6-12 months |
0.20 |
0.21 |
Over-qualified |
0.33 |
0.37 |
|
|
+1 year |
0.51 |
0.57 |
Reasons for doing crowdwork No employment available |
0.20 |
0.12 |
|
|
High school or less |
0.13 |
0.12 |
Only able to work at home |
0.20 |
0.14 |
|
|
Post-secondary |
0.37 |
0.30 |
Prefers working from home |
0.50 |
0.40 |
|
|
Bachelor or above |
0.50 |
0.58 |
Pay is better |
0.17 |
0.08 |
|
|
Neutral/Dissatisfied |
0.22 |
0.26 |
Complement a second job |
0.41 |
0.54 |
|
|
Satisfied |
0.52 |
0.57 |
Cash while at school |
0.19 |
0.02 |
|
|
Very satisfied |
0.26 |
0.17 |
Leisure |
0.27 |
0.29 |
|
|
Nº of observations |
357 |
642 |
It is fun |
0.45 |
0.44 |
|
|
Other |
0.05 |
0.11 |
||||
|
Nº of observations |
357 |
642 |
Note: Young refers to those aged 20-29 while adults are those aged 30-65.
Table A.2. Descriptive statistics by country XR/PPP ratio.
|
Mean |
Mean |
|||||||
|---|---|---|---|---|---|---|---|---|
|
Variable |
<1.2 |
1.2-2.4 |
2.4 |
Variable |
<1.2 |
1.2-2.4 |
>2.4 |
|
|
Hourly wage |
4.92 |
1.68 |
2.30 |
Main job |
0.36 |
0.30 |
0.42 |
|
|
Weekly hours |
31.01 |
31.34 |
35.65 |
English |
0.96 |
0.02 |
0.35 |
|
|
Age |
35.41 |
33.75 |
32.22 |
AMT |
0.94 |
0.00 |
0.59 |
|
|
Tenure |
Under-qualified |
0.19 |
0.34 |
0.31 |
||||
|
<6 months |
0.26 |
0.26 |
0.19 |
Over-qualified |
0.40 |
0.24 |
0.29 |
|
|
6-12 months |
0.21 |
0.25 |
0.13 |
Reason for crowdworking |
||||
|
>12 months |
0.53 |
0.49 |
0.69 |
No employment available |
0.16 |
0.18 |
0.07 |
|
|
Education |
Only able to work at home |
0.15 |
0.10 |
0.28 |
||||
|
High school or less |
0.14 |
0.17 |
0.04 |
Prefers working at home |
0.42 |
0.38 |
0.52 |
|
|
Post-secondary |
0.41 |
0.22 |
0.11 |
Pay is better |
0.06 |
0.14 |
0.29 |
|
|
Tertiary |
0.45 |
0.61 |
0.85 |
Complement a second job |
0.56 |
0.40 |
0.32 |
|
|
Job satisfaction |
Cash while at school |
0.09 |
0.10 |
0.06 |
||||
|
Neutral/dissatisfied |
0.30 |
0.14 |
0.14 |
Leisure |
0.30 |
0.26 |
0.24 |
|
|
Satisfied |
0.56 |
0.61 |
0.46 |
It is fun |
0.41 |
0.45 |
0.55 |
|
|
Very satisfied |
0.14 |
0.25 |
0.40 |
Other |
0.11 |
0.02 |
0.08 |
|
|
Nº of observations |
666 |
152 |
181 |
Nº of observations |
666 |
152 |
181 |
Appendix B – Ratio exchange rate/PPP conversion factor
Table B.1: Descriptive statistics, ratio exchange rate/PPP conversion factor.
|
Country |
Ratio XR/PPP |
Country |
Ratio XR/PPP |
|
|---|---|---|---|---|
|
|
3.08 |
|
2.46 |
|
|
|
1.39 |
|
1.75 |
|
|
|
2.76 |
|
1.02 |
|
|
|
1.03 |
|
3.46 |
|
|
|
2.33 |
|
1.94 |
|
|
|
1.41 |
|
2.49 |
|
|
|
2.36 |
|
2.01 |
|
|
|
0.93 |
|
1.43 |
|
|
|
1.78 |
|
1.92 |
|
|
|
1.98 |
|
2.26 |
|
|
|
1.79 |
|
2.52 |
|
|
|
2.16 |
|
2.03 |
|
|
|
1.85 |
|
1.69 |
|
|
|
2.95 |
|
1.43 |
|
|
|
1.56 |
|
1.23 |
|
|
|
0.92 |
|
2.95 |
|
|
|
1.07 |
|
0.87 |
|
|
|
1.33 |
|
2.81 |
|
|
|
2.00 |
|
1.87 |
|
|
|
3.70 |
|
2.70 |
|
|
|
3.08 |
|
0.92 |
|
|
|
1.02 |
|
1.00 |
|
|
|
1.13 |
|
2.82 |
|
|
|
2.64 |
Note: The acronym ‘XR’ refers to the exchange rate between the local currency of the crowdworker’s country of residence and US$ 1 as of
Appendix C - Average and lowest/minimum wages.
Table C.1: Descriptive statistics, monthly average and lowest/minimum wages, US$ 2015.
|
Country |
Ave. wage |
Min. wage |
Country |
Ave. wage |
Min. wage |
|
|---|---|---|---|---|---|---|
|
|
332 |
204 |
|
660 |
257 |
|
|
|
1,001 |
659 |
|
446 |
117 |
|
|
|
113 |
19 |
|
2.881 |
1,817 |
|
|
|
3,738 |
1,813 |
|
149 |
129 |
|
|
|
797 |
251 |
|
481 |
285 |
|
|
|
818 |
220 |
|
226 |
133 |
|
|
|
553 |
222 |
|
1,101 |
505 |
|
|
|
3,550 |
1,554 |
|
1,285 |
713 |
|
|
|
527 |
137 |
|
2,953 |
206 |
|
|
|
448 |
270 |
|
635 |
263 |
|
|
|
1,272 |
479 |
|
560 |
99 |
|
|
|
346 |
177 |
|
609 |
282 |
|
|
|
606 |
413 |
|
989 |
460 |
|
|
|
493 |
168 |
|
2,073 |
957 |
|
|
|
1,288 |
471 |
|
2,301 |
915 |
|
|
|
4,039 |
1,413 |
|
163 |
50 |
|
|
|
3,292 |
1,742 |
|
4,099 |
1,876 |
|
|
|
1,562 |
827 |
|
292 |
183 |
|
|
|
947 |
401 |
|
712 |
514 |
|
|
|
172 |
66 |
|
265 |
87 |
|
|
|
166 |
100 |
|
3,430 |
1,723 |
|
|
|
2,402 |
1,193 |
|
3,744 |
1,256 |
|
|
|
2,629 |
1,467 |
Viet Nam |
218 |
145 |
|
|
|
636 |
259 |
Source: Average wages from ILO (2017) and calculated from the ILO Labour Force Micro Database. Lowest/minimum wages from Wikipedia and other media.
Appendix D - World map, ratio of crowdwork earnings to minimum wage.
This world map shows the ratio between the global FTE crowdworking earnings, , calculated as is explained in Section 3, and the 2015 monthly lowest/minimum wage in USD27 , for each of the countries. Sometimes, no statutory minimum wage exists in a given country; in those cases we relied upon the lowest sectoral collectively bargained minimum wages. In some other instances the statutory minimum wage varies by region (and within region, by area, like in China); in those cases, we used the lowest among the full list of statutory minimum wages.
It is also important to note, when interpreting the map, that the crowdworkers in the dataset are not the kind of workers who earn a minimum wage; most of them are highly educated and, especially in lower-income countries, they probably belong to relatively well-off families. Therefore, this map is better interpreted as the comparison between crowdwork earnings and crowdworkers’ outside option if access to these platforms were universal, in sum, a hypothetical scenario.
Figure 5: FTE average monthly earnings in crowdwork to lowest/minimum wage in the country
Source: List of minimum wages by country from the Wikipedia and other online sources are used for retrieving minimum/lowest wages. see Appendix C for the full list of lowest/minimum wages. The website xe.com is used to retrieve the exchange rates.
Appendix E - Generalized ordered logit estimates
Table E.1: Odd-ratios from a generalized ordered logit on crowdworkers’ job satisfaction. Baseline: very satisfied.
|
Women |
Men |
|
|---|---|---|
|
|
Neutral Satisfied |
Neutral Satisfied |
|
|
1 |
1 |
|
|
1 |
0 |
|
|
|
|
|
|
0 |
0 |
|
|
0 |
0 |
|
No employment available |
0 |
0 |
|
Only able to work at home |
0 |
0 |
|
Prefers working from home |
|
1 |
|
Pay is better |
6 |
2 |
|
Complement a second job |
1 |
1 |
|
Cash while at school |
|
0 |
|
Leisure |
1 |
1 |
|
It is fun |
4 |
2 |
|
Other |
0 |
0 |
|
Pseudo-R2 |
0.1565 |
0.1225 |
|
Nº of observations |
414 |
585 |
References
Adams, A. and J. Berg. 2017. “When Home Affects Pay: An Analysis of the Gender Pay Gap Among Crowdworkers.”
Barnes, S.-A., A. Green, and M. de Hoyos. 2015. “Crowdsourcing and Work: Individual Factors and Circumstances Influencing Employability.”
Baudry, B. and V. Chassagnon. 2016. "L’arbitrage entre le salariat et le travail indépendant au prisme des théories de la firme. une analyse économique des pratiques de crowdworking.’’ '
Bauwens, M. February
Brawley, A. M. and C. L. S. Pury. 2016. “Work Experiences on MTurk: Job Satisfaction, Turnover, and Information Sharing.”
Benedict, J. N., S. G. Devi, and A. Velayudhan. 2009. “Perceived Overqualification, Job Satisfaction, Somatization, and Job Stress of MNC Executives.”
Berg, J. 2016. “Income Security in the On-demand Economy: Findings and Policy Lessons from a Survey of Crowdworkers.” ILO Working Paper, Conditions of Work and Employment Series, n
Brawley, A. M. and C. L. Pury. 2016. “Work Experiences on MTurk: Job Satisfaction, Turnover and Information Sharing.”
Chamorro-Premuzic, T. 2013. “Does Money Really Affect Motivation?: A Review of the Research,”
de Stefano, V. 2016. “The Rise of the ‘Just-in-Time Workforce’: On-demand Work, Crowdwork and Labour Protection in the ‘Gig-economy.’”
Difallah, D. E., G. Demartini, and P. Cudré-Mauroux. 2012. “Mechanical Cheat: Spamming Schemes and Adversarial Techniques on Crowdsourcing Platforms.” In
enigmatic7569. “Can a Requester Impose Country-Specific Restrictions for Workers?” Reddit, February 17, 2015.
Eyal, N. 2014. “The Pros and Cons of a Gamified Work Culture.”
Felstiner, A. 2011. “Working the crowd: Employment and labour law in the crowdsourcing industry.”
Gadiraju, U., R. Kawase, S. Dietze, and G. Demartini, 2015. “Understanding Malicious Behaviour in Crowdsourcing Platforms: The Case of Online Surveys
Gupta, A., W. Thies, E. Cutrell, and R. Balakrishnan. 2012. “mClerk: Enabling Mobile Crowdsourcing in Developing Regions.” In
Hirth, M., T. Hoßfeld, and P. Tran-Gia. 2013. “Analyzing costs and accuracy of validation mechanisms for crowdsourcing platforms.”
Horton, J. and L. Chilton. 2010. “The Labor Economics of Paid Crowdsourcing” In Proceedings of the 11th ACM conference on Electronic commerce (EC '10), June 7 - 11, 2010, Cambridge Massachusetts, 209–218. New York, NY: Association for Computing Machinery
Hsing-Ming, L., C. Mei-Ju, and W. Ho-Tang. 2016. “The Measurement of Perceived Overqualification and the Relationships Among Perceived Overqualification, Psychological Empowerment and Job Satisfaction of Private Kindergarten Teachers”.
Huberman, B. A., D. M. Romero, and F. Wu.2009. “Crowdsourcing, Attention and Productivity.”
ILO (International Labour Organization). 2016.
ILO. 2017.
ILO. 2020
Johnson, G. J. and W. R. Johnson. 2000. “Perceived Overqualification and Dimensions of Job Satisfaction: A Longitudinal Analysis.”
Judge, T. A., J. E. Bono, and E.A. Lock. 2000 “Personality and Job Satisfaction: The Mediating Role of Job Characteristics”
Kässi, O. and V. Lehdonvirta. 2016. “Online Labour Index: Measuring the Online Gig Economy for Policy and Research”, Munich Personal RePEc Archive Paper n
Kittur, A., J. V. Nickerson, M. S. Bernstein, E. M. Gerber, A. Shaw, J. Zimmerman, M. Lease, and J.J. Horton. 2013. “The future of crowd work.” In
Kupka, A. 2012. “Why You Need To Love Your Job,”
Law, E., M. Yin, J. Goh, K. Chen, M.A. Terry, and K. Z. Gajos. 2016. “Curiosity Killed the Cat, but Makes Crowdwork Better.”
Manker, A, R. J. Shah., M. Lease. 2017 “Design Activism for Minimum Wage Crowd Work” Proceedings of the 2017 CHI Conference on Human Factors in Computing Systems (CHI '17), Denver, Colorado. May 6 – 11, 2017. New York, NY: Association for Computing Machinery
Margaryan, A. 2016. “Understanding Crowdworkers’ Learning Practices.”
Millán, A., J. M. Millá, and C. Román. 2017. “Are False Own-Account Workers Less Job Satisfied Than True Ones?”
Miriri, D. 2017. “Kenya Targets 1 Million Digital Jobs for Youths in a Year.” Reuters January 20, 2017.
Morgan, J. 2014. “The Top 10 Factors For On-The-Job Employee Happiness,”
Pinedo Caro, L., N. O’Higgins, and J. Berg. 2021. “Young People and the Gig-economy.”
Pooler, M. 2014. “Crowdworkers Form Their Own Digital Networks.”
Smith, P. C., L. M. Kendall, and C.L Hulin. 1969.
Taeihagh, A. 2017. “Crowdsourcing, Sharing Economies and Development.”
Thies, W., Ratan, A., and Davis, J. 2011. “Paid Crowdsourcing as a Vehicle for Global Development.” in Proceedings of the ACM CHI Workshop on Crowdsourcing and Human Computing, May, 1-4.
von Ahn, L. 2006. “Games with a Purpose”
Williams, R. 2006. “Generalized Ordered Logit/Partial Proportional Odds Models for Ordinal Dependent Variables.
Williams, R. 2016. “Understanding and Interpreting Generalized Ordered Logit Models.”
Acknowledgements
The authors wish to express their appreciation and thanks to the many colleagues and friends whose comments and suggestions have contributed much to the development and improvement of this paper as it progressed. Although too numerous to mention each by name, the authors wish to specifically acknowledge the suggestions received from participants at the Regulating for Decent Work Conference at the ILO and at a Development Analytics seminar in Istanbul where the paper was presented. The authors also wish to mention the conversations with, and comments from, Janine Berg which were instrumental in the paper’s development. Janine also supported our access and understanding of the ILO survey of crowd-workers analysed in the paper. Comments from Uma Rami whose extensive and significant work on digital labour platforms also informed the development of this paper are also gratefully acknowledged. Excellent support in the final preparation of the working paper provided by Adam Elsheikhi is also gratefully acknowledged.

