Lifelong Learning and Skills for the Future
© International Labour Organization 2026.
First published 2026.

Attribution 4.0 International (CC BY 4.0)
This work is licensed under the Creative Commons Attribution 4.0 International. See: creativecommons.org/licences/by/4.0. The user is allowed to reuse, share (copy and redistribute), adapt (remix, transform and build upon the original work) as detailed in the licence. The user must clearly credit the ILO as the source of the material and indicate if changes were made to the original content. Use of the emblem, name and logo of the ILO is not permitted in connection with translations, adaptations or other derivative works.
Attribution – The user must indicate if changes were made and must cite the work as follows: ILO, Lifelong learning and skills for the future, World of Work Series, Geneva: International Labour Office, 2026. © ILO.
Translations – In case of a translation of this work, the following disclaimer must be added along with the attribution: This is a translation of a copyrighted work of the International Labour Organization (ILO). This translation has not been prepared, reviewed or endorsed by the ILO and should not be considered an official ILO translation. The ILO disclaims all responsibility for its content and accuracy. Responsibility rests solely with the author(s) of the translation.
Adaptations – In case of an adaptation of this work, the following disclaimer must be added along with the attribution: This is an adaptation of a copyrighted work of the International Labour Organization (ILO). This adaptation has not been prepared, reviewed or endorsed by the ILO and should not be considered an official ILO adaptation. The ILO disclaims all responsibility for its content and accuracy. Responsibility rests solely with the author(s) of the adaptation.
Third-party materials – This Creative Commons licence does not apply to non-ILO copyright materials included in this publication. If the material is attributed to a third party, the user of such material is solely responsible for clearing the rights with the rights holder and for any claims of infringement.
Any dispute arising under this licence that cannot be settled amicably shall be referred to arbitration in accordance with the Arbitration Rules of the United Nations Commission on International Trade Law (UNCITRAL). The parties shall be bound by any arbitration award rendered as a result of such arbitration as the final adjudication of such a dispute.
For details on rights and licensing, contact: [email protected]. For details on ILO publications and digital products, visit: www.ilo.org/publns.
ISBN: 9789220433195 (print); 9789220433201 (accessible PDF); 9789220435458 (epub); 9789220435465 (html)
ISSN: 3106-941X (print); 3106-9428 (online)
DOI: https://doi.org/10.54394/00033011
Also available in:
French, ISBN 9789220433232 (print); 9789220433249 (accessible PDF); 9789220435472 (epub); 9789220435489 (html); DOI https://doi.org/10.54394/00033015
Spanish, ISBN 9789220433218 (print); 9789220433225 (accessible PDF); 9789220435496 (epub); 9789220435502 (html); DOI https://doi.org/10.54394/00033013
lifelong learning / skills development / skills requirements
06.08.1
ILO Cataloguing in Publication Data
The designations employed in ILO publications and databases, which are in conformity with United Nations practice, and the presentation of material therein do not imply the expression of any opinion whatsoever on the part of the ILO concerning the legal status of any country, area or territory or of its authorities, or concerning the delimitation of its frontiers or boundaries. See: www.ilo.org/disclaimer.
The opinions and views expressed in this publication are those of the author(s) and do not necessarily reflect the opinions, views or policies of the ILO.
Reference to names of firms and commercial products and processes does not imply their endorsement by the ILO, and any failure to mention a particular firm, commercial product or process is not a sign of disapproval.
Photo credits – Front cover: Two young workers are learning together in a server room, preparing for the future of work, 03/2026 © Enrique León / ILO
Printed in Switzerland
Produced by the Publications Production and Publishing Management Unit (PRODOC) of the ILO.
The ILO endeavours to use paper sourced from forests managed
in an environmentally sustainable and socially responsible manner.
Code: DESIGN-PPM-PMSERV
Foreword
Angelique Kahindo,1 a Congolese refugee in Uganda, joined an apprenticeship programme, training as a tailor with a local artisan. Over six months, she learned new skills – from designing, sewing and repairing garments to bookkeeping, budgeting and customer service. She has since opened her own business and now earns a steady income to support herself and her children. Her journey illustrates how access to learning can transform lives, mirroring the experiences of countless others for whom skills development is not an abstract policy goal, but a path to dignity, resilience and hope.
Businesses, too, transform through learning. As part of ILO programmes, for example, enterprise owners and workers across the world take part in training and receive hands-on coaching to improve how their workplaces run. Many participating enterprises report higher productivity, stronger teamwork and better working conditions.
Experiences such as these show that learning and skills development at different stages of life are powerful tools to empower workers and help businesses innovate. This potential has broad relevance in the face of today’s labour market transformations – be they driven by new technologies (including artificial intelligence), the green transition, demographic shifts or geopolitical developments. Lifelong learning and skills development must therefore represent a central element of any successful growth and development strategy. Yet, opportunities to learn remain unequally distributed, often mirroring broader social and economic divides.
At the ILO, we have been motivated by the observation that there is still no recent, authoritative and comprehensive report on these topics. Aiming to fill this void, this report develops a broad and integrated understanding of learning throughout life. Lifelong learning is relevant not only to improve the outcomes of workers and enterprises, but also to advance broader societal goals. Because the report identifies gaps and inequalities in access to lifelong learning – especially in the world of work – it subsequently analyses the types of skills that are most needed in today’s labour markets, demonstrating the importance of developing rounded sets of skills. In addition to enabling workers to acquire skills that help them adapt to a changing world of work, the adequate valuation of those skills by markets and societies is equally important.
Looking ahead, the message is clear: fostering lifelong learning is a shared responsibility that requires addressing both individual barriers and systemic challenges. Building coherent and integrated systems is essential for lifelong learning and skills development to become truly inclusive and adaptive. Financing remains a central challenge but should be recognized as an investment with high future returns. These efforts demand sustained collaboration between governments and employers’ and workers’ organizations.
If implemented effectively and pursued collectively, lifelong learning can underpin inclusive growth and decent work, while shaping a more adaptable, innovative and sustainable future of work.

Gilbert F. Houngbo
ILO Director-General
1 ILO, “As a refugee, my new skills have given my family hope”, https://voices.ilo.org/stories/as-a-refugee-my-new-skills-have-given-my-family-hope.
Acknowledgements
This report was prepared by a team led by Verónica Escudero, Senior Economist of the ILO Research Department, under the supervision of Caroline Fredrickson, Director of the ILO Research Department, and Richard Samans, former Director. We would like to thank both directors for their unwavering support and strategic guidance during the course of the project. Their leadership has been instrumental in bringing this report to fruition.
The authors of the different chapters in alphabetical order are:
Chapter 1: Isaure Delaporte, Verónica Escudero, Dorothea Hoehtker, Hannah Liepmann (Research Department) and Pedro Moreno da Fonseca (Skills and Employability Branch of the ILO Employment Department).
Chapter 2: Sévane Ananian and Pelin Sekerler Richiardi (Research Department), with written contributions by Kristen Sobeck (Crawford School of Public Policy, Australian National University).
Chapter 3: Willian Adamczyk, Verónica Escudero and Hannah Liepmann, with written contributions by Simon Böhmer (Research Department).
Chapter 4: Willian Adamczyk, Isaure Delaporte, Verónica Escudero and Hannah Liepmann.
Chapter 5: Isaure Delaporte, Verónica Escudero, Hannah Liepmann and Pedro Moreno da Fonseca, with written contributions by Simon Böhmer.
This flagship report has greatly benefited from the close and productive collaboration between the ILO Research Department and the Skills and Employability Branch of the ILO Employment Policy Department. We extend our sincere thanks to Sangheon Lee, Director of the Employment Policy Department, and to Srinivas B. Reddy, Chief of the Skills and Employability Branch, for their support and commitment to fostering synergies between technical research and policy implementation. We also wish to thank the entire Skills and Employability Branch team for their continuous engagement, insightful comments and valuable guidance throughout the preparation of the report, in particular Pedro Moreno da Fonseca for his key role in steering this collaboration. The collaboration ensured a seamless interface between evidence-based research and policy-oriented analysis on skills and lifelong learning.
The report draws extensively on innovative and diverse data sources, including newly collected ILO lifelong learning surveys and collaborative big data initiatives. Pelin Sekerler Richiardi oversaw the individual-level ILO lifelong learning survey piloted in Bangladesh, Fiji and the United Republic of Tanzania, while Pedro Moreno da Fonseca coordinated the ILO institutional lifelong learning survey conducted across 21 countries. We extend our sincere appreciation to the ILO regional and country offices (especially the ILO Regional Office for Africa, the ILO Regional Office for Asia and the Pacific, the Country Offices in Dar es Salaam, Dhaka and Fiji) for their active engagement and financial support, and to the national partners who collaborated in the survey implementation, including the National Bureau of Statistics of the United Republic of Tanzania. We are also thankful to CINTERFOR and skills specialists in Decent Work Teams for their support in the implementation of the institutional surveys.
We would particularly like to recognize the support of ILO colleagues from the field, Andrew Allieu, Milagros Castro, Xian Guan, Ahmed Hassan, Edmund Moshy, Albert Okal, Peter Rademaker, Mohammad Mohebur Rahman, Akiko Sakamoto, Laura Schmid, Ken Chamuva Shawa and Christian Viegelahn for facilitating relations with local partners and discussions on survey tools. ILO statisticians from headquarters and the field provided insightful comments on the survey designs and methodologies. Visiting researcher Haitao Zheng (Chinese Academy of Labour and Social Security) provided helpful support implementing the ILO institutional lifelong learning survey.
The big data analysis was enriched through collaboration with the United Nations Economic and Social Commission for Western Asia (ESCWA), especially Salim Araji and Sama El Hage Sleiman, in addition to Roy Doumit, Maksym Hermez, Tia Mokdad and Le Wu. We also wish to acknowledge the collaboration with the ILO Country Office in Algiers, especially Gilles Cols and Mustapha Ziroili, as well as the National Agency for the Promotion of Employment and Skills (ANAPEC) in Morocco for their contributions to data analysis and methodological discussions.
We gratefully acknowledge the contributions of external collaborators Giordano de Marzo, Trang Luu and Kaja Rupieper, whose insights helped sharpen the analysis and ensure its policy relevance. We also thank our highly committed interns for their expert research assistance at different stages of the report production: Claudia Abdallah, Cloe Barbera, Mariano Calderón, Melchor de la Cruz Rothenfusser, Ludovica Gerbino, Evgeny Gushchin, Elvire Jégu, Samantha Metevier, María Angélica Moreno Barrera, Karina Narbikova, Franziska Riepl and Mareike Sehrer.
We thank colleagues across the ILO for their substantive comments, peer review, statistical and methodological inputs during various stages of the project, in particular: Thais Adileu Oliveira, Ashwani Aggarwal, Uma Rani Amara, Samuel Asfaha, Lara Badre, Giovanna Beaulieu, Janine Berg, David Bescond, Adelle Blackett, Gabriel Bordado, Paloma Carillo, Hae Kyeung Chun, Marva Corley-Coulibaly, Patrick Daru, Yacouba Diallo, Antonio Rinaldo Discenza, Sabrina de Gobbi, Ekkehard Ernst, Valeria Esquivel, Tite Habiyakare, Marek Harsdorff, Christine Hofmann, Aya Jaafar, Tahmina Karimova, Vipasana Karkee, Takaaki Kizu, Stefan Kühn, Claire La Hovary, Donika Limani, Nicolas Maitre, Quentin Mathys, Maria Payet, Yves Perardel, Céline Peyron Bista, Emanuela Pozzan, Iuliia Privalikhina, Nikolai Rogovsky, Catherine Saget, Miguel Sánchez Martínez, Ken Chamuva Shawa, Sergei Soares, Valentina Stoevska, Olga Strietska-Ilina, Bolormaa Tumurchudur-Klok, Samantha Watson and Morgan Williams. Special thanks are due to Sher Verick, from the Office of the Deputy Director-General, for his thoughtful feedback and engagement during the final stages of the report’s preparation. We also thank all others who provided comments, including those who did so anonymously.
The report benefited from the guidance of the members of the ILO Research Review Group, namely Bart van Ark (University of Manchester), Jennifer Bair (University of Virginia), Iain Begg (London School of Economics and Political Science), Haroon Bhorat (University of Cape Town), Fang Lee Cooke (Monash University), Michael Fung (Tecnológico de Monterrey), James Galbraith (LBJ School of Public Affairs), Núria Rodríguez-Planas (City University of New York), Kamala Sankaran (National Law School of India University) and Robert Skidelsky (University of Warwick), whose expertise and constructive feedback strengthened the analytical coherence of the report.
We acknowledge the comments and contributions of additional academic experts: Miguel Ángel Malo (University of Salamanca), Ronald Bachmann (RWI – Leibniz Institute for Economic Research), Maria Julia Granata and Josefina Posadas (World Bank Group), Ariane Hegewisch (Institute for Women’s Policy Research), Michele Pellizzari (Université de Genève), Fabien Petit (University of Barcelona and University College London), Johnny Sung (Institute for Adult Learning) and three anonymous referees whose feedback on the underlying methodologies and analytical approaches informed parts of this report.
The team wishes to thank the ILO Publications Production and Publishing Management Unit for providing production project management, graphic design including the cover, copy-editing, typesetting and proofreading. We also thank the Department of Communication and Public Information (DCOMM) for coordinating the launch of the report and related dissemination activities. We are equally grateful to the Information and Communications Technology Department (INFOTEC) for their continuous technical support in maintaining and upgrading the data server infrastructure.
A final and special acknowledgement is for Alessandro Ippolito Neira for developing the accompanying web platform and for his continuous engagement and communication support throughout the project and for Judy Rafferty, who shepherded the report during the many production stages. We are also grateful to Janine Berg for her decisive support in both the initial and final stages of the report production. Finally, we thank administrative colleagues whose behind-the-scenes contributions kept the production moving smoothly, including Sarah Alvarez, Béatrice Guillemain and Thuy Nguyen Couture.
To all who have assisted – whether named or unnamed – we extend our heartfelt thanks. Their collective contribution has made this global-scale assessment of lifelong learning and skills dynamics possible.
Abbreviations
|
AI |
artificial intelligence |
|
ALMPs |
active labour market policies |
|
CEACR |
Committee of Experts on the Application of Conventions and Recommendations |
|
ESCWA |
Economic and Social Commission for Western Asia |
|
EU |
European Union |
|
GDP |
gross domestic product |
|
HRDF |
Human Resource Development Fund |
|
ICT |
information and communication technology |
|
ISCO |
International Standard Classification of Occupations |
|
LFS |
labour force surveys |
|
NEET |
not in education, employment or training |
|
NLP |
natural language processing |
|
OECD |
Organisation for Economic Co-operation and Development |
|
PIAAC |
Programme for the International Assessment of Adult Competencies |
|
RPL |
recognition of prior learning |
|
SDG |
Sustainable Development Goal |
|
TVET |
technical vocational education and training |
|
UN |
United Nations |
|
UNESCO |
United Nations Educational, Scientific and Cultural Organization |
|
VHS |
Volkshochschulen |
Executive summary
Lifelong learning and skills for the future
Lifelong learning is not a new concept – but it has never been more important. In the face of rapid technological innovation, the green transition, demographic shifts and evolving patterns of globalization and work, the ability of individuals and societies to keep learning and adapting to new realities is a critical foundation for inclusion and resilience. This report argues that lifelong learning should be elevated as a strategic policy priority – not just as a tool to increase productivity and facilitate sustainable growth, but also as a systemic enabler of personal and societal advancement, equity and decent work in the twenty-first century.
However, despite the growing policy focus on lifelong learning and skills development, there remains a striking gap in comprehensive, authoritative, up-to-date research that captures the full scope of lifelong learning. Much of the existing evidence remains scattered and overemphasizes initial formal education, overlooking the diverse and dynamic ways people acquire and apply skills throughout life.
This underscores the need to rethink lifelong learning beyond formal education and training. Learning takes place in many settings – in the classroom, at work, in communities and families – often through non-formal, informal or other non-traditional means. Yet, in this context, participation in lifelong learning beyond the classroom lags behind and remains uneven, and the systems that support it are often fragmented, under-resourced and poorly coordinated.
Drawing from new survey and institutional data, big data analysis and impact evaluations, this report offers a comprehensive road map for countries to transform lifelong learning systems and use them to build inclusive and resilient labour markets. The report is organized in three parts. Part 1 lays the conceptual foundations, defining lifelong learning and mapping its development across education, work and society. Part 2 focuses on the world of work, examining which skills matter most for better employment outcomes and adaptability, using big data and novel methods. Part 3 brings these insights together, outlining the policy conditions for performing lifelong learning systems and effective skills programmes. Taken together, the findings offer a powerful call to action: inclusive, high-quality and responsive lifelong learning must be at the centre of labour market policy – and growth and development strategies more broadly – in an era of fundamental change.
Part 1. A broad view of lifelong learning
Rethinking lifelong learning: A broader, integrated vision
The idea of lifelong learning has evolved from a philosophical ideal into a core principle for navigating today’s complex labour markets and societal transformations. While the roots of lifelong learning can be traced back to ancient thinkers and traditions across different societies, its modern form is relatively recent. The concept gained prominence in the second half of the twentieth century, and the term lifelong learning gradually replaced lifelong education in the late 1990s –shifting from a focus on formal education to a more holistic vision encompassing learning across all domains of life.
Over time, this vision has broadened to reflect not only economic aims but also social, civic and environmental objectives. Still, in practice, lifelong learning policies and discourse often continue to emphasize employability and individual responsibility, with less attention to collective and societal dimensions. This tension between a broad conceptual vision and a narrower implementation remains at the heart of current debates on how to build inclusive and balanced lifelong learning systems.
The ILO has long contributed to this debate, promoting universal access to lifelong learning as an integral part of the right to education and training, and as a cornerstone of decent work and social justice. But more needs to be done collectively to move from principle to practice and strengthen the normative framework to make the right to lifelong learning a reality for all.
This broad and inclusive interpretation is essential in a world where continuous upskilling and reskilling are critical for individuals and enterprises. Though, it should also serve the broader needs of societies and economies that extend well beyond the interests of individual actors. To capture this full scope, this report proposes a comprehensive definition aligned with international labour standards, that goes beyond access to education to include all formal, non-formal and informal learning activities undertaken throughout life.
It encompasses all learning activities undertaken throughout life, individually or collectively, whether in educational, work, family or other social contexts. It emphasizes the development of knowledge, skills and attitudes or behaviours conducive to learning that respond to both individual and collective aspirations and needs, irrespective of formal certification outcomes.
To operationalize this definition, the report introduces a three-pillar framework:
-
education and schooling: the foundation of learning systems and skills acquisition;
-
learning in the world of work: the continuous development of competencies through and at work;
-
broader societal learning: learning that occurs in communities, families and civil society.
This framework serves as a practical lens to identify gaps, track progress and align policy efforts. It underscores that lifelong learning is not the responsibility of one actor or sector but requires an integrated approach across governments, employers, workers and education providers.
However, to make this vision a reality, systems must be in place to support it: inclusive governance structures, equitable financing, quality assurance mechanisms, data systems and robust social dialogue. Without these enablers, lifelong learning risks becoming a rhetorical claim rather than a transformative force.
Mapping the state of lifelong learning worldwide
The state of lifelong learning reveals progress but general gaps in access persist, especially in the world of work. Opportunities to learn throughout life remain uneven, shaped by country income levels, institutional capacity and the population group concerned. High-income countries tend to invest more and achieve better educational and labour market outcomes, while many low- and middle-income countries face persistent challenges in expanding learning opportunities, for adults, women and workers in informal or low-skilled employment. Nonetheless, encouraging developments are also emerging in several low- and middle-income contexts, where innovative technical vocational education and training (TVET) initiatives, traditional apprenticeship programmes and digital solutions are expanding access and helping workers build relevant skills despite resource constraints.
These disparities are compounded by limited data and evidence on who learns, how and with what results. Without a clearer picture of these learning patterns, policies risk missing their mark. To address this gap, the report underscores the need for detailed, disaggregated data – particularly in low- and middle-income countries – to capture the full extent of learning taking place through education, the world of work and in the broader society, including informal and non-formal pathways, learner motivations and barriers to participation.
In this context, the ILO lifelong learning survey represents a critical step towards closing these knowledge gaps in the world of work. Piloted in Bangladesh, Fiji and the United Republic of Tanzania, and available to the public as a new tool for data collection, the survey collects first-hand data on individuals’ lifelong learning experiences across different settings and employment types, providing an unprecedented view of how learning actually happens.
The results reveal that while learning activities can promote individuals’ professional development, the types of learning and resulting benefits differ markedly across groups. Formal workers benefit most from structured learning opportunities, while those with lower levels of education – who work informally and in occupations with lower entry requirements – face limited access to organized learning activities, including through non-formal pathways. These workers rely heavily on informal learning, often limited to learning by doing rather than learning from colleagues or supervisors.
Among organized learning activities, TVET and employer-provided training (such as apprenticeships and internships) remain central, with participants frequently reporting gains in qualifications, work performance and career advancement. However, gender gaps persist and participation remains low in many countries.
Overall, these findings underscore the urgency of building stronger data systems to guide evidence-based, equitable policies. They call for a renewed commitment to inclusive lifelong learning opportunities – especially for women, informal workers and other groups who remain at the margins of learning systems.
Part 2. Skills for transformation and resilience
Which skills matter for better jobs?
Identifying which skills matter for people in different contexts is central to designing skills development programmes and, ultimately, lifelong learning systems that can foster the development of those skills linked to more favourable worker and firm outcomes.
This requires understanding which skills are most in demand, and how demand is changing. The report’s original big data analysis, covering eight middle- and high-income countries across different regions – Brazil, Egypt, Jordan, Morocco, the Russian Federation, South Africa, the United Arab Emirates and Uruguay – sheds new light on which skills and skills bundles drive better employment outcomes and how they interact in practice. As part of this work, the report introduces a new taxonomy and methodology to classify and analyse skills in online data – an approach that can be applied in other countries to generate comparable insights into evolving skills demand.
Key findings include:
-
Socio-emotional and cognitive skills consistently rank among the most demanded skills across countries.
-
Manual skills, while less frequently requested, remain critical for many occupations and yield stronger employment outcomes when combined with cognitive or socio-emotional skills.
Contemporary labour markets require the development of rounded skills bundles. Importantly, employers seek combinations that span domains – for example, pairing basic digital skills with teamwork, or cognitive abilities with manual know-how. Socio-emotional skills often act as bridges, supporting workers’ mobility from occupations dominated by manual tasks towards more complex roles. When cognitive skills are added, the scope for possible upward occupational transitions expands even further.
Wage premiums rise with the complexity of skills, although returns vary across countries, occupations and skill mixes. Higher skill complexity is also associated with better job characteristics, such as access to meaningful work, stability and career progression.
Across countries, cognitive skills are consistently linked to higher wages, while socio-emotional skills are sometimes undervalued by both labour markets and societies. Yet, these socio-emotional skills play a crucial enabling role, supporting the development of higher-complexity competencies (such as project management) and advanced digital skills (including machine learning and artificial intelligence (AI)).
Together, these findings underscore the need for training and lifelong learning strategies that focus not only on isolated competencies, but on balanced skill portfolios adapted to local labour markets and diverse worker profiles. The analysis also highlights the importance of complementing different types of evidence: while online job vacancy data provide valuable, real-time insights into evolving skill demand, they tend to capture transferable skills more prominently than occupation- or industry-specific technical ones. Bridging such big data approaches with other sources of evidence – such as employer surveys and analytical frameworks that map occupations to underlying skills and competencies – can offer a comprehensive and grounded picture of skills needs.
Skills for adaptability amid global transformations
As the world of work undergoes profound change, skills determine who benefits from transformation and who risks being left behind. Together with complementary enabling conditions (which are also needed), skills help workers and firms to adapt, shaping how economies turn disruption into opportunity.
The demand for skills is evolving in the context of all major transformations. The report focuses on three transformative forces that are particularly strong in reshaping today’s labour markets: demographic change, the green transition and digitalization. Together, these three transformations provide a lens for examining a comprehensive spectrum of skills challenges that must be addressed to foster inclusion and build resilience: adequate recognition and valuation of skills, diverse and adaptable skills portfolios, and the capacity of skills to help workers and firms navigate disruptive change.
-
Demographic shifts, particularly population ageing, not only underscore the need for learning throughout life but also sharply increase the demand for care work in many parts of the world. Yet, care workers’ skills – especially socio-emotional ones – remain under-recognized, undervalued and poorly remunerated. This deters workers from entering or staying in the care sector and fuels persistent shortages. Recognizing and rewarding care skills – through adequate pay, better working conditions, certification and public investment – is essential to building a fairer and more resilient care economy. More broadly, the care economy exemplifies that skills development only yields better jobs and societal outcomes when labour markets and societies properly value the acquired and used skills of workers.
-
The green transformation is reshaping labour markets worldwide by creating more green jobs, which require diverse and complementary skill sets (core, technical and green-specific) across cognitive, socio-emotional and manual domains. The report finds that green vacancies often offer better working conditions and pay, but these benefits are unevenly distributed. Wage and quality premiums vary widely, showing that green skills alone do not guarantee good jobs. Skills strategies must therefore extend beyond green-specific training to address disparities and ensure just transitions for all workers.
-
Digitalization redesigns jobs, automating certain tasks while creating new ones. The impact of digital technologies depends largely on the skills available within the workforce. Cognitive and socio-emotional skills – such as digital literacy, problem-solving and people management – are essential to harness digital transformation for inclusive growth. However, focusing narrowly on advanced technical skills (such as AI) is insufficient. Successful adaptation requires complementary skills bundles aligned not only with local technological capacity and workforce readiness but also with access to technology and coherence with broader industrial and employment policies.
Across these transformations, the messages are clear:
-
Versatile and transferable skills foster adaptability, but the returns to these skills vary across contexts. Green roles often offer higher wages and better working conditions, and digital roles can improve employment prospects. Yet, the scale of these gains differs by occupation, education and country context.
-
Skills are a critical lever for resilience, inclusion and opportunity, but they must be developed, recognized, valued and used in ways that reflect evolving labour markets and societal needs. Lifelong learning must be at the centre of transition strategies to ensure that no one is left behind, by expanding comprehensive, inclusive and forward-looking skills offers fit for a fast-changing world of work.
Part 3. Making lifelong learning systems deliver
How can lifelong learning systems rise to the challenge?
After identifying which skills matter across different contexts, this final part of the report turns to the question of how lifelong learning systems and skills programmes can effectively foster them and ensure that all workers can access opportunities to develop and use these skills throughout life.
Drawing on the two new ILO lifelong learning surveys – individual-level and institutional ones – as well as a global meta-analysis of training programmes, the report identifies the core elements that make lifelong learning systems effective, inclusive and sustainable.
Enabling systems matter
Strong governance, coordination, financing and social dialogue are essential building blocks. Clear mandates, coordination across institutions and active involvement of social partners – including sectoral skills bodies – help ensure relevance, coherence and accountability in skills provision. Enabling systems also depend on digital learning infrastructure, effective financial incentives, quality assurance and accessible career development support that make lifelong learning a practical reality for all. Where ministries, institutions and social partners work together, systems tend to be more integrated and responsive. Yet, fragmentation and weak implementation capacity remain widespread obstacles.
Learning must be accessible
Barriers – such as cost, time constraints, limited information and rigid training formats – prevent individuals across different demographic groups from participating. Expanding access requires targeted financial support, measures to alleviate time constraints (such as paid educational leave and investment in the care economy), recognition of prior learning (RPL) and strengthened career guidance and outreach.
Programme integration determines effectiveness
Integrated, well-designed training programmes yield the most sustainable employment outcomes. Programmes that develop technical, cognitive and socio-emotional skills through in-classroom learning and work-based experience enhance employability and job quality – especially when they offer pathways to qualifications and include complementary measures, such as active labour market policies or social protection. Evidence shows that women, in particular, benefit consistently from such integrated approaches, underlining their potential to reduce gender gaps in labour markets.
Financing is foundational
Sustainable and equitable funding is vital, as is cost-sharing among key actors. Public investment should prioritize vulnerable groups and foundational skills, while co-financing from employers is vital to shape training offers that align with labour market needs. Innovative instruments – such as well-designed levies and subsidies, individual learning accounts with adequate course offerings, outcome-based financing and training provision for recipients of social protection benefits – are needed to provide incentives for employers, workers and training providers to engage in non-formal learning activities. Well-designed training programmes improve job access, raise wages and promote productivity and inclusive growth in a sustainable way. However, impact varies by context, underscoring the need to tailor interventions to local realities, collect more disaggregated and comprehensive data on financing mechanisms and evaluate more systematically which financial incentive mechanisms are effective and why.
Together, these findings emphasize that building performing lifelong learning systems requires coherence, accessibility, quality and sustainability. Achieving this vision demands: (i) long-term commitment; (ii) social dialogue among governments, employers and workers; (iii) and a shared understanding that lifelong learning is a public good – essential for resilience, inclusion and decent work in a rapidly changing world.
Key recommendations
Based on the evidence, the report identifies five strategic directions for action.
-
Adopt a holistic vision of lifelong learning: Policies must go beyond training provision to include complementary systems of support (such as social protection and employment services) in addition to policies that encourage job creation and employer engagement.
-
Build inclusive and flexible learning pathways: Remove entry barriers, recognize informal and non-formal learning (for example, through RPL), and ensure permeability between education, training and work.
-
Invest in equity and quality: Target underserved groups and regions, strengthen quality assurance and ensure that all training leads to meaningful employment outcomes.
-
Align learning with labour market transitions and shifting demand: Integrate skills development and measures for adequate wages and working conditions into transition policies for green and digital economies, care strategies and regional development plans.
-
Create shared responsibility and accountability: Governments, employers’ and workers’ organizations and training providers must co-design systems that are demand-driven, adequately resourced and continuously updated.
Priority actions moving forward
Lifelong learning should be treated not as a policy afterthought, but as a strategic lever for adaptability, inclusion and decent work. The findings of this report reaffirm that skills matter: not only for securing jobs, but for shaping fairer labour markets and empowering enterprises and workers to adapt and thrive.
Yet, building effective lifelong learning systems requires political will, social dialogue and sustained investment.
-
Governments need to lead with vision, regulation and financing.
-
Employers and their organizations should co-invest and shape demand-driven training offers.
-
Workers need to be empowered and equipped to engage effectively, with their organizations strengthened to represent diverse interests.
-
Training providers have to innovate, expand access and continuously update their offers.
-
Development partners should support capacity-building and resource mobilization, especially in lower-income contexts.
Countries must move beyond fragmented initiatives and commit to building lifelong learning systems that are inclusive by design, effective in practice and future-ready by orientation. Only then can we ensure that everyone, everywhere, has the opportunity to learn, work and live with dignity in a changing world.
Part 1. A broad view of lifelong learning
Part 1 takes a comprehensive view of lifelong learning, redefining it as a universal, continuous process, spanning formal, non-formal and informal learning across education, work and society. It traces the concept’s evolution and introduces a three-pillar framework connecting schooling, learning in the world of work and broader societal learning. Drawing on both existing evidence and new ILO data, it reveals wide disparities in access to lifelong learning – especially among adults, women and informal workers – and calls for stronger system governance and coordination and robust data to make lifelong learning inclusive and transformative rather than merely aspirational.
1.1. Introduction
Lifelong learning empowers individuals, strengthens enterprises and enables full participation in economic and social life. Workers acquire new skills, individually or collectively, out of personal interest or to adapt to changes in their work. Enterprises facilitate lifelong learning to invest in their workers’ skills and navigate workplace changes when introducing, for example, a new technology or work process. Skills development through lifelong learning thus contributes to enhancing productivity, competitiveness and innovation, while also supporting individuals in accessing decent work, particularly in contexts where such opportunities are limited. More broadly, lifelong learning helps strengthen economies and societies and is an important part of successful growth and development strategies.
Lifelong learning holds a central role in international policy, evident in its prominent role within Sustainable Development Goal (SDG) 4 of the United Nations 2030 Agenda for Sustainable Development, which commits to ensuring inclusive, equitable and quality education while promoting lifelong learning opportunities for all. At the national level, policy debates increasingly emphasize lifelong learning and skills development as key policy objectives that can improve employers’ and workers’ capability to adapt to changes in the world of work.
Despite growing attention to lifelong learning and skills development, there remains no universally accepted understanding of what lifelong learning entails. To fill this void, this report conceptually derives the following definition: lifelong learning encompasses all learning activities undertaken throughout life, individually or collectively, whether in educational, work, family or other social contexts. It aims to increase knowledge, skills and attitudes or behaviours conducive to learning, responding to the aspirations and needs of individuals, groups as well as the wider economy, independently of whether it leads to formal certificates or qualifications.
While the report is anchored in the ILO’s mandate focusing primarily on learning within the world of work, it also acknowledges that lifelong learning spans all stages and domains of life. To build a solid conceptual foundation, Chapters 1 and 2 adopt a broad perspective, exploring lifelong learning through the lenses of education, work and wider society. Because gaps in access to lifelong learning are particularly stark in the world of work, and because major transformations in the world of work pose specific challenges for workers’ and enterprises’ skills development, the subsequent chapters narrow the focus to learning within the world of work. They examine how it supports workforce development, inclusion and resilience. In line with the ILO’s approach, the report analyses different types of learning (formal, non-formal and informal) and the barriers faced by both individuals and institutions in accessing, supporting or providing lifelong learning opportunities. It also explores how lifelong learning responds to labour market dynamics, with attention to workers’ skills development.
However, the scope of lifelong learning reaches further, encompassing all forms of learning from early childhood to adulthood and transcending the needs of a particular workplace, sector or occupation. It extends to broader societal goals – not least in relation to active citizenship and collective organization, social inclusion, social justice and the correction of imbalances in people’s opportunities – aiming to break the intergenerational cycle of poverty and counterbalance gender disparities. As such, lifelong learning is a multifaceted objective that reaches beyond education and training policies. It should incorporate mechanisms that provide workers with the time and financial support needed for learning and assist them with other needs. Therefore, lifelong learning should be strategically integrated with other policies, such as social protection, employment and active labour market policies (ALMPs), to support workers during the transitions they experience throughout their careers.
Furthermore, lifelong learning is an evolving, dynamic concept that responds to ongoing socio-economic challenges and reflects current policy priorities. While the debate around lifelong learning is not new, it has acquired new traction in recent years. The accelerated pace of technological change driven by digital transformation and the shift towards environmentally sustainable economies – referred to as the “twin transition” – underscores the need for flexible skills development offer that allows workers to navigate the phases of work and learning in non-linear ways over their life cycle (see also section 5.2). Such flexible learning pathways can effectively address skills gaps, combat skills obsolescence among experienced workers, and mitigate skills mismatches, especially among educated youth. Additionally, ageing populations and the consequent extension of working lives in many parts of the world have raised new concerns, highlighting the importance of integrated lifelong learning throughout the life cycle.
This first chapter aims to deepen the understanding of the intricacies and relevance of lifelong learning today. Section 1.2 traces the historical evolution of lifelong learning, even before the term was coined, and includes how the concept evolved within the ILO. Considering this context and the multiple perspectives on lifelong learning, section 1.3 develops the above-mentioned definition, which aligns with the spirit of ILO instruments and objectives. This broad definition serves as a foundational guide to operationalize lifelong learning. Building on this basis, this chapter presents a conceptual framework, which can be used by researchers and policymakers in various contexts, organized around three areas: education and schooling, the world of work and broader societal learning. Section 1.4 concludes by exploring the development of systems and its diverse adaptations to regional and economic variations.
1.2. Historical evolution of the lifelong learning concept
From humanity’s earliest days, older generations have transmitted information, skills and knowledge to younger ones, but learning also occurred among peers, in communities and across age groups (UIL 2020). This transmission was primarily oral over long periods in history, as learning was most often informal or incidental – through work activities, observation, and communal and family life. Yet, learning also took more structured forms, such as ritualized cultural expressions or the systematic transmission of skills associated with a craft that occurs in traditional apprenticeships. Over time, societies worldwide developed ways to organize learning, combining informal methods with formal institutionalized education and training offered by public and private entities.
Different societies all over the world, established unique educational systems shaped by their cultural, economic and political contexts. These systems often aimed to support moral and spiritual development, ensure community stability and preserve cultural traditions. Educational practices varied widely but often featured close teacher–student relationships. Initially targeting specific groups, primarily male learners, some educational systems evolved towards greater inclusivity over time.
Formal education typically mirrored social hierarchies. Basic literacy was often taught in community settings (for example, parish schools, pathsalas in India), while higher-level studies were reserved for elites (for example, universities, Vedic gurukuls or certain madrasas in the Islamic world). Early apprenticeship systems existed in ancient cultures (Babylon, Egypt) and became an essential feature of medieval European crafts guilds. Over time, the state assumed responsibility for education, establishing public schools and distinguishing secular from religious-based education.
1.2.1. From lifelong education to lifelong learning
The idea that learning and education is a continuous process central to personal fulfilment and societal development dates back to ancient philosophers and spiritual leaders across various cultures – including Plato, Seneca, Confucius, Buddha, early Indian philosophers and Islamic spiritual leaders – who left a written trace. Early education systems also embraced holistic frameworks that valued continuous learning as a tool to adapt to change, reflecting ideas akin to modern notions of “lifelong education” and “lifelong learning” that gained international prominence in the 1970s.
The contemporary understanding of these concepts emerged more recently, shaped by the evolving European education system and the influence of industrialization in Europe. While “lifelong education” emphasized the institutional transmission of knowledge, “lifelong learning”, which gained traction in the 1990s, focused on the acquisition of knowledge and placed greater responsibility on the individual.
This chapter identifies five historical phases in the development of the lifelong learning concept (see figure 1.1). First, the emergence of adult education during the European Enlightenment and the Industrial Revolution. Second, the period of innovation and institutionalization of adult education. Third, in parallel, its expansion to colonial and non-Western societies in the late nineteenth and early twentieth centuries. Fourth, the rise of international discourse on lifelong education as a global framework in the 1970s. And fifth, the promotion of lifelong learning as a response to the challenges of globalization from the 1990s onward.
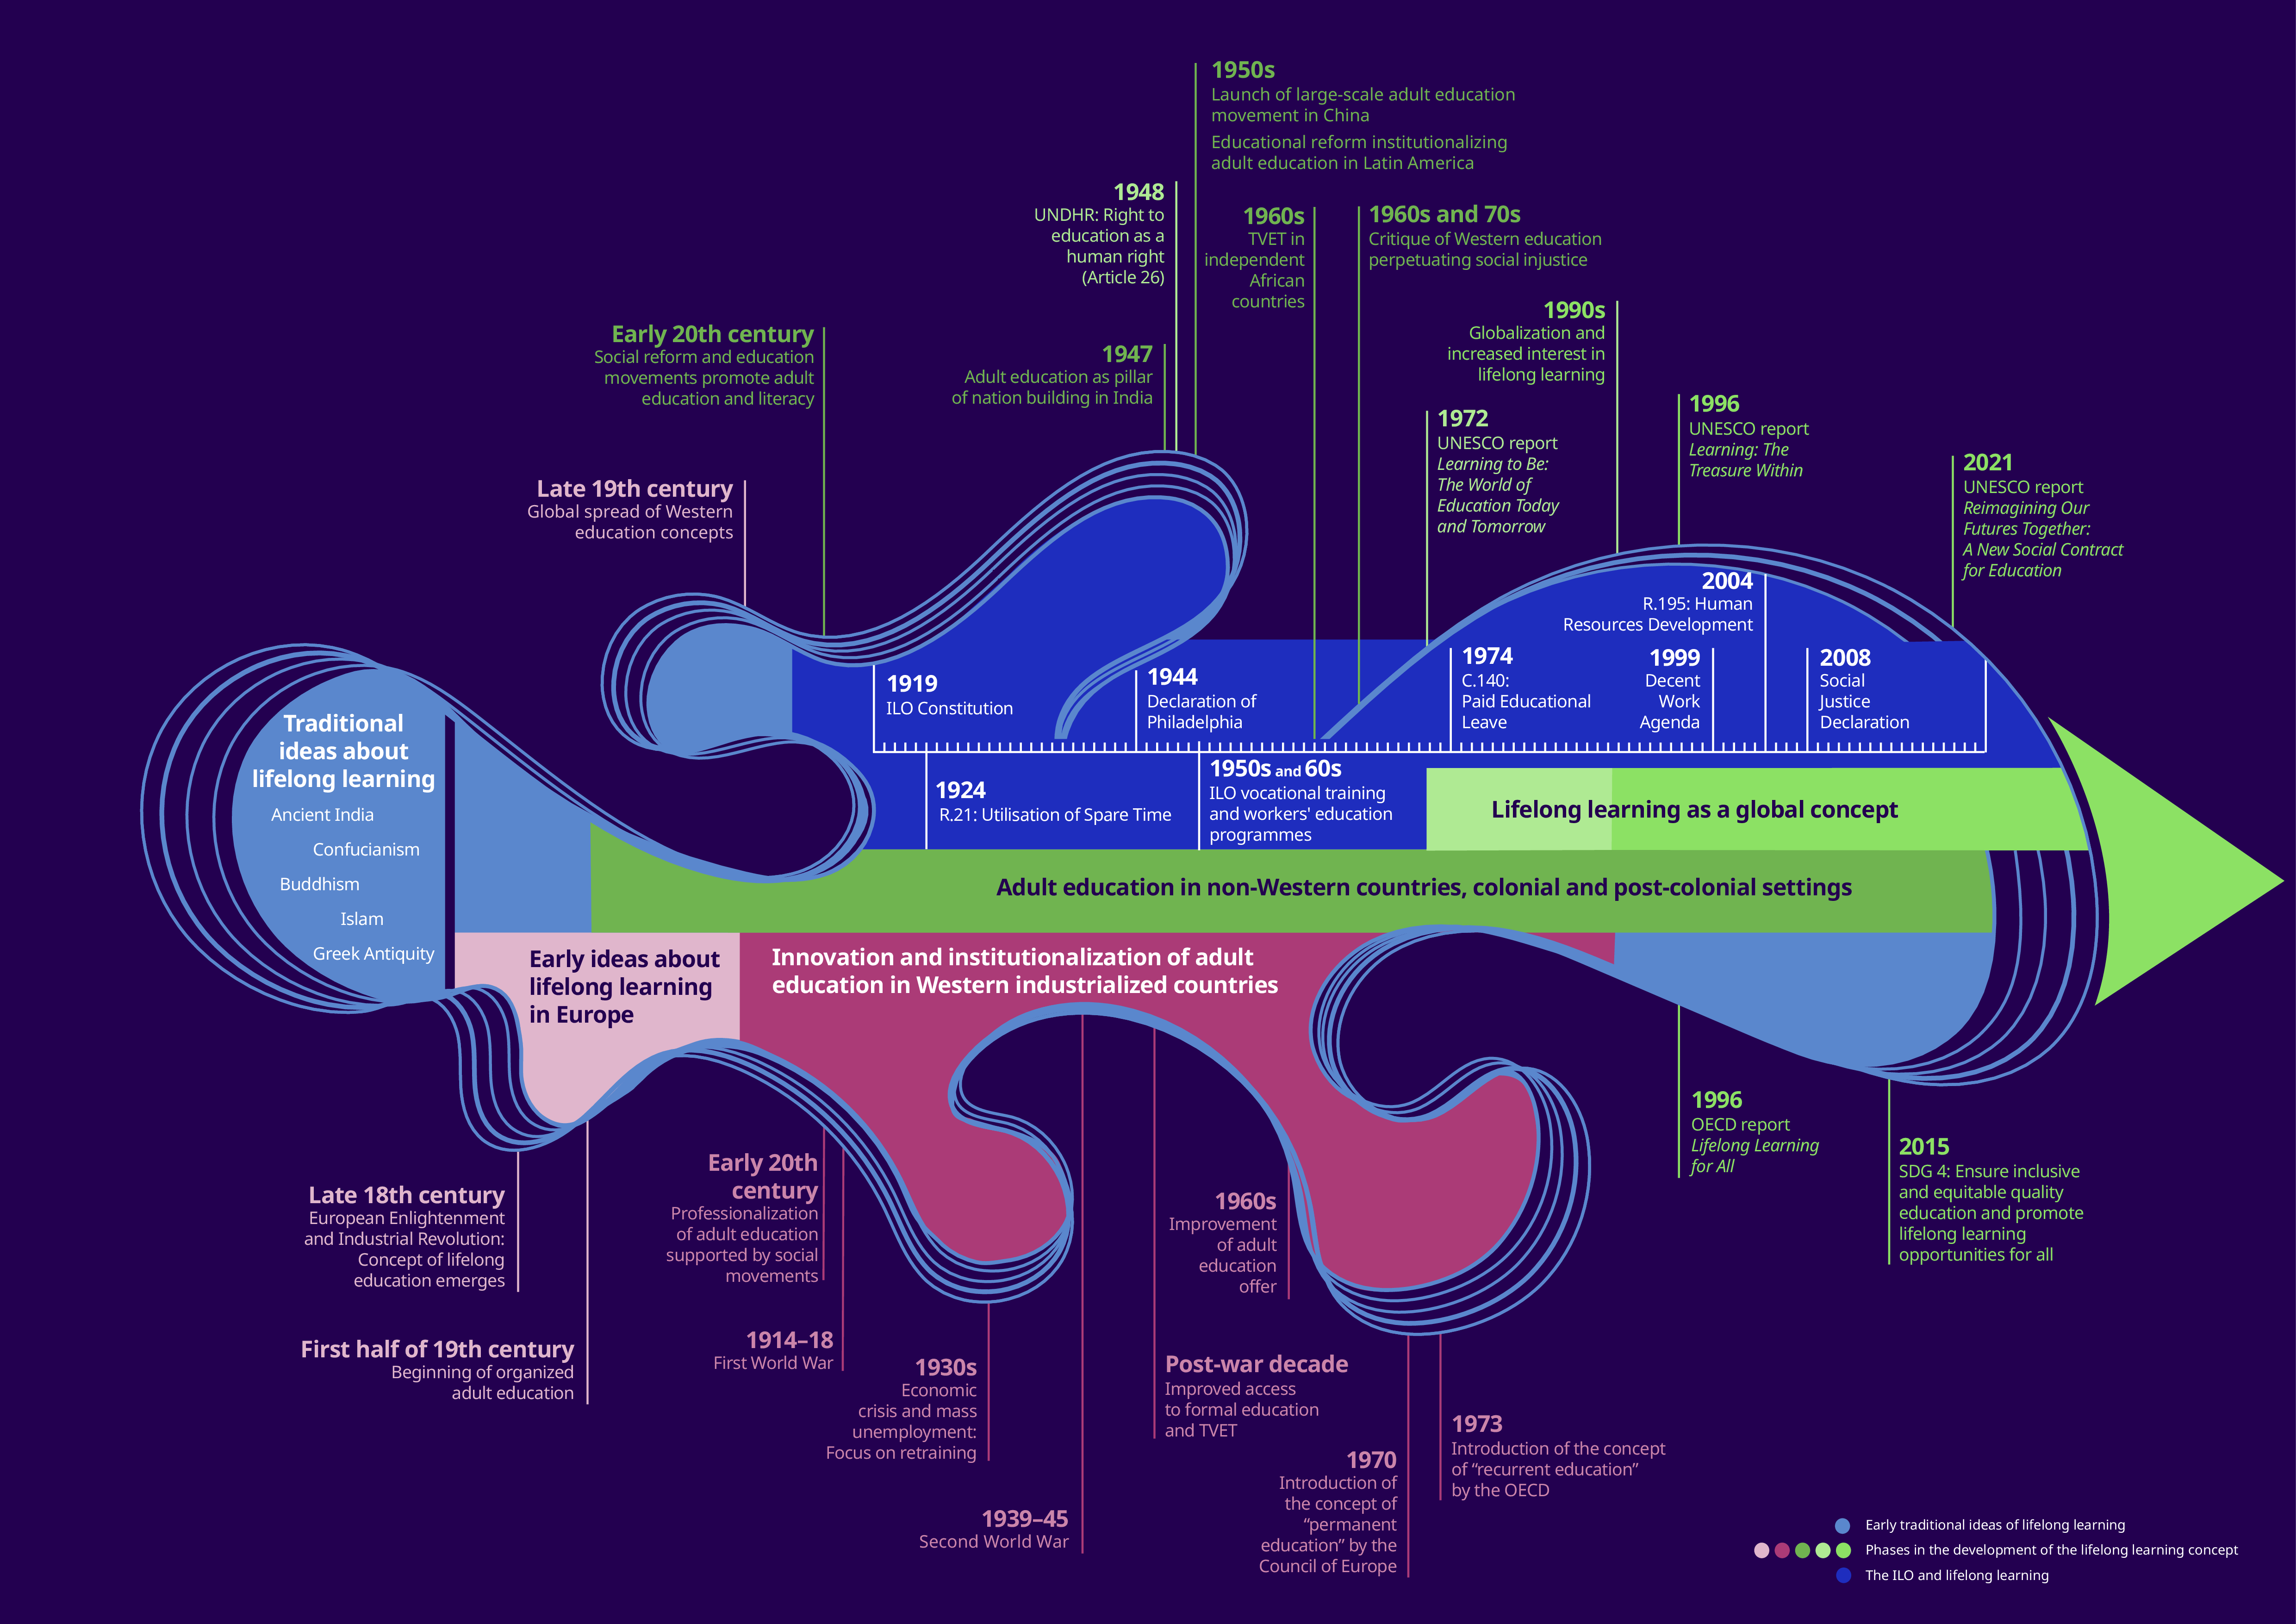
Early ideas about lifelong education in Europe in the eighteenth and nineteenth centuries
The Western concept of lifelong education originates from two intertwined developments: the Enlightenment belief in human reason and education as a force for transformation, and the socio-economic and technological changes brought by industrialization in Europe. From the late eighteenth to the nineteenth century, these changes gave rise to national education systems that reached broader populations, in which school became the central space for organized and increasingly secular instruction.
During the French Revolution, the idea of lifelong learning became synonymous with adult education and self-instruction, as pathways to social and economic progress (Hake, van Gent and Katus 2004). In response to the dynamics of the unfolding Industrial Revolution, adult education broadened across Europe, covering vocational and non-vocational learning (such as literacy, calculus, drawing, mechanics and agriculture) and later extending to university classes. While complementary to emerging formal education systems and what we now define as technical vocational education and training (TVET),2 these initiatives lacked institutional linkages (Hake, van Gent and Katus 2004).
By the mid-nineteenth century, institutionalized adult education initiatives – such as Mechanics’ Institutes in Scotland and England in the 1820s, municipal adult classes in France in the 1830s and the Danish Folk high schools of the 1840s – had spread widely to other industrializing countries.
Adult education primarily targeted men with little or no formal education – such as farmers, crafts workers and, in the second part of the nineteenth century, industrial workers – while women’s participation developed later (Fieldhouse 1996; Laot 2013; Olbrich 2001). Programmes were largely private and served both skills development and civic goals, including workers’ moral development, especially for women (Hake and Laot 2009; Lembré 2020).
In contrast to these liberal and social reformist “top–down” adult education initiatives, the labour movement promoted “education for workers by workers”, often organized by trade unions. These programmes focused on literacy, technical skills and cultural access, with broader goals of empowerment, political emancipation and the creation of a class identity (Merrill and Schurman 2016). Together, liberal adult education and workers’ education became the two major influencers shaping the ILO’s initiatives on education in the world of work (see section 1.2.2).
Innovation and institutionalization in Western industrialized countries: Adult education in the twentieth century
In the early twentieth century, adult education became more professionalized, institutionalized and increasingly connected to larger social movements, including workers’, women’s, Christian and cooperative movements (Cooke and MacSween 2000).
The First World War and the Bolshevik Revolution spurred renewed debate in Western countries about the role of education in modernization, socio-economic progress and democratic stability (Field 2001). Notably, the British Government’s 1919 report on adult education was likely the first official document to assert that “adult education is a permanent national necessity, an inseparable aspect of citizenship, and therefore should be both universal and lifelong” (The Centenary Commission on Adult Education 2019; see also Lindeman 1926 and Wiltshire, Taylor and Jennings 1980).
Educators – such as Eduard C. Lindeman in the United States and Basil A. Yeaxlee in the United Kingdom – advocated “lifelong education” as a key vector of democratization and social justice, emphasized learning from experience and recognized the value of what is called today non-formal and informal education – in churches, trade unions, workshops and associations (Lindeman 1926; Yeaxlee 1929). However, the economic crisis of the 1930s and soaring unemployment shifted focus towards adult retraining programmes, often compulsory, supported by public authorities and employers (Field 2001; ILO 1939).
Following the Second World War, the demand for adult education and vocational (re)training surged. The reintegration of hundreds of thousands of demobilized soldiers and millions of refugees, the urgency of economic reconstruction and the pace of technological change (accelerated by the war) forced governments to facilitate access to formal education and adult retraining. These priorities were also reflected in the ILO’s early manpower programmes (see below).
In the 1960s, liberal market economies integrated publicly financed adult education, both vocational and non-vocational, into welfare and formal educational structures. Similarly, socialist countries – particularly the Soviet Union – promoted both formal and non-formal adult education to boost productivity and drive industrialization and modernization (Zajda 2003), thus also serving political and societal objectives defined by the Communist Party.
Adult education in non-Western countries: Colonial and post-colonial settings
From the late nineteenth century through the first half of the twentieth century, Western educational concepts spread globally. Their implementation often disrupted or destroyed local traditions with long-lasting traumatic consequences – especially in colonial settings, but also for ethnic minorities and native populations in Western countries. While colonial education systems differed in nature and methods, they typically imposed formal structures that, whether intentional or not, did not always succeed in replacing pre-existing forms of education. These systems generally catered to colonizers and local elites, entrenching inequality in access to formal education. However, certain aspects of Western adult education, particularly those focused on emancipation through learning and literacy, also inspired social reform and anti-colonial movements. Following independence, post-colonial states placed education – and, in particular, adult education – at the centre of national development and modernization agendas.
In India, for instance, the significance of learning throughout life was evident in ancient scriptures and educational practices spanning temples, villages and early universities (Mandal 2019). British colonial rule introduced a centralized education system, largely limited to urban elites (Kumar 2016). Inspired by Western social reform, literacy-focused education was largely undertaken by missionaries and later taken up by non-governmental social reform organizations, some aligned with the freedom movement (Balakrishnan 2002). After independence, adult education became a pillar of nation-building (Mandal 2019).
In China, Confucianism, which viewed learning as a lifelong journey of individual self-improvement (Zhang 2008), served as a foundational principle for early adult education aimed at nurturing future elites.3 Early mass education, including adult education, began during the Republic era and emphasized literacy as well as technical education and training, influenced by Western models (Wang and Liu 2022; Wu 1930).
In Latin America and the Caribbean, the educational landscape has long been shaped by colonial legacies that continue to influence access and equity. After gaining independence in the nineteenth century, most countries retained education systems that reinforced racial and socio-economic inequalities. Formal education remained accessible for (mostly male) elites, while basic on-the-job training was considered sufficient for the broader population (Rama and Tedesco 1980). Following the Second World War, educational reforms aimed at modernization and industrialization led to a greater institutionalization of adult education, including literacy and vocational and technical training (Cortright 1966; UNESCO, ECLA and UNDP 1981; Wallenborn 2001).
In the 1960s, amid widespread social and political unrest, a popular education movement emerged. Driven by local activists, churches and non-governmental organizations, it championed learner-centred, informal adult education as a vehicle for emancipation, social justice and political change. Paulo Freire, a Brazilian educator and theologian, was central to this movement. His ideas strongly influenced regional education debates and aligned with the United Nations Educational, Scientific and Cultural Organization (UNESCO)’s vision of lifelong learning. However, popular education has taken diverse forms, shaped by local contexts and varying in goals, content, methods and outcomes (Jara 2010).
In colonial Africa, educational opportunities for the colonized populations were constrained by racial and gender discrimination and designed to produce a compliant workforce for the colonial administration (Matasci, Bandeira Jerónimo and Gonçalves Dores 2020). This undermined indigenous systems that emphasized practical knowledge transmission and community involvement (Fordjor et al. 2003; Nafukho, Amutabi and Otunga 2005; Preece 2009). In some African colonies, adult education initiatives inspired by the respective European models were established for selected indigenous groups (mostly in urban areas), offering evening classes, correspondence courses and, by the end of the century, sometimes remote access to university education (mostly to men) (Indabawa et al. 2000).
Following decolonization, adult education and TVET were integrated into national development strategies. Despite their significance, many programmes failed to connect with the realities and work lives of people, especially in rural-based economies (Elfert 2019; Indabawa et al. 2000; Poignant 1970). There were attempts in newly independent African countries, such as those by President Kwame Nkrumah in Ghana and President Julius Nyerere in the United Republic of Tanzania, to ”decolonize” education and ground lifelong learning in African traditions, such as ujamaa or ubuntu (Abraham 2022; Preece 2009).
Contrasting with the formal education systems, informal and traditional non-formal education systems often provided more accessible learning pathways. Yet, barriers like gender disparities in traditional apprenticeships persisted. In many post-colonial societies, traditional apprenticeship relationships continue, whereby a more experienced craftsperson passes on knowledge and skills to learners. For example, TVET is often perceived in low- and middle-income countries as a path to white-collar jobs, while practical skills necessary for specific occupations are acquired through traditional apprenticeships. Post-independence, critiques emerged of inherited systems for perpetuating social injustice, inequality and exclusion – echoing broader debates about Western education models (Bourdieu and Passeron 1970). These critiques, alongside rapid technological and societal changes, reinforced calls to rethink the concept of lifelong education (Kallen and Bengtsson 1973).
A threefold paradigm change in the 1970s: Lifelong education as a global education strategy
The broader concept of lifelong education resurfaced in the 1960s, this time on the international stage. Three distinct paradigms emerged in response to what was perceived as a global education crisis, spurred by the 1968 student protests and demands from newly decolonized nations for education to support their development strategies (Kallen 1996). These paradigms also influenced debates in the ILO.
In 1970, the Council of Europe introduced the concept of “permanent education” (éducation permanente) as a coherent strategy for European education systems. It aimed to promote equality of opportunity by bridging theoretical and practical education and fostering greater learner participation. This was seen as a necessary response to the needs of modern, post-industrial societies undergoing rapid technological and social change (Council of Europe 1973).
UNESCO, responding to the demands of its growing global membership, particularly from developing countries, proposed “lifelong education” as a new global comprehensive framework suitable to all contexts.4 It was grounded in the right to education, as stipulated in UNESCO’s Constitution,5 article 26 of the Universal Declaration of Human Rights6 and article 13 of the International Covenant on Economic, Social and Cultural Rights.7 Its most influential articulation came in the 1972 “Faure report” (Faure et al. 1972), rooted in decades of adult education dialogue and European democratic education reform efforts (Elfert 2019).
Lifelong education, as envisioned by the Faure report, extended earlier liberal ideals of adult education and reinforced article 26(2) of the Universal Declaration of Human Rights, which states that education shall promote personal development, respect for human rights and understanding, tolerance and friendship among nations and communities. The concept also called for building “learning societies” by integrating all stages of education, expanding access to higher education, embracing formal and informal learning (see box 1.1) and addressing emerging topics, such as health and environmental education (Faure et al. 1972).
For the purposes of this report, the following definitions are used to describe different forms of learning. These should not be confused with statistical classifications of formal and non-formal education, which refer more specifically to institutionalized and structured learning systems.
-
Formal learning takes place in education and training institutions, is recognized by relevant national authorities and leads to diplomas and qualifications. Formal learning is structured according to educational arrangements, such as learning objectives, curricula, qualifications and teaching–learning requirements. It is intentional from the learner’s point of view.
-
Non-formal learning (also referred to as semi-structured learning) occurs outside of formal education systems, often in addition or as an alternative to formal learning. While it can be planned and structured according to educational and training arrangements, it is generally more flexible. It usually takes place in community-based settings, at the workplace or through civil society initiatives. TVET institutions may support non-formal learning by delivering targeted training that does not lead to qualifications – such as core skills modules and technical training. These may be offered as stand-alone courses, community programmes or as part of recognition of prior learning (RPL) processes.
Although non-formal learning is intentional from the learner’s perspective, its outcomes are not always officially recognized. Recognition, when it occurs, typically happens through validation and accreditation processes managed by relevant authorities, sometimes with the involvement of TVET institutions. Non-formal learning may also be the object of certification under the auspices of authoritative sectoral organizations that produce industry standards, enjoying broad recognition by employers and professionals in an economic sector. Examples of non-formal learning include adult literacy programmes, in-company training, structured online learning and apprenticeships in the informal economy.
-
Informal learning is learning that occurs in daily life, in the family, in the workplace, in communities and through interests and activities of individuals. Through a recognition, validation and accreditation process, competences gained in informal learning can be made visible and contribute to qualifications and other recognitions. In some cases, the term experiential learning (or “learning by doing”) is used to refer to informal learning that focuses on learning from experience. Another important source of informal learning is learning from peers, for instance through workplace interactions and shared practices. Informal learning may be unintentional from the learner’s perspective.
Source: Cedefop (2014); UIL (2012).
From a different perspective, the Organisation for Economic Co-operation and Development (OECD) introduced the concept of “recurrent education”, a more functional, productivity-oriented concept grounded in human capital theory. It encouraged alternating periods of education or training and work, with paid educational leave as a core mechanism (Kallen 1996).
The debate on lifelong education contributed to improvements in the overall offer of adult education. New technologies supported distant learning (such as the British Open University), helping democratize access to education. However, the international efforts to promote lifelong learning did not lead to major reforms of national education and training systems.
In the following decades, the decline of stable wage employment, falling unionization and rising labour markets fragmentation in many countries further weakened lifelong learning initiatives. Paid educational leave policies in Western Europe struggled with low take-up due to eligibility restrictions, limited awareness and inadequate financial support (Field 2001).
Lifelong learning since the 1990s: A global response to globalization and technological change?
The accelerated trend of globalization following the end of the Cold War and rapid technological change further transformed the world of work in the early 1990s. The persistence of informal and precarious employment in developing countries, coupled with its increase in industrialized ones and high unemployment in many regions, reignited interest in lifelong learning. By then, the term had largely replaced lifelong education.
The concept was also formally integrated into international human rights law. In 1999, the United Nations (UN) Committee on Economic, Social and Cultural Rights stated that the right to fundamental education ”is not limited by age or gender... [and] is an integral component of adult education and life-long learning” (UN 1999, para. 24).
A pivotal policy document during this period was UNESCO’s “Delors report” (Delors 1996). It offered a global vision of twenty-first-century education centred on four pillars of “learning throughout life”: learning to know, learning to do, learning to live together and learning to be. Compared to the Faure report, it put a stronger emphasis on the economic dimension of continuous training – formal and informal – for employability. The report recognized the potential of emerging technologies to democratize knowledge, but also warned of their capacity to deepen inequalities (Elfert 2015).
The OECD’s Lifelong learning for all (OECD 1996), published the same year, presented a more market-oriented view. It framed lifelong learning as a tool to increase individuals’ skills and competencies for labour markets needs and to build competitive knowledge societies. Emphasizing a “whole-system approach”, it called for integrating formal and non-formal education and training with consistent outcomes and credits systems (Elfert 2015; Field 2001).
Lifelong learning was also actively promoted by the European Commission’s strategy for a single European market. Several governments embraced this framework to modernize their education systems and foster competitiveness and innovation (Volles 2016).
By the early 2000s, lifelong learning had become a consensus policy response among industrialized countries to address global economic competition. This shift from lifelong education to lifelong learning mirrored broader societal transformations towards more individual responsibility, autonomy and continuous adaptation to labour market needs. This era also placed increased pressure on non-employed groups to enter the labour market to reduce welfare spending (Field 2001). While non-state actors were seen as key players, the role of trade unions in lifelong learning remained marginal, underscoring a prioritization of economic over wider political, social and well-being objectives.
In Asia, countries developed lifelong learning strategies in line with the approaches of the OECD and the European Union (EU), building on traditional values of continuous learning (Medel-Añonuevo, Ohsako and Mauch 2001; Zhang 2008). Other countries, especially in Latin America, privileged access to higher education, or focused on basic and primary education for all as the most cost-effective investment (Elfert 2019). In light of these still highly heterogenous approaches, it is not surprising that the concept of lifelong learning was absent from the UN Millennium Development Goals.8
Over time, employability and individual responsibility for skills development became the dominant objectives of lifelong learning; a development that also influenced ILO thinking (Elfert and Draxler 2022). In 2015, SDG 4 (Ensure inclusive and equitable quality education and promote lifelong learning opportunities for all) broadened the scope of the concept again, stating not only economic aims, but also societal and environmental objectives – including education for sustainable development, human rights, gender equality, peace and global citizenship (UN, n.d.). Recent EU policy documents, such as the EU Skills Agenda (European Commission 2016, 2020), similarly incorporated inclusion and citizenship, advocating for greater public support for individual learning choices. UNESCO’s 2021 report Reimagining our futures together: A new social contract for education (UNESCO 2021a) reaffirmed the need for a social objective of education and learning as it is a common good. It highlighted the central role of teachers and free public education, and emphasized human dignity and community as key aims of education.
Alongside a stronger focus on the societal role of learning and education, there has been growing recognition of the need for culturally embedded lifelong learning strategies. For the twenty-first century, such strategies should blend existing educational traditions, philosophical worldviews and value systems with contemporary pedagogical approaches to foster inclusive, locally grounded learning societies (Fordjor et al. 2003; Mandal 2019; Preece 2009; Wu 2020).
1.2.2. The ILO and lifelong learning
As the concept of lifelong learning evolved, so did its role within the ILO, shaped by the economic and societal needs of its constituents. The ILO has long supported education and learning from childhood through to adulthood, focusing on three areas aligned with its social justice mandate: combating child labour through compulsory early education, advancing TVET and offering adult education for workers. These efforts underpin the ILO’s commitment to fairer labour market outcomes within the overall aim to “improve the conditions of work”, as stated in the Preamble of the ILO Constitution.9
The two first dimensions were already reflected in the Preamble of the ILO Constitution, which called for the “protection of children [and] young persons” and the “organization of vocational and technical education”. Simultaneously, the ILO supported workers’ education, reflecting its foundational conviction that “labour is not a commodity”. The promotion of the eight-hour workday was tied to enabling education during leisure time, as evidenced by the Utilisation of Spare Time Recommendation, 1924 (No. 21).
Following the Second World War, the ILO called on its members to establish comprehensive education and training systems, aligning with the Declaration of Philadelphia of 1944.10 This Declaration, which was appended to the ILO Constitution in 1946, affirmed that “all human beings, irrespective of race, creed or sex, have the right to pursue both their material well-being and their spiritual development in conditions of freedom and dignity, of economic security and equal opportunity”. Part III of the Declaration further committed the ILO to the provision of training facilities to achieve these aims, the promotion of employment in occupations that allow workers to fully apply their skills and talents, the cooperation of employers and workers in the continuous improvement of productivity, and the assurance of equal access to educational and vocational opportunities. Initially focused on European reconstruction, the ILO’s training efforts soon expanded to support development of economically less developed countries (ILO 1949).
In response to the needs of new Member States, especially those emerging from decolonization, attention shifted to building modern and productive labour forces. This included vocational and technical training and “workers’ education” – now defined more narrowly as non-vocational education, often run by trade unions. Its goals included educating workers about their economic and social roles, awareness of labour rights, democratic participation and better industrial relations. To support this, the ILO established its International Training Centre in Turin, Italy, in 1965, offering both vocational training and workers’ education courses (Guigui 1972) to professionals from developing countries. The ILO also helped setting up national and regional tripartite productivity organizations where training was central.
In the 1970s, the ILO actively engaged in the public and academic debate around lifelong and recurring education. There was broad consensus among ILO constituents that lifelong learning could facilitate equitable access to employment and improve working conditions, including in areas like accident prevention and other aspects of occupational safety and health. In 1974, the ILO adopted the Paid Educational Leave Convention (No. 140) and Recommendation (No. 148). These instruments broadened the scope of continuing education to include “training at any level; general, social and civic education; and trade union education”, reflecting the organization’s comprehensive approach to workforce development.
A year later, the Human Resources Development Convention, 1975 (No. 142) (and Recommendation, 1975 (No. 150)), further emphasized the comprehensive nature of the lifelong education concept. Both instruments embodied the ideal that lifelong education is essential not only for economic progress and social cohesion, but also for facilitating individual fulfilment and preserving workers’ fundamental freedom of choice. They called for active cooperation with employers’ and workers’ organizations in formulating and implementing training policies and programmes, reinforcing the tripartite approach to lifelong learning systems (for more detail, see section 1.3.1).
In the mid-1990s, under the pressures of globalization and rapid technological change, the ILO joined the OECD and UNESCO in advocating for lifelong learning as a tool to increase workers’ productivity, support lifelong employability and boost economic competitiveness among countries. Lifelong learning also served the human rights objective of promoting equality of opportunity for women and marginalized groups (for example, persons with disabilities and displaced persons) (ILO 1998). During this period, however, national attention to traditional non-vocational workers’ education declined.
In 1999, the launch of the ILO Decent Work Agenda cemented the link between lifelong learning and employment promotion (ILO 1999). The Human Resources Development Recommendation, 2004 (No. 195) – the first ILO standard to explicitly use the term lifelong learning – reinforced socio-economic objectives, particularly employability, but also recognized its contribution to personal development, culture and active citizenship, echoing broader UNESCO and EU perspectives (see section 1.2.1). The ILO’s Committee of Experts on the Application of Conventions and Recommendations (CEACR) emphasized the human rights dimension of the instrument (ILO 2010, para. 106) by recalling that Recommendation No. 195 states that Member States should “recognize that education and training are a right for all and, in cooperation with the social partners, work towards ensuring access for all to lifelong learning”. The ILO Declaration on Social Justice for a Fair Globalization of 2008 and the ILO Centenary Declaration for the Future of Work11 of 2019 further underscored the need to align education and training systems with labour market needs, and enhance individuals’ capacity to access decent work. They also highlighted the importance of developing the capabilities needed for democratic participation and, in the case of vulnerable groups, for full inclusion in societies.
Today, as societies face rapid technological disruption and overlapping global crises, this report places renewed emphasis on the societal dimensions of lifelong learning. Drawing inspiration from UNESCO’s Global Education Monitoring Report, 2021/2 (UNESCO 2021b), and based on the subsequent discussions of key principles and elements of lifelong learning, it calls for a revitalized focus on leveraging traditional, community-based forms of education, learning and skills development.
1.3. Constructing a definition of lifelong learning
1.3.1. Lifelong learning in ILO instruments and other key documents
While international labour standards,12 the work of supervisory bodies and other texts and instruments of the ILO do not provide a full description of all dimensions that may help define lifelong learning, they provide important normative elements and document key stakeholder commitments. As mentioned above, the Declaration of Philadelphia laid a foundational basis for the ILO’s approach to lifelong learning already in 1944.
International labour standards furthermore encourage the promotion of universal access to learning for people of all ages, acknowledging the existence and relevance of diverse types of learning over the life cycle. Chief among the ILO’s instruments are the Human Resources Development Convention, 1975 (No. 142), and Recommendation, 2004 (No. 195). Convention No. 142 frames education and human resources development in a comprehensive manner, calling for the establishment and development of flexible and complementary systems of general, technical and vocational education, educational and vocational guidance and vocational training, whether within or outside the formal education system. Significantly, the text introduces a lifelong approach that accounts for both workers’ aspirations and the broader needs of society, extending beyond economic and employment goals (see also ILO 1991). The CEACR has further commented on Convention No. 142 as emphasizing “the importance of training throughout a person’s working life, which is now known as ‘lifelong learning’” (ILO 2010, para. 162). In doing so, the Committee also underscored that continuous access to training enables individuals to upgrade their skills, thereby supporting career progression and improving employment prospects. Moreover, the CEACR recognizes that robust lifelong learning systems are essential for responding to today’s structural transformations (ILO 2010, para. 580).
While the term lifelong learning had already appeared earlier in the Job Creation in Small and Medium-Sized Enterprises Recommendation, 1998 (No. 189), which encouraged “a process of lifelong learning for all categories of workers and entrepreneurs”, Recommendation No. 195 is the first to formally define the concept and embed it within a comprehensive framework. It defines lifelong learning as “all learning activities undertaken throughout life for the development of competencies and qualifications”. As mentioned above, the CEACR observes that Recommendation No. 195 aligns with human rights instruments by affirming the right to education and training (ILO 2010, para. 106). Recommendation No. 195 further recognizes lifelong learning as a contributing factor to the advancement of the interests of individuals, enterprises, the economy and the society as a whole. This definition underlines the importance of knowledge and skills acquired whether formally, non-formally or informally, emphasizing the significance of learning that happens within work contexts, communities and families. Consistently, Recommendation No. 195 calls for the development of comprehensive systems that can respond to current and future skills needs. These systems should ensure flexible training options, the recognition and certification of skills, robust qualification systems, sustainable funding, quality assurance and support for career development.
The Paid Educational Leave Convention (No. 140) and Recommendation (No. 148), 1974, complement the above instruments by establishing a clear obligation for Member States to enhance access to education and training in the world of work. Convention No. 140 requires that Member States “formulate and apply a policy designed to promote, by methods appropriate to national conditions and practice and by stages as necessary, the granting of paid educational leave”. This leave must be granted “for a specified period during working hours, with adequate financial entitlements”, with the aim to help workers adjust to technological, economic and structural change. While Convention No. 140 focuses on social benefits and other rights deriving from an employment relation, it applies to all workers, including those in non-standard or undeclared forms of work. Nonetheless, its implementation may remain challenging in informal contexts. In contrast, the Transition from the Informal to the Formal Economy Recommendation, 2015 (No. 204), explicitly addresses the needs of workers and learners in the informal economy, stating that “prior learning such as through informal apprenticeship systems [should be recognized], thereby broadening options for formal employment”.
Focusing on a specific aspect of lifelong learning, the Quality Apprenticeships Recommendation, 2023 (No. 208), advocates for the establishment of regulatory frameworks that promote quality apprenticeships. Recommendation No. 208 emphasizes the critical role of tripartite systems and programmes in developing up-to-date skills and qualifications required to perform various trades. It underscores the importance of maintaining high training standards for teachers and trainers, formalizing apprenticeship agreements, ensuring adequate remuneration and providing social protection. Furthermore, it emphasizes creating opportunities for a socially inclusive access to apprenticeships, ensuring that diverse groups can benefit from these educational pathways. Complementing this, the ILO–UNESCO Recommendation concerning the status of teachers13 of 1966 and subsequent declaration of 201814 provide foundational guidance on the rights, responsibilities and working conditions of educational and teaching staff. These measures aim to support teachers and educators in preparing learners not just to adapt to but to actively shape their futures, aligning with broader educational and labour market goals (Rawkins 2018).
While this chapter emphasizes international labour standards directly linked to the development of skills and qualifications, the broad understanding of lifelong learning adopted here – which includes education, learning in the world of work and societal learning across the life course – calls for a wider set of relevant instruments, including:
-
the Minimum Age Convention, 1973 (No. 138), and the Worst Forms of Child Labour Convention, 1999 (No. 182), which safeguard children’s right to education; and
-
the Indigenous and Tribal Peoples Convention, 1989 (No. 169), which supports culturally appropriate lifelong learning.
Collectively, these instruments affirm lifelong learning as a key dimension of human development, decent work and social justice.
The CEACR has also emphasized the critical importance of lifelong learning in the face of global transformations. In its 2020 General Survey on promoting employment and decent work, the CEACR underscored the essential role of lifelong learning in the face of continuous technological innovations, climate change and environmental transformation (ILO 2020, para. 1067(e)). In contexts of continuous change, the Committee recognized that access to lifelong learning enables all workers to participate meaningfully in the labour market and to adapt successfully to future transitions (ILO 2020, 19).
Moreover, on the basis of the international labour standards, the ILO has adopted lifelong learning as an organizing principle of its human-centred approach to skills development. The ILO Centenary Declaration for the Future of Work links this to fundamental shifts in the world of work and mandates the ILO to promote “the acquisition of skills, competencies and qualifications for all workers throughout their working lives as a joint responsibility of governments and social partners”. To achieve this, it tasks the ILO and its Member States with ensuring lifelong learning and quality education for all and developing effective measures to support workers through the transitions, paying particular attention to education and training systems that are responsive to labour market needs. Relatedly, the report of the Global Commission on the Future of Work emphasizes that investment in people’s capabilities is “the cornerstone of a reinvigorated social contract” with relevance for “the broader dimensions of human development” (ILO 2019b, 30). Such investment aims to support people through transitions and to contribute to a lifelong active society. The report thus calls for a formal recognition of a universal entitlement to lifelong learning.
Finally, the ILO Strategy on skills and lifelong learning for 2030 (ILO 2023a) consolidates many of the dimensions addressed by international instruments, delivering an agreed framework for action that engages governments, social partners and civil society. The aim of the strategy is to improve the ILO’s capacity to support constituents in developing comprehensive, resilient and inclusive lifelong learning systems, based on social dialogue. These systems aim to deliver quality learning and actively contribute to human development, full, productive and freely chosen employment and decent work.
1.3.2. Stakeholder perspectives on lifelong learning in the world of work
The understanding and perceived value of what constitutes lifelong learning are not uniform across governments, employers and workers, and training providers. These diverse perspectives significantly influence how these key stakeholders of lifelong learning prioritize and shape system development,15 often leading to conflict and disagreement. In this context, social dialogue plays a crucial role in positioning lifelong learning as a catalyst for socio-economic development. It enables the convergence of different stakeholders to find common ground, as reflected in international labour standards, such as the Human Resources Development Recommendation, 2004 (No. 195), and recalled in the International Labour Conference resolution concerning skills and lifelong learning (ILO 2021b). The ILO calls on governments to work in cooperation with social partners to ensure access to lifelong learning for all, based on the shared commitment to system development reflected in international labour standards – despite differing views and interests. This section provides a brief analysis of the diverse values and evolving expectations stakeholders bring to lifelong learning. For individuals, lifelong learning is increasingly valued for its contribution to career success, personal fulfilment, well-being and adaptability in an ever-changing world. Large-scale surveys by Cedefop (2021) and the OECD (2025) show that both youth and adults consider continuing learning beyond initial education and training as essential for maintaining employability and seizing career opportunities. Learners engaging in education and pre-employment training view their future certificates and diplomas – as well as the skills they acquire – as crucial for securing employment or pursuing further training.
These surveys also highlight a shift in how individuals perceive the value of initial education and training. While traditional certificates remain crucial for labour market entry, shorter, targeted training courses focused on specific skill sets are gaining popularity. Additionally, financial incentives (such as targeted grants, scholarships and student loans) play a significant role in improving access for vulnerable groups (Herbaut and Geven 2020; Reinders, Dekker and Falisse 2021). Moreover, the development of mass education and outreach programmes, multiple entry points into educational processes, and the use of diverse media provide flexible access to training for individuals in all walks of life.
Focusing specifically on workers, lifelong learning is essential for them for adapting to evolving skills needs, enhancing employability and pursuing upward mobility. In this regard, career guidance systems and work-based learning opportunities, such as traineeships and quality apprenticeships, are gaining prominence (Alfonsi et al. 2020; Vermeire, De Cuyper and Kyndt 2022; Zimmermann et al. 2013). Moreover, lifelong learning has the potential to positively impact productivity, career prospects and motivation. Experienced workers lacking formal qualifications can benefit from RPL combined with supplementary training to attain necessary qualifications. Meanwhile, workers with outdated skills may require training in areas such as digital, green jobs, literacy, communication or data analysis (Hötte, Somers and Theodorakopoulos 2023; Ugur and Mitra 2017). While the effectiveness of lifelong learning systems is difficult to ascertain causally, the positive impacts of various learning opportunities have been well documented (see Chapter 5), as has the extent to which workers value lifelong learning for its potential and realized benefits. Flexible upskilling and reskilling opportunities through work-based and workplace training are highly valued for their impact on employability and income (Backhaus 2023; Picchio and van Ours 2013). Meanwhile, mid-career workers often seek transitions that better align with personal aspirations (Bozionelos, Lin and Lee 2020), where career guidance, grants and individual subsidies can play a crucial role.
Importantly, workers in the informal economy primarily access learning through non-formal and incidental opportunities, especially traditional or informal apprenticeships. These equip individuals with the skills necessary for a specific craft and can be upgraded to meet modern quality standards, incorporate new technologies and provide opportunities for formal qualifications. This flexible pathway is critical for integrating informal workers into the formal economy and enhancing their job security and development prospects. At the same time, it is important to recognize that many workers – particularly in low- and middle-income countries – often transition between formal and informal work during their lifetime (Brehm, Doku and Escudero 2023). Supporting lifelong learning across both segments is therefore essential to ensure smoother transitions and sustained employability.
Employers recognize the need for lifelong learning in developing workforce skills to address their current and future needs, retaining and nurturing talent, facilitating recruitment and enhancing adaptability and innovation potential. Apprenticeships play a strategic role in: (i) continuously aligning skills development programmes with the current and future skills needs of labour markets; and (ii) building a qualified workforce (Alfonsi et al. 2020; Zimmermann et al. 2013). Work-based learning facilitates the targeted development of specific skill sets that support adaptations in production, logistics and marketing related to digital transformation and the greening of workplaces (Sitzmann et al. 2006). The demand for digital and green skills goes hand in hand with a heightened demand for other core and transferrable skills, such as communication and problem solving (Cedefop 2018, 2022; ILO 2021c). This is often addressed by an expanding offering of micro-credentials.
Governments value lifelong learning for its broad socio-economic impacts, which are realized through diversified, accessible and flexible education and training solutions. These benefits may include improved access to literacy and skills, enhanced economic competitiveness, higher rates of innovation resulting from a more skilled workforce, the promotion of active citizenship, and overall improvements in well-being (Mallick, Das and Pradhan 2016; Phale et al. 2021). Governments have the capacity to create infrastructure, regulations and incentives that stimulate the development of various components of lifelong learning systems. These components can encompass education, initial training, work-based learning or digital-based learning. Governments are concerned with sustaining universal access to education and have a core role in financing and expanding access to lifelong learning, as well as assuring the quality of growingly diversified learning offer. This is often achieved through strategic partnerships and a tripartite approach that balances different yet complementary perspectives and needs (UNESCO and ILO 2018).
Lastly, education and training providers benefit from lifelong learning as it allows them to diversify and expand their offer, potentially reaching to new learners and providing higher service value. Lifelong learning promotes the creation of learning options that align closely with the growing demand for targeted upskilling and reskilling. Leveraging hybrid and online delivery methods helps to reduce costs and expand offer, develop capacity by engaging a diverse pool of trainers, and design training that engages learners across their lifespans. The development of lifelong learning encourages TVET to become more responsive to skills demand, supported by financing models that incorporate private contributions, improved skills governance and access labour market information (UNESCO 2021b). Additionally, the development of lifelong learning could lead to a greater private-based offer, frequently in the form of online courses with varied training credentials. Though, this presents significant challenges in terms of system development and regulation (Hawley-Woodall 2019).
1.3.3. Definition of lifelong learning
Against this background, the present report adopts the definition in box 1.2 as a stepping stone towards the operationalization of lifelong learning, including its measurement and application.
Lifelong learning encompasses all learning activities undertaken throughout life, individually or collectively, whether in educational, work, family or other social contexts. It aims to increase knowledge, skills and attitudes or behaviours conducive to learning, responding to the aspirations and needs of individuals, groups as well as the wider economy, independently of whether it leads to formal certificates or qualifications.
As mentioned in section 1.3.1, this definition builds on the one provided in the Human Resources Development Recommendation, 2004 (No. 195), which described lifelong learning as “all learning activities undertaken throughout life for the development of competencies and qualifications”. The definition in this report incorporates additional key components and guiding principles needed to operationalize lifelong learning in today’s context, and which contribute to shaping and operationalizing the concept:
-
Universal access: Lifelong learning should be promoted through comprehensive, flexible offerings of learning opportunities. This includes creating inclusive pathways that acknowledge previous learning experiences and offering both financial and non-financial incentives.
-
Skills relevance: Addressing current and emerging skills needs, gaps and mismatches is crucial for ensuring worker employability, access to decent work, and enterprise productivity and innovation.
-
Broader goals: Consistent with a human-centred approach, lifelong learning also encompasses broader goals, including personal self-fulfilment, community development and the transition to more inclusive, sustainable and resilient societies.16
-
Comprehensive systems: Effective lifelong learning requires coherent and coordinated policies that link with employment, social protection, environmental and digital strategies. ILO instruments, while refraining from prescribing a single definitive approach or ideal structure for lifelong learning systems, encourage the development of comprehensive systems built on robust skills intelligence. These systems should combine flexible and inclusive learning opportunities supported by strong institutions – including social dialogue and work-based learning arrangements, such as apprenticeships. They also depend on well-defined frameworks, effective governance, stable funding, qualified staff, rigorous quality assurance mechanisms, RPL and the provision of career guidance (see sections 1.4.2 and 1.4.3 for a discussion on lifelong learning systems).
Recommendation No. 195 provides guidance in this regard: stressing the integration of education, training and lifelong learning into broader economic, fiscal, social and labour market policies and programmes to support sustainable growth, employment and social development (ILO 2010, para. 122). It also calls on Member States to ensure coordination across all components of the education and training system within the lifelong learning framework (ILO 2010, para. 135).
Together, these components integrate the “world of work” with “broader societal” dimensions of lifelong learning, underscoring the importance of social dialogue in expanding opportunities and ensuring the quality of the offer. They also reflect the understanding that lifelong learning not only serves economic and employment objectives, but also contributes significantly to broader human, social and environmental development. This insight into the multidimensional nature of lifelong learning leads to the formulation of the following three guiding principles – which are consistent with the framework set out in the resolution of the International Labour Conference on skills and lifelong learning in 2021 (ILO 2021b) – for a comprehensive understanding of lifelong learning:
-
Lifelong scope: Lifelong learning consists of learning activities that occur over the life cycle and in diverse contexts – such as at school, work, within communities or at home, and while individuals engage in diverse activities and roles.
-
Varied modalities: Lifelong learning encompasses a wide array of learning modalities, from formal learning that leads to certificates and qualifications to non-formal learning (such as semi-structured on-the-job training) that may not necessarily result in certification. Informal learning – acquired non-intentionally through work and other activities or through personal exploration of information and human interactions – is an integral part of lifelong learning.
-
Inclusivity and equity: Lifelong learning is human-centred and inclusive, offering equal learning opportunities to all, regardless of background.
1.4. Operationalizing lifelong learning
1.4.1. Conceptual framework of lifelong learning used in this report
The comprehensive, multidimensional definition of lifelong learning adopted in this report, and its conceptual underpinnings from international labour standards discussed above, give rise to three main dimensions of lifelong learning and their different goals for individuals, enterprises and society. These three dimensions are education or schooling, the world of work and broader societal learning (see figure 1.2).
The first dimension acknowledges that a significant portion of lifelong learning occurs within various educational institutions – from early and basic education for children and adolescents to higher education and the university level. Typically, under the jurisdiction of national, state or regional governments, this dimension focuses on acquiring knowledge, forming social networks and developing cognitive and non-cognitive skills (starting from literacy and numeracy, and including the ability to learn as well as the development of socio-emotional skills) (for example, Deming 2022).
The second dimension, central to the ILO’s mission and activities, concerns learning with direct relevance for the world of work, whether work-based, in classroom or initiated by workers themselves. This dimension views learning as a gateway to decent working conditions and addresses the resilience of workers in the face of major transformative phenomena in contemporary labour markets, such as technological changes and shifts towards more environmentally sustainable economies. This learning supports workers and significantly benefits employers. Consequently, it should not be viewed as the sole responsibility of workers. As previously discussed, this type of learning aligns with employers’ demand for specific skills, leading to increased productivity and innovation and, ultimately, contributing to enhanced and sustainable economic growth and development. As such, the active involvement of both employers’ and workers’ organizations is key for devising and organizing learning offers that: (i) address the economic needs related to current skills demands; (ii) enhance workers’ personal fulfilment; and (iii) improve workers’ working conditions.
Reflecting the diversity of learning within the world of work, international labour standards refer to a range of work-related learning instruments. Some of these focus on facilitating labour market entry, including pre-employment training delivered through educational institutions. This area overlaps with the first dimension of the framework, illustrating the complementarities between dimensions.
Apprenticeships play a crucial role in facilitating workers’ initial entry into the labour market and remain relevant for older workers (ILO 2021d). The availability and organization of apprenticeships vary by country, resulting in different organizational structures. These include school-based systems, dual apprenticeships that combine classroom education in vocational schools with practical training in firms (Eichhorst et al. 2012, 2015), and informal apprenticeships that follow local norms and traditions (Hofmann et al. 2022; ILO 2021d). Those apprenticeships, where the learning component takes place within secondary schools, overlap directly with the framework’s first dimension, again showing that the different dimensions are interrelated.
Another form of learning within the world of work specifically aims to enhance the employment prospects of unemployed or underemployed workers. This type of training is typically organized as part of ALMPs, ideally in combination with social protection benefits (Asenjo, Escudero and Liepmann 2024; ILO 2016, 2024; Peyron Bista and Carter 2017). Additionally, the international labour standards discussed above cover various other forms of work-based learning, such as training provided by employers, self-initiated learning by workers and general learning through interactions in the workplace.
The third dimension explicitly highlights the societal aspects of learning, where collective interaction among individuals and enterprises activates potential and achieves outcomes that individual actors alone could not realize (ILO 2023b). Depending on the collaborative engagement of a sufficient number of actors, this societal dimension broadens the scope beyond the interests of individual workers or firms, including goals like active citizenship. Furthermore, it encompasses the development of professional and occupational identities, bridging personal fulfilment with the principles of decent work. These efforts aim to enhance social cohesion and reduce inequalities by promoting the participation of marginalized groups in societal processes. This type of learning is facilitated not only within educational institutions and the world of work – in this context, specifically through trade unions and workers’ organizations – but also through community work and family interactions. This again reflects the interrelatedness of all three dimensions.
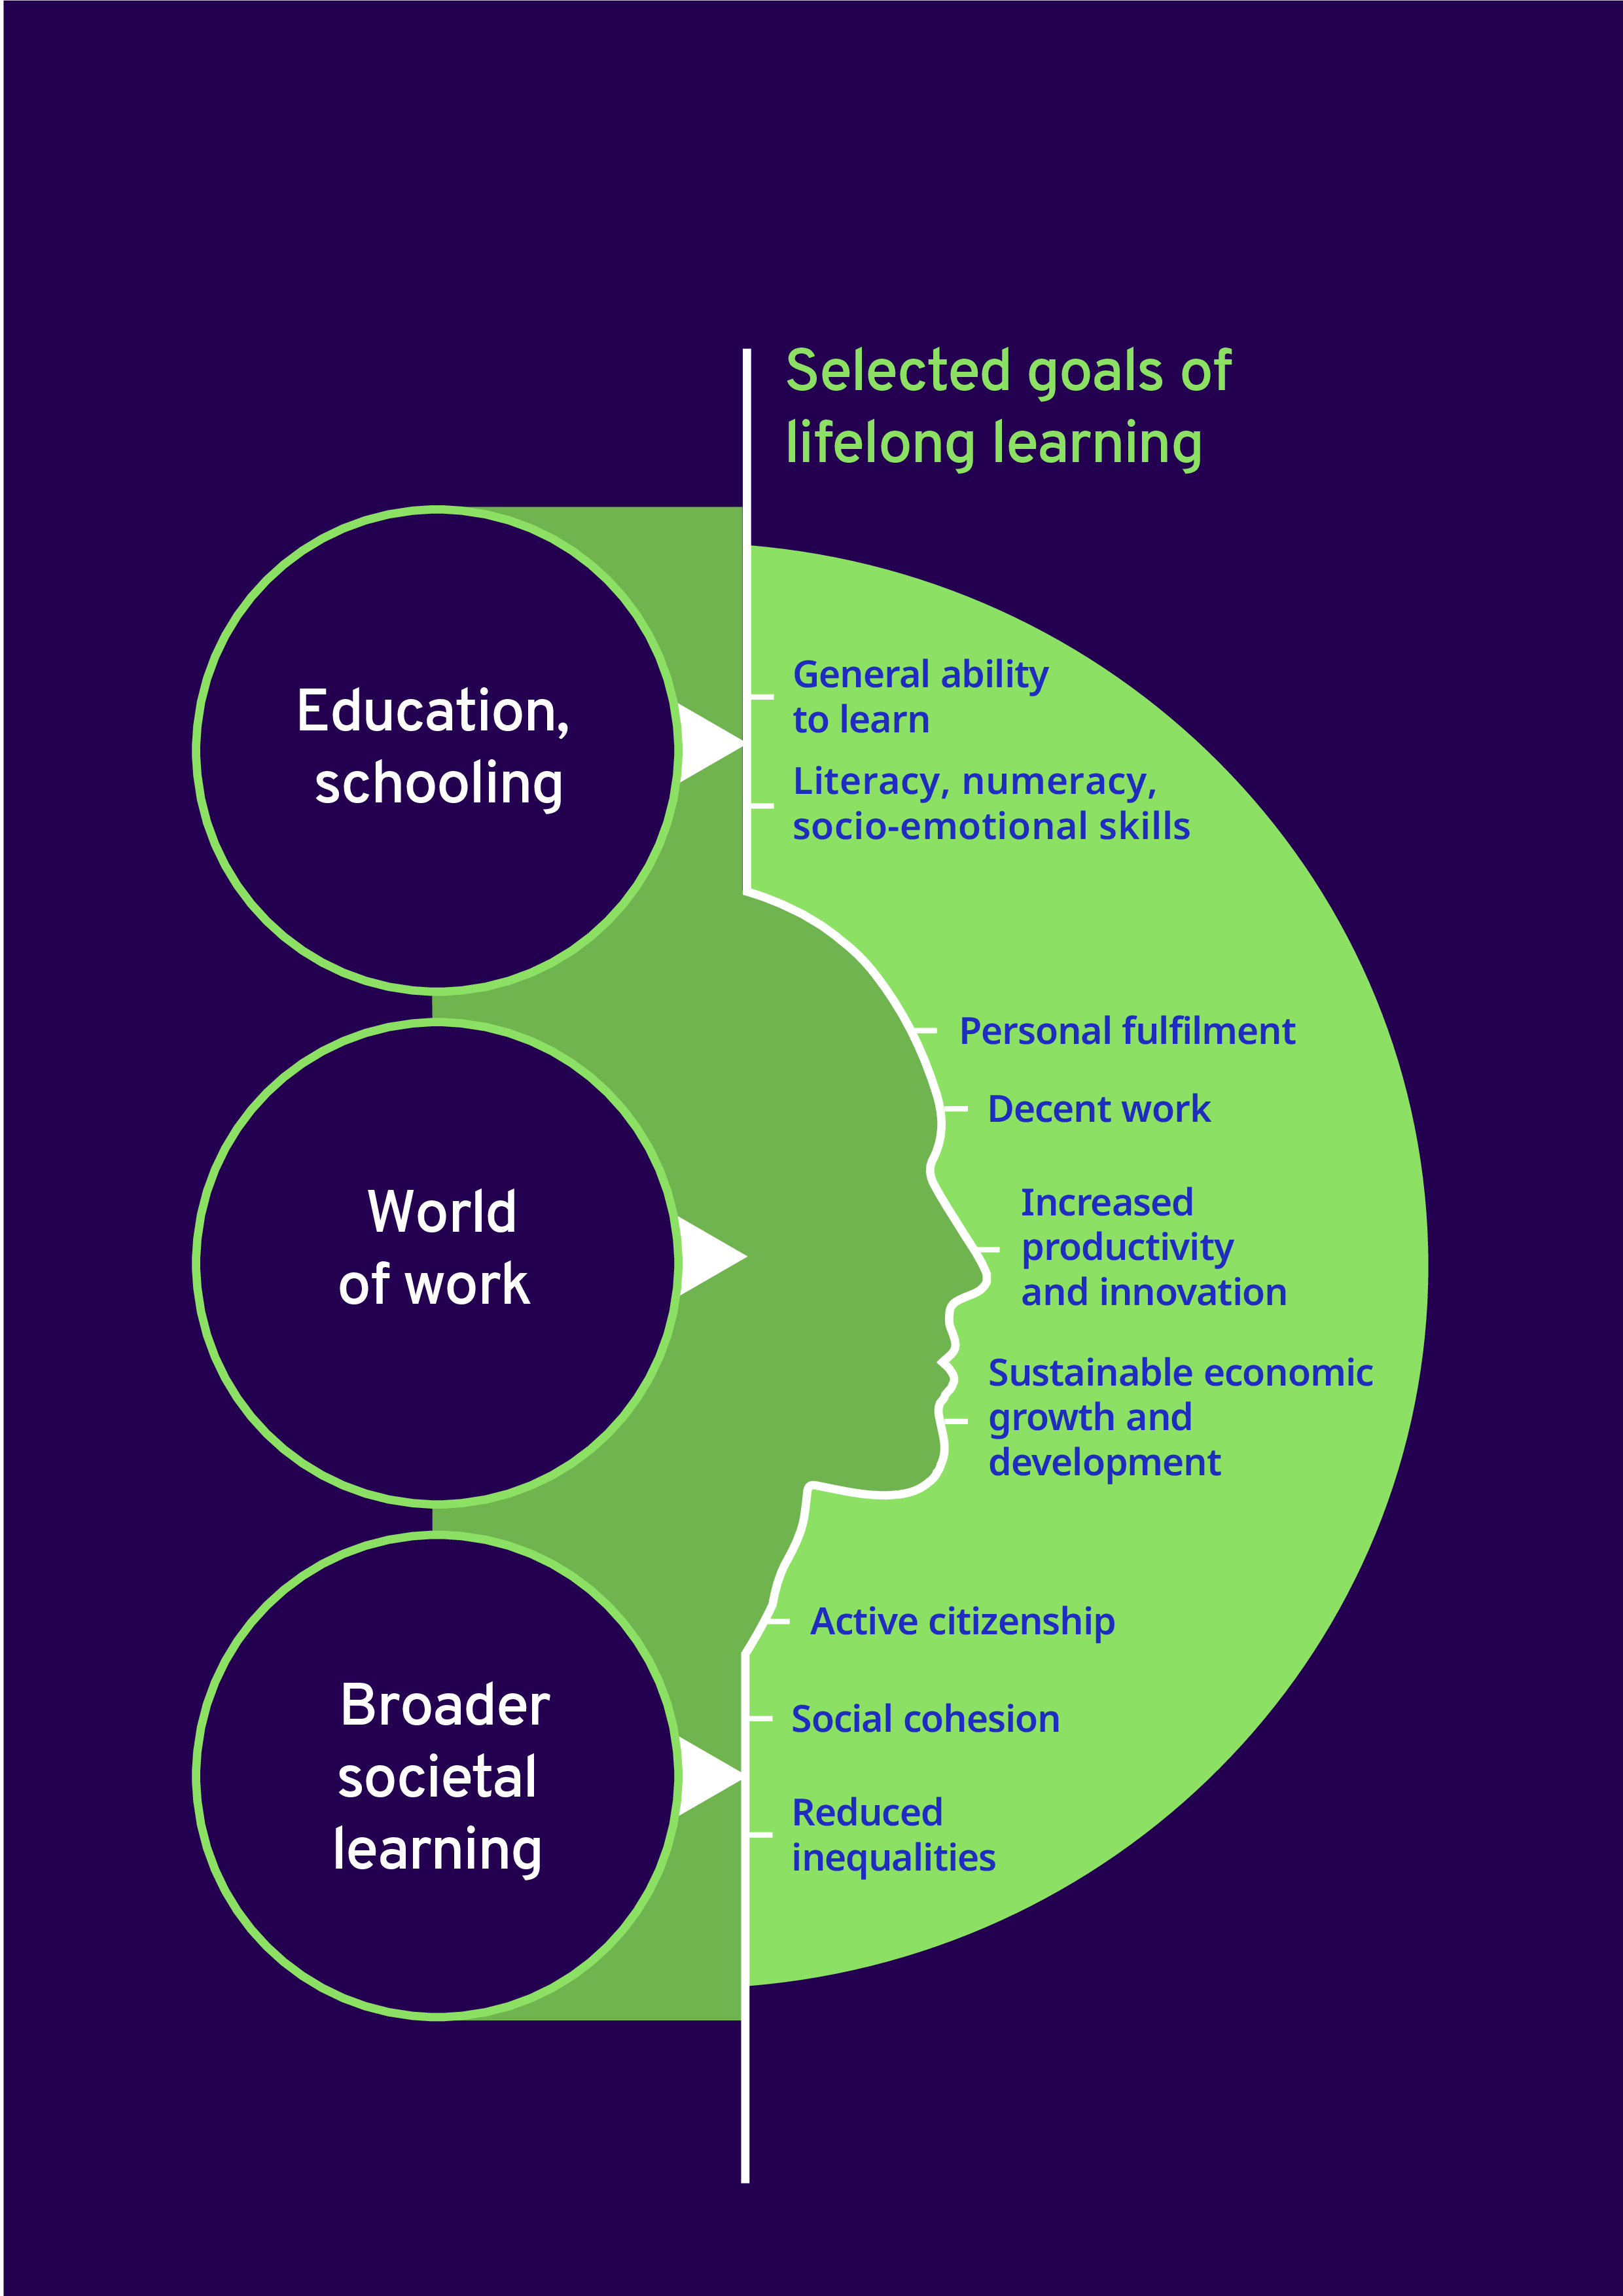
1.4.2. Lifelong learning as a system: Challenges and implementation
Building on the comprehensive conceptual framework outlined above, it is imperative to discuss lifelong learning within a systemic context. Realizing universal lifelong learning involves more than just providing individual opportunities – it requires a coordinated effort between policies, learning offers and support systems to create seamless learning pathways for individuals. This integrated system development is essential, as acknowledged by ILO constituents (ILO 2021b). Throughout this report, some of the policy issues that hold importance for system development are analysed.
The concept of skills and lifelong learning systems encompasses comprehensive frameworks designed to promote and support continuous learning opportunities throughout an individual’s life. These systems vary in their scope and sophistication. Essential elements of these systems include diverse education and training modalities (formal, informal and non-formal), support services (such as RPL,17 and financial and career development assistance) as well as governance arrangements and mechanisms (such as skills anticipation and quality assurance systems).18
Nonetheless, lifelong learning is seldom treated as a cohesive system. More often, it is associated with a collection of uncoordinated activities and programmes dispersed across multiple providers and regulated and managed by different policies and bodies (for example, ministries, professional associations, chambers, bipartite bodies, etc.). While a growing number of governments strive for greater coordination, they often face systemic fragmentation without a strategic vision and integrated policy approach (OECD 2024). For example, efforts like expanding apprenticeships, non-formal learning and systems for recognizing prior learning typically lack coordination (OECD and ILO 2017).
The lack of appropriate assessment of the existing situation and of effective governance frameworks that can drive coordination and capacity development efforts also hinder the achievement of desired outcomes. Effective implementation of lifelong learning programmes necessitates preliminary diagnosis. Such programmes should be governed by participative and decentralized governance mechanisms that provide adequate financing and quality assurance mechanisms to evaluate impacts. Often, the necessary flexibility is missing, and programmes fail to cater adequately to individual needs, treating learners as “problematic” whenever they do not fit defined beneficiary typologies or pose challenges to the regular development of prescribed actions, rather than offering suitable solutions (Bacchi 2009).
Additionally, education and training programmes risk failing to reach those who stand to benefit the most due to inadequate targeting, inflexible learning opportunities and lack of enabling measures (Carranza and McKenzie 2024; Kluve et al. 2019). This often results in the exclusion of vulnerable groups, such as youth, women, economically disadvantaged persons, ethnic minorities and isolated populations from learning opportunities (see also Chapter 2).
1.4.3. Diversity in the evolution of lifelong learning systems
Achieving higher levels of system development is not a linear process. National development across countries reveals typical system configurations that reflect distinct historical pathways and priorities at different stages of system maturity. The evolution of lifelong learning reveals a complex interplay of convergence and divergence within education and training systems worldwide. This complexity is rooted in traditional education practices, where informal and non-formal education, stemming from incidental learning through work activities and community participation, have historically formed the cornerstone of knowledge and skills development.
In contrast, as discussed in section 1.2.1, formal education, which originated in community-based schools often led by religious institutions, gradually evolved into state-led public schooling systems aimed at achieving basic literacy for all. Colonial legacies have further shaped these formal education systems, frequently reinforcing existing social hierarchies and perpetuating inequalities. Despite efforts following decolonization to expand access to formal education, informal and non-formal education continue to play a pivotal role in many societies due to their adaptability and universal accessibility.
Lifelong learning thus operates in a space that is only partially institutionalized. While formal education and TVET are framed within established institutional structures, enhancing their legitimacy and facilitating consistent public funding (Meyer and Rowan 1977),19 they often struggle to adapt to local needs and individual preferences, leading to mismatches between educational offer, market demands and individual needs. The concept of lifelong learning offers a flexible approach to addressing economic, societal, communitarian and individual needs, going beyond standardized education and training structures.
As such, the understanding and institutionalization of lifelong learning vary widely across countries. In some countries, lifelong learning is closely associated with adult education programmes provided by state-accredited institutions, which may include literacy courses, technical training and formal apprenticeships. In others, it emphasizes continuing training within enterprises, co-financed by training centres or flexible, short-term programmes that may not lead to formal certification. A broader scope encompassing a combination of these offers is what aligns best with the concept of lifelong learning as referred to in ILO standards.
Given the significant existence of the informal economy, integrating lifelong learning with work is essential (Naik 1975). This involves expanding non-formal learning programmes, offering part-time education and training, implementing distance learning and enhancing traditional apprenticeships to better meet the needs of diverse populations. Outreach efforts, RPL, career guidance and the use of various media channels, including digital platforms and radio, are essential for ensuring inclusive access to lifelong learning opportunities. Aligning social protection programmes for vulnerable groups with skills development and qualification pathways is paramount to enable individuals to participate when time and income constraints make engagement costly (ILO 2016, 2023c).
As systems evolve, priorities may shift. Many countries initially focus on expanding formal vocational training, especially in contexts where formal education structures are legacies from colonial administrations. This often entails public investments in initial training and the expansion of standards and regulations – such as qualifications, curricula, the professionalization of trainers, certification and accreditation. Over time, as economic and social realities change, targeted developments may take the form of either expanding institutionalized education or supporting existing non-formal education frameworks. Some countries may even choose to expand government-based training offers, while simultaneously incentivizing enterprise-based training.
Countries at different income levels may prioritize different aspects of system development. For instance, low-income countries might focus on expanding mass education programmes to address basic literacy challenges, developing RPL, facilitating transitions into the formal economy, upgrading traditional apprenticeships and empowering communities. Conversely, middle- to high-income countries might aim to enhance competitiveness and technological innovation, meet social demands and extend working lives. Key developments for effective intervention include establishing labour market information systems, developing sector-level strategies and providing individual financial incentives to enable tailored learning pathways.
Despite efforts to develop sophisticated system components in some areas, many countries may leave other aspects relatively underdeveloped. For example, while some countries may have diversified funding mechanisms, robust multi-stakeholder governance and comprehensive labour market intelligence, measures to ensure inclusivity may remain inadequate. Conversely, systems with well-developed qualification frameworks and trainer training systems might struggle to align formal training offers with industry needs. Few systems comprehensively address all these aspects to strategically achieve socio-economic goals.
Other structural features of the economy also shape how lifelong learning systems evolve. Factors – such as sectoral composition, enterprise size, work organization, the size of the informal labour market and the strength of labour market institutions – can all influence system priorities and capacities. For instance, strong regulatory frameworks enable more structured learning pathways, which are more easily implemented by larger, formal enterprises. Similarly, robust labour market institutions and effective industrial relations, supported by social dialogue, can contribute to the development of learning entitlements, encourage participation in training and facilitate the tailoring of learning activities to specific groups.
It is crucial to recognize that, while elements signifying system development can be identified – as discussed in the previous sections – there is no single linear, ideal process. The evolution of lifelong learning systems leads to distinct solutions that reflect particular contexts, challenges and heritages. This report acknowledges that policy dimensions vary significantly, underscoring the importance of adapting strategies to meet local needs and circumstances effectively.
1.5. Conclusion
Lifelong learning emerges as a dynamic and multifaceted concept, deeply intertwined with the socio-economic transformations that have shaped societies across various eras – from the Enlightenment and the Industrial Revolution to the digital era and today’s focus on sustainability. Its philosophical roots span cultures and traditions, consistently framing continuous education as essential for both individual fulfilment and the development of harmonious societies.
Nationally and internationally, various stakeholder groups have long recognized the potential of lifelong learning. The ILO has likewise emphasized its importance through international labour standards and policy frameworks. Lifelong learning is viewed not only as a means to enhance workers’ adaptability to changing labour markets, but also as a foundation for more equitable access to learning opportunities, inclusive growth and the empowerment of individuals and communities across the world of work.
Despite this growing interest in lifelong learning and skills development, there remains no universally accepted understanding of what lifelong learning entails. This chapter provides this definition and presents a conceptual framework for its implementation across different domains. Lifelong learning comprehensively encompasses all learning activities undertaken throughout life, individually or collectively, whether in educational, work, family or other social contexts. It emphasizes the development of knowledge, skills and attitudes or behaviours conducive to learning that respond to both individual and collective aspirations and needs, irrespective of formal certification outcomes. This broadened definition expands the scope of what constitutes learning beyond traditional educational paradigms and recognizes the value of informal and non-formal learning processes.
Building on this definition and grounded in international labour standards, this chapter introduces a conceptual framework that categorizes lifelong learning into three interrelated components: education and schooling, the world of work and broader societal learning. This framework supports a more holistic understanding of how lifelong learning operates across different layers of society and how it supports policy development and implementation more effectively across different contexts.
Taken together, the definition and framework position lifelong learning as a multidimensional and strategic priority. By offering a clear and implementable approach, they equip policymakers, educators, social partners and other stakeholders to build systems that support personal development, enhance enterprise productivity and promote inclusive and sustainable social progress.
2 TVET is understood as comprising education, training and skills development relating to a wide range of occupational fields, production, services and livelihoods. TVET, as part of lifelong learning, can take place at the secondary, post-secondary and tertiary levels. It includes work-based learning and continuing training and professional development which may lead to qualifications (ILO 2021a).
3 The traditional civil service examination system in Imperial China did not impose any age limits (Kai-Ming, Xinhuo and Xiaobo 1999; Zhang 2008).
4 Countries are designated as developed and developing in the historical part. However, the current report refers to high-, middle- and low-income countries, or low- and middle-income countries, for a more objective and tangible classification.
5 UNESCO, “Constitution”, https://www.unesco.org/en/legal-affairs/constitution.
6 UN, “Universal Declaration of Human Rights”, https://www.un.org/en/about-us/universal-declaration-of-human-rights.
7 Office of the UN High Commissioner for Human Rights, “International Covenant on Economic, Social and Cultural Rights”, https://www.ohchr.org/en/instruments-mechanisms/instruments/international-covenant-economic-social-and-cultural-rights.
8 UN, “News on Millenium Development Goals”, https://www.un.org/millenniumgoals/.
9 ILO, “ILO Constitution”, https://www.ilo.org/resource/other/ilo-constitution.
10 ILO, “Declaration of Philadelphia, Authentic text”, https://www.ilo.org/resource/declaration-philadelphia-authentic-text.
11 ILO, “ILO Centenary Declaration for the Future of Work”, https://www.ilo.org/resource/ilc/108/ilo-centenary-declaration-future-work.
12 “International labour standards are legal instruments drawn up by the ILO’s constituents (governments, employers and workers) setting out basic principles and rights at work. They are either Conventions (or Protocols), which are legally binding international treaties that can be ratified by member States, or Recommendations, which serve as non-binding guidelines” (ILO 2019a, 18).
13 ILO and UNESCO, “ILO–UNESCO Recommendation concerning the Status of Teachers, 1966”, https://www.ilo.org/ilo-unesco-recommendation-concerning-status-teachers-1966.
14 ILO, “Education is not a commodity: Teachers, the right to education and the future of work”, https://www.ilo.org/resource/conference-paper/education-not-commodity-teachers-right-education-and-future-work.
15 For a definition and discussion of skills and lifelong learning systems, see sections 1.4.2 and 1.4.3.
16 In this regard, the CEACR observed that Recommendation No. 195 emphasizes that education, training and lifelong learning are contributing factors to personal development, access to culture and active citizenship (ILO 2010, para. 124).
17 The term “recognition of prior learning” should be understood as in the Quality Apprenticeships Recommendation, 2023 (No. 208), as “a process, undertaken by qualified personnel, of identifying, documenting, assessing and certifying a person’s competencies, acquired through formal, non-formal or informal learning, based on established qualification standards”. Thus, recognition of prior learning “provides an opportunity for people to acquire qualifications or credits towards a qualification or exemptions (from all or part of the curriculum, or even exemption from an academic prerequisite for entering a formal study programme) without going through a formal education or training programme” (ILO 2018, 9).
18 Quality assurance encompasses processes and procedures for ensuring that qualifications, assessment and programme delivery meet certain standards (Tuck 2007).
19 Formal education adheres to standardized curricula and assessments processes supported by individual rights protection. Similarly, TVET, while not inherently rights-based, maintains a degree of standardization linked to certification and accreditation processes.
-
References
Abraham, Getahun Yacob. 2022. “Nkrumah’s and Nyerere’s Educational Visions – What Can Contemporary Africa Learn from Them?”. African Journal of Education and Practice 8 (1): 20–29. https://doi.org/10.47604/ajep.1470.
Alfonsi, Livia, Oriana Bandiera, Vittorio Bassi, Robin Burgess, Imran Rasul, Munshi Sulaiman and Anna Vitali. 2020. “Tackling Youth Unemployment: Evidence from a Labor Market Experiment in Uganda”. Econometrica 88 (6): 2369–2414. https://doi.org/10.3982/ECTA15959.
Asenjo, Antonia, Verónica Escudero and Hannah Liepmann. 2024. “Why Should We Integrate Income and Employment Support? A Conceptual and Empirical Investigation”. The Journal of Development Studies 60 (1): 1–29. https://doi.org/10.1080/00220388.2023.2246621.
Bacchi, Carol. 2009. Analysing Policy: What’s the Problem Represented to Be? Frenchs Forest, Australia: Pearson.
Backhaus, Teresa. 2023. “Training in Late Careers: A Structural Approach”. IZA Discussion Paper No. 15875. Institute of Labor Economics. https://ssrn.com/abstract=4331401.
Balakrishnan, Rajiv. 2002. “Adult Education in India – Policy & Perspectives”. Social Change 32 (3–4): 181–194. https://doi.org/10.1177/004908570203200410.
Bourdieu, Pierre, and Jean-Claude Passeron. 1970. Reproduction in Education, Society and Culture. London: Sage. [English translation published in 1977].
Bozionelos, Nikos, Cai-Hui Lin and Kin Yi Lee. 2020. “Enhancing the Sustainability of Employees’ Careers through Training: The Roles of Career Actors’ Openness and of Supervisor Support”. Journal of Vocational Behavior 117: 103333. https://doi.org/10.1016/j.jvb.2019.103333.
Brehm, Johannes, Angela Doku and Verónica Escudero. 2023. “What Has Been Driving Work-to-Work Transitions in the Emerging World? A Comparative Study of Indonesia and South Africa”. ILO Working Paper No. 89. https://doi.org/10.54394/ZABU6787.
Carranza, Eliana, and David McKenzie. 2024. “Job Training and Job Search Assistance Policies in Developing Countries”. Journal of Economic Perspectives 38 (1): 221–244. https://doi.org/10.1257/jep.38.1.221.
Cedefop (European Centre for the Development of Vocational Training). 2014. Terminology of European Education and Training Policy: A Selection of 130 Key Terms. Second edition. https://www.cedefop.europa.eu/files/4117_en.pdf.
———. 2018. Insights into Skill Shortages and Skill Mismatch: Learning from Cedefop’s European Skills and Jobs Survey. Cedefop Reference Series, 106. https://data.europa.eu/doi/10.2801/645011.
———. 2021. More Perceptions: Opinion Survey on Adult Learning and Continuing Vocational Education and Training in Europe – Volume 2: Views of Adults in Europe. Cedefop Reference Series, 119. http://data.europa.eu/doi/10.2801/55767.
———. 2022. Setting Europe on Course for a Human Digital Transition: New Evidence from Cedefop’s Second European Skills and Jobs Survey. Cedefop Reference Series, 123. http://data.europa.eu/doi/10.2801/253954.
Cooke, Anthony, and Ann MacSween, eds. 2000. The Rise and Fall of Adult Education Institutions and Social Movements: The Proceedings of the International Conference on the History of Adult Education. Studies in Pedagogy, Andragogy, and Gerontagogy No. 47. Berlin, Germany: Peter Lang Verlag.
Cortright, Richard W. 1966. “Adult Basic Education in Latin America”. International Review of Education 12 (2): 176–183. https://doi.org/10.1007/BF01416213.
Council of Europe. 1973. Permanent Education: The Basis and Essentials. New York: Manhattan Publishing. https://eric.ed.gov/?id=ED087671.
Delors, Jacques. 1996. Learning: The Treasure Within; Report to UNESCO of the International Commission on Education for the Twenty-First Century (Highlights). UNESCO. https://unesdoc.unesco.org/ark:/48223/pf0000109590.
Deming, David J. 2022. “Four Facts about Human Capital”. Journal of Economic Perspectives 36 (3): 75–102. https://doi.org/10.1257/jep.36.3.75.
Eichhorst, Werner, Núria Rodríguez-Planas, Ricarda Schmidl and Klaus F. Zimmermann. 2012. “A Roadmap to Vocational Education and Training Systems Around the World”. IZA Discussion Paper No. 7110. Institute of Labor Economics. https://ftp.iza.org/dp7110.pdf.
———. 2015. “A Road Map to Vocational Education and Training in Industrialized Countries”. ILR Review 68 (2): 314–337. https://doi.org/10.1177/0019793914564963.
Elfert, Maren. 2015. “UNESCO, the Faure Report, the Delors Report, and the Political Utopia of Lifelong Learning”. European Journal of Education 50 (1): 88–100. https://doi.org/10.1111/ejed.12104.
———. 2019. “Lifelong Learning in Sustainable Development Goal 4: What Does It Mean for UNESCO’s Rights-Based Approach to Adult Learning and Education?”. International Review of Education 65 (4): 537–556. https://doi.org/10.1007/s11159-019-09788-z.
Elfert, Maren, and Alexandra Draxler. 2022. “The Faure Report: 50 Years on – Editorial Introduction”. International Review of Education 68 (5): 637–654. https://doi.org/10.1007/s11159-022-09981-7.
European Commission. 2016. A New Skills Agenda for Europe: Working Together to Strengthen Human Capital, Employability and Competitiveness. https://eur-lex.europa.eu/legal-content/EN/TXT/?uri=CELEX%3A52016DC0381.
———. 2020. European Skills Agenda for Sustainable Competitiveness, Social Fairness and Resilience. https://eur-lex.europa.eu/legal-content/EN/TXT/?uri=celex:52020DC0274.
Faure, Edgar, Felipe Herrera, Abdul-Razzak Kaddoura, Henri Lopes, Arthur V. Petrovsky, Majid Rahnema and Frederick Champion Ward. 1972. Learning to Be: The World of Education Today and Tomorrow. Sixth edition. UNESCO. https://unesdoc.unesco.org/ark:/48223/pf0000001801.
Field, John. 2001. “Lifelong Education”. International Journal of Lifelong Education 20 (1–2): 3–15. https://doi.org/10.1080/09638280010008291.
Fieldhouse, Roger. 1996. A History of Modern British Adult Education. Leicester, UK: National Institute of Adult Continuing Education.
Fordjor, Peter, Agnes Kotoh, Kwame Kumah Kpeli, Albert Kwamefio, Quarm Bernard Mensa, Esther Owusu and Barbara K. Mullins. 2003. “A Review of Traditional Ghanaian and Western Philosophies of Adult Education”. International Journal of Lifelong Education 22 (2): 182–199. https://doi.org/10.1080/0260137032000055321.
Guigui, Albert. 1972. The Contribution of the ILO to Workers Education 1919–1970. ILO. https://labordoc.ilo.org/discovery/fulldisplay/alma991460853402676/41ILO_INST:41ILO_V2.
Hake, Barry J., Bastiaan van Gent and József Katus, eds. 2004. Adult Education and Globalisation: Past and Present – The Proceedings of the 9th International Conference on the History of Adult Education. Studies in Pedagogy, Andragogy, and Gerontagogy No. 57. Berlin, Germany: Peter Lang Verlag. https://www.peterlang.com/document/1098069.
Hake, Barry J., and Françoise F. Laot, eds. 2009. The Social Question and Adult Education – La Question Sociale et l’Education des Adultes. Frankfurt, Germany: Peter Lang. https://www.peterlang.com/document/1106448.
Hawley-Woodall, Jo. 2019. European Inventory on Validation of Non-Formal and Informal Learning 2018 Update. Thematic Report: Bridging the Gap: Validation Creating Routes and Links between Sectors. Cedefop. https://cumulus.cedefop.europa.eu/files/vetelib/2019/european_inventory_validation_2018_bridging_gap.pdf.
Herbaut, Estelle, and Koen Geven. 2020. “What Works to Reduce Inequalities in Higher Education? A Systematic Review of the (Quasi-)Experimental Literature on Outreach and Financial Aid”. Research in Social Stratification and Mobility 65: 100442. https://doi.org/10.1016/j.rssm.2019.100442.
Hofmann, Christine, Markéta Zelenka, Boubakar Savadogo and Wendy Lynn Akinyi Okolo. 2022. “How to Strengthen Informal Apprenticeship Systems for a Better Future of Work? Lessons Learned from Comparative Analysis of Country Cases”. ILO Working Paper No. 49. https://doi.org/10.54394/WJEK5468.
Hötte, Kerstin, Melline Somers and Angelos Theodorakopoulos. 2023. “Technology and Jobs: A Systematic Literature Review”. Technological Forecasting and Social Change 194: 122750. https://doi.org/10.1016/j.techfore.2023.122750.
ILO. 1939. Technical and Vocational Education and Apprenticeship. Report I. International Labour Conference. 25th Session. http://www.ilo.org/public/libdoc/ilo/1939/39B09_8_engl.pdf.
———. 1949. “The I.L.O. Manpower Programme”. International Labour Review 59 (4): 367–393. https://labordoc.ilo.org/permalink/41ILO_INST/eqc11n/alma995165600502676.
———. 1991. Report of the Committee of Experts on the Application of Conventions and Recommendations. Report III (Part 4B). International Labour Conference. 78th Session. https://libguides.ilo.org/conference/76-80#78th.
———. 1998. World Employment Report 1998–99: Employability in the Global Economy – How Training Matters. https://labordoc.ilo.org/permalink/41ILO_INST/j3q9on/alma993305523402676.
———. 1999. Report of the Director General: Decent Work. International Labour Conference. 87th Session. https://libguides.ilo.org/conference/86-90#87th.
———. 2010. Report of the Committee of Experts on the Application of Conventions and Recommendations. Report III (Part B). International Labour Conference. 99th Session. https://libguides.ilo.org/conference/96-100#99th.
———. 2016. What Works: Active Labour Market Policies in Latin America and the Caribbean. https://labordoc.ilo.org/permalink/41ILO_INST/j3q9on/alma994987689902676.
———. 2018. Recognition of Prior Learning (RPL): Learning Package. https://researchrepository.ilo.org/esploro/outputs/995218726802676.
———. 2019a. Rules of the Game: An Introduction to the Standards-Related Work of the International Labour Organization. https://researchrepository.ilo.org/esploro/outputs/995219491502676.
———. 2019b. Work for a Brighter Future: Global Commission on the Future of Work. https://researchrepository.ilo.org/esploro/outputs/995271389102676.
———. 2020. Report of the Committee of Experts on the Application of Conventions and Recommendations. ILC.109/III(B). https://www.ilo.org/resource/conference-paper/ilc/109/promoting-employment-and-decent-work-changing-landscape.
———. 2021a. “Glossary of Skills and Labour Migration”. https://www.ilo.org/resource/glossary-skills-and-labour-migration.
———. 2021b. Resolution concerning skills and lifelong learning. International Labour Conference. 109th Session. https://www.ilo.org/resource/ilc/109/resolution-concerning-concerning-skills-and-lifelong-learning.
———. 2021c. Changing Demand for Skills in Digital Economies and Societies: Literature Review and Case Studies from Low- and Middle-Income Countries. https://researchrepository.ilo.org/esploro/outputs/995219272702676.
———. 2021d. A Framework for Quality Apprenticeships. ILC.110/IV/1. https://labordoc.ilo.org/discovery/delivery/41ILO_INST:41ILO_V2/1286136450002676.
———. 2023a. The ILO Strategy on Skills and Lifelong Learning 2030. https://researchrepository.ilo.org/esploro/outputs/995319472602676.
———. 2023b. Transformative Change and SDG 8: The Critical Role of Collective Capabilities and Societal Learning. https://doi.org/10.54394/HKDP3268.
———. 2023c. “Aligning Skills Development and National Social Protection Systems”. Discussion Paper. https://researchrepository.ilo.org/esploro/outputs/995340190902676.
———. 2024. World Social Protection Report 2024–26: Universal Social Protection for Climate Action and a Just Transition. https://doi.org/10.54394/ZMDK5543.
Indabawa, Sabo A., Akpovire Oduaran, Tai Afrik and Shirley Walters, eds. 2000. The State of Adult and Continuing Education in Africa. Department of Adult and Nonformal Education, Faculty of Education, University of Namibia. https://eric.ed.gov/?id=ED453359.
Jara, Oscar H. 2010. “Popular Education and Social Change in Latin America”. Community Development Journal 45 (3): 287–296. https://doi.org/10.1093/cdj/bsq022.
Kai-Ming, Cheng, Jin Xinhuo and Gu Xiaobo. 1999. “From Training to Education. Lifelong Learning in China”. Comparative Education 35 (2): 119–129. https://doi.org/10.1080/03050069927928.
Kallen, Denis. 1996. “Lifelong-Learning in Retrospect”. European Journal of Vocational Training 8/9 (3): 16–22. https://www.cedefop.europa.eu/en/publications/8-91996.
Kallen, Denis, and Jarl Bengtsson. 1973. Recurrent Education: A Strategy for Lifelong Learning. OECD. https://eric.ed.gov/?id=ED083365.
Kluve, Jochen, Susana Puerto, David Robalino, Jose M. Romero, Friederike Rother, Jonathan Stöterau, Felix Weidenkaff and Marc Witte. 2019. “Do Youth Employment Programs Improve Labor Market Outcomes? A Quantitative Review”. World Development 114: 237–253. https://doi.org/10.1016/j.worlddev.2018.10.004.
Kumar, Krishna. 2016. Politics of Education in Colonial India. First edition. London: Routledge.
Laot, Françoise F. 2013. “Collective Dimensions in Lifelong Education and Learning: Political and Pedagogical Reflections”. In Challenging the ’European Area of Lifelong Learning’: A Critical Response, Lifelong Learning Book Series vol. 19, edited by George K. Zarifis and Maria N. Gravani, 285–297. Dordrecht, Netherlands: Springer. https://doi.org/10.1007/978-94-007-7299-1_25.
Lembré, Stéphane. 2020. “Des travaux et des cours: Industrialisation et enseignement industriel en Europe occidentale des années 1830 aux années 1930”. Artefact. Techniques, histoire et sciences humaines 13: 335–359. https://doi.org/10.4000/artefact.6882.
Lindeman, Eduard C. 1926. The Meaning of Adult Education. New York: New Republic. http://archive.org/details/meaningofadulted00lind.
Mallick, Lingaraj, Pradeep Kumar Das and Kalandi Charan Pradhan. 2016. “Impact of Educational Expenditure on Economic Growth in Major Asian Countries: Evidence from Econometric Analysis”. Theoretical and Applied Economics XXIII (2(607)): 173–186. https://www.ectap.ro/impact-of-educational-expenditure-on-economic-growthin-major-asian-countries-evidence-from-econometric-analysis-lingaraj-mallick_pradeep-kumar-das_kalandi-charan-pradhan/a1190/.
Mandal, Sayantan. 2019. “The Rise of Lifelong Learning and Fall of Adult Education in India”. London Review of Education 17 (3): 318–330. https://doi.org/10.18546/LRE.17.3.08.
Matasci, Damiano, Miguel Bandeira Jerónimo and Hugo Gonçalves Dores. 2020. “Introduction: Historical Trajectories of Education and Development in (Post)Colonial Africa”. In Education and Development in Colonial and Postcolonial Africa: Policies, Paradigms, and Entanglements, 1890s–1980s, edited by Damiano Matasci, Miguel Bandeira Jerónimo and Hugo Gonçalves Dores, 1–28. Cham, Switzerland: Palgrave Macmillan. https://doi.org/10.1007/978-3-030-27801-4.
Medel-Añonuevo, Carolyn, Toshio Ohsako and Werner Mauch. 2001. “Revisiting Lifelong Learning for the Twenty-First Century”. https://unesdoc.unesco.org/ark:/48223/pf0000127667.
Merrill, Michael, and Susan J. Schurman. 2016. “Toward a General Theory and Global History of Workers’ Education”. International Labor and Working-Class History 90: 5–11. https://doi.org/10.1017/S0147547916000259.
Meyer, John W., and Brian Rowan. 1977. “Institutionalized Organizations: Formal Structure as Myth and Ceremony”. American Journal of Sociology 83 (2): 340–363. https://doi.org/10.1086/226550.
Nafukho, Fredrick, Maurice Amutabi and Ruth Otunga. 2005. “Foundations of Adult Education in Africa”. African Perspectives on Adult Learning. UNESCO Institute for Education. https://unesdoc.unesco.org/ark:/48223/pf0000141340.
Naik, Jayant Pandurang. 1975. Policy and Performance in Indian Education (1947–74). New Delhi, India; Dr K.G. Saiyidain Memorial Trust. https://www.arvindguptatoys.com/arvindgupta/JPNaik_02.pdf.
OECD (Organisation for Economic Co-operation and Development). 1996. Lifelong Learning for All: Meeting of the Education Committee at Ministerial Level, 16–17 January 1996. https://hdl.voced.edu.au/10707/97779.
———. 2024. Co-ordinating Adult Learning Policies: Mechanisms for Inter-Institutional and Stakeholder Co-ordination. https://www.oecd.org/en/publications/co-ordinating-adult-learning-policies_725d9938-en.html.
———. 2025. Trends in Adult Learning: New Data from the 2023 Survey of Adult Skills, Getting Skills Right. https://doi.org/10.1787/ec0624a6-en.
OECD and ILO. 2017. Engaging Employers in Apprenticeship Opportunities: Making It Happen Locally. https://doi.org/10.1787/9789264266681-en.
Olbrich, Josef. 2001. Geschichte der Erwachsenenbildung in Deutschland. Wiesbaden, Germany: VS Verlag für Sozialwissenschaften. https://doi.org/10.1007/978-3-322-95032-1.
Peyron Bista, Céline, and John Carter. 2017. Unemployment Protection: A Good Practices Guide and Training Package. ILO. https://researchrepository.ilo.org/esploro/outputs/995219047702676.
Phale, Koketso, Fanglin Li, Isaac Adjei Mensah, Akoto Yaw Omari-Sasu and Mohammed Musah. 2021. “Knowledge-Based Economy Capacity Building for Developing Countries: A Panel Analysis in Southern African Development Community”. Sustainability 13 (5): 2890. https://doi.org/10.3390/su13052890.
Picchio, Matteo, and Jan C. van Ours. 2013. “Retaining through Training Even for Older Workers”. Economics of Education Review 32: 29–48. https://doi.org/10.1016/j.econedurev.2012.08.004.
Poignant, Raymond. 1970. “Educational Development in Developing Countries during the First UN Development Decade: A Critical Evaluation of International Aid to Education”. The Fundamentals of Educational Planning: Lecture – Discussion Series, No. 52. https://unesdoc.unesco.org/ark:/48223/pf0000074936.
Preece, Julia. 2009. “Lifelong Learning and Development: A Perspective from the ‘South’”. Compare: A Journal of Comparative and International Education 39 (5): 585–599. https://doi.org/10.1080/03057920903125602.
Rama, Germán W., and Juan Carlos Tedesco. 1980. “Education and Development in Latin America, 1950–1975”. UNDP; ECLA. https://unesdoc.unesco.org/ark:/48223/pf0000040880.
Rawkins, Christa. 2018. A Global Overview of TVET Teaching and Training: Current Issues, Trends and Recommendations. Joint ILO–UNESCO Committee of Experts on the Application of the Recommendations concerning Teaching Personnel (CEART). CEART/13/2018/8. https://www.ilo.org/resource/conference-paper/global-overview-tvet-teaching-and-training-current-issues-trends-and.
Reinders, Simone, Marleen Dekker and Jean-Benoît Falisse. 2021. “Inequalities in Higher Education in Low- and Middle-Income Countries: A Scoping Review of the Literature”. Development Policy Review 39 (5): 865–889. https://doi.org/10.1111/dpr.12535.
Sitzmann, Traci, Kurt Kraiger, David Stewart and Robert Wisher. 2006. “The Comparative Effectiveness of Web-Based and Classroom Instruction: A Meta-Analysis”. Personnel Psychology 59 (3): 623–664. https://doi.org/10.1111/j.1744-6570.2006.00049.x.
The Centenary Commission on Adult Education. 2019. “A Permanent National Necessity...”: Adult Education and Lifelong Learning for 21st Century Britain. https://doi.org/10.17639/nott.7027.
Tuck, Ron. 2007. An Introductory Guide to National Qualifications Frameworks: Conceptual and Practical Issues for Policy Makers. ILO. https://www.oitcinterfor.org/en/node/7328.
Ugur, Mehmet, and Arup Mitra. 2017. “Technology Adoption and Employment in Less Developed Countries: A Mixed-Method Systematic Review”. World Development 96: 1–18. https://doi.org/10.1016/j.worlddev.2017.03.015.
UIL (UNESCO Institute for Lifelong Learning). 2012. UNESCO Guidelines for the Recognition, Validation and Accreditation of the Outcomes of Non-Formal and Informal Learning. https://unesdoc.unesco.org/ark:/48223/pf0000216360.
———. 2020. Embracing a Culture of Lifelong Learning: Contribution to the Futures of Education Initiative – Report: A Transdisciplinary Expert Consultation. https://unesdoc.unesco.org/ark:/48223/pf0000374112.
UN (United Nations). 1999. Implementation of the International Covenant on Economic, Social and Cultural Rights. E/C.12/1999/10. https://digitallibrary.un.org/record/407275.
———. n.d. “Sustainable Development Goals: 4 Quality Education”. https://www.un.org/sustainabledevelopment/education/.
UNESCO (United Nations Educational, Scientific and Cultural Organization). 2021a. Reimagining Our Futures Together: A New Social Contract for Education. https://doi.org/10.54675/ASRB4722.
———. 2021b. Global education Monitoring Report, 2021/2: Non-State Actors in Education – Who Chooses? Who Loses? https://doi.org/10.54676/XJFS2343.
UNESCO, ECLA (Economic Commission for Latin America) and UNDP (United Nations Development Programme). 1981. Desarrollo y educación en América Latina. Informes finales, No. 4. https://unesdoc.unesco.org/ark:/48223/pf0000050389.
UNESCO and ILO. 2018. Taking a Whole of Government Approach to Skills Development. https://www.ilo.org/publications/taking-whole-government-approach-skills-development.
Vermeire, Eva, Nele De Cuyper and Eva Kyndt. 2022. “Preparing Students for the School-to-Work Transition: A Systematic Review of Research on Secondary School-Based Vocational Education”. In Research Approaches on Workplace Learning: Insights from a Growing Field, Professional and Practice-Based Learning, vol. 31, edited by Christian Harteis, David Gijbels and Eva Kyndt, 367–398. Cham, Switzerland: Springer. https://doi.org/10.1007/978-3-030-89582-2_17.
Volles, Nina. 2016. “Lifelong Learning in the EU: Changing Conceptualisations, Actors, and Policies”. Studies in Higher Education 41 (2): 343–363. https://doi.org/10.1080/03075079.2014.927852.
Wallenborn, Manfred. 2001. “Vocational Training in Latin America”. European Journal of Vocational Training 22: 55–62. https://www.cedefop.europa.eu/en/publications/222001.
Wang, Xiaoxuan, and Jinrong Liu. 2022. “Chinese Universities’ Experience of Social Education, 1912–1949”. Humanities and Social Sciences Communications 9 (1): 346. https://doi.org/10.1057/s41599-022-01366-3.
Wiltshire, Harold, John Taylor and Bernard Jennings. 1980. The 1919 Report: The Final and Interim Reports of the Adult Education Committee of the Ministry of Reconstruction, 1918–1919. Department of Adult Education. https://unesdoc.unesco.org/ark:/48223/pf0000202882.
Wu, Shu-Pan. 1930. “The Development of Adult Education in China”. The Elementary School Journal 31 (1): 61–66.
Wu, Zunmin. 2020. “China’s Experiences in Developing Lifelong Education, 1978–2017”. ECNU Review of Education 4 (4): 857–872. https://doi.org/10.1177/2096531120953959.
Yeaxlee, Basil A. 1929. Lifelong Education. London: Cassel and Company. http://archive.org/details/in.ernet.dli.2015.224059.
Zajda, Joseph. 2003. “Lifelong Learning and Adult Education: Russia Meets the West”. International Review of Education 49: 111–132. https://doi.org/10.1023/A:1022922006270.
Zhang, Weiyuan. 2008. “Conceptions of Lifelong Learning in Confucian Culture: Their Impact on Adult Learners”. International Journal of Lifelong Education 27 (5): 551–557. https://doi.org/10.1080/02601370802051561.
Zimmermann, Klaus F., Costanza Biavaschi, Werner Eichhorst, Corrado Giulietti, Michael J. Kendzia, Alexander Muravyev, Janneke Pieters, Núria Rodríguez-Planas and Ricarda Schmidl. 2013. “Youth Unemployment and Vocational Training”. Foundations and Trends® in Microeconomics 9 (1–2): 1–157. https://doi.org/10.1561/0700000058.
2.1. Introduction
As discussed in Chapter 1, lifelong learning and skills development are key policy objectives, crucial for enhancing the adaptability of workers and firms to dynamic labour market conditions. Accurately measuring the state of lifelong learning across countries is essential to ensure these objectives are met. Reliable data help identify the beneficiaries, where the gaps lie and how best to address them. Data also support the design of evidence-based policies and strategies, ensuring that resources are allocated efficiently and interventions are tailored to specific national needs. However, as this chapter will show, the availability of comprehensive and comparable data remains limited, particularly in low- and middle-income countries.
This chapter, as part of Part 1 of the report, undertakes a critical task: to explore how lifelong learning is taking shape globally across its three core dimensions – education and schooling, the world of work and broader societal learning – as outlined in Chapter 1. In doing so, it seeks to answer two key questions:
-
What is the current state of lifelong learning across these dimensions?
-
How can existing data gaps – particularly in the context of the world of work and in low- and middle-income countries – be addressed to better support inclusive, evidence-based policymaking?
This chapter builds on prior methodologies, such as the EU’s European Lifelong Learning Indicators Index and Canada’s Composite Learning Index, which provided early insights into measuring lifelong learning, but have since been discontinued. In line with these earlier indicators, this chapter aims to offer a comprehensive perspective on various dimensions of lifelong learning, while extending the focus beyond high-income countries.
To achieve this, this chapter undertakes an extensive mapping to identify globally comparable indicators that capture lifelong learning’s multifaceted nature. This process involves selecting indicators based on their availability across countries from various income groups and their ability to capture different types of learning. The sources for these indicators include SDG data as collected by different UN agencies, the World Bank’s World Development Indicators, the OECD’s Programme for the International Assessment of Adult Competencies (PIAAC), the World Values Survey and the ILO Harmonized Microdata Collection (ILOSTAT). Data for the most recent available year are used to maximize country coverage and provide a current snapshot. The analysis also categorizes countries by income level and, where relevant, by geographical region, to offer diverse perspectives. In doing so, it seeks to highlight how specific contexts and individual or employment characteristics may influence access to learning opportunities and their outcomes.
While the analysis of this extensive mapping provides novel insights on the three dimensions of lifelong learning, it also reveals significant gaps. Existing indicators are inadequate to fully capture the nuances of lifelong learning, particularly in low- and middle-income countries, and especially in relation to learning at work. Many indicators fail to distinguish between formal, non-formal and informal learning modalities (see box 1.1 for definitions).20 Even when they do, information on the content, scope and reach of non-formal learning is limited, and data on informal learning are almost non-existent. Moreover, data are scarce on beneficiaries’ characteristics, their motivations and barriers, and their perceptions of the usefulness of these activities – all critical elements for designing inclusive, targeted policies.
To help address these gaps, the ILO conducted individual-level surveys in three middle-income countries from different regions (Bangladesh, Fiji and the United Republic of Tanzania), selected to represent both lower- and upper-middle-income countries (see box 2.2 for an overview of surveys methodology).21 These countries were also chosen for their demonstrated commitment to improving lifelong learning in national programmes and the availability of relevant labour market data. These surveys introduce innovative questions to cover underexplored dimensions of lifelong learning. These include distinctions between formal, non-formal and informal learning; information on detailed course content and duration; training providers and certifications obtained; usefulness of learning activities, including their contribution to reskilling and upskilling; specific learning needs of individuals; incentives they receive; and barriers they face, among other factors.
In addition, the surveys include questions aligned with national labour force surveys (LFS), capturing details, such as employment status, wages, contract type and business registration status. This integration enables analysis on the relationship between learning activities and labour market outcomes, including for informal workers.22 By combining existing statistical indicators with the newly gathered data, the chapter provides a more complete picture of the state of lifelong learning that reflects its multifaceted definition. Findings from the ILO surveys are interwoven throughout the chapter to complement existing data and address identified gaps. The survey questionnaire and data are also a useful tool for public institutions, policymakers and researchers. Going forward, the survey could be leveraged to collect data on lifelong learning in other countries or over time to track progress and inform future strategies.
This chapter is structured around the three dimensions of lifelong learning. Section 2.2 focuses on education and schooling, analysing investment in education, educational outcomes and the extent of exclusion from education opportunities. Section 2.3 turns to the world of work – the ILO’s main area of concern – where data gaps are most significant. This section begins with an overview of learning participation by different population groups (working-age individuals and workers in formal firms) to identify possible disparities, and examines formal, non-formal and informal learning activities, drawing on insights from ILO lifelong learning surveys. The analysis identifies significant gaps in access to learning in the world of work, which provides a motivation for focusing on it in Part 2. It also highlights the vital role of employers’ and workers’ organizations in promoting lifelong learning. Section 2.4 explores broader societal learning, including collective learning and engagement of citizens in voluntary organizations. Section 2.5 concludes by identifying the learning gaps that must be addressed to enable individuals to reach their full potential and improve their outcomes in the world of work.
2.2. Lifelong learning in education
Formal education, or schooling, is an individual’s first formal experience of lifelong learning. It is the phase where the building blocks required for advanced learning are established (including literacy and numeracy) and where a passion for continued learning may be cultivated. Success in the educational realm depends on several factors – in particular, the amount and quality of resources invested by countries. Greater financial resources can ensure student access to basic school infrastructure, such as sanitation and water, as well as other resources, such as computers and the internet. Sufficient funding is also important to train, attract and retain qualified teachers, thereby enhancing the overall quality of education.
These resources, if appropriately invested, yield positive outcomes (Psacharopoulos and Patrinos 2018). The outcomes of lifelong learning in the world of education refer to educational attainment and achievement, such as reading proficiency or tertiary enrolment. However, if large proportions of children either are excluded from attending school or drop out of school, the societal and economic gains from lifelong learning diminish. The greater the magnitude of exclusion, the greater the associated losses. This section explores these three components: (i) first investment in education (see section 2.2.1); (ii) educational outcomes; and (iii) exclusion (see section 2.2.2), in order to assess the current state of lifelong learning in education across the globe.
Throughout the analysis, this chapter seeks to distinguish between:
-
general education, which UNESCO defines as “designed to develop learners’ general knowledge, skills and competencies” (UIS 2012, para. 55); and
-
vocational education, which specifically prepares students for employment and is therefore examined in the context of the world of work (section 2.3.1).
However, globally comparable data that clearly differentiate between these two types of education are lacking. To approximate this distinction, the analysis focuses on indicators related to lower secondary education when data permit.23 This choice is based on findings that many countries introduce learning schemes directly linked to the world of work – such as formal TVET – after lower secondary education (UNESCO 2013). Furthermore, lower secondary education is widely recognized as a critical stage in the education continuum (OECD 2019a; UNESCO 2017). Focusing on lower secondary education also ensures comparability of educational outcomes, as many key indicators (such as reading and mathematics proficiency) are commonly reported at this level, especially in OECD countries.
2.2.1. Investment in education
One of the main determinants of the availability and quality of educational opportunities and outcomes is the amount of resources a country allocates to education (Baker, Farrie and Sciarra 2016; Jackson, Johnson and Persico 2016). Figure 2.1 plots four key indicators of investment in education, by country income group, as defined by the World Bank’s income-based classification: government expenditure, prevalence of qualified teachers, access to information and communication technology (ICT),24 and access to infrastructure. The larger the surface formed by these four indicators in each figure, the higher the investment in education.
-
Figure 2.1. Investment in education, 2023 or latest available year, by country income group (percentage)
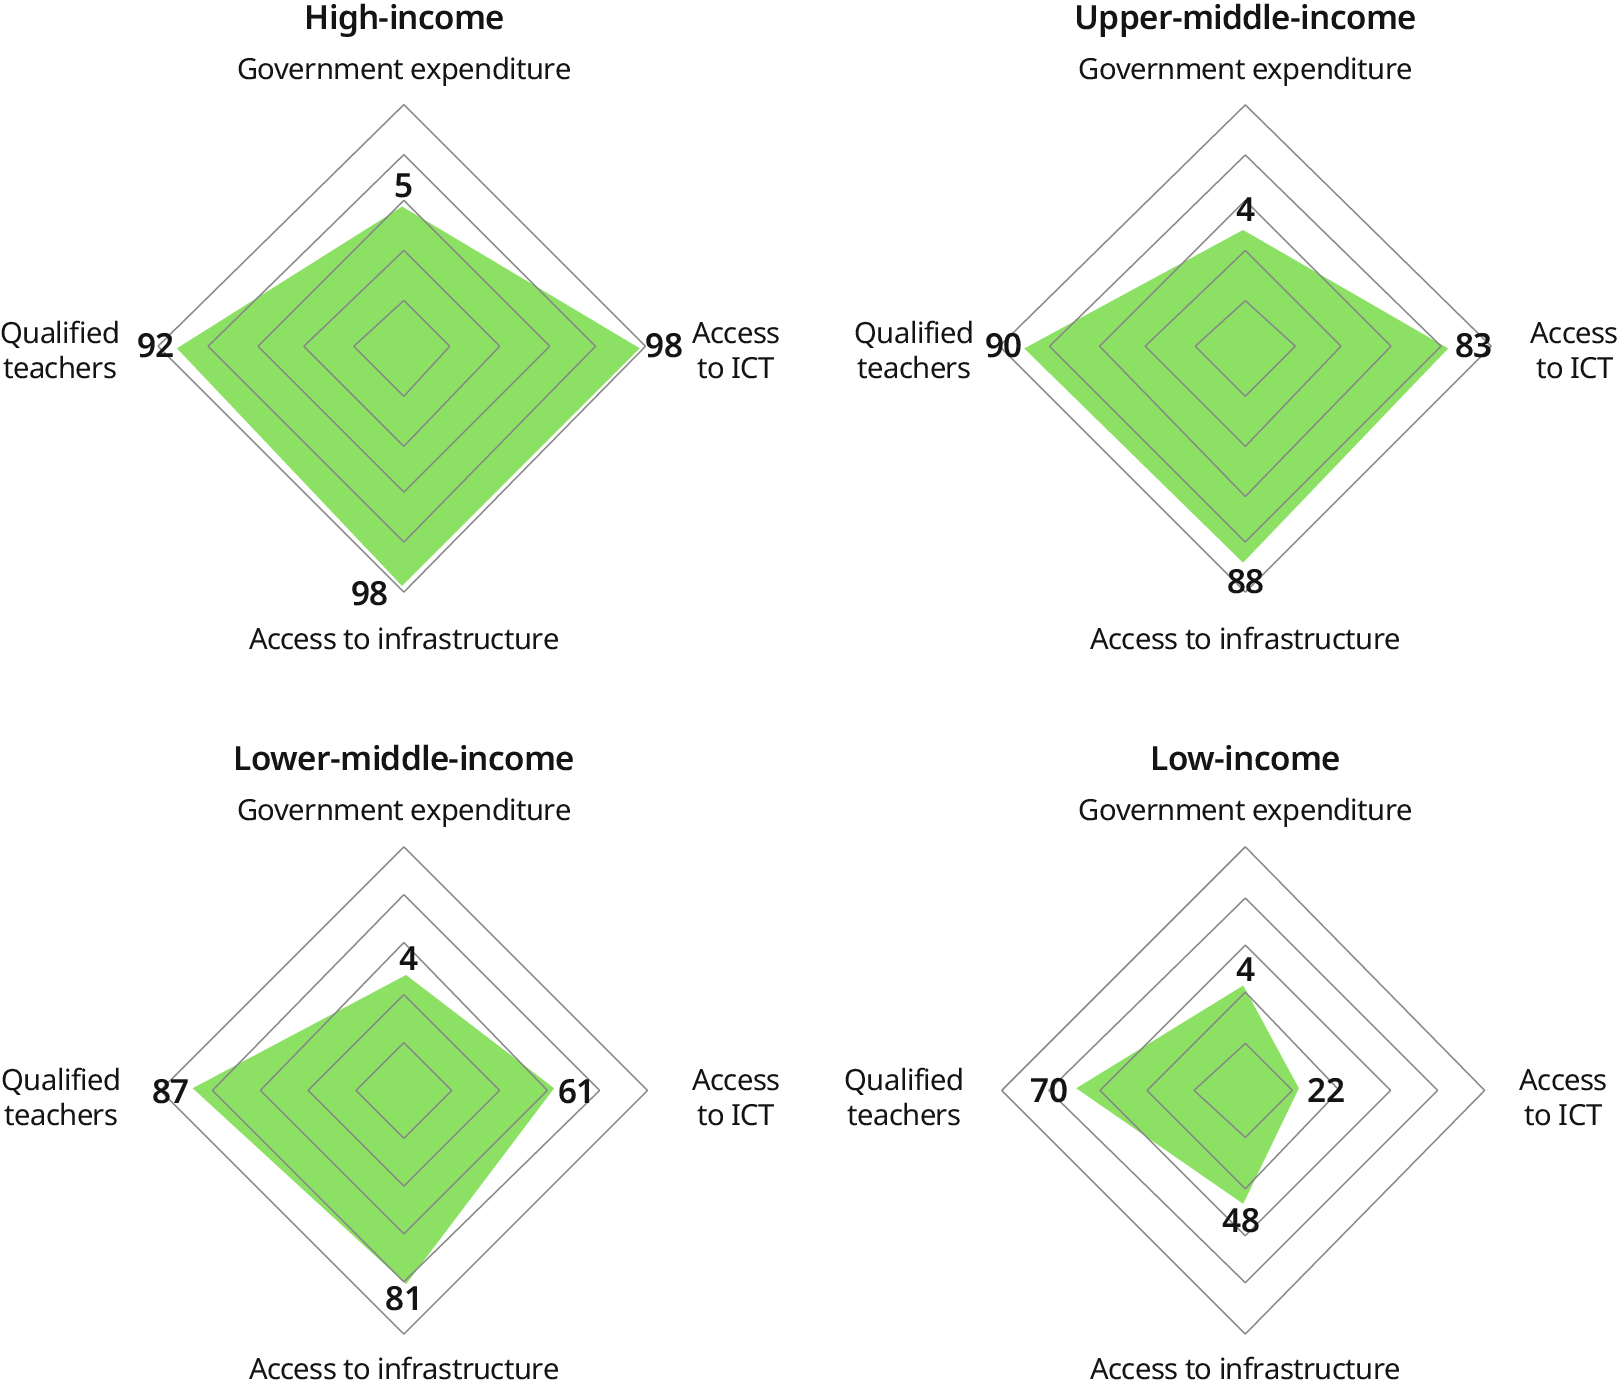
Note: For this figure, the high-income group includes 50 countries and territories; the upper-middle-income group, 36; the lower-middle-income group, 40; and the low-income group, 22.
Government expenditure in education is expressed as a percentage of the gross domestic product (GDP). Access to ICT refers to the average of two indicators measuring the access of computers for pedagogical use and internet. Access to infrastructure resources is an average of various indicators including access to sanitation, water, handwashing areas, electricity and infrastructure for students with disabilities. Qualified teachers refers to the proportion of teachers with the minimum required qualifications.
All indicators are at the lower secondary education level, except for government expenditure which covers all levels. The outermost gridline represents 100 per cent for each indicator, except for government expenditure, where it represents the maximum observed value of 8.74 per cent of GDP. The position of each data point corresponds to the country income group’s unweighted average.
Source: UN, "SDG Indicators Database"; UNDP, “UN Population Division Data Portal”; World Bank, “DataBank”.
Looking at these surfaces, figure 2.1 shows a clear income trend: low-income countries allocate the smallest amount of resources to education, and the investment increases steadily alongside income levels. High-income countries thus invest the most.
These indicators should also be considered alongside the share of children (aged 0 to 14) in the population, since children in this age group are the main beneficiaries of the general education system. Since countries in lower-income groups have a higher share of children in their population, fewer resources are allocated to a higher number of beneficiaries, lowering the rates of investment per child.
2.2.2. Educational outcomes and exclusion
Similar country income trends emerge for educational outcomes. Figure 2.2 shows that as a country’s income increases, a larger share of children and adolescents attend school, represented by higher enrolment rates in secondary and tertiary schools. Additionally, educational outcomes in mathematics and reading, as well as lower secondary education completion rates, improve with country income level. Although tertiary education is only partially covered here, evidence points to wide disparities across income levels, with only a small share of students of the low- and middle-income households in low-income countries attending tertiary education (Buckner and Abdelaziz 2023). These trends suggest that a country’s income level and its investment in education are strong determinants of educational outcomes. This is also consistent with the literature which finds a strong relationship between school spending and student outcomes (Baker, Farrie and Sciarra 2016; Jackson, Johnson and Persico 2016).
-
Figure 2.2. Educational outcomes at the lower secondary education level, 2023 or latest available year, by country income group (percentage)
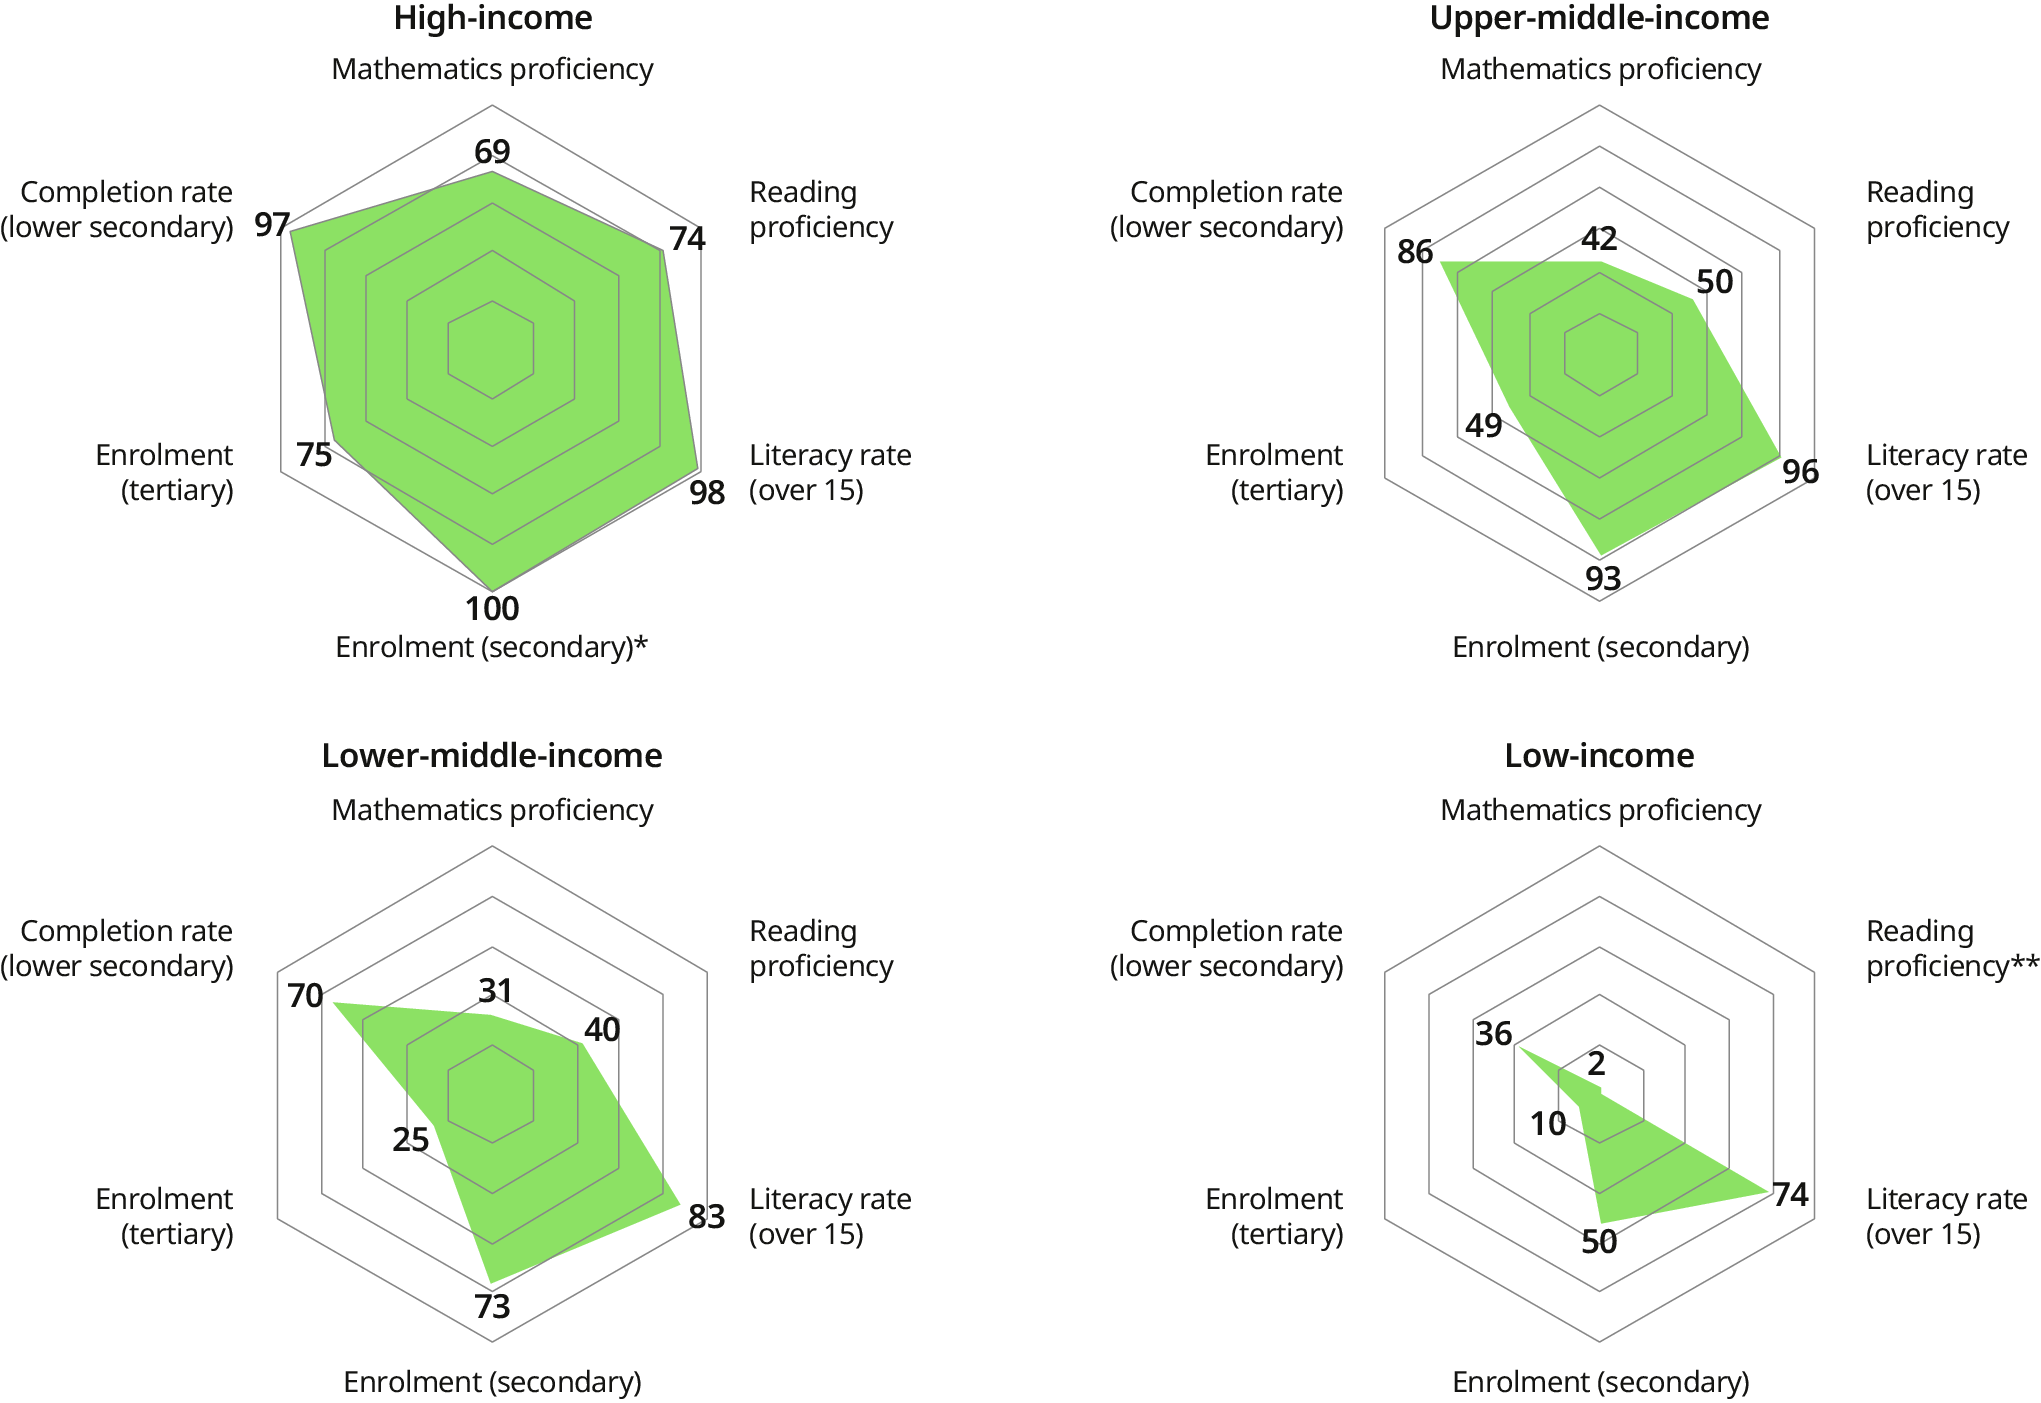
Key: * The average value of enrolment in secondary education is 109 per cent in high-income countries. For visual purposes, it is capped at 100 per cent in this figure. Rates exceeding 100 per cent are due to the inclusion of students who are older or younger than the typical age group for a given level. ** There are no data on reading proficiency and there is only one data point on mathematics proficiency for low-income countries.
Note: For this figure, the high-income group includes 57 countries and territories; the upper-middle-income group, 49; the lower-middle-income group, 49; and the low-income group, 29.
Mathematics proficiency represents the proportion of children and adolescents achieving a minimum proficiency level in mathematics. Reading proficiency representing the proportion of children and young people adolescents achieving a minimum proficiency level in reading. Lower secondary completion rate is expressed as the total share of the relevant age group. Literacy rate for 15-year-olds and above is expressed as a share of the population aged 15 and above. Secondary gross enrolment is expressed as a share of the youth in secondary school age. Tertiary gross enrolment is expressed as share of the youth in tertiary education age.
The outermost gridline represents 100 per cent for each indicator, except for mathematics and reading proficiency, for which we take the sample’s maximum value (95 for mathematics and 90.5 for reading). The position of each data point corresponds to the country income group’s unweighted average.
Source: UN, "SDG Indicators Database"; World Bank, “DataBank”.
Another possible explanation for the differences observed across income groups is the level of exclusion of children and youth in countries’ educational programmes. Figure 2.3 shows three indicators that can serve as proxies for the exclusion of certain populations from the education system. The data reveal a strong correlation between a country’s income level and exclusion factors: lower-income countries have the highest share of children and adolescents out of school, as well as the highest share of young people not in education, employment or training (NEET), although the latter indicator appears to be substantial at all income levels. These indicators of exclusion steadily decrease as income levels increase. Additionally, disparities between sexes in education diminish as income levels rise, suggesting that women face greater exclusion from the education system in low-income countries.
-
Figure 2.3. Exclusion in education, 2023 or latest available year, by sex and country income group (percentage)

Note: For this figure, the high-income group includes 56 countries and territories; the upper-middle-income group, 49; the lower-middle-income group, 47; and the low-income group, 29.
Children out of school is expressed as a share of the youth in primary school age (6 to 11 years old). Adolescents out of school is expressed as a share of the youth in lower secondary school age (11 to 14 years old). Youth NEET represents the share of youth (aged 15 to 24) not in education, employment or training.
The outermost gridline represents the sample’s maximum value for each indicator (44 per cent for youth NEET, 29 per cent for adolescents out of school and 16 per cent for children out of school). The scale of the graph is normalized relative to the sample’s maxima. The position of each data point corresponds to the country income group’s unweighted average.
Source: ILO Harmonized Microdata Collection (ILOSTAT); World Bank, “DataBank”.
A range of factors contribute to the barriers faced by children and youth in accessing education. Beyond shortcomings in educational systems, poverty and broader socio-economic vulnerability play a significant role (OECD 2019b). Child poverty, in particular, has well-documented negative effects on children’s education and health outcomes (McKinney 2014). In such contexts, social protection schemes – especially those that combine cash benefits with access to education, health protection and other essential services – can have positive, mutually reinforcing effects (Angrist, Bettinger and Kremer 2006; Chetty, Hendren and Katz 2016; ILO and UNICEF 2023).
While lifelong learning opportunities in the world of education are strongly associated with countries’ income levels, these findings do not hold uniformly for all countries within each income group. This suggests that economic growth alone does not fully determine educational outcomes. Figure 2.4 shows that the distribution of the indicators linked to investment in education widens as income level decreases. In other words, while high-income countries tend to be quite similar in these aspects, greater variation exists across countries in lower-income groups. In low-income countries, this variation is most pronounced in school access to infrastructure (from 3 to 77 per cent) and ICT (from almost 0 up to 67 per cent).25 Regarding the prevalence of qualified teachers, only half of teachers are qualified in some low-income countries whereas, in many others, the share exceeds 75 per cent.
-
Figure 2.4. Distribution of country-level averages of investment in education at the lower secondary education level, 2023 or latest available year, by country income group (percentage)
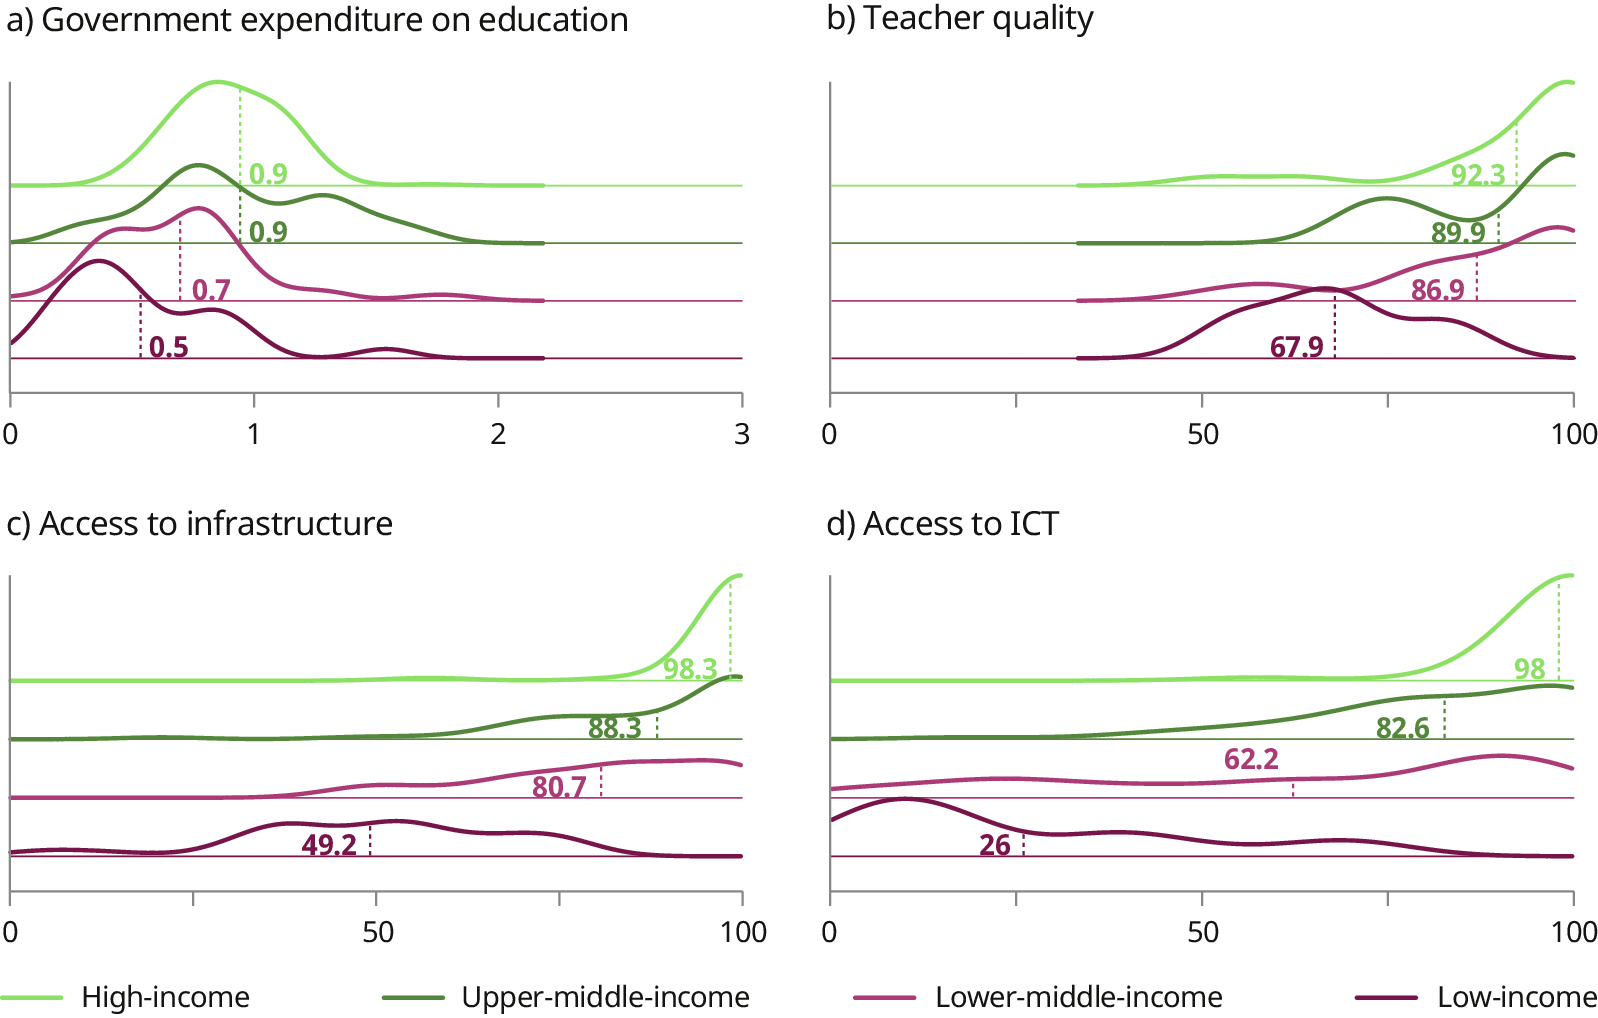
Note: For this figure, the high-income group includes 52 countries and territories; the upper-middle-income group, 36; the lower-middle-income group, 41; and the low-income group, 22. Each country was weighted equally. Dashed vertical lines show the average of each country income group.
Source: UN, “SDG Indicators Database”; UNDP, “UN Population Division Data Portal”; World Bank, “DataBank”.
A similar pattern emerges when looking at educational outcomes in figure 2.5, particularly in mathematics and reading proficiency as well as in lower secondary completion rates. For instance, Viet Nam (a lower-middle-income country) has a remarkable share of students who achieve minimum proficiency in both mathematics (84 per cent) and reading (90 per cent). Within the lower-middle-income group, high rates of gross secondary education enrolment are also observed in several countries. The variation across countries with similar income levels suggests that other factors may play an important role in shaping learning opportunities, such as policy frameworks, cultural attitudes toward education and the prioritization of education in public spending.
-
Figure 2.5. Distribution of country-level averages of educational outcomes, latest available year, by country income group (percentage)
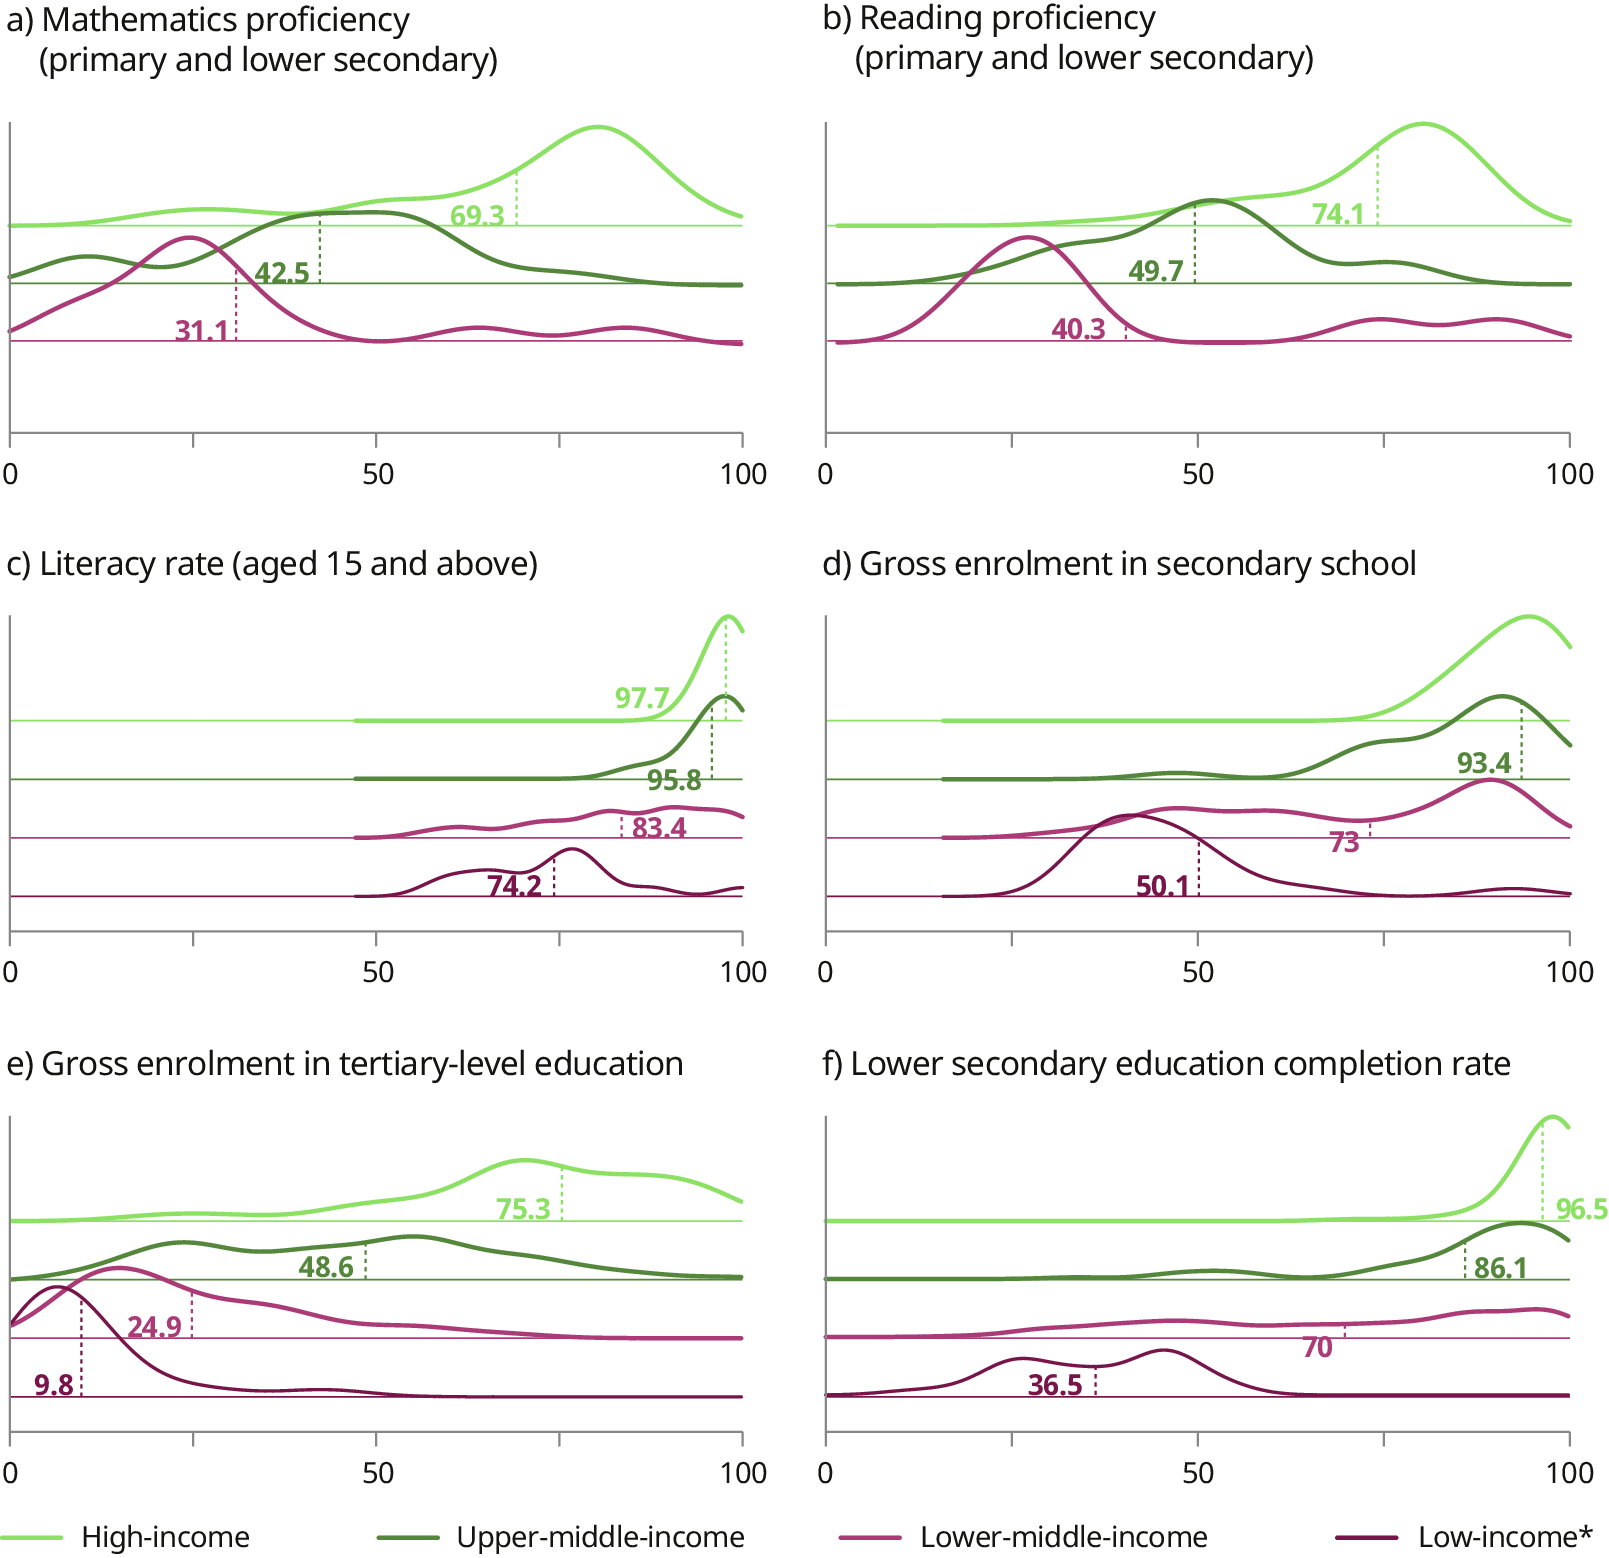
Key: * There are no data on reading proficiency and there is only one data point on mathematics proficiency for low-income countries.
Note: For this figure, the high-income group includes 54 countries and territories; the upper-middle-income group, 48; the lower-middle-income group, 53; and the low-income group, 26.
Each country is weighted equally. Dashed vertical lines show the average of each country income group.
Source: UN, "SDG Indicators Database"; World Bank, “DataBank”.
Specifically, financial management is a critical aspect of education systems, complementing overall investment levels in shaping educational outcomes. Budgetary issues – such as delayed fund disbursement, limited flexibility in reallocating funds, and complex financial procedures – can negatively affect education quality. Studies show that budget predictability remains low in many countries, particularly low-income ones, with potential consequences for student performance (Kadirov, Gurazada and Poulsen 2023). At the same time, when financial transfers are predictable and reach schools as intended, they can contribute to higher enrolment increases and improved learning outcomes, such as better test scores (Reinikka and Svensson 2004, 2011).
Beyond educational outcomes, education policies also impact the labour market, by contributing to broader efforts to address skills shortages and mismatches. In this context, timely and accurate information on current and future skill needs is essential. Such data inform curriculum design, guide decisions on the number of places available in different education streams and help students make informed career choices (OECD 2016). Overcoming challenges in data collection, effective use of information and stakeholder coordination is crucial to designing effective education and training policies, as largely discussed in Chapter 3.
2.3. Lifelong learning in the world of work
Individuals continue their lifelong learning as they leave the formal education system and transition into the world of work.26 The general education system provides foundational skills and knowledge that are essential to the workforce, creating a strong interconnection between work and education. Some groups, such as apprentices and interns, straddle both realms simultaneously. The skills and competencies acquired from the education system are also crucial to benefit from lifelong learning in the world of work. In this regard, evidence from the ILO lifelong learning surveys in Bangladesh, Fiji and the United Republic of Tanzania tends to confirm that individuals with lower educational attainment may have fewer opportunities to benefit from lifelong learning initiatives in the world of work (see box 2.1).
Box 2.1. Relationship between learning in education and the world of work: Insights from the ILO lifelong learning surveys
Evidence from the ILO lifelong learning surveys conducted in Bangladesh, Fiji and the United Republic of Tanzania highlights that educational attainment is a crucial enabler for individuals to engage in lifelong learning in the world of work.
The surveys reveal that individuals who cannot read and write have significantly less exposure to formal and non-formal types of work-related learning (figure 2.6). In Bangladesh, only 1.4 per cent of individuals who are unlettered report engaging in formal learning activities in the world of work, compared to nearly 15 per cent for the rest of the population. A similar gap in the rates of engagement in formal learning according to literacy is observed in the United Republic of Tanzania (about 16 percentage points). The illiteracy rate among survey respondents in Fiji is too low to provide meaningful statistics.
-
Figure 2.6. Participation in different types of learning, by literacy status (percentage)
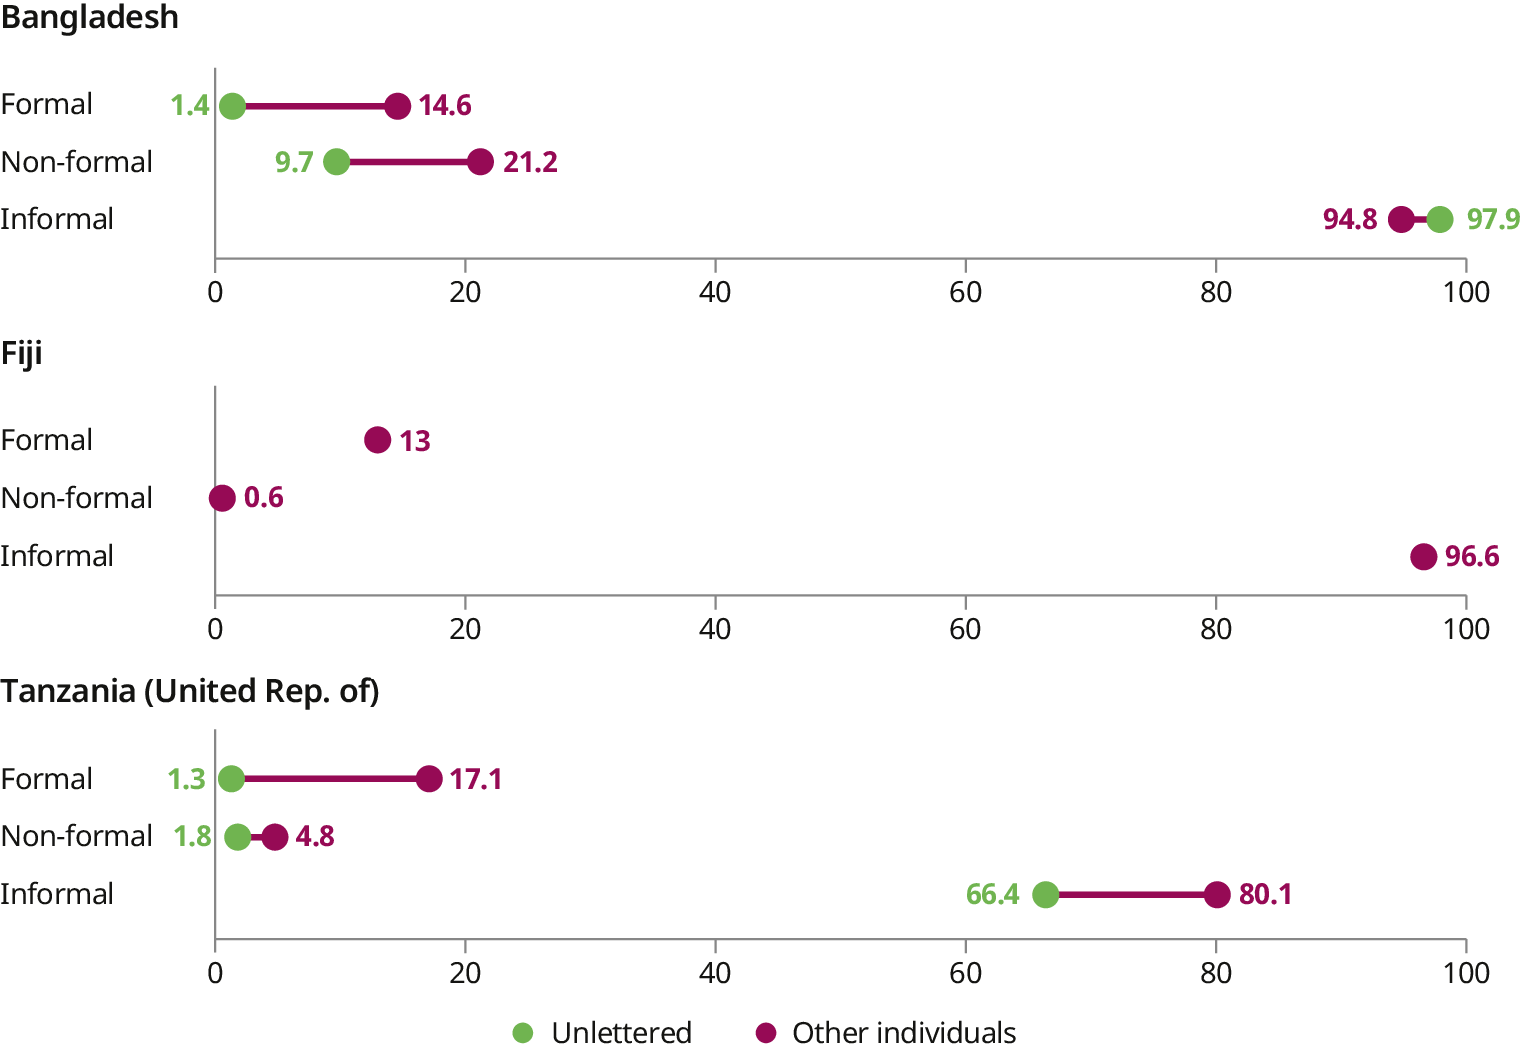
Note: The survey questions used to identify informal learning were asked only to individuals in employment. Thus, the shares are conditional on being in employment. The shares of formal and non-formal learning are for the entire sample.
Source: ILO lifelong learning surveys for Bangladesh (2023), Fiji (2025) and the United Republic of Tanzania (2025).
Likewise, those who have not completed lower secondary education participate in fewer formal and non-formal learning activities compared to those who have (figure 2.7). For example, more than a quarter of the individuals who have completed lower secondary education in Bangladesh undertake formal learning activities in the world of work, compared to only 3 per cent who have not completed lower secondary education. In Fiji and the United Republic of Tanzania, the gaps in formal learning between individuals with and without secondary education are also substantial. This underscores the intrinsic connection between education and the world of work, emphasizing the importance of educational achievement as a precondition that facilitates access to lifelong learning opportunities within the world of work.
-
Figure 2.7. Participation in different types of learning received, by lower secondary school completion (percentage)
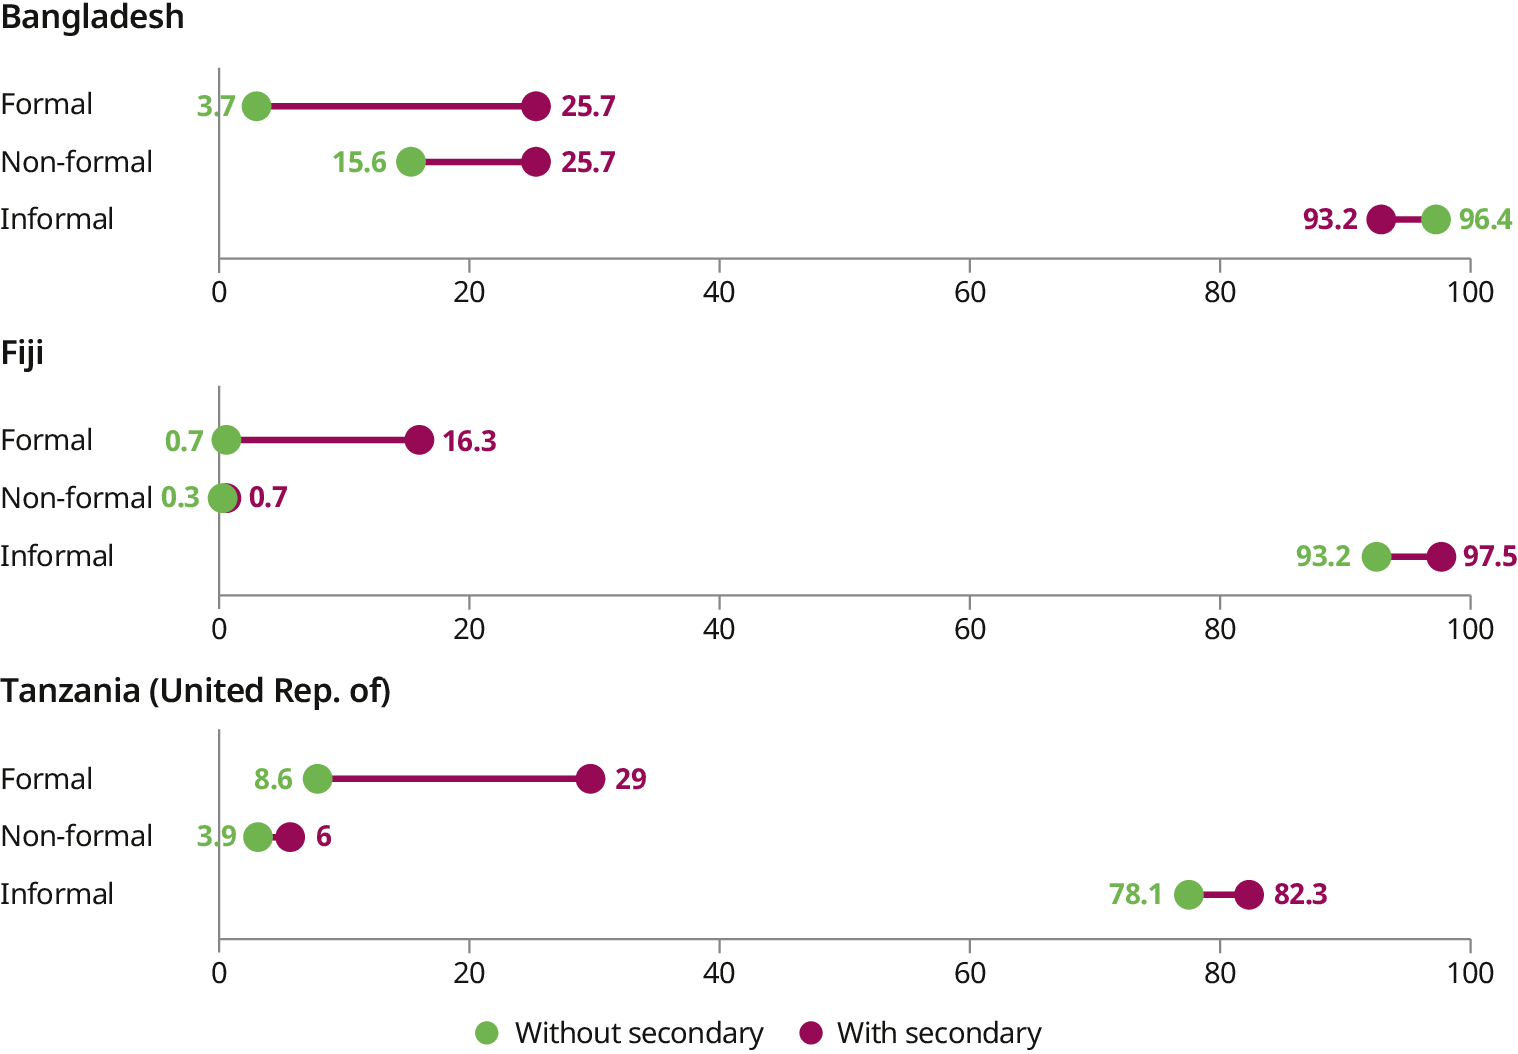
Note: The survey questions used to identify informal learning were asked only to individuals in employment. Thus, the shares are conditional on being in employment. The shares of formal and non-formal learning are for the entire sample.
Source: ILO lifelong learning surveys for Bangladesh (2023), Fiji (2025) and the United Republic of Tanzania (2025).
In all three countries, a large proportion of employed people reports access to informal learning, including among unlettered people and those without secondary education. This is particularly evident in Bangladesh and Fiji, where the proportion accessing informal learning exceeds 90 per cent.
Opportunities for lifelong learning in the world of work are made available directly or indirectly through various channels, including government programmes; employer-sponsored initiatives or work-based learning; self-financed efforts; and professional or informal networks. Globally, countries rely on different combinations of these learning sources to offer lifelong learning opportunities to individuals in the world of work. These combinations, along with their financing mechanisms, are discussed in detail in Chapter 5. The variation in the available sources of learning reflects differences in policies, institutional frameworks and the maturity of each country’s lifelong learning system.
While the global mapping in this chapter demonstrates the breadth of lifelong learning indicators, it also highlights significant gaps in data on learning opportunities in the world of work – especially in low- and middle-income countries. Existing indicators rarely distinguish clearly between formal, non-formal and informal learning activities (see footnote 1), and information about informal learning and the specific characteristics of the learning activities is generally not available. Data on learning outcomes – such as income, productivity and career prospects – are also scarce.
To address these gaps, the ILO conducted dedicated individual-level surveys in Bangladesh, Fiji and the United Republic of Tanzania (box 2.2). These surveys provide new insights into how individuals engage in different types of learning, the perceived usefulness of those learning experiences, the barriers they face and how learning relates to their work. These surveys complement existing data and offer practical tools for countries to track lifelong learning over time. While these three countries were selected to reflect diverse regional and income-level contexts, the intention is not to generalize their findings to other settings. Rather, the aim is to illustrate how a comprehensive analysis of learning within the world of work can be carried out in practice. This approach demonstrates the feasibility and added value of generating robust data outside of high-income countries – offering a model that could be adapted and expanded by others in future research and policy efforts.
To help address the lack of data on learning within the world of work – particularly in low- and middle-income countries – the ILO conducted dedicated individual-level surveys in Bangladesh, Fiji and the United Republic of Tanzania, referred to as ILO lifelong learning surveys throughout this report. These surveys do not aim to produce generalizable findings for all countries, but rather to demonstrate how comprehensive data on lifelong learning can be generated in a practical and scalable way – particularly outside of high-income contexts. Each survey collected detailed information on individuals’ employment situation and their engagement in formal, non-formal and informal learning activities, offering unique insights into how learning happens in practice and how it links to work.
Information on the survey methodology and full country questionnaires are available on the report’s website.27
-
Bangladesh: The survey was conducted between November and December 2023, with 6,164 individuals aged 15 to 64 interviewed face-to-face. Interviews were conducted across all eight administrative divisions – Barishal, Chattogram, Dhaka, Khulna, Mymensingh, Rajshahi, Rangpur and Sylhet. Within each division, geographical areas were sampled using a partially randomized approach to ensure representation of both rural and urban populations. Within each selected area, households were sampled systematically. One individual per sampled household was selected and interviewed.
-
Fiji: The survey was conducted via telephone interviews, using a sample drawn from a telecommunications provider’s database of 190,000 users. A stratified random sample of 2,452 individuals aged 18 and above was selected based on region and urban/rural location. A total of 2,272 interviews were completed between March and April 2025.
-
United Republic of Tanzania: A total of 4,500 face-to-face interviews were conducted with individuals aged 15 and above between March and June 2025. The survey covered both urban and rural districts in eight regions: Arusha, Dar es Salaam, Dodoma, Lindi, Mbeya, Mjini Magharibi, Mwanza and Tabora. Within each district, wards and villages were randomly selected, and households were then sampled using a systematic approach. One adult per household was interviewed.
Measuring formal, non-formal and informal learning
Each survey enables the identification of formal, non-formal and informal learning consistent with definitions used in this report (see box 1.1).
-
Formal learning was captured through questions about attendance at technical or vocational training institutions leading to a formal certification.
-
Non-formal learning was identified with questions on other training and learning activities undertaken in the past 36 months outside the formal education system.
Informal learning was captured when respondents reported learning through experience – such as learning by doing – or acquiring knowledge from colleagues or supervisors in the workplace.
To give a comprehensive picture of learning in the world of work, this section presents key findings drawing on both global indicators and the new ILO surveys on lifelong learning activities. First, this section starts with an overview of learning opportunities available for the working-age population, with a particular focus on informal workers, who are often overlooked by existing data (section 2.3.1). It then focuses on the three types of learning in the world of work – formal, non-formal and informal – acknowledging that these categories often overlap and that certain activities can simultaneously contain elements of each (section 2.3.2).
2.3.1. Overview of learning in the world of work
Given their life stage, working-age individuals are generally more likely to benefit from learning opportunities linked to employment or professional development rather than general education.28 Informal workers, however, are less likely to access organized learning activities. They face multiple barriers to participating in lifelong learning, including training costs, lack of information about opportunities, lower levels of basic skills, and financial constraints (ILO 2020b; Torm 2024). Those employed by informal firms have even fewer training opportunities, as these firms often lack the resources to invest in learning (Palmer 2017). Data to distinguish lifelong learning opportunities between formal and informal workers remain limited. Nonetheless, two global indicators – supplemented by findings from the surveys in Bangladesh, Fiji and the United Republic of Tanzania – shed some light.
The first indicator, SDG 4.3.1, provides insight into lifelong learning opportunities for all workers. The indicator captures participation in various forms of training for the entire working-age population (aged 15 to 64) during the previous 12 months.29 Globally, based on this indicator, only 16 per cent of the 15–64 age group has participated in formal and non-formal education and training. In addition, figure 2.8 indicates little deviation from this global trend by country income group. These trends suggest that limited learning opportunities exist for the working-age population. The indicator’s broad definition underscores the limited availability of lifelong learning opportunities globally, since it includes both formal and non-formal learning (with general education included under formal education).30 Unfortunately, SDG 4.3.1 neither provides information on individuals by employment status nor distinguishes between formal and non-formal learning – both of which would be particularly relevant for individuals aged 15 to 25, as they are more likely to be engaged in initial education. Nevertheless, it provides a useful benchmark for comparison with other, more specific, indicators.
-
Figure 2.8. Distribution of country-level averages of the participation in formal and non-formal education and training, 2023 or latest available year, by country income group (percentage)
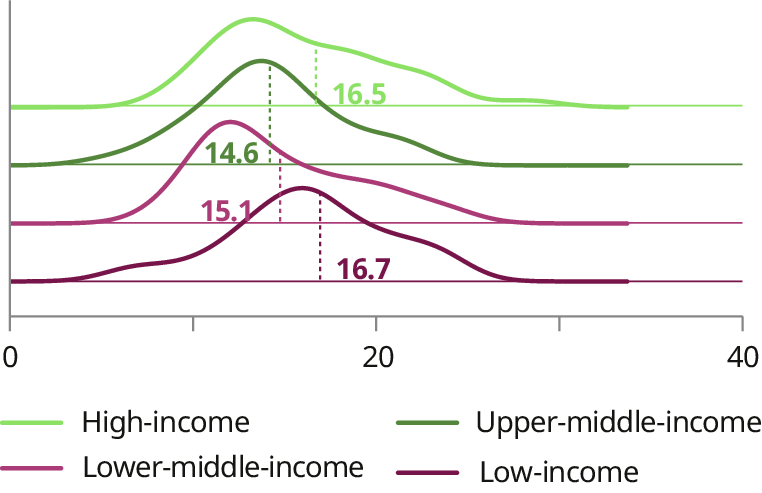
Note: For this figure, the high-income group includes 36 countries and territories; the upper-middle-income group, 34; the lower-middle-income group, 36; and the low-income group, 17.
Each country is weighted equally. Dashed vertical lines show the averages of each country income group.
Source: UN, "SDG Indicators Database".
The second global indicator is obtained from the World Bank Enterprise Surveys and measures training received by the workers in formal enterprises.31 It provides insight into the training landscape within the formal economy, which is likely to offer more favourable training opportunities. Formal enterprises are typically defined as those that are registered at relevant national institutions or maintain a set of accounts required by law. By contrast, enterprises are considered informal when they do not keep formal accounts and are not registered at national level (Gaarder and van Doorn 2021).
Based on World Bank data, table 2.1 shows the average share of full-time permanent workers in formal firms who received training through their employers during the fiscal year. It reveals that, globally, more than 50 per cent of permanent workers employed by formal firms received employer-provided training during the fiscal year covered in the database. Although this rate is slightly lower in low-income countries (42 per cent), it is similar to the global average for the other country income groups.
-
Table 2.1. Share of full-time permanent workers receiving employer-provided training in formal manufacturing firms of five or more employees, 2023 or latest available year, by country income group (percentage)
|
Country income group |
Workers receiving employer-provided training |
|---|---|
|
World |
51 |
|
High-income |
48 |
|
Upper-middle-income |
53 |
|
Lower-middle-income |
54 |
|
Low-income |
42 |
Note: A simple average of the country-level values was used for country income groups.
Source: World Bank, “World Bank Enterprise Surveys”.
One limitation of these averages is that they are based on samples excluding enterprises with fewer than five employees. Research has shown that training is closely associated with company size, with larger companies being more likely to provide it (Holtmann and Idson 1991; Kitching and Blackburn 2002). This may be partly explained by structural and resource-related challenges faced by smaller firms. Other factors may also account for differences in training activities between enterprises, including the regulatory and organizational pressures they face (OECD 2021).
Furthermore, the relatively high rates of employer training made available to full-time permanent employees in formal firms globally, contrasts sharply with the global average for all workers from SDG 4.3.1 (16 per cent). This points to the fact that informal workers, who include workers in informal firms as well as informal workers in the formal sector, are far less likely to benefit from training than other workers worldwide.32 Therefore, the gap between the two indicators reflects, in part, differences in the composition of employment across the globe, with low- and middle-income countries having much higher informal employment rates.
Inequalities in learning opportunities available to formal and informal workers are corroborated by findings from the ILO lifelong learning surveys, which show that informal workers have less access to formal and non-formal learning. Figure 2.9 presents the share of formal and informal workers by type of learning in Bangladesh, Fiji and the United Republic of Tanzania. Across formal and non-formal types of learning, formal workers have higher participation rates compared to informal workers. The largest gap in participation emerges for formal learning, which formal workers are two to three times more likely to access than informal workers. Beyond the formality status of employment, substantial differences in participation in formal learning can also be observed across occupational groups (see box 2.3 on learning types by occupational groups).
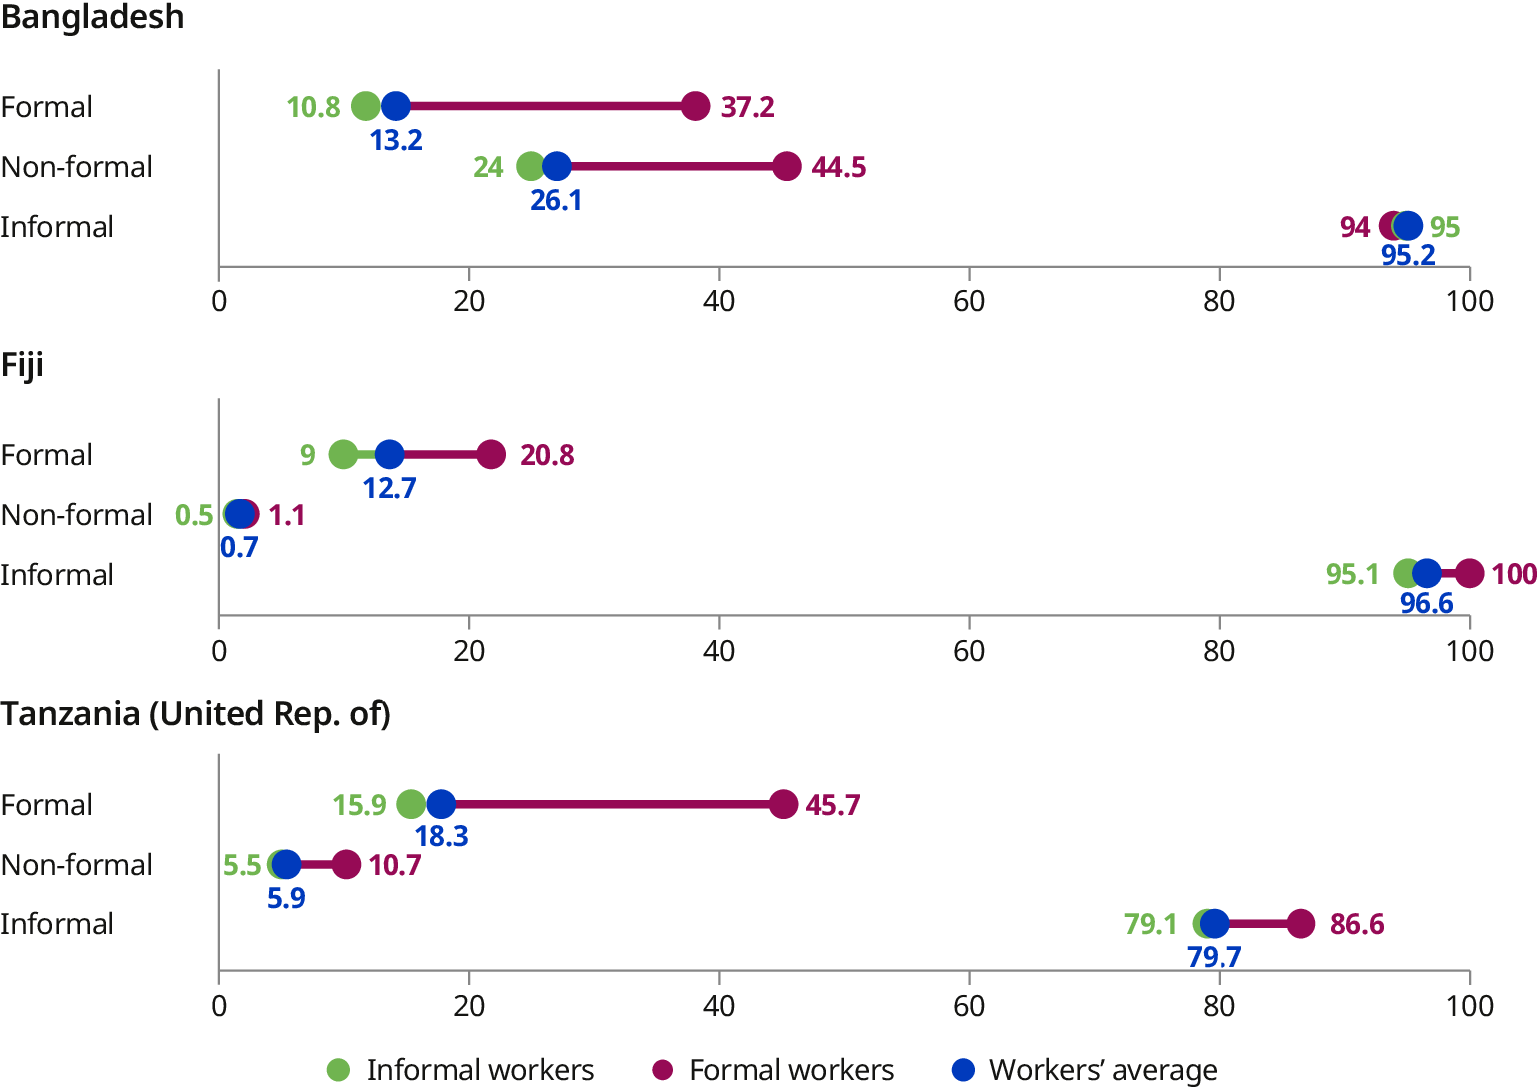
Source: ILO lifelong learning surveys for Bangladesh (2023), Fiji (2025) and the United Republic of Tanzania (2025).
Turning to non-formal learning participation rates, a 20-percentage-point gap is observed between formal and informal workers in Bangladesh (that is, 44.5 per cent of formal workers access non-formal learning, compared to 24 per cent of informal workers). In the United Republic of Tanzania, the overall participation is much lower but shows a similar pattern: 10.7 per cent of formal workers report engaging in non-formal learning, versus 5.5 per cent of informal workers. Meanwhile, in Fiji, participation is very limited overall, with only 1.1 per cent of formal workers and 0.5 per cent of informal workers reporting engagement in non-formal learning activities.
With regard to informal learning in the workplace, most individuals in employment in Bangladesh and Fiji report accessing this modality of learning in their current workplace, with similar shares between formal workers (94 per cent in Bangladesh, 100 per cent in Fiji) and informal workers (95 per cent in both Bangladesh and Fiji). The proportion of informal learning is also high among formal and informal workers in the United Republic of Tanzania (86 and 79 per cent, respectively). However, informal workers primarily rely on a specific aspect of informal learning: learning by doing. This disproportionate reliance on self-directed learning, as opposed to other forms, reflects the limited learning opportunities provided by employers to informal workers.
Based on the ILO lifelong learning surveys, figure 2.10 provides insights into the learning activities undertaken by individuals across different occupations in Bangladesh, Fiji and the United Republic of Tanzania, according to the International Standard Classification of Occupations (ISCO).
Managers, professionals and technicians – typically in higher-skilled positions – show high participation in formal learning in all three countries. In contrast, workers in lower-skilled occupations – such as service and sales workers, skilled agricultural workers and those in elementary occupations – engage less in this type of learning. In particular, workers in elementary occupations show minimal engagement, ranging between 3 and 14 per cent.
In Bangladesh and the United Republic of Tanzania, where data are available, participation in non-formal learning tends to be less disparate across occupations. Still, in Bangladesh, professionals, technicians and clerical support workers benefit more often from this kind of training, with participation rates between 44 and 46 per cent in these three occupational categories. In the United Republic of Tanzania, non-formal learning primarily targets professionals and craft and related trade workers, with participation rates of 12 and 13 per cent.
Finally, informal learning is widespread across nearly all occupational categories. However, in the United Republic of Tanzania, it appears slightly less widespread among plant and machine operators and assemblers. Access to specific informal learning methods also varies by occupational group (see section 2.3.2). For instance, relatively few low-skilled workers report learning from colleagues or supervisors. In Bangladesh, 57 per cent of managers and professionals report learning from supervisors or colleagues, compared to just 39 per cent of those in elementary occupations. Similar patterns appear in Fiji and the United Republic of Tanzania, where 57 and 60 per cent of managers and professionals, respectively, reported usually learning from colleagues or supervisors, compared to 18 and 38 per cent of those in elementary occupations.
Overall, these disparities highlight the need for targeted interventions to enhance formal learning opportunities for lower-skilled workers and promote equitable access to lifelong learning.
-
Figure 2.10. Participation in different types of learning, by ISCO occupation (percentage)
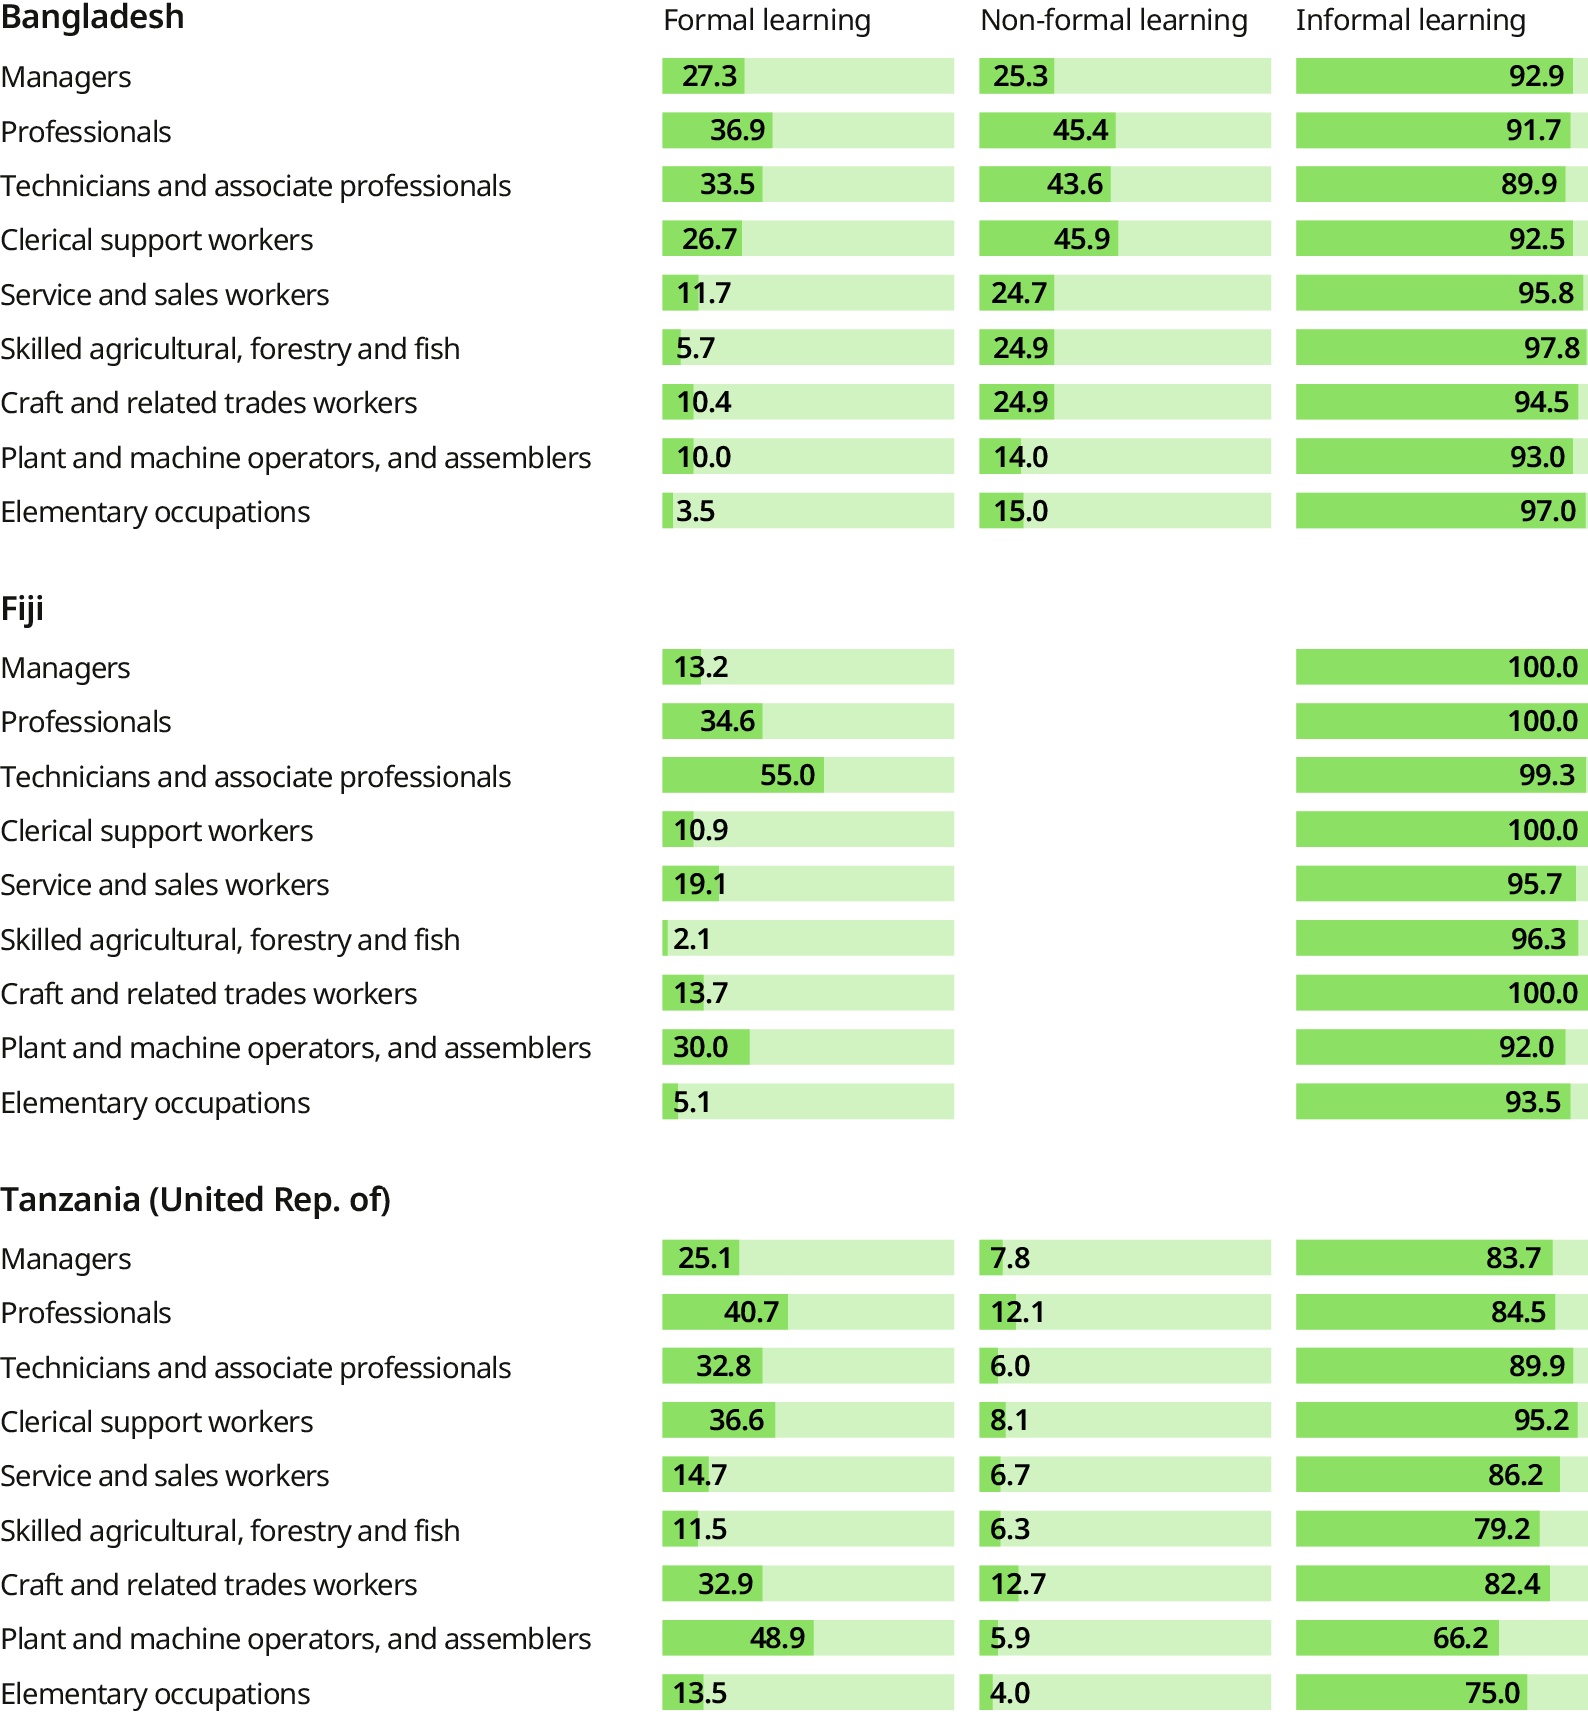
Source: ILO lifelong learning surveys for Bangladesh (2023), Fiji (2025) and the United Republic of Tanzania (2025).
2.3.2. Different types of lifelong learning in the world of work
This section examines the different types of learning activities that take place within formal, non-formal and informal frameworks in the world of work. It highlights examples, such as: (i) TVET programmes, which generally fall under formal learning; (ii) apprenticeships and internships, which can be either formal or non-formal; and (iii) other non-formal and informal learning activities. Understanding these distinctions helps shed light on how workers gain skills throughout their careers and the varied pathways they use to upskill or reskill. The analysis draws on findings from the ILO lifelong learning surveys, complemented by data from national LFS and the OECD’s PIAAC.
Exploring formal learning: TVET participation
TVET refers to education, training and skills development across a broad range of occupational fields, production sectors, services and livelihoods. TVET can take place at secondary, post-secondary and tertiary levels and includes work-based learning, continuing training and professional development that may lead to formal qualifications. TVET also includes diverse opportunities to acquire practical skills, knowledge and understanding relevant to occupations in various sectors of economic and social life (UNESCO and ILO 2002; UNESCO-UNEVOC, n.d.). Since TVET programmes typically result in nationally recognized certifications issued by public authorities, they are primarily classified as formal training. However, TVET might also have non-formal and informal components.
Based on the LFS microdata compiled by the ILO, figure 2.11 shows that high-income countries have the highest completion rates of TVET among the working-age population compared to other income groups. While there is considerable variation among high-income countries, the relatively high average is attributable to various factors including: higher employment expectations following completion; higher literacy rates among students; robust career guidance and intermediary services; well-established apprenticeship systems; and strong connections between training programmes and industry needs. In contrast, low-income countries lag behind, potentially due to a lack of public emphasis on vocational training or capacity constraints. In their joint report, the World Bank, UNESCO and the ILO (2023) delve into these challenges and identify several concerns, such as low levels of foundational skills among learners, financial and social barriers, teachers’ limited pedagogical skills and inadequate incentives for TVET providers to ensure accountability. In many instances, additional challenges have also been identified for TVET completion among specific groups, such as persons with disabilities (UNESCO 2021).33
-
Figure 2.11. Distribution of country-level TVET completion rates among working-age population, 2023 or latest available year, by country income group (percentage)
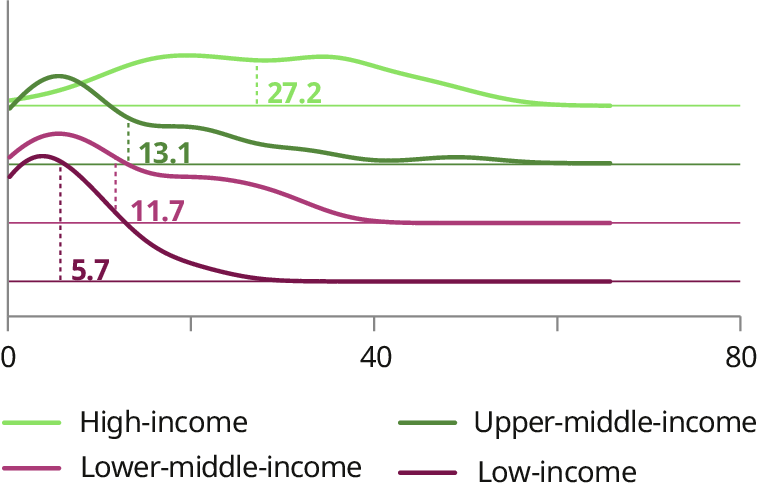
Note: For this figure, the high-income group includes 27 countries and territories; the upper-middle-income group, 27; the lower-middle-income group, 29; and the low-income group, 14.
Each country is weighted equally. Dashed vertical lines show the average of each country income group.
Source: ILO Harmonized Microdata Collection (ILOSTAT).
The ILO lifelong learning surveys complement these findings by shedding light on the types of TVET programmes in which individuals participate. In Bangladesh and the United Republic of Tanzania, 11 and 13 per cent of individuals reported participating in TVET that led to certification at some point in their lives. While participation was similar for both sexes in Bangladesh, the rate was lower for women in the United Republic of Tanzania (11 per cent, compared to 16 per cent for men). In both countries, most TVET participants also took courses that were shorter than six months – 69 per cent in Bangladesh and 58 per cent in the United Republic of Tanzania – with a higher proportion of females taking these shorter courses (80 per cent in Bangladesh and 60 per cent in the United Republic of Tanzania).
Focusing on subject areas pursued by each sex, in Bangladesh, the most common TVET programmes pursued by men included: computer science (43 per cent of men who attended TVET), electrical and electronic engineering (14 per cent) and driving and motor mechanics (10 per cent). Similarly, women pursued computer science (45 per cent) but then focused on ready-made garment (17 per cent) and craftsman/handicraft and cottage work (15 per cent). In the United Republic of Tanzania, the most popular TVET programmes for women were computer science (24 per cent), leather and textile (19 per cent) and catering, hotel and restaurant (15 per cent), In contrast, men attended more frequently programmes in driving and motor mechanic (42 per cent), electrical and electronic engineering (16 per cent) and computer science (11 per cent).
Finally, among respondents to the survey in Fiji, 5 per cent reported participating in TVET (6 per cent among males and 3 per cent among females). Although this relatively low participation rate does not allow for statistically meaningful estimates of the distribution of TVET programmes by sex, mechanical/civil engineering was the most frequently attended training programme overall (16 per cent), followed by catering, hotel and restaurant (11 per cent), and computer science (10 per cent).
The surveys also shed light on how useful the TVET courses are perceived to be. Notably, a significant share of TVET participants emphasize the value of these programmes in helping them gain qualifications. For example, three quarters of TVET participants in Bangladesh reported that courses were beneficial to gain formal qualifications. Additionally, 64 per cent stated that TVET helped them enter or progress in a specific career, while 38 per cent found it an effective way to develop work-related skills. Similar patterns emerge in Fiji and the United Republic of Tanzania, where most participants reported gaining qualifications as the main benefit (33 and 38 per cent, respectively), followed by developing work-related skills (31 and 28 per cent) and career progression (30 and 14 per cent).
The ILO lifelong learning surveys also provide insight into the labour market outcomes associated with TVET. While more advanced econometric techniques are needed to establish causality, interesting descriptive patterns emerge. When comparing those who received TVET to those who did not, no noticeable difference is observed in employment rates between the two groups in Bangladesh and Fiji, but the employment rate is slightly higher for those who received TVET in the United Republic of Tanzania (68 per cent compared to 55 per cent for those who did not). However, when looking at income, figure 2.12 shows a substantial income difference favouring TVET participants in all three countries. On average, those who received TVET earn approximately 40 per cent more than those who do not in Bangladesh, compared to 7 per cent more in Fiji and 20 per cent more in the United Republic of Tanzania. Where earnings by sex can be estimated, higher earnings are observed for both females and males with TVET, although women earn significantly less than men on average.
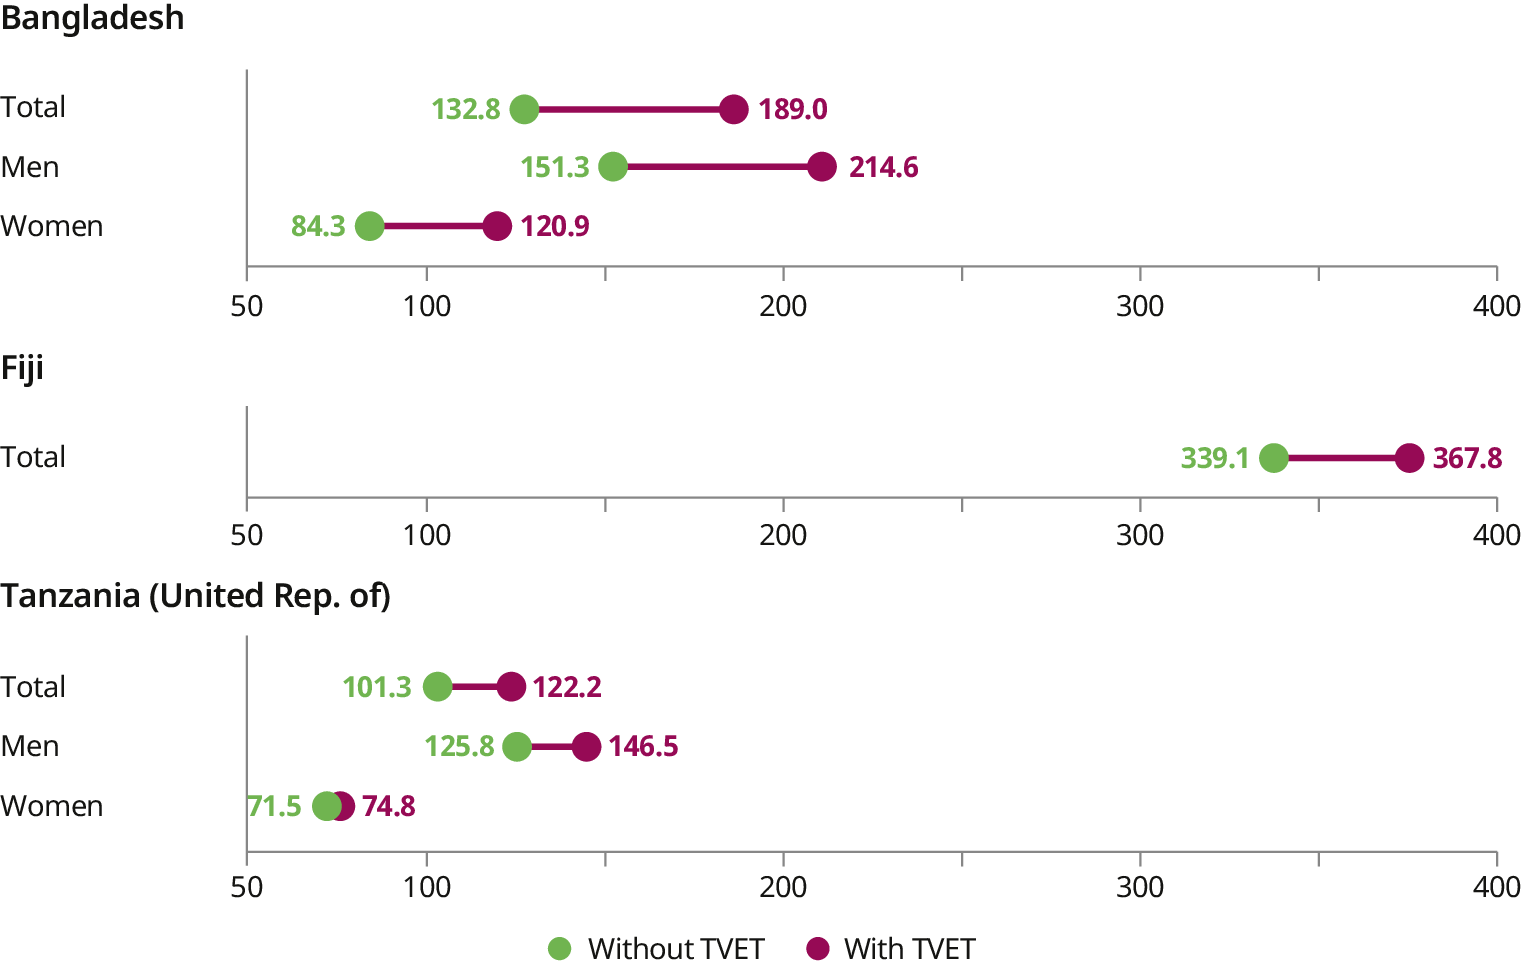
Note: Fiji was not included in the analysis by sex due to low TVET completion rates, which limit statistical inference by sex. Values were reported in local currency and the figure shows the equivalent in US$ based on 2023 annual average exchange rates by the World Bank.
Source: ILO lifelong learning surveys for Bangladesh (2023), Fiji (2025) and the United Republic of Tanzania (2025).
These income differences cannot be exclusively attributed to TVET participation alone. Other factors – such as education and pre-existing skill levels, socio-economic background access to job opportunities, and professional networks – may also be driving these trends. In fact, a meta-analysis by Tripney and Hombrados (2013), finds that individuals completing TVET in low- and middle-income countries experience positive, albeit relatively modest, impacts on paid employment, formal employment and monthly earnings. These effects, which vary considerably across contexts, suggest that the potential labour market gains from TVET may not be sufficient to incentivize widespread uptake in these countries.
Non-formal learning: Participation, training content and needs
Non-formal learning refers to education that is institutionalized and intentional but does not lead to a nationally recognized certification. In the context of the world of work, this typically includes training provided by employers and courses undertaken by workers themselves. The OECD’s PIAAC contains four specific questions that provide insight into non-formal learning, namely if, within the last 12 months, individuals have:
-
participated in courses or private lessons;
-
engaged in open or distance learning;
-
attended seminars and workshops; or
-
participated in organized on-the-job training sessions.
These questions capture intentional and organized learning activities, making them consistent with the classification of non-formal learning.
Figure 2.13 plots the minimum, mean and maximum values for the responses to these four questions from the PIAAC database.34 Across the countries for which data are available,35 PIAAC shows that, on average, about 10 per cent of the employed population (including employees, self-employed and unpaid family workers) has participated in private lessons or online education in the last 12 months. Over a quarter of the employed population also indicates having participated in seminars and workshops. In contrast, the mean for organized on-the-job training is much higher at 35 per cent. For companies, on-the-job training is a cost-effective way to help new staff adapt, introduce job-specific tasks or familiarize workers with new responsibilities (OECD 2010, 2021). On-the-job training has been found to be crucial for boosting workers’ productivity and wages, and the share of employees receiving firm-provided training increases with economic development (Ma, Nakab and Vidart 2024).
-
Figure 2.13. Frequency of non-formal learning in the last 12 months in the employed population (percentage)
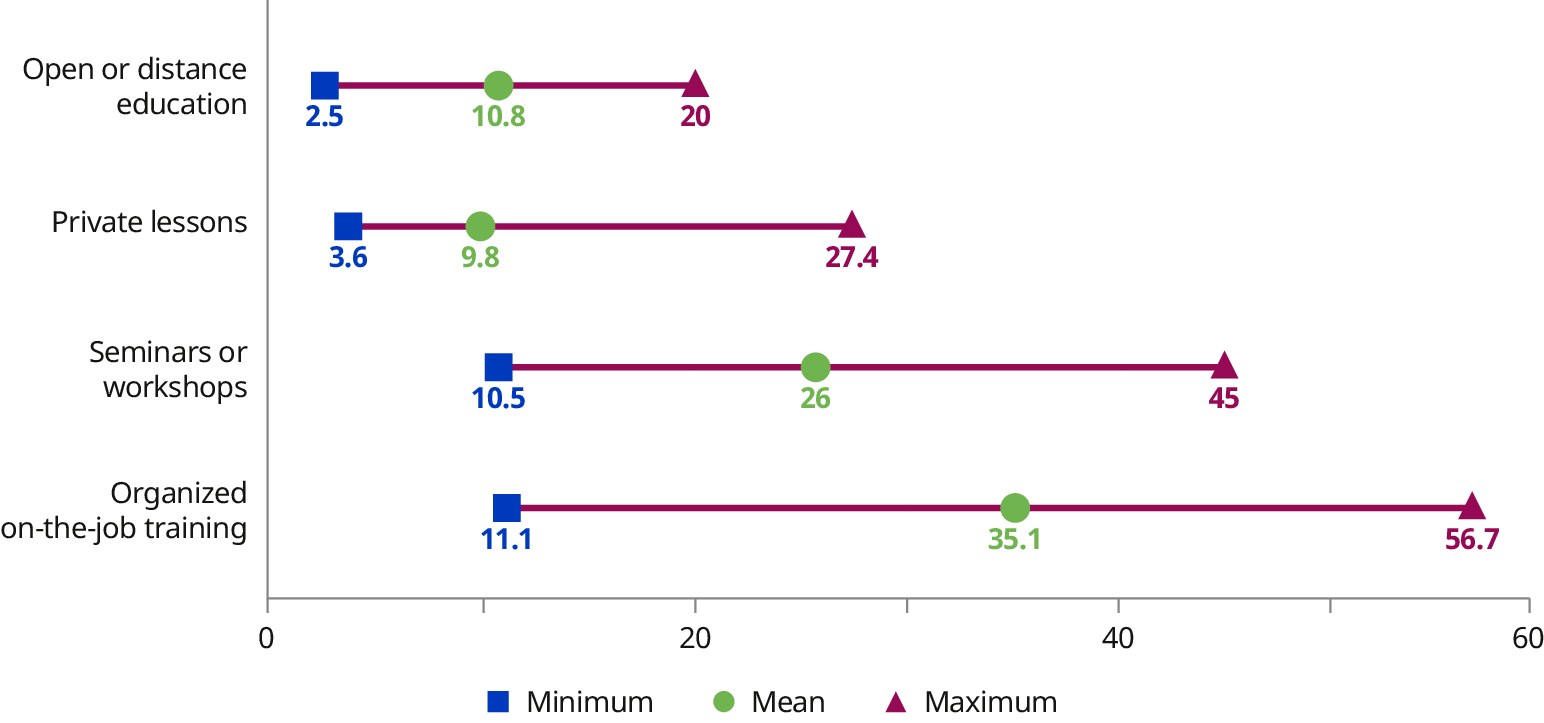
Note: The figure shows the average of the mean, minimum and maximum values observed in each country of the sample. Each country is weighted equally. Data were collected between 2011 and 2017 for Austria, Belgium, Canada, Chile, Denmark, Ecuador, Finland, France, Germany, Greece, Hungary, Ireland, Israel, Italy, Japan, Kazakhstan, Lithuania, Mexico, Netherlands, New Zealand, Norway, Peru, Poland, Russian Federation, Singapore, Slovenia, Spain, Sweden, United Kingdom and United States.
Source: OECD, “Survey of Adult Skills (PIAAC)”.
The ILO lifelong learning surveys enable deeper exploration of non-formal learning activities by examining their specific content. The surveys ask individuals about their participation in various forms of training over the last 36 months. Figure 2.14 shows the six most common types of non-formal learning activities undertaken by employed individuals surveyed in Bangladesh and the United Republic of Tanzania during this period. In both countries, occupation-specific training appears to be the most prevalent with 57 and 31 per cent of respondents, respectively, having participated in this type of training at some point in the last 36 months. Uptake also appears relatively high for females (65 per cent in Bangladesh and 35 per cent in the United Republic of Tanzania). The second most popular type of training varied between the two countries. In the United Republic of Tanzania, workplace orientation training was the second most frequently mentioned type of training (24 per cent), whereas in Bangladesh, it was digital/computer skills training (20 per cent).
-
Figure 2.14. Content of non-formal training for the employed population who participated in training in the last 36 months, by sex (percentage)
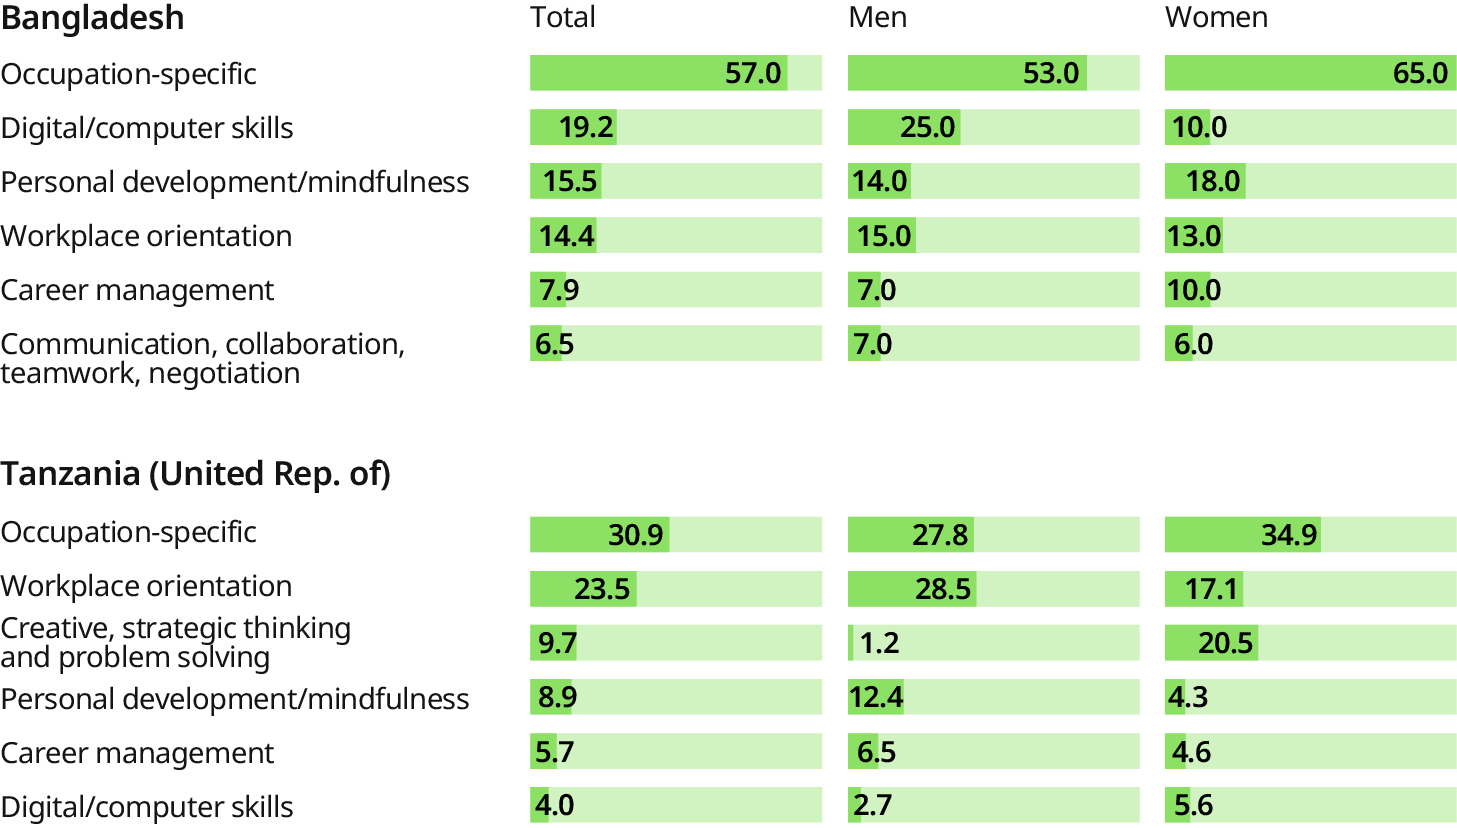
Note: The number of participants who engaged in training in Fiji was too low to carry out a similar analysis.
Source: ILO lifelong learning surveys for Bangladesh (2023) and the United Republic of Tanzania (2025).
Gaps between sexes do emerge across different types of training. For example, in Bangladesh, the male participation rate for digital/computer skills training is 25 per cent, compared to just 10 per cent for females. This gap likely stems from women’s more limited access to ICT equipment in low- and middle-income countries, traditional gender roles, societal norms and systemic barriers within educational systems that disproportionately impact women (Martínez-Cantos 2023; Singh 2017). In particular, unpaid care work, which is disproportionately carried out by women, can affect training opportunities and content by limiting the time available for career development (OECD 2018). Similarly, male participation rates are higher than female rates for workplace orientation training in both countries. In contrast, participation in occupation-specific training is notably higher among women.
The surveys also ask about respondents’ specific learning needs and the types of training they feel they require or would benefit from. Figure 2.15 shows the training needs in Bangladesh and the United Republic of Tanzania, disaggregated by age. Across all age groups, a significant share of respondents in both countries indicated a need for training in new technical skills. Digital and computer skills were frequently in demand, particularly among younger respondents, reflecting the importance of ICT proficiency. Meanwhile, people aged 25 or above, particularly older workers, expressed relatively little need for digital skills. There is also strong interest in technical training among adults and older workers, suggesting a desire for upskilling, career changes or continuous professional development. Respondents also placed a significant emphasis on personal development and mindfulness, particularly adults and older workers, possibly for career sustainment or transitioning to post-retirement activities.
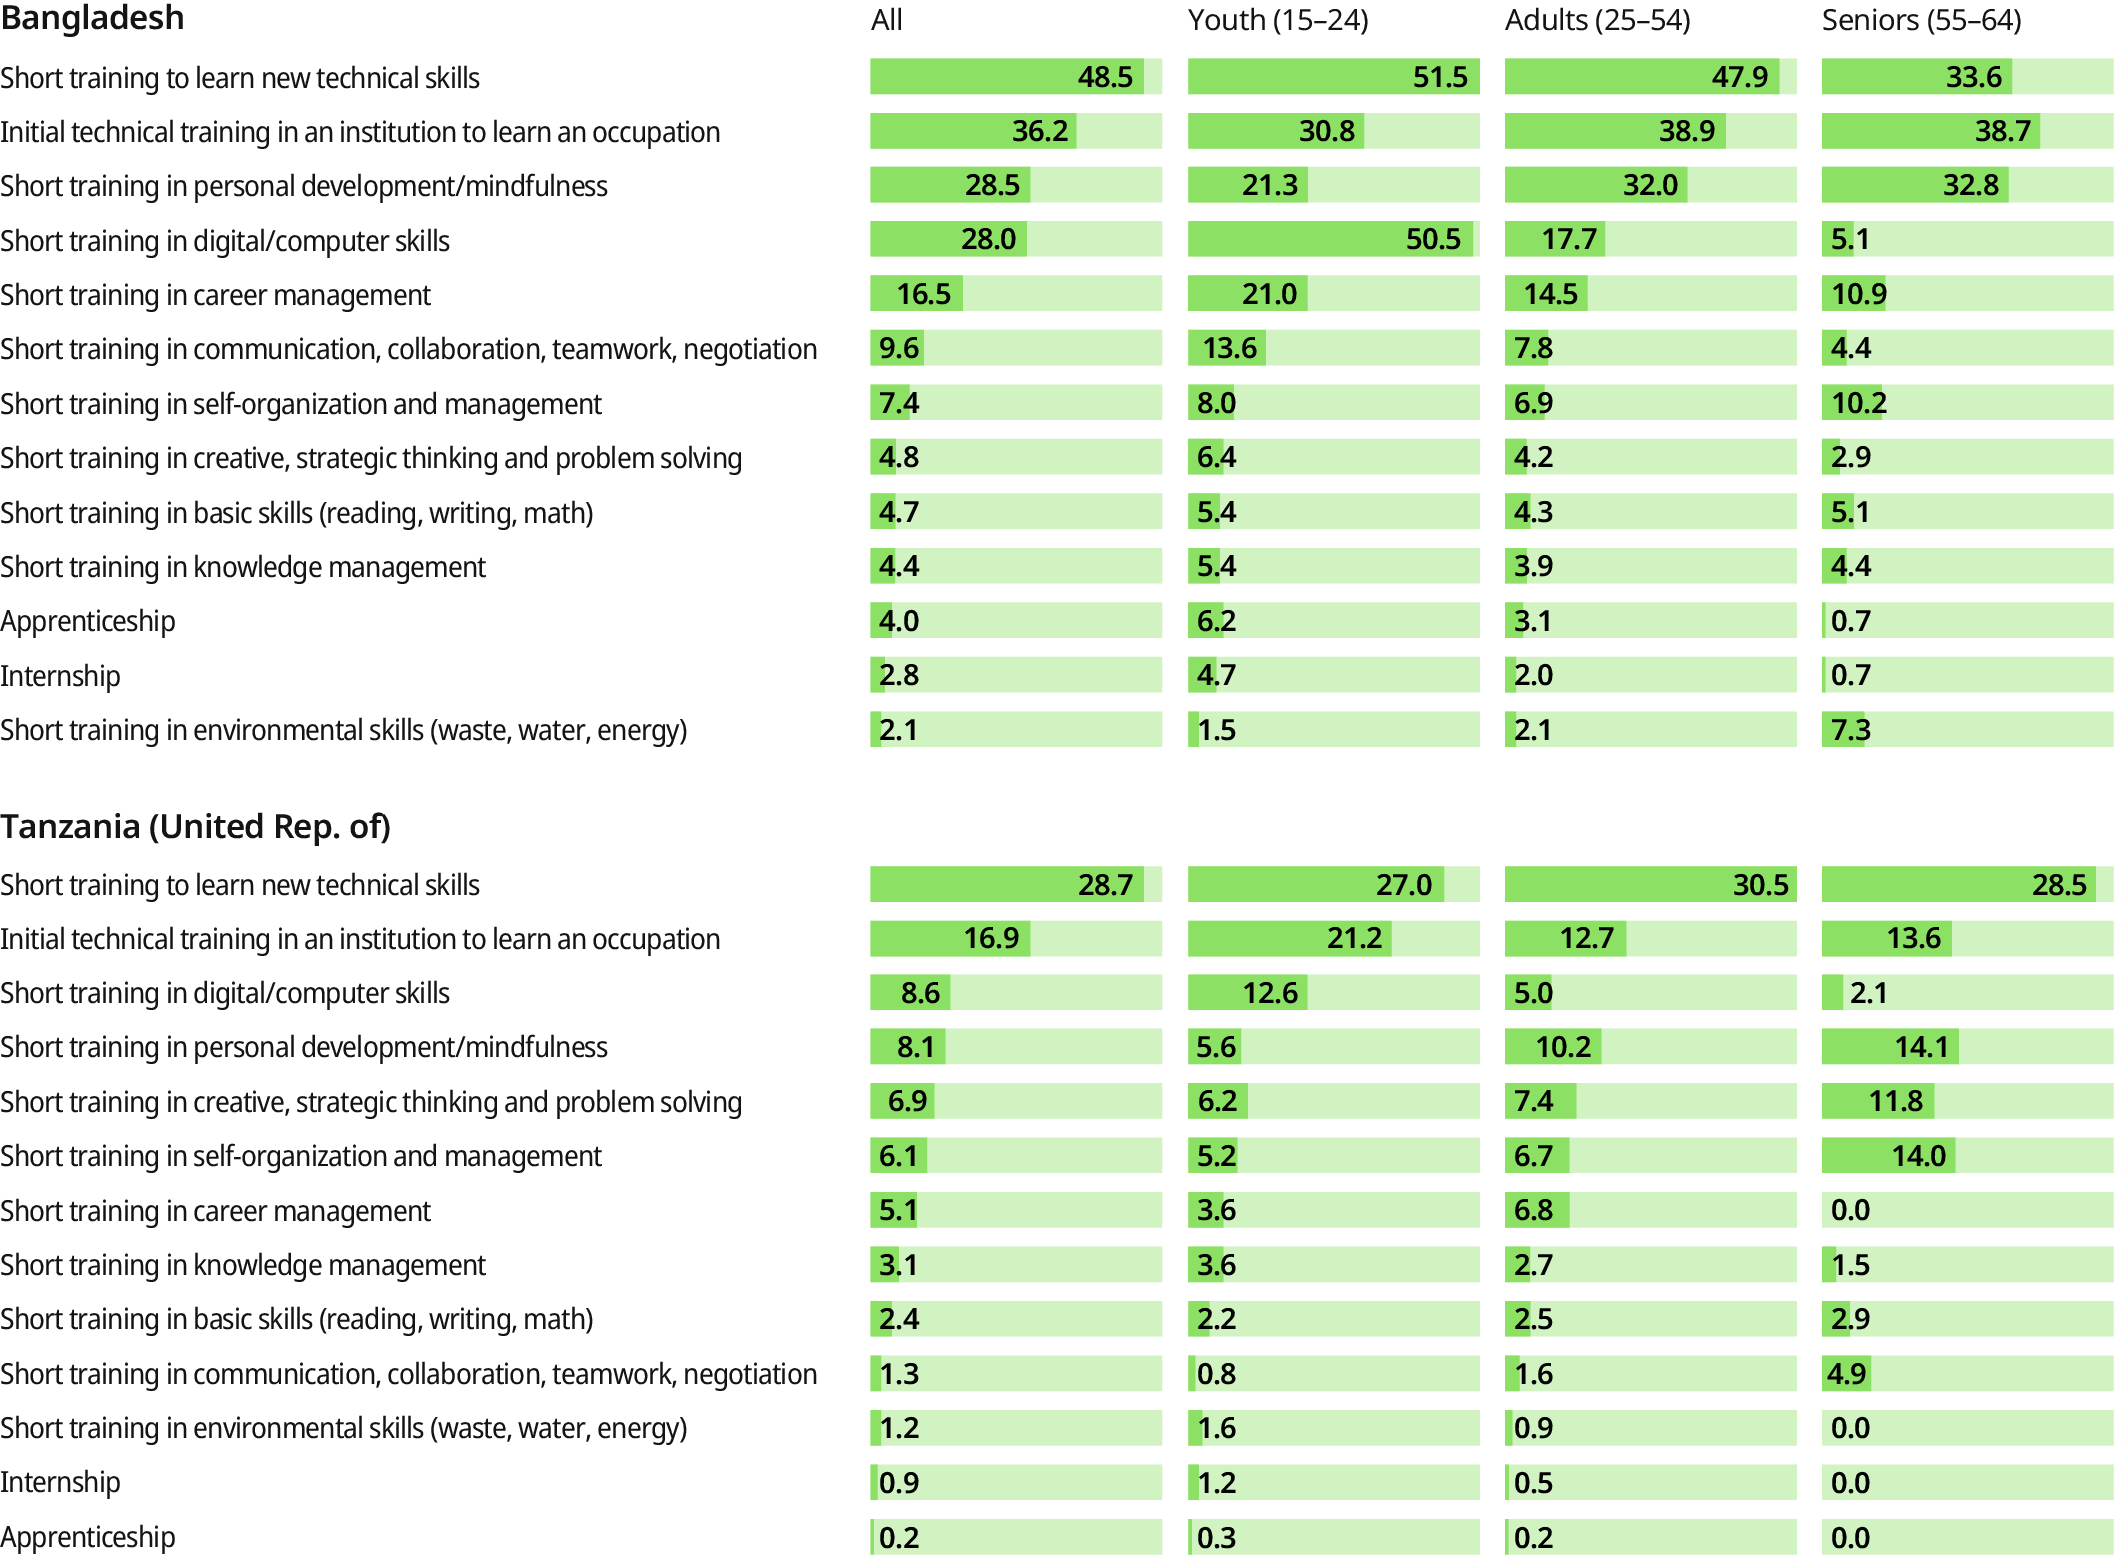
Note: The figure explores the question: “Do you believe you need training to improve your employment prospects or develop a new activity?”, which was asked to non-employed respondents. In Bangladesh, it was asked as a multiple-choice question, while in the United Republic of Tanzania, only one answer was possible. The number of respondents to this question in Fiji was too low to carry out a similar analysis.
Source: ILO lifelong learning surveys for Bangladesh (2023) and the United Republic of Tanzania (2025).
Surprisingly, relatively few respondents in both surveyed countries mentioned the need to acquire environmental skills. Rather than lack of interest, these low shares may stem from the broader challenge of identifying the specific content of green skills and understanding the types of jobs that will require them (Eurofound 2023), as well as the benefits of investing in these skills (see Chapter 4). This highlights a critical knowledge gap that warrants further research. Chapter 4 addresses this issue by identifying green skills and skills for green jobs, as well as exploring their relationship with wages and other non-wage job characteristics.
Alongside age-related differences, training needs may also vary between population groups. Existing research has examined training interventions that support persons with disabilities in the labour market, particularly in terms of employability and job retention (Bartram and Cavanagh 2019; Thomas and Morgan 2021). However, further evidence is needed to fill persistent knowledge gaps, especially in low- and middle-income countries.
Straddling formal and non-formal learning: Apprenticeships and internships
Apprenticeships and internships straddle both formal and non-formal learning. Quality apprenticeships integrated into formal education, such as TVET, combine classroom-based instruction with structured workplace learning (ILO 2023a), in what is normally called alternance training. While the Quality Apprenticeships Recommendation, 2023 (No. 208), advocates for the establishment of regulatory frameworks that promote quality apprenticeships, informal apprenticeships remain especially common in countries with large informal economies and are often found in trades like carpentry or masonry (Hofmann et al. 2022). These traditional or informal apprenticeships, which benefit from non-formal learning, are implemented fully in workplaces of many informal economy activities, such as traditional artisan workshops where senior craftspeople train apprentices (ILO 2023a, para. 43).
Meanwhile, internships are a form of work-based learning that usually does not lead to learning credential, internship certificates serving essentially as proof of participation and completion. They allow students to gain practical work experience through shorter, less structured placements that often have fewer regulatory requirements, differ in pay and recognition, and typically lack a learning curriculum. (ILO, n.d.; Inter-agency Group on Technical and Vocational Education and Training 2017).36
Figure 2.16, based on LFS microdata compiled by the ILO, shows that apprenticeships and internships are more prevalent in low-income countries. This pattern reflects the widespread use of traditional or informal apprenticeships in many low- and middle-income countries in sectors where informal employment predominates (ILO 2023c). While formal apprenticeships integrated into TVET programmes normally adhere to regulatory requirements for rights and obligations, traditional apprenticeships in many low- and middle-income countries rely on local practices and typically fall outside such frameworks – posing challenges for quality assurance in countries with limited institutional capacity and large informal sectors (World Bank, UNESCO and ILO 2023).
-
Figure 2.16. Distribution of country-level shares of working-age population currently participating in internships or apprenticeships, 2023 or latest available year, by country income group (percentage)
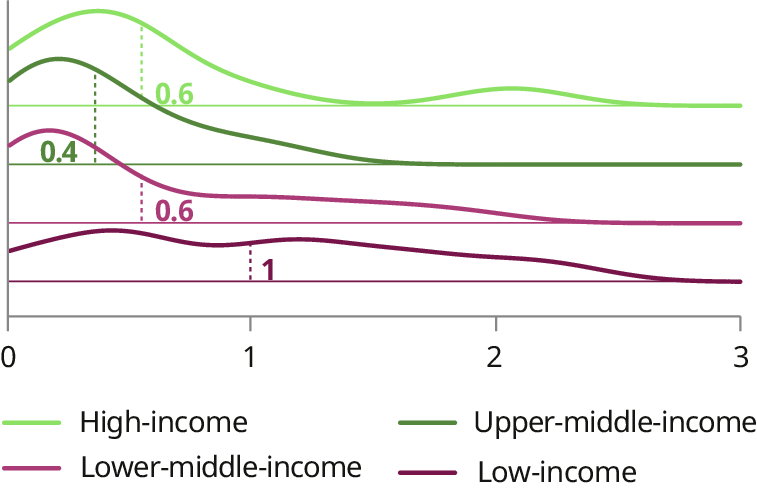
Note: For this figure, the high-income group includes 9 countries and territories; the upper-middle-income group, 14; the lower-middle-income group, 19; and the low-income group, 14.
Each country is weighted equally. Dashed vertical lines show the average of each country income group.
Source: ILO Harmonized Microdata Collection (ILOSTAT).
The figure also shows that only a small share of the working-age population (up to 3 per cent) is currently participating in an internship or apprenticeship across all income groups. This is unsurprising, as these estimates reflect only those actively engaged at the time of the survey. Moreover, LFS do not fully capture traditional forms of learning or the ambiguous status of contributing family members (ILO 2023c). Additional measurement gaps compound this issue: only about 25 countries include specific questions to identify apprenticeships, while many questions fail to distinguish between apprenticeships, internships and other types of traineeships. Definitions of these terms can also vary across countries and within countries over time (ILO 2023a).
The ILO lifelong learning surveys help address some of these gaps by including specific questions on apprenticeships and internships. These surveys clarify the scope of national LFS indicators by distinguishing between apprenticeships and internships, and capturing both past and current experiences. Figure 2.17 illustrates the apprenticeship and internship experiences of working-age men and women in Bangladesh, Fiji and the United Republic of Tanzania. In Bangladesh, around 18 per cent of men and 11 per cent of women have participated in an apprenticeship. In Fiji, apprenticeship participation is below 1 per cent for both sexes. In the United Republic of Tanzania, male participation stands at 8 per cent compared to 6 per cent for women.
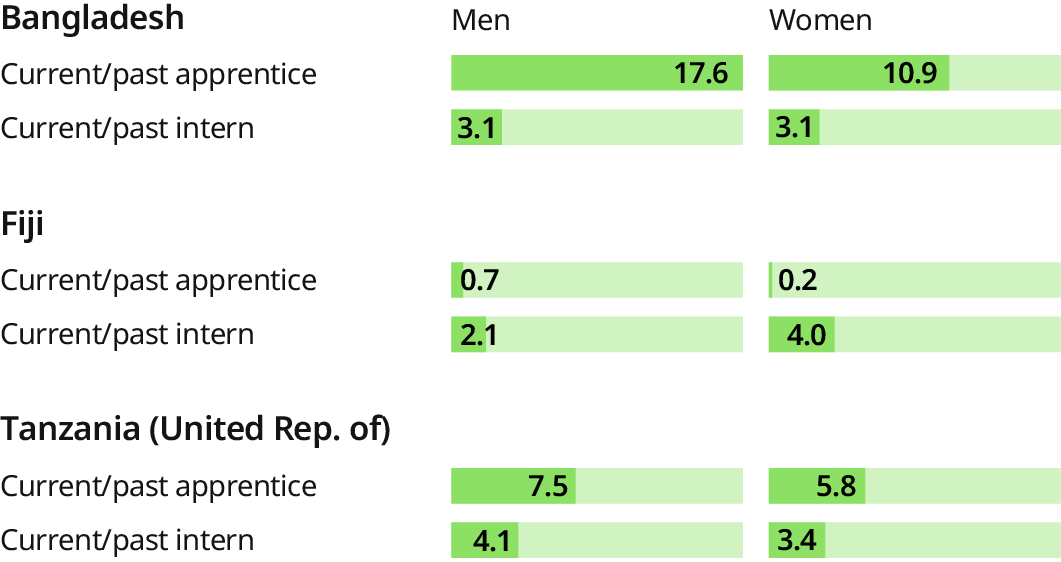
Source: ILO lifelong learning surveys for Bangladesh (2023), Fiji (2025) and the United Republic of Tanzania (2025).
Participation in internships is low across all three countries. In Bangladesh, only 3 per cent of both men and women report current or past internships experience, with no notable differences between sexes. In Fiji, 4 per cent of women have participated in internships, slightly higher than the 2 per cent observed for men. In the United Republic of Tanzania, internship participation is 4 per cent among men and 3 per cent among women. This indicates that apprenticeships are more prevalent than internships in Bangladesh and the United Republic of Tanzania, and are more often geared towards men.
The ILO lifelong learning surveys go further by assessing the perceived usefulness of the apprenticeship and internship experiences. Figure 2.18 shows that improved job performance and increased job search success consistently rank among the top three benefits mentioned by respondents in Bangladesh, Fiji and the United Republic of Tanzania. Other highly ranked benefits include better salary prospects, job search success and enhanced workplace integration, while personal development was also frequently reported by respondents in Bangladesh and Fiji.
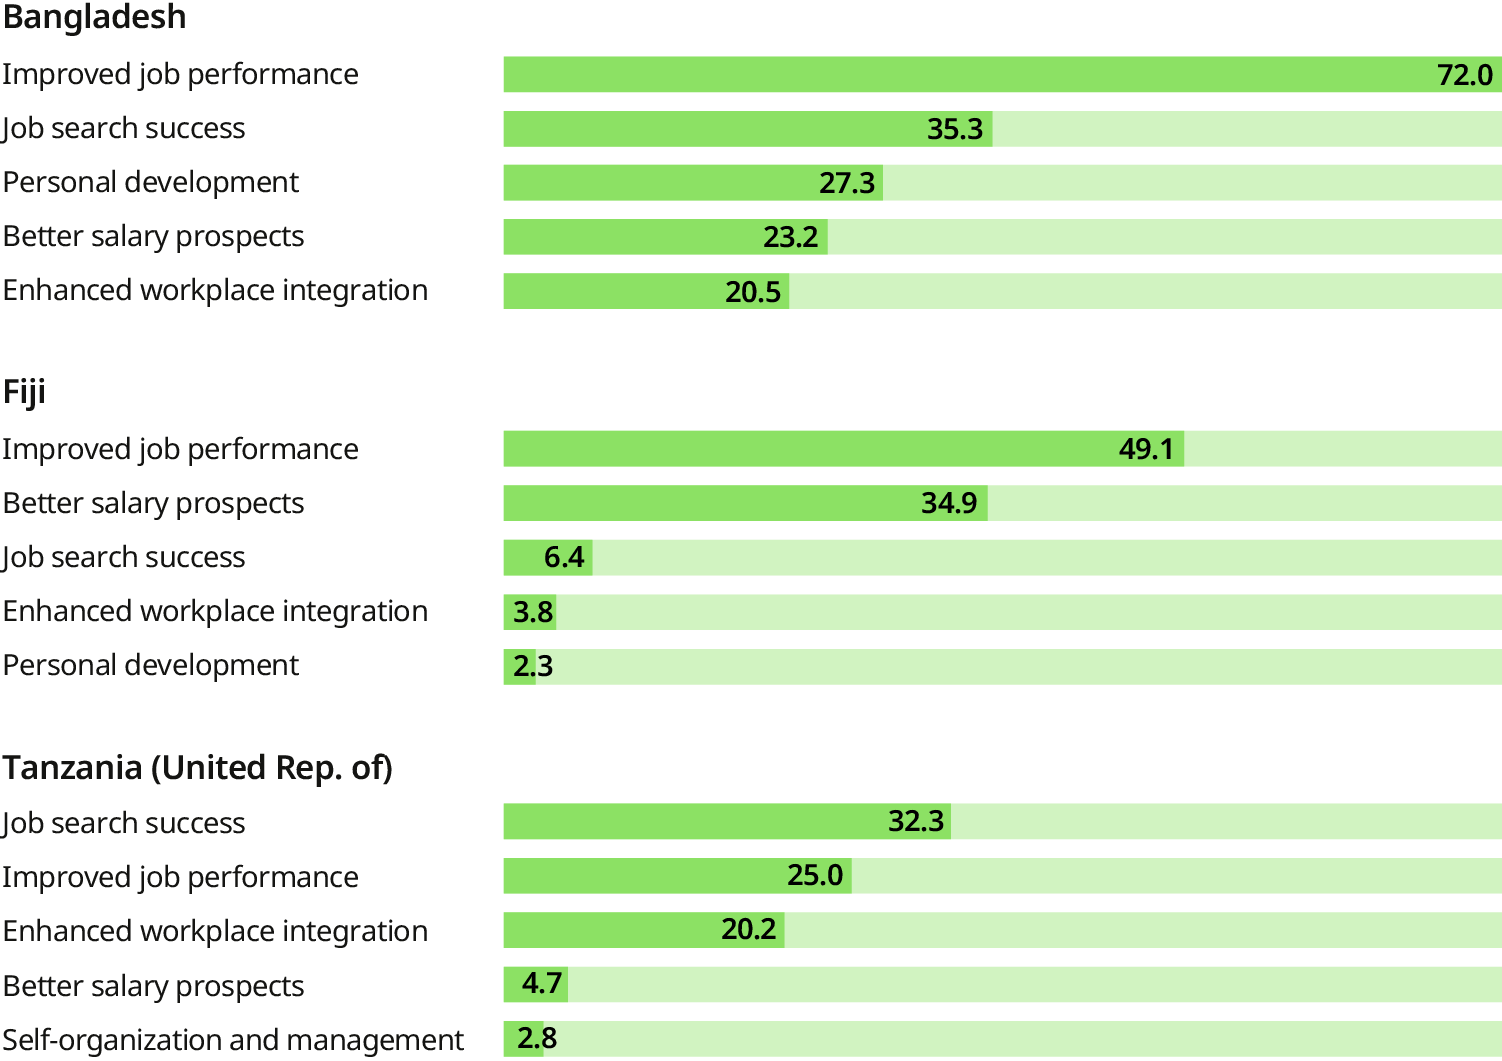
Note: Respondents in Bangladesh could select multiple answers among a list of 14 benefits. In Fiji and the United Republic of Tanzania, respondents selected one among 14 benefits.
Source: ILO lifelong learning surveys for Bangladesh (2023), Fiji (2025) and the United Republic of Tanzania (2025).
Informal learning: Participation and application
Informal learning can be described as intentional but not institutionalized, and is less structured than formal and non-formal learning (ILO 2023a). Various activities fall under informal learning, such as learning by doing (also called experiential learning (ILO 2023a)), learning from supervisors and co-workers, or self-teaching. Current transformations in the world of work, such as new ways of working that have emerged in the context of evolving ICT, have been shown to have the potential to increase informal learning (Gerards, de Grip and Weustink 2021).
The PIAAC database includes questions about the frequency of learning from co-workers and supervisors, keeping up to date with new products or services, and learning by doing. Figure 2.19 presents the minimum, maximum and mean shares of individuals who reported participating in these activities daily or weekly. While there is variation across countries, frequent participation in informal learning is common. For example, more than a quarter of the employed population reports learning from co-workers or keeping up to date on a daily or weekly basis. For learning by doing, the share is even greater, with half of the employed population engaging in this activity daily or weekly, on average, across countries.
-
Figure 2.19. Frequency of informal learning on a daily or weekly basis in the employed population (percentage)
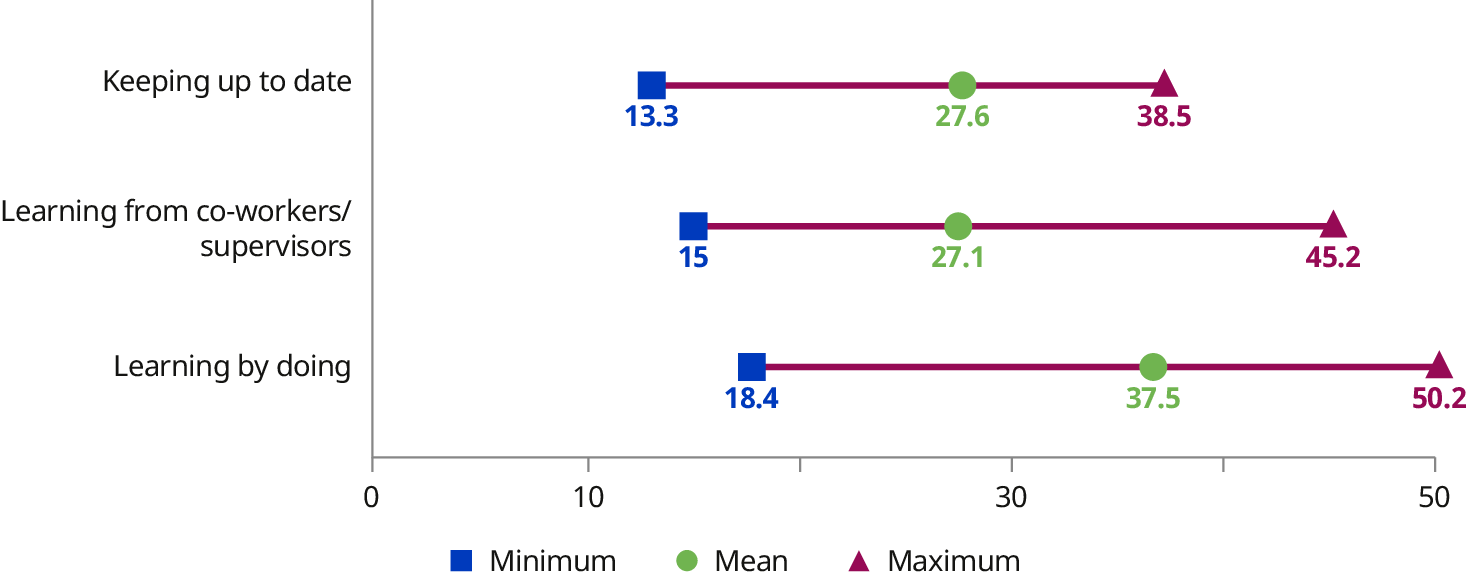
Note: Data were collected between 2011 and 2017 for Austria, Belgium, Canada, Chile, Denmark, Ecuador, Finland, France, Germany, Greece, Hungary, Ireland, Israel, Italy, Japan, Kazakhstan, Lithuania, Mexico, Netherlands, New Zealand, Norway, Peru, Poland, Russian Federation, Singapore, Slovenia, Spain, Sweden, United Kingdom and United States.
Source: OECD, “Survey of Adult Skills (PIAAC)”.
The ILO lifelong learning surveys shed light on formal and informal workers’ access to informal learning. Figure 2.20 highlights marked disparities in the types of informal learning available to formal and informal workers within their current workplaces. Informal workers predominantly rely on learning by doing in all three countries, with participation rates higher than those of formal workers. This trend is consistent with existing literature showing that informal workers, who are frequently own-account workers, often depend on self-teaching or workplace-based learning by doing (Palmer 2020), due to fewer opportunities for interaction with supervisors or colleagues.
-
Figure 2.20. Type of informal learning received in the workplace by formal and informal workers (percentage)
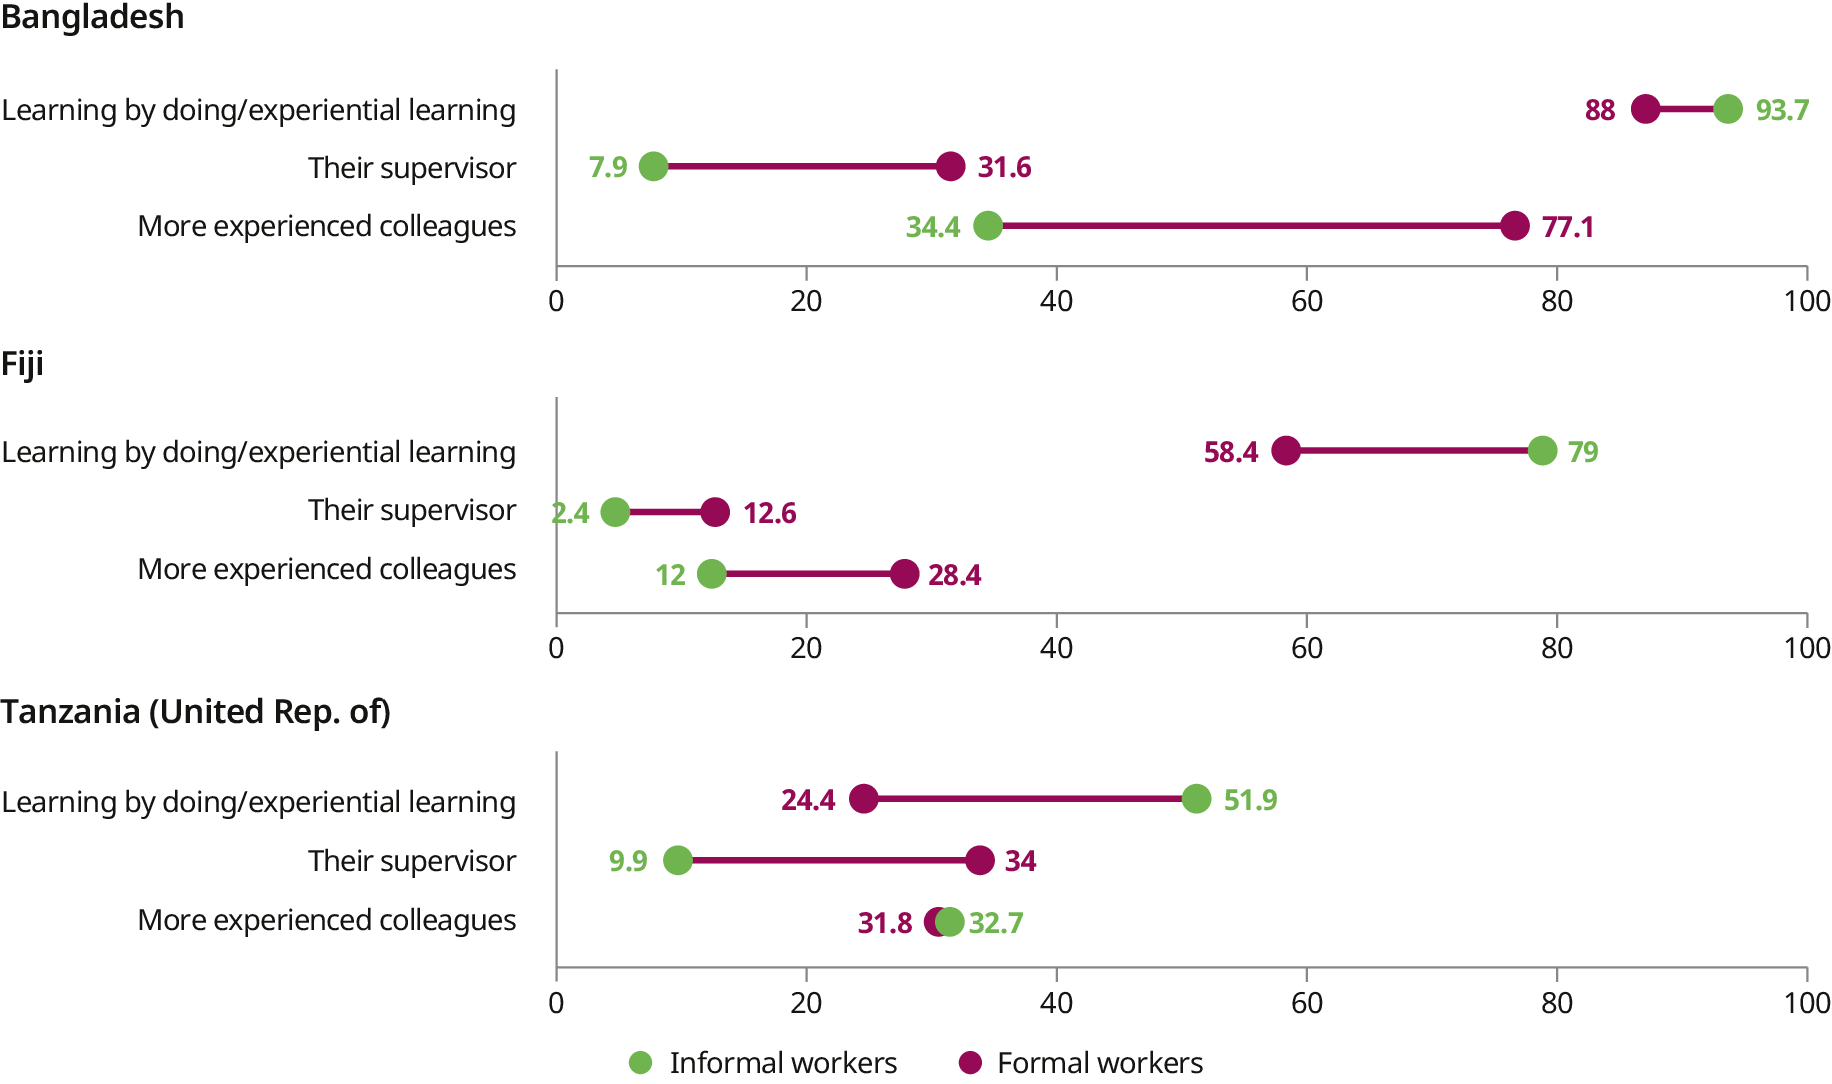
Note: Respondents in Bangladesh could select more than one form of informal learning. For Fiji and the United Republic of Tanzania, respondents had to choose one among the three options.
Source: ILO lifelong learning surveys for Bangladesh (2023), Fiji (2025) and the United Republic of Tanzania (2025).
In contrast, formal workers report greater access to other forms of informal learning that require workplace interaction. For instance, In Bangladesh, more than three quarters (77 per cent) of formal workers report learning from more experienced colleagues, compared to just 34 per cent of informal workers. Similarly, 32 per cent of formal workers report learning from supervisors, whereas only 8 per cent of informal workers do so. When asked about the applicability of the workplace learning gained from co-workers and supervisors, most respondents in Fiji and the United Republic of Tanzania indicated it was both firm-specific and general (figure 2.21). By contrast, in Bangladesh, only about one third view it as both, 40 per cent indicating it was primarily firm-specific. This suggests that such informal learning is not always easily transferable to other employers.
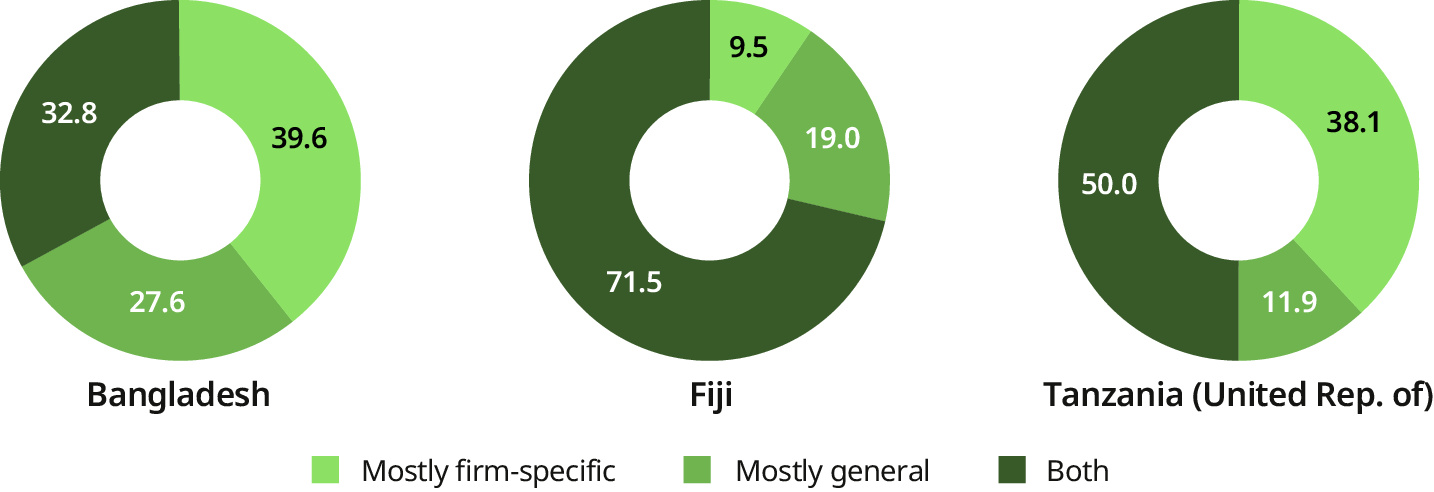
Source: ILO lifelong learning surveys for Bangladesh (2023), Fiji (2025) and the United Republic of Tanzania (2025).
Different types of learning can complement one another, particularly non-formal and informal learning. Evidence from OECD countries highlights complementarity between job-related training and informal learning, especially among temporary employees (Ferreira, de Grip and van der Velden 2018). This may be because formal training not only enhances workers’ skills but also strengthens their capacity to learn informally on the job.
2.3.3. The central role of employers’ and workers’ organizations
As noted in Chapter 1, trade unions play a vital role in shaping the world of work, particularly by promoting decent working conditions and social justice. In this framework, trade unions contribute to promoting learning activities, including through the support of learning initiatives.
In this regard, trade unions advocate for workers’ rights to education, including as part of collective bargaining processes (Bridgford 2017). Beyond the roles emphasized in ILO instruments (see section 1.3.1), they help ensure that workers are informed about their rights and entitlements in the workplace through the learning activities they organize. Trade unions can also act as “learning ambassadors” encouraging workers to engage in training and collecting information on learning needs (EESC 2022). Their presence in the workplace has been found to be associated with an increase in training opportunities (Addison and Belfield 2007).
Globally, however, trade union density rates – indicating the share of employees who are trade union members – remain low, at approximately 11.2 per cent (ILO 2022), and have been declining over time. This trend is concerning, as it may hinder the capacity of unions to facilitate learning opportunities for workers (Bridgford 2017), and it weakens the ability of social partners to collectively respond to the evolving skills demand.
Employers’ organizations also play an important role in enabling learning, alongside their contributions to social dialogue and other core functions. One of their key roles is to provide services to members, including the provision of up-to-date information (ILO 2025). However, available evidence suggests that membership in employers’ organizations remains low in some parts of the world, including in certain OECD countries (OECD 2017).
In light of the decline in trade union density rates and low levels of membership in employers’ organizations, promoting the right to freedom of association – and ensuring its effective realization – is essential. Equally important is raising awareness among social partners of the importance of their role in supporting lifelong learning and skills development.
2.4. Broader societal learning dimension
While learning through education and work forms the core of individuals’ lifelong learning paths, a significant share of learning occurs through interactions within broader society – including family, community or voluntary organizations. This form of learning reflects what Osborne and Borkowska (2017, 270) describe as “the embedding of learning within all aspects of life’s activities” and involves the active participation of different segments of society. Broader societal learning matters for several reasons.
Firstly, societies profoundly shape individuals’ lifelong learning by instilling values and norms from an early age through familial, cultural and institutional channels. These foundational values shape attitudes toward learning and personal development throughout life (Pirrie 2005). Secondly, collective learning within societies empowers individuals and contributes to the development of collective capabilities (ILO 2023d). Such capabilities transcend individual human capital accumulation and foster a more adaptable and resilient community (Yorks and Barto 2015). As such, they enable social groups to innovate, establish consensus on social goals and transform organizations to enhance overall societal well-being (Formenti and Hoggan-Kloubert 2023; ILO 2023d). However, these benefits materialize only when societal values are inclusive, as inclusivity has the potential to foster greater social cohesion and enhance the quality of lifelong learning by embracing diverse perspectives. Inclusive societal learning ensures that marginalized groups actively participate in society, thereby enriching the collective learning experience.
This section examines the broader societal dimension of lifelong learning, recognizing that existing indicators and concepts may not fully capture its scope. While no standardized statistical framework exists to measure societal learning, social participation can serve as a meaningful proxy for the extent of learning beyond education and the world of work. Participation in volunteer organizations and membership in employers’ or workers’ organizations – some of which engage individuals beyond their immediate workplace – can reflect learning that occurs outside formal education and structured work-based training (section 2.4.1). Additionally, the efforts of individuals to seek external sources of information can indicate a willingness to learn and adapt, while also serving as a means of acquiring new perspectives and knowledge from societies beyond their immediate environments (section 2.4.2). Rather than providing an exhaustive assessment, the indicative measures in this section aim to offer a tangible sense of individuals’ exposure to societal learning. Together, these proxies help illuminate how learning unfolds in broader social contexts.
2.4.1. Engagement in opportunities for societal learning
Family is certainly the first environment where human beings interact with others and develop social relationships of varying intensity and duration. For example, the involvement of parents, carers and family members in nurturing children’s curiosity is essential for fostering an interest in science-related careers and encouraging participation in social activities related to science learning (Chakraverty et al. 2018). In addition, other types of social relationships – such as friendships, collaboration in organizations and informal contact with neighbours – provide a rich set of experiences that are significant for individuals (Granovetter 1973).
In this framework, employers’ and workers’ organizations play a key role in promoting and enabling societal learning beyond the world of work. They are part of a broader network of organizations that enable individuals to use their voice, engage with governments and participate in decision-making (OECD 2022), while also fostering awareness of rights and learning opportunities.
However, beyond the role played by social partners, other forms of engagements may also foster learning within society (Fouarge et al. 2018). Figure 2.22 shows various dimensions of volunteer engagement with the community. Volunteer engagement reflects an individual’s ability and willingness to engage in collective learning, thereby enhancing collective capabilities as people learn from each other. Higher levels of volunteer engagement can also indicate a greater capacity to disseminate information throughout society, fostering broader societal learning. The figure shows that, globally, the share of individuals who are active members of community organizations varies from 4 to 20 per cent, depending on the organization. Among all organizations, active membership in religious organizations is the most common (20 per cent of the population), followed by sports or recreational organizations (about 13 per cent).
-
Figure 2.22. Share of the population in active volunteer engagement, by type of organization (percentage)
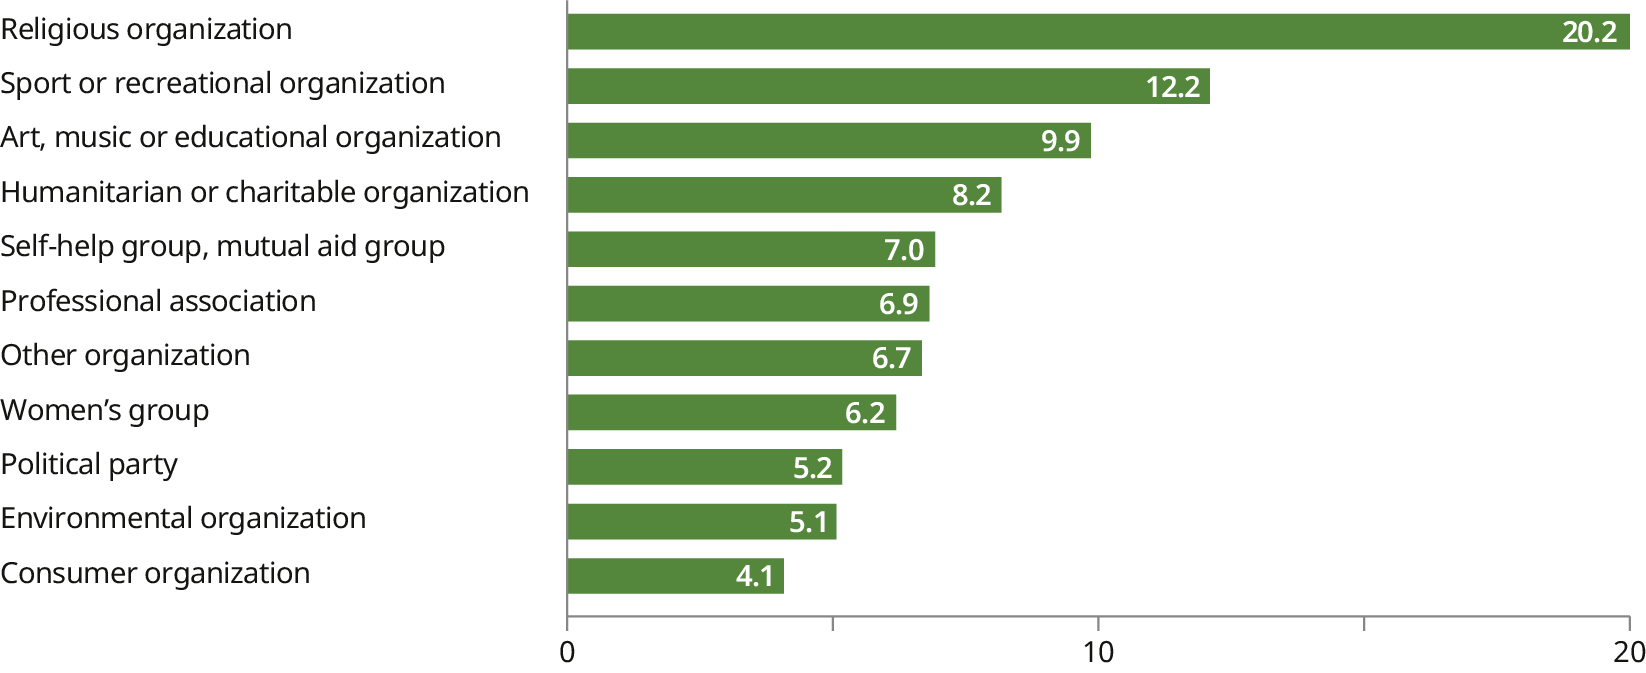
Note: All values are unweighted averages of the country-level average of each variable. The World Values Survey (WVS) Wave 7 was conducted in 66 countries and territories between 2017 and 2023.
Source: Haerpfer et al. (2022).
There is notable variation among regions in terms of the most popular form of voluntary engagement in organizations (figure 2.23). Religious organizations are the most popular in Africa, the Americas and Asia and the Pacific. In contrast, professional organizations are most popular in the Arab States.37 In Europe, the two most common volunteer memberships are sports or recreational organizations, and religious organizations. However, the region has low membership rates in general. In Central Asia, political party membership is the highest among all regions, but still lower than sports or recreational organizations, and art, music and educational organizations in the region.
-
Figure 2.23. Share of the population in active volunteer engagement, by type of organization and region (percentage)
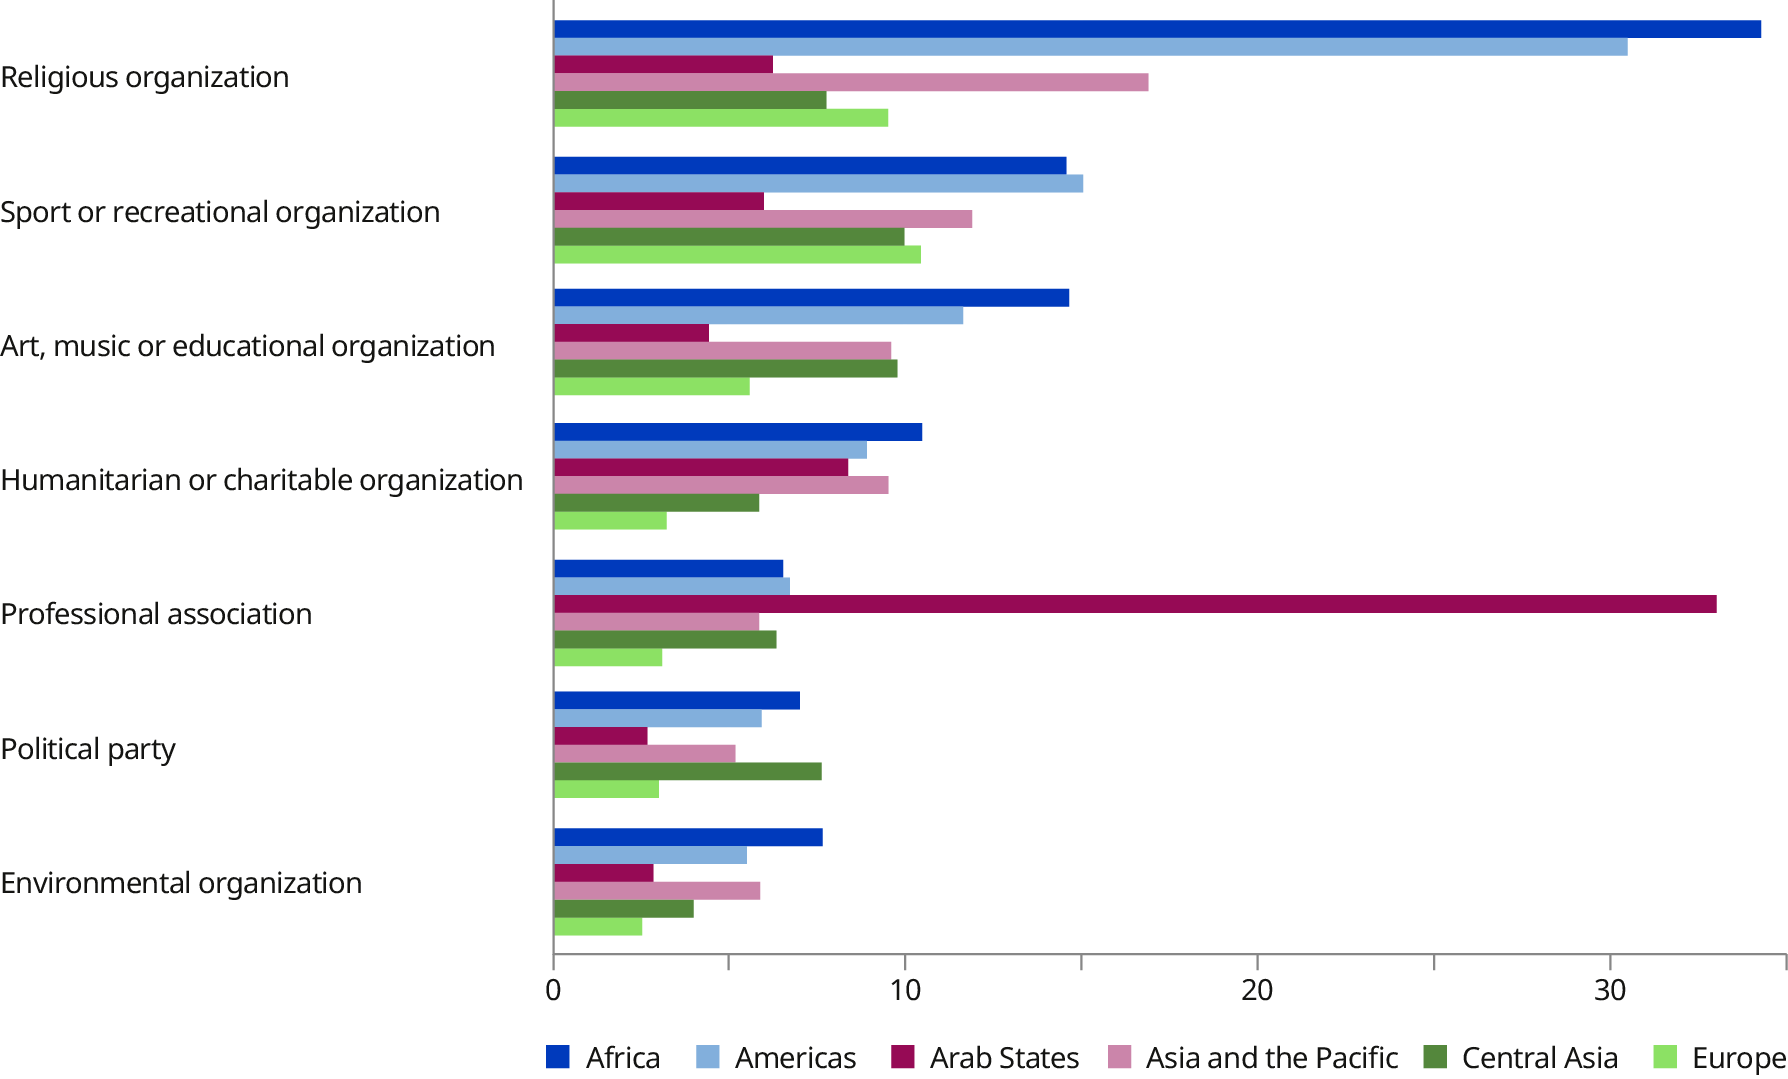
Note: All values are unweighted averages of the country-level average of each variable. The World Values Survey (WVS) Wave 7 was conducted in 66 countries and territories between 2017 and 2023.
Source: Haerpfer et al. (2022).
2.4.2. Willingness to learn in society
One measure of societal learning is the extent to which the public regularly seeks external sources of information. While following current affairs may not always constitute structured or intentional learning, it plays a key role in fostering civic awareness, social engagement and critical thinking (Lassen 2005). In this sense, staying informed contributes to societal learning by shaping how individuals interpret and respond to the world around them (Campante, Durante and Sobbrio 2018), even if it does not directly align with formal education or skills-based learning. At the same time, the risks associated with misinformation and information overload underscore that learning through information depends not only on access to and quantity of information, but also on its quality and reliability (Azzimonti and Fernandes 2023).
The World Values Survey captures the frequency and sources from which external information is sought. Figure 2.24 shows that a large share of the global population seeks information on a daily basis across 58 countries. The most common sources people use daily to learn about current events locally and globally are TV news, mobile phones, the internet and social media. On average, about 60 per cent of people seek information daily from TV news, while about 50 per cent do so from their mobile phones. Radio news, email and the daily newspaper are the least frequently used sources for daily information. Recent studies also highlight the popularity of new sources of information (particularly AI chatbots) for finding information (Chatterji et al. 2025).
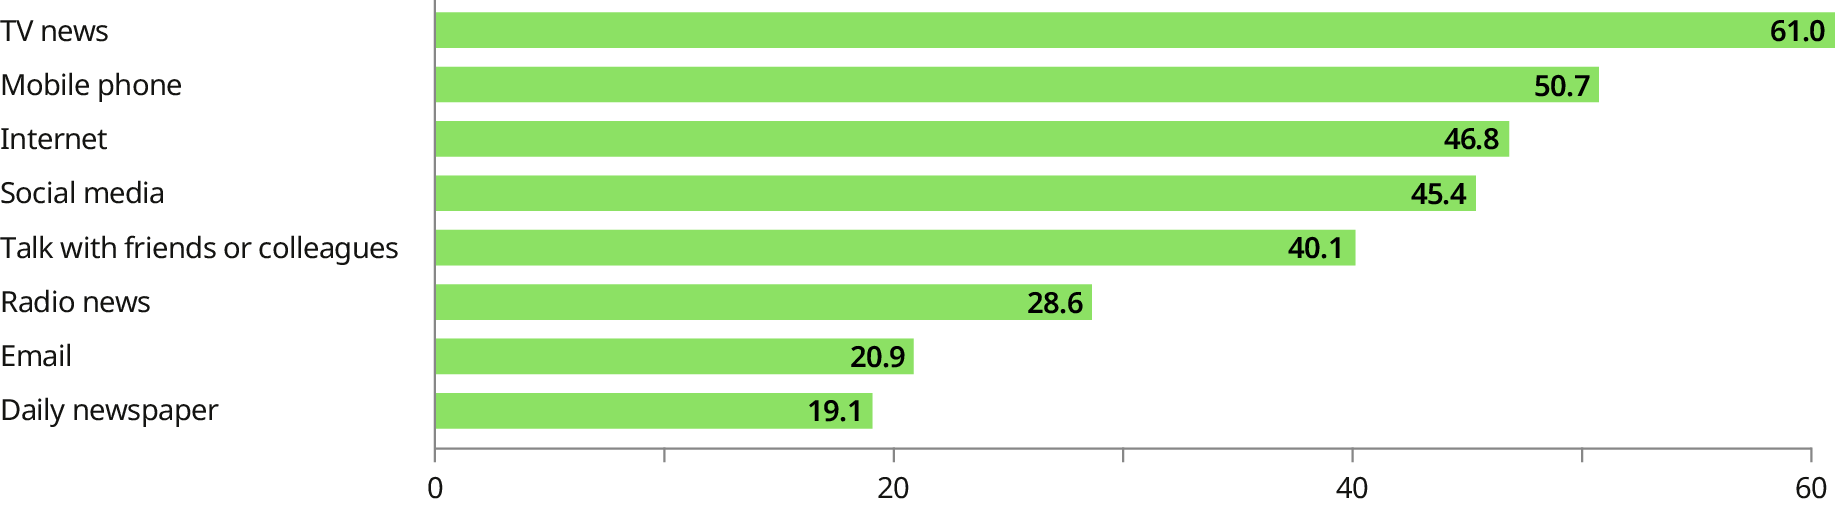
Note: All values are unweighted averages of the country-level average of each variable. The World Values Survey (WVS) Wave 7 was conducted in 66 countries and territories between 2017 and 2023.
Source: Haerpfer et al. (2022).
Access to reliable information also empowers individuals and communities to make informed decisions and promote social progress. Research shows that expanding media access can shift social norms and behaviours. For example, cable television in India was associated with greater autonomy for women and reduced acceptance of domestic violence (Jensen and Oster 2009). Also, access to community radio in Benin encouraged households to invest in public health goods, such as malaria prevention (Keefer and Khemani 2016). Beyond these outcomes, access to information underpins societal learning about rights where community-based organizations play a crucial role – for example, by raising awareness of harmful practices, such as child labour and supporting affected families (Thévenon and Edmonds 2019).
When analysing these statistics by country income group, a clear trend emerges: the higher the country income level, the larger the share of individuals who seek information from various sources daily. Figure 2.25 illustrates that, with the exception of mobile phone and radio, individuals in low-income countries have the lowest proportion of daily information seekers compared to other country income groups. Limited access to ICT is a key factor driving these disparities. In low-income countries, restricted internet accessibility limits people’s ability to use technology-dependent information sources, such as the internet and email. Supporting this, Hanafizadeh, Saghaei and Hanafizadeh (2009) show that ICT access is strongly correlated with gross national income. Moreover, lower literacy rates in low-income countries may reduce engagement with newspapers, making people more reliant on oral sources of information, such as conversations with friends and colleagues or radio news.
-
Figure 2.25. Share of the population using daily information sources, by country income group (percentage)
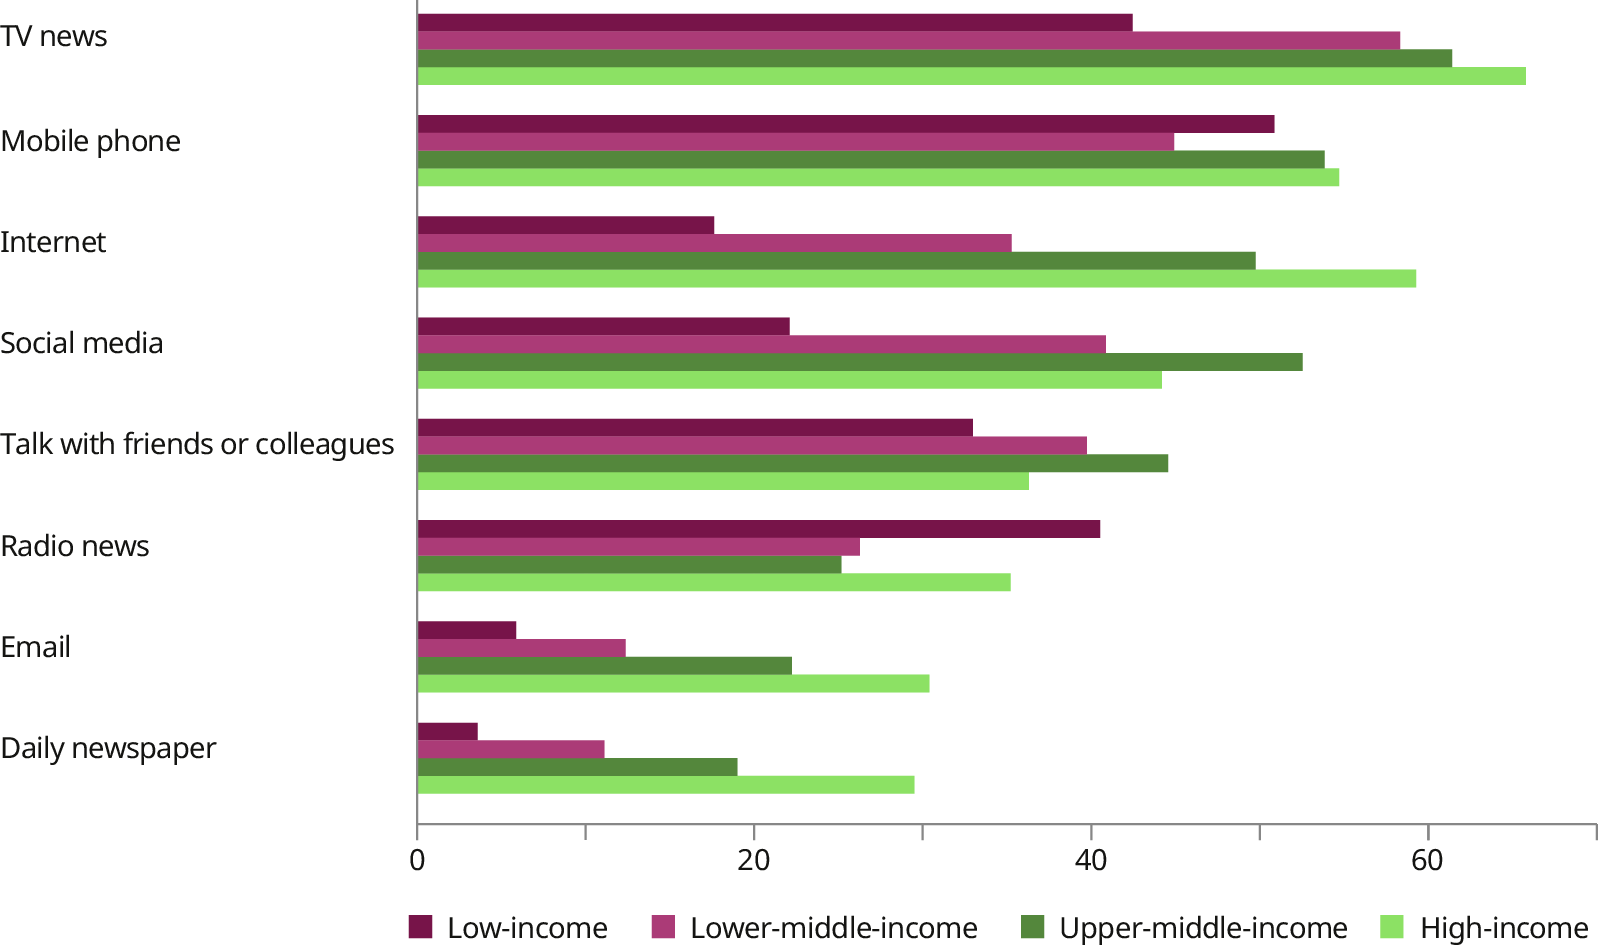
Note: All values are unweighted averages of the country-level average of each variable, within each country category. The World Values Survey (WVS) Wave 7 was conducted in 66 countries and territories between 2017 and 2023.
Source: Haerpfer et al. (2022).
According to WVS data, significant regional variations also emerge regarding the preferred sources of information. In the Arab States, a larger proportion of individuals rely on social media, followed by TV news – likely reflecting constraints on the freedom of the press (RSF, n.d.). In Africa, relatively more people acquire information from radio news, a pattern likely connected to restricted ICT accessibility and lower educational attainment.
However, it is important to note that information may also undermine opportunities for societal learning. For example, there is a widespread concern about the link between participation in online social networks and political polarization. This occurs through the creation of echo chambers, where individuals receive highly personalized messages that reinforce their existing opinions and biases. This phenomenon is known as the personalization–polarization hypothesis (Keijzer, Mäs and Flache 2024). The dynamics of opinion formation and the influence of social media are complex, with individuals’ responses mediated by various factors. Consequently, even small differences in message personalization can significantly impact the overall opinion dynamics, either increasing or decreasing polarization (Keijzer and Mäs 2022). Also, the ideological segregation of online networks, which groups like-minded individuals together, has been found to create echo chambers that facilitate the spread of misinformation (Stein, Keuschnigg and van de Rijt 2023).
Opportunities for societal learning are essential, but they are insufficient if access is unequal – especially for marginalized groups who often face significant barriers to accessing available opportunities. For example, research has shown that persons with disabilities may struggle to access certain information sources (Perrin and Atske 2021). Meanwhile, when a society places greater value on the views of one group over another, the quality and benefits of societal learning decline (Fricker 2007; ILO 2023d). Yet, data on participation rates across different population groups remain scarce, highlighting the need for further research and more inclusive data collection in this area.
2.5. Conclusion
This chapter has explored the current state of lifelong learning within the realms of education and work, while also assessing the extent of individual engagement in societal learning. The assessment of lifelong learning in formal education revealed a strong correlation between a country’s income level, its investment in education and educational outcomes. High-income countries typically exhibit greater investment in education and achieve higher literacy rates and proficiency in subjects like mathematics. Moreover, disparities between sexes in education decrease as countries progress from lower- to higher-income groups, suggesting that women face greater exclusion from the education system in low-income countries. However, differences within country income groups suggest that learning opportunities are also shaped by factors, such as education policy choices and their implementation, the strength of social protection systems (which help mitigate poverty-related barriers to education) and prevailing cultural attitudes towards learning.
In the world of work, understanding who benefits from lifelong learning opportunities is central for policy design. Data show that workers in full-time permanent jobs within formal enterprises have greater learning opportunities than the broader working-age population, which also includes informal, unemployed and self-employed workers. The ILO lifelong learning surveys confirm that informal workers and those with lower education levels rely mostly on informal learning, particularly learning by doing. This highlights the need for targeted policies to support these groups.
With regard to learning activities, TVET plays an important role. While high-income countries tend to report higher participation, low-income countries often show lower engagement – potentially reflecting limited emphasis on vocational training or capacity constraints. According to the ILO lifelong learning surveys, many TVET recipients report benefits in terms of gaining qualifications and advancing their careers, although with substantial differences between men and women.
Non-formal learning, including employer-provided training and self-initiated courses, is crucial for lifelong learning systems. Data from PIAAC surveys show that approximately 10 per cent of workers take private lessons, while about 35 per cent receive on-the-job training, highlighting different modes of access to non-formal learning. Insights from the ILO lifelong learning surveys in Fiji and the United Republic of Tanzania further underscore the importance of tailoring training content to specific needs, particularly in technical and digital skills. Informal learning is also widespread, but patterns differ by category of workers: informal workers rely disproportionately on learning by doing, while formally employed workers benefit from more interactive learning with colleagues and supervisors.
Employers’ and workers’ organizations play a central role in shaping and supporting such learning opportunities, particularly in the world of work. Strengthening these organizations is therefore essential to building inclusive lifelong learning systems. Yet, participation in them remains low worldwide, reflecting broader structural labour market challenges and varying levels of compliance with fundamental principles and rights at work.
Finally, global data suggest a widespread habit of seeking information daily, indicating a strong foundation for societal learning. However, the frequency and channels used to access information vary considerably across countries and population groups. In many low- and middle-income countries, limited internet access remains a barrier, especially for marginalized communities. Ensuring equitable access to reliable information is therefore essential to avoid deepening existing inequalities and to guard against the risks of misinformation. Furthermore, while community-based participation – such as engagement in voluntary organizations – holds potential for fostering collective learning, actual involvement is uneven.
In sum, this chapter highlights persistent gaps in learning that need to be addressed to enable individuals to fully realize their potential. In the world of work – central to the ILO mandate – bridging disparities in access to learning opportunities and skills development remains critical. Identifying the skills that matter in different contexts is key to understanding how skill policies, and lifelong learning systems more broadly, can foster skills associated with more favourable outcomes for both workers and employers.
20 Formal learning refers to structured education within recognized institutions leading to qualifications. Non-formal learning occurs outside formal education systems and may be structured, but typically does not lead to formal qualifications. Training provided by employers fall under this category. Informal learning happens through daily life experiences, though it can be recognized through validation processes. In the world of work, it can occur through interactions with co-workers or learning by doing.
21 The surveys’ detailed methodological note is on the report’s website (https://www.ilo.org/lifelong-learning-and-skills-future).
22 In this report, the term “informal worker” refers to workers in informal employment, consistent with ILO practice (ILO 2018a, 2020a).
23 Lower secondary education typically begins between 10 and 13 years old, after primary education (age 12 being the most common starting age). Upper secondary education typically starts between 14 and 16 years old and ends around 17 or 18 (UIS 2012). However, in order to increase the availability of data on government expenditure across countries, figure 2.1 also includes government expenditure on other education levels.
24 Although the effects of ICT on education are complex and depend on several variables (such as the type of technology, and student and teacher characteristics), digital technologies have shown significant potential for improving education in schools, especially when they are used to complement instruction instead of substituting it (Courtney et al. 2022; Timotheou et al. 2023). Specifically, access to the internet in schools has been associated with improved student performance, though impacts vary across the groups studied (Lakdawala, Nakasone and Kho 2023).
25 It should be noted that comparability across countries might not be entirely accurate due to variations in the definitions used.
26 As discussed in Chapter 1, learning in the world of work is not limited to work-based learning and comprises all activities with direct relevance for the world of work, whether work-based, in classroom or initiated by workers themselves.
28 However, this population group may also access other forms of learning. In particular, frameworks such as open universities, with typically flexible instructional delivery, can enable adults to pursue studies while balancing work and other responsibilities (Daniel-Gittens 2016).
29 Although the ILO defines the working-age population as persons aged 15 and above, the range 15 to 64 is also commonly used. Given that many indicators are capped at age 64, including SDG 4.3.1 presented here, this group is referred to as working-age population in this chapter. In Fiji, however, the ILO’s lifelong learning survey covers the 18–64 age group instead.
30 Furthermore, as various learning activities are combined into a single indicator, it is not possible to assess the specificities of each type. This is a shortcoming that the ILO lifelong learning surveys addresses by asking specific questions about the types of learning activities (section 2.3.2).
31 While the indicator title refers to “formal training”, following the definitions of this report, this training can be understood as non-formal learning (see footnote 1). Indeed, employer-provided measures tend to be institutionalized and intentional but do not lead to nationally recognized qualifications and are often provided in the form of workshops, short courses or seminars (ILO 2023a).
32 Informal work is defined by productive activities performed by persons that are – in law or in practice – not covered by formal arrangements (ILO 2023b). In the ILO lifelong learning surveys, informal workers are defined as employees without a written contract and self-employed individuals or business owners whose businesses are not registered.
33 For instance, TVET institutions in many low- and middle-income countries are not equipped with inclusive and disability-friendly infrastructure. Also, teachers’ pedagogical approaches do not always address the special educational needs of learners, including those with disabilities (UNESCO 2021).
34 OECD, “Survey of Adult Skills (PIAAC)”, https://www.oecd.org/en/about/programmes/piaac.html.
35 About 84 per cent of the countries covered are high-income countries (see note to figure 2.13 for the list of countries).
36 Apprenticeships, especially informal ones, may share similarities with internships in many low- and middle-income countries (ILO 2018b).
37 These professional associations have emerged as key players in the Arab States, particularly during critical junctures, such as the popular protests in 2011. They serve as sectoral representative organizations, primarily composed of middle-class groups (Mouawad et al. 2021).
-
References
Addison, John T., and Clive R. Belfield. 2007. “Unions, Training and Firm Performance”. Zeitschrift für Arbeitsmarktforschung 40 (4): 361–381. https://iab.de/publikationen/publikation/?id=590788.
Angrist, Joshua D., Eric A. Bettinger and Michael Kremer. 2006. “Long-Term Educational Consequences of Secondary School Vouchers: Evidence from Administrative Records in Colombia”. The American Economic Review 96 (3): 847–862. https://doi.org/10.1257/aer.96.3.847.
Azzimonti, Marina, and Marcos Fernandes. 2023. “Social Media Networks, Fake News, and Polarization”. European Journal of Political Economy 76: 102256. https://doi.org/10.1016/j.ejpoleco.2022.102256.
Baker, Bruce D., Danielle Farrie and David G. Sciarra. 2016. “Mind the Gap: 20 Years of Progress and Retrenchment in School Funding and Achievement Gaps”. ETS Research Report Series 2016 (1): 1–37. https://doi.org/10.1002/ets2.12098.
Bartram, Timothy, and Jillian Cavanagh. 2019. “Re-Thinking Vocational Education and Training: Creating Opportunities for Workers with Disability in Open Employment”. Journal of Vocational Education & Training 71 (3): 339–349. https://doi.org/10.1080/13636820.2019.1638168.
Bridgford, Jeff. 2017. Trade Union Involvement in Skills Development: An International Review. ILO. https://researchrepository.ilo.org/esploro/outputs/995219181102676.
Buckner, Elizabeth, and Yara Abdelaziz. 2023. "Wealth-Based Inequalities in Higher Education Attendance: A Global Snapshot". Educational Researcher 52 (9): 544–552. https://doi.org/10.3102/0013189X231194307.
Campante, Filipe, Ruben Durante and Francesco Sobbrio. 2018. “Politics 2.0: The Multifaceted Effect of Broadband Internet on Political Participation”. Journal of the European Economic Association 16 (4): 1094–1136. https://doi.org/10.1093/jeea/jvx044.
Chakraverty, Devasmita, Sarah N. Newcomer, Kelly Puzio and Robert H. Tai. 2018. “It Runs in the Family: The Role of Family and Extended Social Networks in Developing Early Science Interest”. Bulletin of Science, Technology & Society 38 (3–4): 27–38. https://doi.org/10.1177/0270467620911589.
Chatterji, Aaron, Thomas Cunningham, David J. Deming, Zoe Hitzig, Christopher Ong, Carl Yan Shan and Kevin Wadman. 2025. “How People Use ChatGPT”. NBER Working Paper No. 34255. National Bureau of Economic Research. https://doi.org/10.3386/w34255.
Chetty, Raj, Nathaniel Hendren and Lawrence F. Katz. 2016. “The Effects of Exposure to Better Neighborhoods on Children: New Evidence from the Moving to Opportunity Experiment”. American Economic Review 106 (4): 855–902. https://doi.org/10.1257/aer.20150572.
Courtney, Matthew, Mehmet Karakus, Zara Ersozlu and Kaidar Nurumov. 2022. “The Influence of ICT Use and Related Attitudes on Students’ Math and Science Performance: Multilevel Analyses of the Last Decade’s PISA Surveys”. Large-Scale Assessments in Education 10 (1): 8. https://doi.org/10.1186/s40536-022-00128-6.
Daniel-Gittens, Kathy-Ann. 2016. “Open University Model”. In The SAGE Encyclopedia of Online Education, vol. 3, edited by Steven L. Danver, 884–886. Thousand Oaks, CA: SAGE Publications. https://doi.org/10.4135/9781483318332.n279.
EESC (European Economic and Social Committee). 2022. The Work of the Future: Ensuring Lifelong Learning and Training of Employees. https://www.eesc.europa.eu/en/our-work/publications-other-work/publications/work-future-ensuring-lifelong-learning-and-training-employees.
Eurofound. 2023. Measures to Tackle Labour Shortages: Lessons for Future Policy. https://data.europa.eu/doi/10.2806/216577.
Ferreira, Maria, Andries de Grip and Rolf van der Velden. 2018. “Does Informal Learning at Work Differ between Temporary and Permanent Workers? Evidence from 20 OECD Countries”. Labour Economics 55: 18–40. https://doi.org/10.1016/j.labeco.2018.08.009.
Formenti, Laura, and Tetyana Hoggan-Kloubert. 2023. “Transformative Learning as Societal Learning”. New Directions for Adult and Continuing Education 177: 105–118. https://doi.org/10.1002/ace.20482.
Fouarge, Didier, Peter van Eldert, Andries de Grip, Annemarie Künn and Davey Poulissen. 2018. “Nederland in Leerstand”. ROA Report No. 2018/4. Research Centre for Education and the Labour Market. https://doi.org/10.26481/umarep.2018004.
Fricker, Miranda, ed. 2007. Epistemic Injustice: Power and the Ethics of Knowing. Oxford: Oxford University Press. https://doi.org/10.1093/acprof:oso/9780198237907.002.0003.
Gaarder, Edwin, and Judith van Doorn. 2021. “Enterprise Formalization: An Introduction”. ILO Thematic Brief No. 1/2021. https://researchrepository.ilo.org/esploro/outputs/995218956502676.
Gerards, Ruud, Andries de Grip and Arnoud Weustink. 2021. “Do New Ways of Working Increase Informal Learning at Work?”. Personnel Review 50 (4): 1200–1215. https://doi.org/10.1108/PR-10-2019-0549.
Granovetter, Mark S. 1973. “The Strength of Weak Ties”. American Journal of Sociology 78 (6): 1360–1380. https://www.jstor.org/stable/2776392.
Haerpfer, Christian W., Ronald Inglehart, Alejandro Moreno, Christian Welzel, Kseniya Kizilova, José Ramón Diez-Medrano, Marta Lagos, Pippa Norris, Evgeny Ponarin and Bi Puranen, eds. 2022. World Values Survey: Round Seven – Country-Pooled Datafile Version 6.0. Madrid, Spain and Vienna, Austria: JD Systems Institute and WVSA Secretariat. https://doi.org/10.14281/18241.24.
Hanafizadeh, Mohammad Reza, Abbas Saghaei and Payam Hanafizadeh. 2009. “An Index for Cross-Country Analysis of ICT Infrastructure and Access”. Telecommunications Policy 33 (7): 385–405. https://doi.org/10.1016/j.telpol.2009.03.008.
Hofmann, Christine, Markéta Zelenka, Boubakar Savadogo and Wendy Lynn Akinyi Okolo. 2022. “How to Strengthen Informal Apprenticeship Systems for a Better Future of Work? Lessons Learned from Comparative Analysis of Country Cases”. ILO Working Paper No. 49. https://doi.org/10.54394/WJEK5468.
Holtmann, Alphonse G., and Todd L. Idson. 1991. “Employer Size and On-the-Job Training Decisions”. Southern Economic Journal 58 (2): 339–355. https://doi.org/10.2307/1060178.
ILO. 2018a. Women and Men in the Informal Economy: A Statistical Picture. https://labordoc.ilo.org/permalink/41ILO_INST/j3q9on/alma994989692702676.
———. 2018b. “The Regulation of Internship: A Comparative Study”. ILO Employment Working Paper No. 240. https://researchrepository.ilo.org/esploro/outputs/995385590202676.
———. 2020a. Building Back Better for Women: Women’s Dire Position in the Informal Economy. https://researchrepository.ilo.org/esploro/outputs/995218816702676.
———. 2020b. “Lifelong Learning in the Informal Economy”. Research Brief, Skills and Employability. https://researchrepository.ilo.org/esploro/outputs/995219145602676.
———. 2022. Social Dialogue Report 2022: Collective Bargaining for an Inclusive, Sustainable and Resilient Recovery. https://doi.org/10.54394/VWWK3318.
———. 2023a. National Practices in Measuring Work-Based Learning: A Critical Review, ILO Department of Statistics. ICLS/21/2023/Room document 25. https://researchrepository.ilo.org/esploro/outputs/995331818102676.
———. 2023b. Resolution concerning statistics on the informal economy. ICLS/21/2023/RES. I. https://www.ilo.org/resource/resolution-concerning-statistics-informal-economy.
———. 2023c. “Apprentices in Countries with Large Informal Economies”. ILO Statistical Brief. https://researchrepository.ilo.org/esploro/outputs/995271897102676.
———. 2023d. Transformative Change and SDG 8: The Critical Role of Collective Capabilities and Societal Learning. https://doi.org/10.54394/HKDP3268.
———. 2025. Compendium of Good Practices: The Power of Membership – Strategies for Sustainable Employers and Business Membership Organizations Growth. https://researchrepository.ilo.org/esploro/outputs/995660061102676.
———. n.d. “Other Forms of Work Based Learning”. https://www.ilo.org/topics/apprenticeships/publications-and-tools/digital-toolkit-quality-apprenticeships/what-are-quality-apprenticeships/other-forms-work-based-learning.
ILO and UNICEF (United Nations Children’s Fund). 2023. More Than a Billion Reasons: The Urgent Need to Build Universal Social Protection for Children – Second ILO–UNICEF Joint Report on Social Protection for Children. https://researchrepository.ilo.org/esploro/outputs/995264809702676.
Inter-agency Group on Technical and Vocational Education and Training. 2017. Investing in Work-Based Learning. https://unesdoc.unesco.org/ark:/48223/pf0000260677.
Jackson, C. Kirabo, Rucker C. Johnson and Claudia Persico. 2016. “The Effects of School Spending on Educational and Economic Outcomes: Evidence from School Finance Reforms”. The Quarterly Journal of Economics 131 (1): 157–218. https://doi.org/10.1093/qje/qjv036.
Jensen, Robert, and Emily Oster. 2009. “The Power of TV: Cable Television and Women’s Status in India”. The Quarterly Journal of Economics 124 (3): 1057–1094. https://doi.org/10.1162/qjec.2009.124.3.1057.
Kadirov, Aliya, Srinivas Gurazada and Thomas Poulsen. 2023. “Budget Execution in the Education Sector and Why It Matters”. World Bank Blogs (blog). 2 March 2023. https://blogs.worldbank.org/en/education/budget-execution-education-sector-and-why-it-matters.
Keefer, Philip E., and Stuti Khemani. 2016. “The Government Response to Informed Citizens: New Evidence on Media Access and the Distribution of Public Health Benefits in Africa”. The World Bank Economic Review 30 (2): 233–267. https://doi.org/10.1093/wber/lhv040.
Keijzer, Marijn A., and Michael Mäs. 2022. “The Complex Link between Filter Bubbles and Opinion Polarization”. Data Science 5 (2): 139–166. https://doi.org/10.3233/DS-220054.
Keijzer, Marijn A., Michael Mäs and Andreas Flache. 2024. “Polarization on Social Media: Micro-Level Evidence and Macro-Level Implications”. Journal of Artificial Societies and Social Simulation 27 (1): 7. https://doi.org/10.18564/jasss.5298.
Kitching, John, and Robert A. Blackburn. 2002. The Nature of Training and Motivation to Train in Small Firms. Research Report RR330. Small Business Research Centre, Kingston University. http://dera.ioe.ac.uk/4691/1/RR330.pdf.
Lakdawala, Leah K., Eduardo Nakasone and Kevin Kho. 2023. “Dynamic Impacts of School-Based Internet Access on Student Learning: Evidence from Peruvian Public Primary Schools”. American Economic Journal: Economic Policy 15 (4): 222–254. https://doi.org/10.1257/pol.20200719.
Lassen, David Dreyer. 2005. “The Effect of Information on Voter Turnout: Evidence from a Natural Experiment”. American Journal of Political Science 49 (1): 103–118. https://doi.org/10.1111/j.0092-5853.2005.00113.x.
Ma, Xiao, Alejandro Nakab and Daniela Vidart. 2024. “Human Capital Investment and Development: The Role of On-the-Job Training”. Journal of Political Economy Macroeconomics 2 (1): 107–148. https://doi.org/10.1086/728667.
Martínez-Cantos, José-Luis. 2023. “The Gender Gap in Digital Skills in Cross-National Perspective”. In Research Handbook on Digital Sociology, edited by Jan Skopek, 348–367. Cheltenham, UK: Edward Elgar Publishing. https://doi.org/10.4337/9781789906769.00028.
McKinney, Stephen. 2014. “The Relationship of Child Poverty to School Education”. Improving Schools 17 (3): 203–216. https://doi.org/10.1177/1365480214553742.
Mouawad, Jamil, Nacer Djabi, Mohamed El Agati, Osama Samir, Ahmed Abdel Majeed Srour, Zaher Srour and Amr Alhammood. 2021. “Between the Significance of Roles and the Challenges of Organization and Representation: Independent Professional Unions in the Arab World”. Arab Reform Initiative, 9 November 2021. https://www.arab-reform.net/publication/between-the-significance-of-roles-and-the-challenges-of-organization-and-representation-independent-professional-unions-in-the-arab-world/.
OECD (Organisation for Economic Co-operation and Development). 2010. Learning for Jobs. https://doi.org/10.1787/9789264087460-en.
———. 2016. Getting Skills Right: Assessing and Anticipating Changing Skill Needs. https://doi.org/10.1787/9789264252073-en.
———. 2017. OECD Employment Outlook 2017. https://doi.org/10.1787/empl_outlook-2017-en.
———. 2018. Bridging the Digital Gender Divide: Include, Upskill, Innovate.
———. 2019a. PISA 2018 Results: What Students Know and Can Do. Volume I. https://doi.org/10.1787/82d15396-en.
———. 2019b. Changing the Odds for Vulnerable Children: Building Opportunities and Resilience. https://doi.org/10.1787/a2e8796c-en.
———. 2021. Training in Enterprises: New Evidence from 100 Case Studies. Getting Skills Right. https://doi.org/10.1787/7d63d210-en.
———. 2022. The Protection and Promotion of Civic Space: Strengthening Alignment with International Standards and Guidance. https://doi.org/10.1787/d234e975-en.
Osborne, Michael, and Katarzyna Borkowska. 2017. “A European Lens upon Adult and Lifelong Learning in Asia”. Asia Pacific Education Review 18: 269–280. https://doi.org/10.1007/s12564-017-9479-4.
Palmer, Robert. 2017. Jobs and Skills Mismatch in the Informal Economy. ILO https://researchrepository.ilo.org/esploro/outputs/995219180902676.
———. 2020. Lifelong Learning in the Informal Economy: A Literature Review. ILO. https://researchrepository.ilo.org/esploro/outputs/995218807502676.
Perrin, Andrew, and Sara Atske. 2021. “How Can We Ensure That More People with Disabilities Have Access to Digital Devices?”. World Economic Forum, 16 September 2021. https://www.weforum.org/stories/2021/09/disability-barrier-to-digital-device-ownership/.
Pirrie, Anne. 2005. “Reclaiming Basic Skills: In Defence of Long-Life Learning”. Policy Futures in Education 3 (1): 106–116. https://doi.org/10.2304/pfie.2005.3.1.2.
Psacharopoulos, George, and Harry Anthony Patrinos. 2018. “Returns to Investment in Education: A Decennial Review of the Global Literature”. Education Economics 26 (5): 445–458. https://doi.org/10.1080/09645292.2018.1484426.
Reinikka, Ritva, and Jakob Svensson. 2004. “Local Capture: Evidence from a Central Government Transfer Program in Uganda”. The Quarterly Journal of Economics 119 (2): 679–705. https://doi.org/10.1162/0033553041382120.
———. 2011. “The Power of Information in Public Services: Evidence from Education in Uganda”. Journal of Public Economics 95 (7–8): 956–966. https://doi.org/10.1016/j.jpubeco.2011.02.006.
RSF (Reporters without Borders). n.d. “World Press Freedom Index 2023”, RSF database. Accessed 28 October 2023. https://rsf.org/en/index.
Singh, Sumanjeet. 2017. “Bridging the Gender Digital Divide in Developing Countries”. Journal of Children and Media 11 (2): 245–247. https://doi.org/10.1080/17482798.2017.1305604.
Stein, Jonas, Marc Keuschnigg and Arnout van de Rijt. 2023. “Network Segregation and the Propagation of Misinformation”. Scientific Reports 13 (1): 917. https://doi.org/10.1038/s41598-022-26913-5.
Thévenon, Olivier, and Eric Edmonds. 2019. “Child Labour: Causes, Consequences and Policies to Tackle It”. OECD Social, Employment and Migration Working Papers, No. 235. https://dx.doi.org/10.1787/f6883e26-en.
Thomas, Faith, and Robert L. Morgan. 2021. “Evidence-Based Job Retention Interventions for People with Disabilities: A Narrative Literature Review”. Journal of Vocational Rehabilitation 54 (2): 89–101. https://doi.org/10.3233/JVR-201122.
Timotheou, Stella, Ourania Miliou, Yiannis Dimitriadis, Sara Villagrá Sobrino, Nikoleta Giannoutsou, Romina Cachia, Alejandra Martínez Monés and Andri Ioannou. 2023. “Impacts of Digital Technologies on Education and Factors Influencing Schools’ Digital Capacity and Transformation: A Literature Review”. Education and Information Technologies 28 (6): 6695–6726. https://doi.org/10.1007/s10639-022-11431-8.
Torm, Nina. 2024. “Training Returns among Informal Workers: Evidence from Urban Sites in Kenya and Tanzania”. The European Journal of Development Research 36: 1593–1615. https://doi.org/10.1057/s41287-024-00652-x.
Tripney, Janice S., and Jorge G. Hombrados. 2013. “Technical and Vocational Education and Training (TVET) for Young People in Low- and Middle-Income Countries: A Systematic Review and Meta-Analysis”. Empirical Research in Vocational Education and Training 5 (3). https://doi.org/10.1186/1877-6345-5-3.
UIS (UNESCO Institute for Statistics). 2012. International Standard Classification of Education: ISCED 2011. https://www.uis.unesco.org/en/methods-and-tools/isced.
UNESCO (United Nations Educational, Scientific and Cultural Organization). 2013. Expanding TVET at the Secondary Education Level. Asia-Pacific Education System Review Series, No. 7. https://unesdoc.unesco.org/ark:/48223/pf0000226220.
———. 2017. Global Education Monitoring Report 2017/8: Accountability in Education – Meeting Our Commitments. https://doi.org/10.54676/VVRO7638.
———. 2021. Technical and Vocational Education and Training for Disadvantaged Youth. https://unevoc.unesco.org/pub/tvet_for_disadvantaged_youth.pdf.
UNESCO and ILO. 2002. Technical and Vocational Education and Training for the Twenty-First Century: UNESCO and ILO Recommendations. https://labordoc.ilo.org/permalink/41ILO_INST/1jaulmn/alma994983193302676.
UNESCO-UNEVOC (International Centre for Technical and Vocational Education and Training). n.d. “Formal TVET”. TVETipedia Glossary. https://unevoc.unesco.org/home/TVETipedia+Glossary/lang=en/show=term/term=Formal+TVET#start.
World Bank, UNESCO and ILO. 2023. Building Better Formal TVET Systems: Principles and Practice in Low- and Middle-Income Countries. https://labordoc.ilo.org/permalink/41ILO_INST/j3q9on/alma995320392002676.
Yorks, Lyle, and Jody Barto. 2015. “Workplace, Organizational, and Societal: Three Domains of Learning for 21st-Century Cities”. New Directions for Adult and Continuing Education 2015 (145): 35–44. https://doi.org/10.1002/ace.20121.
Part 2. Skills for transformation and resilience
Building on Part 1’s broad understanding of lifelong learning, Part 2 focuses on the world of work, identifying which skills matter most for better jobs and adaptability in changing labour markets. Using innovative big data analysis and novel methods, it shows that core and technical skills across cognitive and socio-emotional domains work best in combination, driving higher wages, career progression and adaptability. Skills are a critical lever for resilience, inclusion and opportunity amid major transformations – demographic, environmental and digital. However, to meet these challenges, they must be developed, recognized and valued in ways that reflect labour markets and societal needs.
3.1. Introduction
The first two chapters set out the concept of lifelong learning, presenting a working definition and a conceptual framework for tracking its development across three main dimensions: education, the world of work and broader societal learning. As illustrated in Chapter 2, the gaps in lifelong learning and skills development are particularly significant in the world of work. In parallel, major transformative phenomena – such as technological advancements, the green transition, demographic shifts and changing trade patterns – are reshaping labour markets globally. Beginning with this chapter, the report therefore adopts a more specific focus on the world of work.
These transformations emphasize the pivotal role of skills in determining employment opportunities. Possessing or lacking certain skills affects the resilience of some workers while rendering others vulnerable to deteriorating working conditions or job loss. Consequently, efforts to foster skilling, upskilling and reskilling are important. To do so effectively, it is crucial to gain a deeper understanding of the skills and skill sets needed to secure better employment opportunities. This chapter addresses this topic by exploring the following questions:
-
What are the observed patterns of firms’ demand for skills and the supply of skills by workers?
-
How are skills interconnected and related to each other?
-
What role do these skills and skills bundles play in securing higher-quality jobs?
These insights are crucial for addressing the policy challenges explored in the rest of this report, including: (i) how to make workers more resilient in the face of structural transformations (Chapter 4); (ii) how lifelong learning systems can best allow workers to build the demanded skills sets; and (iii) which role policies play in this regard (Chapter 5).
This chapter builds on and complements the existing literature. Particularly in the last 20 years, academic research has contributed to a much deeper understanding of how skills are related to employment outcomes, albeit confined to selected high-income countries in Europe and North America. Early literature distinguished between occupations with high and low skills intensity, often proxying this by educational requirements or workers’ experience (for example, Tinbergen 1974). Autor, Levy and Murnane (2003) introduced a new framework, where jobs are constituted of combinations of routine manual, routine cognitive, non-routine manual and non-routine cognitive tasks to be performed by workers through the application of related skills. The framework has advanced the understanding of routine-biased technological change and job polarization (for example, Autor, Katz and Kearney 2006; Goos, Manning and Salomons 2014; Spitz-Oener 2006) and recovery patterns after recessions (Acemoglu and Autor 2011; Jaimovich and Siu 2020).
The recent rise of natural language processing (NLP) methods, which enable computer-based text analysis, makes it possible to use big data to analyse skills. Studies increasingly use NLP methods to analyse vacancy postings and extract skills information by processing job descriptions and identifying keywords or patterns from the data (Ash and Hansen 2023). Atalay et al. (2020), for example, show that the task and skill requirements of jobs have changed drastically within occupations in the United States. Hershbein and Kahn (2018) show that during recessions, firms tend to hire more skilled workers, accelerating workforce changes already initiated by routine-biased technological change. Deming and Kahn (2018) show, also using US data, that demand for cognitive and social skills is heterogeneous even within occupations or industries and that combinations of skills explain differences in wages, illustrating the importance for workers to develop the skills demanded for higher-quality jobs.
Policy-oriented institutions have also expanded their research, accompanying their skills development agendas with publications and data collection. For example, the EU provides data on skills development and shortages (Cedefop et al. 2021), the OECD conducts the Survey of Adult Skills PIAAC (OECD 2019), and the World Economic Forum has published reports on skills demand based on interviews of company executives (WEF 2023) and skills-based hiring strategies (WEF 2024).
Despite these advancements, considerable research gaps remain. Often, analyses focus on one specific sector, occupation or set of skills, either due to data limitations or to answer a specific research question (for example, Debortoli, Müller and vom Brocke 2014; Deming and Noray 2020; Marconi, Vergolini and Borgonovi 2023). Analyses on the role of skills for employment outcomes other than wages are regularly missing. Most notably, studies tend to concentrate on single high-income countries, while cross-country comparisons and knowledge for other countries are scarce. This is largely due to a lack of reliable data and of universally implementable skills frameworks.
To address these limitations, some studies rely on one-time surveys in selected middle-income countries (for example, Lewandowski et al. 2022; Lewandowski, Park and Schotte 2023, using data from OECD’s PIAAC survey and the World Bank’s STEP Skills Measurement Program38), while others use labour force surveys and assess skills by applying the occupation-level information on skills from the US O*NET Program39 (Almeida, Corseuil and Poole 2017; Bhorat et al. 2020; Reijnders and de Vries 2018). The former approach means that trends over time cannot be detected, and the latter relies on the problematic assumption that skills compositions of occupations in the analysed country are identical to those in the United States. Access to granular, longitudinal skills information from low- and middle-income countries is therefore key to understanding skills dynamics worldwide, especially since existing work shows significant deviations in these countries from the skills-related patterns in high-income countries (Atencio-De-Leon, Lee and Macaluso 2025; Hjort and Poulsen 2019; Lewandowski et al. 2022; Lewandowski, Park and Schotte 2023).
A few studies already use online data from emerging economies – for example, Archibong et al. (2022) for Nigeria, Matsuda, Ahmed and Nomura (2019) for Pakistan and Nomura et al. (2017) for India. However, these studies cover only specific segments of the labour market or focus on specific skills in the respective country.40 A challenge is the absence of an internationally applicable taxonomy for skills, as existing frameworks are tailored to the United States and similar contexts (and thus less suited for application in low- and middle-income economies), primarily by neglecting manual skills.
Given these research gaps and challenges, this chapter complements the existing knowledge, supported by original big data analysis for six selected middle- and two high-income countries in regions so far neglected by the literature. It also acknowledges that future research should further advance the understanding of skills dynamics in low-income countries.
This chapter provides a summary of the key findings. Detailed methodological explanations and in-depth analyses are available in the report-related articles and briefs included on the report’s website.41 Section 3.2 presents the methodology and data used. Section 3.3 explores skill demand and supply and their evolution over time. Section 3.4 analyses whether skills are interconnected as skills bundles. Building on these findings, section 3.5 explores the role of skills in promoting job quality.
3.2. Data and approach
This chapter uses online vacancy and applicants’ data from job portals and aggregators. Such data provide granular information on workers’ previous job tasks and the tasks sought in vacancies, enabling the identification of country-specific trends in skills supply and demand. Moreover, online vacancy and applicant data are typically collected in real-time or at high frequencies. This avoids the time gaps associated with traditional data collection, including surveys, which are often conducted at longer intervals (Escudero, Liepmann and Podjanin 2024).
This chapter presents the first attempt to systematically explore these data in the context of emerging economies (see box 3.1 for details on the data). Vacancy data have been obtained from online job portals and aggregators in six middle-income countries: Brazil, Egypt, Jordan, Morocco, the Russian Federation and South Africa. Additional vacancy data have been obtained from two high-income countries, the United Arab Emirates and Uruguay. The two high-income countries are worth examining, as their labour markets are clearly distinct from the cases the existing literature has focused on.42 In general, countries were selected to cover examples from diverse regions and with heterogeneous labour market features that had not been studied from this perspective before, thereby looking outside of the United States and the EU. For Brazil and Uruguay, applicant profile information was available in addition to vacancy data.
For the Russian Federation and South Africa, vacancy data originate from the job aggregator Adzuna43 covering the period 2016 to 2021. For Brazil and Uruguay, vacancy and applicants’ data were provided by the job board BuscoJobs44 spanning the period 2010 to 2023. The analysis for Egypt, Jordan and the United Arab Emirates was possible thanks to a collaboration with the UN Economic and Social Commission for Western Asia (ESCWA). ESCWA’s data stem from the ESCWA Skills Monitor, a machine-learning-based platform that tracks skills demand across the Arab region. The ESCWA data refer to years 2020 to 2024.45 More details on Egypt, Jordan and the United Arab Emirates are available in El Hage Sleiman, Liepmann and Mokdad (2025), which is the source of the analyses for the three countries. Finally, the analysis for Morocco was conducted in collaboration with the ILO Country Office for Algiers, using data from Veille+, a platform which was developed by the public employment service (ANAPEC) in partnership with the ILO. It uses automated web scraping to collect and structure vacancy information, for years 2022 to 2025.46 Only applicants and vacancies with occupational information for which at least one skill was identified were considered for the analysis.
While these datasets offer a rich foundation for exploring skills dynamics, they entail several limitations to their representativeness (see Fabo and Kureková 2022, a study conducted for this report to provide further methodological considerations). The analysis focuses on the online labour market, excluding: (i) jobs for which recruitment occurs exclusively through “off-line” methods, like word of mouth or local notices, and (ii) applicants without online profiles. The prevalence of such data is influenced by the size of the informal economy, cultural norms, disparities in internet access and digital literacy. Online data also tend to be more common in high-income countries and urban areas.
Additionally, the online data used originate from privately owned job portals, which typically attract more postings for professional occupations, compared to public employment service portals (Kureková et al. 2016). Nevertheless, analyses for Uruguay show that the data sufficiently represent jobs requiring medium and even low formal qualification levels to allow for meaningful analyses. Furthermore, the methodology assigns a substantial number of manual skills relevant to these occupations (Escudero, Liepmann and Podjanin 2024).47
Another challenge is that applicants tend to use significantly fewer words than those used in job vacancies to describe their periods of employment (so-called “jobs spells”, which contain starting and ending dates for each employment period and an open-text description). Due to the brevity of these texts, some skills used in applicants’ current or previous employment experiences may not be captured, suggesting that applicants might need to better tailor their profiles in the application process (Luu and Escudero, forthcoming).
Nevertheless, the data present a valuable opportunity for analysis, especially in countries where more comprehensive skills data are scarce or unavailable and similar analyses could otherwise not be conducted. To capture and systematically classify skills in online data, and building on the ILO’s Global Framework on Core Skills for Life and Work in the 21st Century (ILO 2021),48 a new skills taxonomy geared towards broad applicability across countries was developed. This taxonomy aggregates skills into three overarching categories: cognitive, socio-emotional and manual, and 15 subcategories (table 3.1). Each skill subcategory is defined using keywords that are mutually exclusive and tailored to online data. The taxonomy includes skills related to tasks that workers perform on the job and skills referring to individuals’ personal attributes. The keywords are grounded in literature from economics (for example, Deming and Kahn 2018; Deming and Noray 2020; Hershbein and Kahn 2018) and psychology (for example, Almlund et al. 2011), along with complementary analyses. For more details on the taxonomy’s conceptual underpinnings, see Escudero, Liepmann and Podjanin (2024).
|
Subcategory |
Definition |
Examples of keywords |
|---|---|---|
|
Cognitive skills |
||
|
Core cognitive skills |
Skills needed to perform tasks that require analysis and calculation, problem solving, intuition and flexibility. |
Planning, designing, problem solving, strategic thinking, analysis, measuring, informing |
|
Sophisticated cognitive skills |
Skills needed to perform more advanced tasks that require analysis, modelling and creativity. |
Evaluate, research, statistics, data analysis |
|
General computer skills |
These six subcategories relate closely to the cognitive skills described above and correspond to skills that are needed in specific areas of work. They are listed as separate subcategories because they are often specifically mentioned in job adverts and in applicants’ work experiences. |
Computer, Excel, internet skills |
|
Software (specific) skills and technical support |
Programming language, web development, computer repair |
|
|
Machine learning and AI skills |
Automation, neural networks, deep learning |
|
|
Financial skills |
Budgeting, accounting, finance |
|
|
Writing skills |
Writing, editing, reports |
|
|
Project and process management skills |
Project, process, product and supply management |
|
|
Socio-emotional skills |
||
|
Character skills |
These skills are related to personal attributes, including conscientiousness, openness to experience and emotional stability. |
Organized, energetic, time management, reliable |
|
Social skills |
These skills encompass character traits associated with interpersonal interactions. |
Communication, teamwork, empathy, advice, presentation |
|
People management skills |
These two subcategories refer to specific abilities within the broader realm of social interactions that are frequently specified as prerequisites in job postings. |
Supervisory, leadership, mentoring, staff development |
|
Customer service skills |
Client, patient, selling, buy, purchase |
|
|
Manual skills |
||
|
Finger dexterity skills |
These skills are usually required in routine work, particularly in machine operation and the production or handling of goods. |
Picking, sorting, packing, equipment, control machine |
|
Hand–foot–eye coordination skills |
Such “non-routine” skills are usually required for work in changing environments that necessitate adaptation. |
Attending animals, driving, renovate, repair, cleaning |
|
Physical skills |
This subcategory focuses on innate bodily characteristics. |
Resistance, carrying loads, physical strength, walking |
Note: This taxonomy is derived from a comprehensive review of economics and psychology literature. It builds on economic studies that exploit similar data, while also incorporating manual skills and broadening the conceptual basis of socio-economic skills to enable analyses across labour markets.
Source: Adamczyk et al. (2025) and Escudero, Liepmann and Podjanin (2024), who provide details on the underlying concepts and literature.
Skills are hereby understood as the “ability to carry out a manual or mental activity, acquired through learning and practice” (Strietska-Ilina et al. 2011, 176) and “the ability to carry out the tasks and duties of a given job” (ILO, n.d.). To ensure comprehensiveness and measurability, the focus is on technical and non-technical skills that are transferable and thus applicable across occupations (see box 3.2). As jobs evolve due to technological advances and other economic shifts, workers with strong transferable skills are better equipped to navigate occupational transitions, as demonstrated below. Given the chapter’s aim to provide high-level analyses for countries in different regions, the analysed skills are defined at a relatively broad level. Nevertheless, the underlying methodology enables more granular analyses, such as those related to specific skills demand in the growing digital, green and care sectors. Digital skills are already captured by the taxonomy in general computer skills, specific software skills, and machine learning and artificial intelligence (AI). Green skills are added and analysed in Chapter 4. Going forward, similar extensions could be possible, such as care skills.49 Moreover, the methodology allows for granular analyses at the keyword level, as illustrated in a few instances in this chapter and Chapter 4.
The taxonomy of skills is based on a broad categorization of skills, technical and non-technical, most of which are transferable across occupations. These skills are not occupation- or industry-specific (Strietska-Ilina et al. 2011). While the taxonomy also includes some technical skills, such as financial skills and machine learning and AI, the focus remains on skills applicable across various occupations.
Transferable skills are often supplemented by occupation-specific technical skills that are non-transferable to other occupations. This includes skills related to “applying the basic principles and techniques of a trade” and “skills and knowledge which are entirely job-related or firm-specific“ (ILO 2007). For example, laying bricks is a trade-specific skill relevant to “bricklayers and related workers” (Clarke, Winch and Brockmann 2013), whereas preparing accounting ledgers according to firm-specific procedures is a job- or firm-specific skill (Kanungo and Misra 1992). Technical skills have been emphasized in formal education systems, particularly in TVET, due to their immediate labour market applicability and their positive impact on employment and wages (Gangl, Müller and Raffe 2003; Hampf and Woessmann 2017).
While specialized technical skills often yield early wage gains, the long-term wage growth for workers with these skills is generally lower compared to those with more general training (Hanushek et al. 2017). This pattern holds also among college graduates (Deming and Noray 2020), as technical skills may rapidly change, especially in times of technological change. For example, Costa et al. (2024) show that, in the United Kingdom, 8 per cent of ICT skills required in job postings in 2022 had been newly introduced since 2016, whereas 26 per cent of the ICT skills that were popular in 2016 became obsolete by 2022 (see also below).
These findings underscore the importance of acquiring not only up-to-date technical skills but also more enduring socio-emotional and general cognitive skills, which allow workers to adapt to change. In addition, curricula need to be updated in response to changing demands (see also Buehler, Lehnert and Backes-Gellner 2024; World Bank, UNESCO and ILO 2023).
The taxonomy is both comprehensive and compact, which results in distinct advantages over other skills categorizations. First, its broad theoretical foundation makes it more comprehensive than existing taxonomies. For example, the 35 aggregated skills categories from O*NET are tailored to the United States and do not capture manual skills in as much depth (Fleisher and Tsacoumis 2012). Second, its compactness makes the taxonomy well-suited for research purposes. Thus, it differs from highly detailed taxonomies, uncategorized lists or complex ontologies. For example, the European Skills, Competences, Qualifications and Occupations ontology contains nearly 14,000 skills (European Commission, n.d.), which are too complex to be directly utilized in research.50
The taxonomy was applied to the online vacancy and applicant data using NLP techniques, which allows systematic access and categorization of unstructured information. Open-text descriptions of vacancies were pre-processed to align with the structured format of the skills taxonomy and its associated keywords. A skill was identified if at least one relevant keyword – or one of its synonyms – from the taxonomy appeared in the vacancy. For applicant data, the uploaded employment histories were similarly prepared and categorized. For more detailed methodological explanations, see Adamczyk et al. (2025).
3.3. Assessing employers’ demand and workers’ supply of skills
The demand for specific skills varies across countries and over time, shaped by factors such as work organization and firm structure, occupational structure, economic conditions, technological advancements and shifts in global trade patterns. Similarly, the supply of skills is influenced by multiple determinants, including the effectiveness of lifelong learning systems, sociocultural norms and demographic factors, like a population’s age distribution and labour force participation rates. This section explores the skills sought by firms and those offered by workers, examining potential differences across countries and over time and providing the basis for subsequent sections.
3.3.1. Skills requirements in employers’ vacancies
Based on the analysis of the vacancy data, employers place significant emphasis on socio-emotional skills across all countries considered. The relative frequency of skill occurrences in vacancies reveals that socio-emotional skills are highly demanded in all countries, even accounting for 59 per cent of all skills in Morocco, 52 per cent in the Russian Federation and 51 per cent in the United Arab Emirates (see figure 3.1).51 Among the socio-emotional subcategories studied, social and customer service skills are most frequently required. Character skills also rank prominently, appearing in third or fourth place in all countries. This echoes a broader global trend noted by Sostero and Tolan (2022), who highlight the importance of communication and customer service skills in Europe, and the increasing demand for social skills in the United States (Deming and Kahn 2018). It also reflects the prominence of the service sector in the countries studied (for example, Naudé, Szirmai and Haraguchi 2016), where socio-emotional skills are critical.
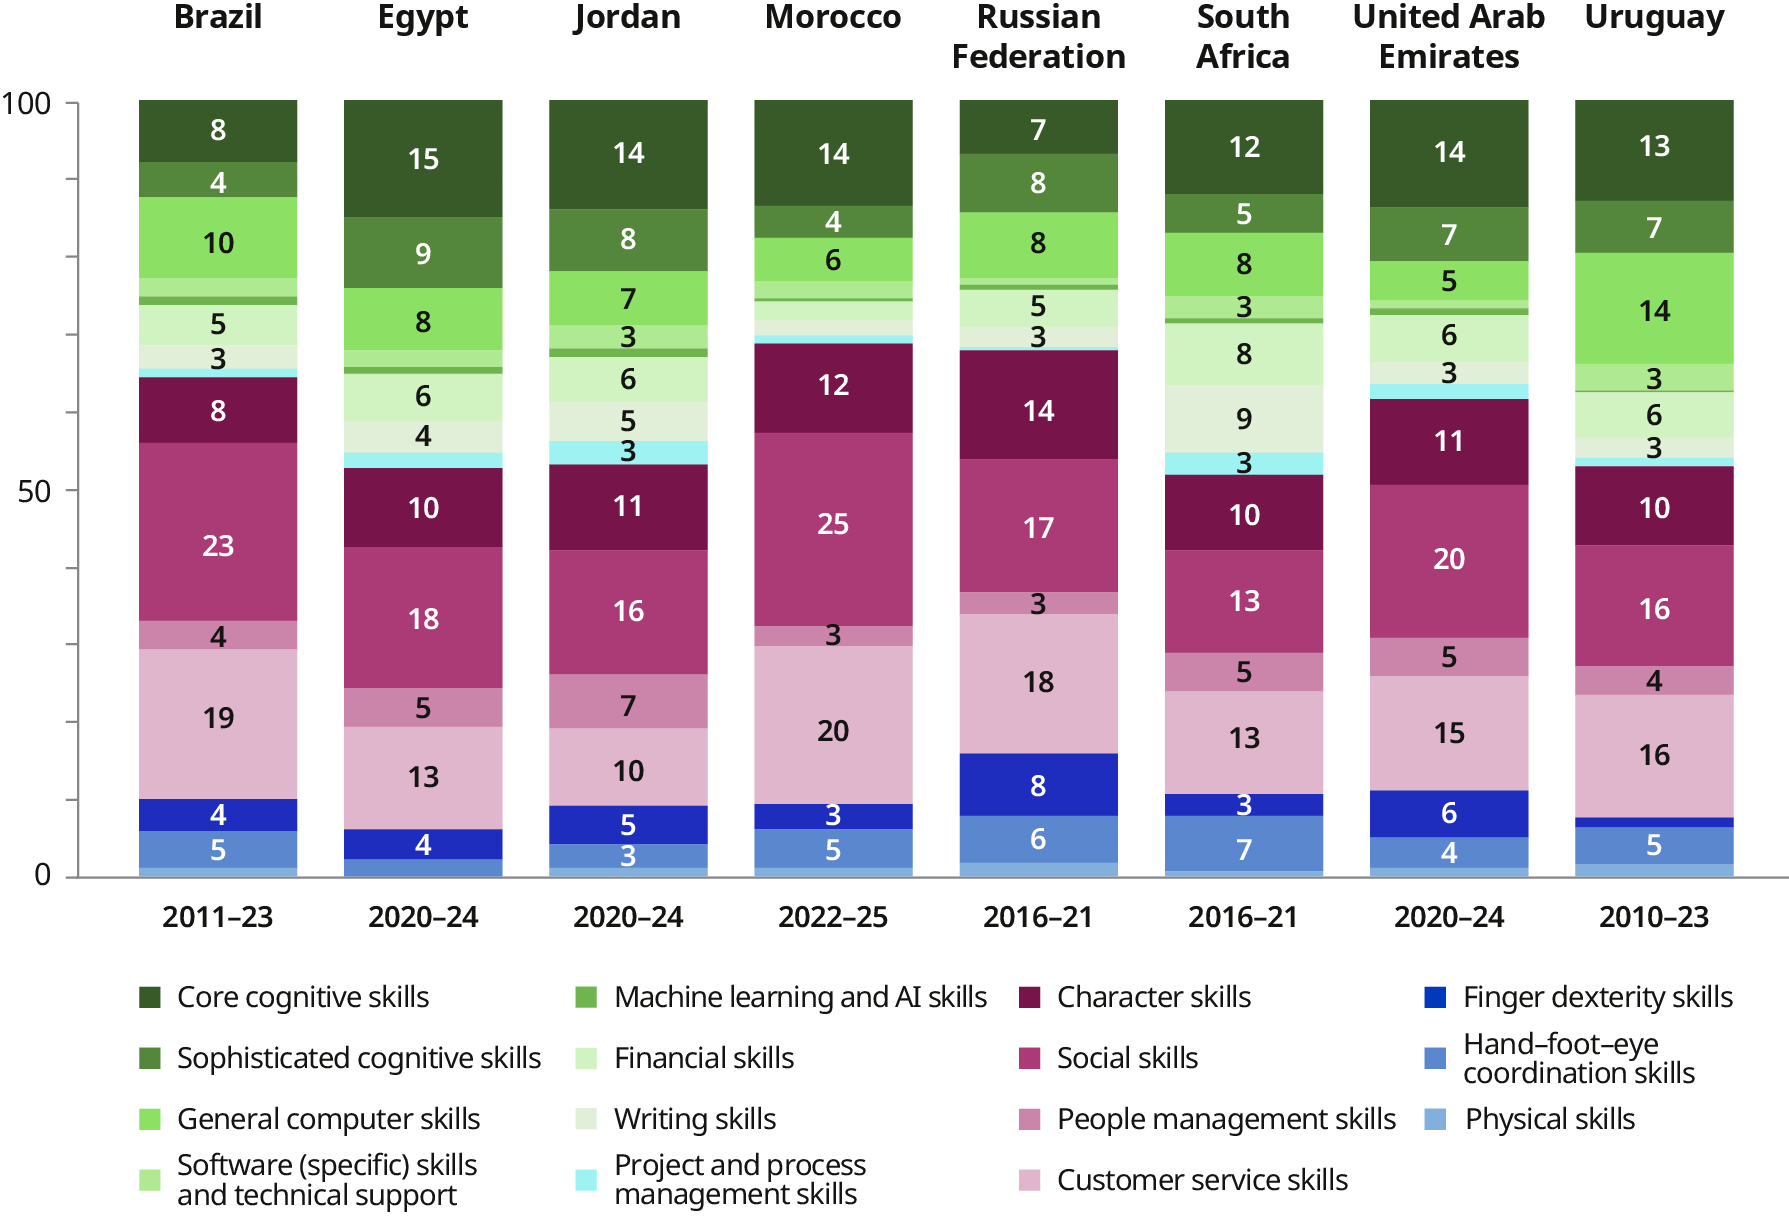
Note: The figure displays the share of a specific skill relative to the total occurrences of all skills across time. Labels below 3 per cent were omitted.
Source: Analysis based on vacancy data from BuscoJobs for Brazil and Uruguay (2010–23), Adzuna for the Russian Federation and South Africa (2016–21), ESCWA for Egypt, Jordan and the United Arab Emirates (2020–24), and Veille+ for Morocco (2022–25).
Other commonly required skills include core cognitive skills, such as planning and strategic thinking (see box 3.3 on how these skills are identified), and general computer skills. The emphasis on general computer proficiency underscores the importance of basic digital literacy, which has become a foundational skill for thriving in increasingly digital societies and economies (ILO 2023a). Overall, the importance of the broader category of cognitive skills ranges from 31 per cent in Morocco to 48 per cent in South Africa. Manual skills are also in demand, accounting for 16 per cent in the Russian Federation, where their share is the highest. In contrast, Egypt has the smallest share of online manual skills demand at 6 per cent (figure 3.1).
To provide a clearer understanding of how the chapter characterizes and interprets each skill, table 3.2 lists the top three words most associated with each skill in South Africa. The table shows that some skills are predominantly defined by single keywords; this is especially true for machine learning and AI skills (“automation”), writing skills (“report” and “write”), and finger dexterity skills (“equipment”). In contrast, other skills – such as core and sophisticated cognitive, character and people management skills – are more broadly identified by multiple keywords.
The results for most skills are similar in Brazil, the Russian Federation and Uruguay. However, skills in South Africa tend to be associated with relatively more keywords, possibly due to the larger English language vocabulary (Erichsen 2019) and different communication styles across countries (Kureková et al. 2016). South African employers predominately use a low-context communication style, where information is explicit and detailed, whereas in Brazil (Piroşcă 2016) and the Russian Federation (Burmann and Semrau 2022), a high-context style, where much is implied, is more common.
-
Table 3.2. Top three keywords associated with each skill as a share of the total number of matches for that skill, South Africa (percentage)
|
Cognitive skills |
Socio-emotional skills |
|||
|---|---|---|---|---|
|
Core cognitive skills |
Character skills |
|||
|
Plan |
19.0 |
Achieve |
11.2 |
|
|
Design |
12.7 |
Attention detail |
10.1 |
|
|
Strategy |
8.4 |
Initiative |
8.6 |
|
|
Sophisticated cognitive skills |
Social skills |
|||
|
Science |
22.5 |
Team |
35.8 |
|
|
Research |
22.2 |
Communication |
24.2 |
|
|
Evaluate |
11.5 |
Presentation |
5.5 |
|
|
Computer (general) skills |
People management skills |
|||
|
Computer |
33.2 |
Leadership |
20.8 |
|
|
Software |
20.2 |
Coach |
11.5 |
|
|
Microsoft |
13.5 |
People management |
5.6 |
|
|
Software and technical support |
Customer service skills |
|||
|
SQL |
26.8 |
Client |
36.8 |
|
|
HTML |
16.5 |
Customer |
24.5 |
|
|
JavaScript |
16.1 |
Sales |
19.9 |
|
|
Machine learning and AI skills |
Manual skills |
|||
|
Automation |
63.6 |
Finger dexterity skills |
||
|
Apache |
12.4 |
Equipment |
46.3 |
|
|
Machine learn |
7.9 |
Pack |
15.8 |
|
|
Financial skills |
Single |
6.6 |
||
|
Accounting |
25.8 |
Hand–foot–eye coordination skills |
||
|
Finance |
20.1 |
Drive |
44.1 |
|
|
Cost |
18.2 |
Transport |
19.4 |
|
|
Writing skills |
Clean |
8.4 |
||
|
Report |
51.2 |
Physical skills |
||
|
Write |
31.7 |
Walk |
39.8 |
|
|
Recommendation |
5.6 |
March |
18.8 |
|
|
Project and process management skills |
Physically fit |
10.6 |
||
|
Project management |
30.3 |
|||
|
Operation management |
6.3 |
|||
|
Management process |
5.8 |
|||
▪Q1 (0.0%–10.9%) ▪Q2 (11.0%–18.8%) ▪Q3 (18.9%–25.9%) ▪Q4 (26.0%–64.0%)
Source: Analysis based on Adzuna vacancy data (South Africa, 2016–21).
Another notable difference relates to character skills. The four selected countries use different keywords to characterize these skills, which may reflect varying work cultures (Minkov and Kaasa 2022; Taras, Steel and Kirkman 2011). Employers in the Russian Federation tend to emphasize diligent, self-independent characteristics, while employers in Uruguay mostly require dynamic and proactive traits. In Brazil, there is a focus on organization, while in South Africa, character skills are characterized by a diverse set of attributes, including achievement, competence, initiation, attentiveness, innovation and organization (figure 3.2).
-
Figure 3.2. Word clouds for the subcategory character skills
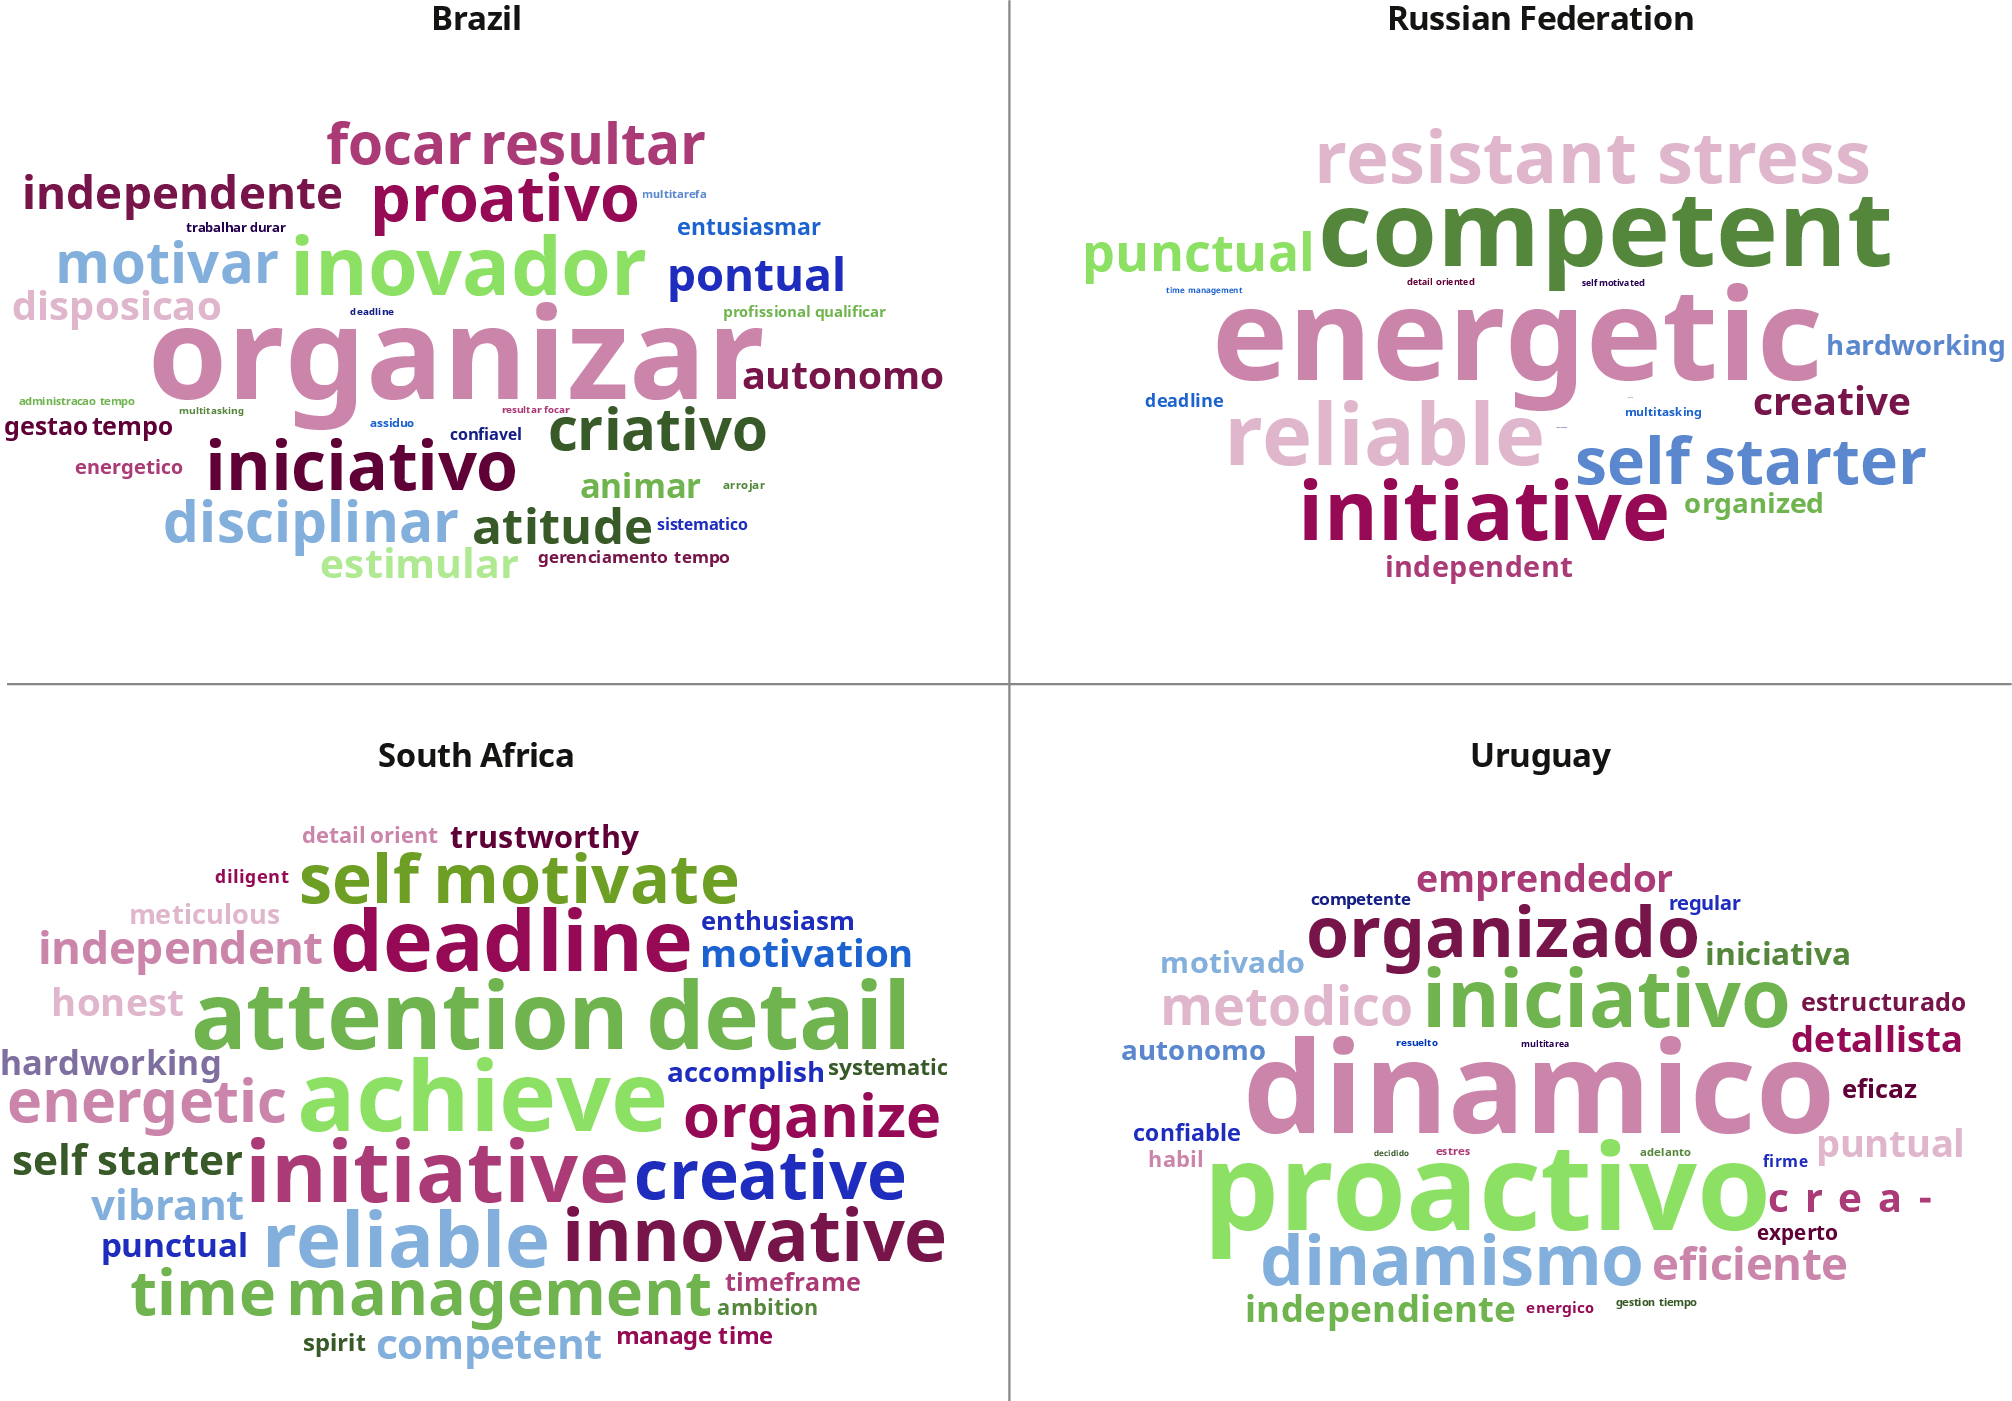
Note: The size of a word reflects how often it appears in the data: the bigger the word, the more frequently it is found. For the Russian Federation, terms were translated to English to express them in Latin script.
Source: Analysis based on vacancy data from BuscoJobs for Brazil and Uruguay (2010–23) and Adzuna for the Russian Federation and South Africa (2016–21).
The composition of skills demand has remained relatively stable over time across most countries (see figure 3.3). Brazil, Morocco, the Russian Federation and the United Arab Emirates show modest shifts, characterized by a decline in the share of social skills and an increase in manual skills. In contrast, Egypt, Jordan and Uruguay have experienced an increase in the demand for social skills, often accompanied by a slight decline in cognitive or manual skills. These modest changes may seem counterintuitive considering the prevalent discourse on rapid technological changes and their impact on workplace skills (for example, Atalay et al. 2020; Autor et al. 2024; Deming and Noray 2020).
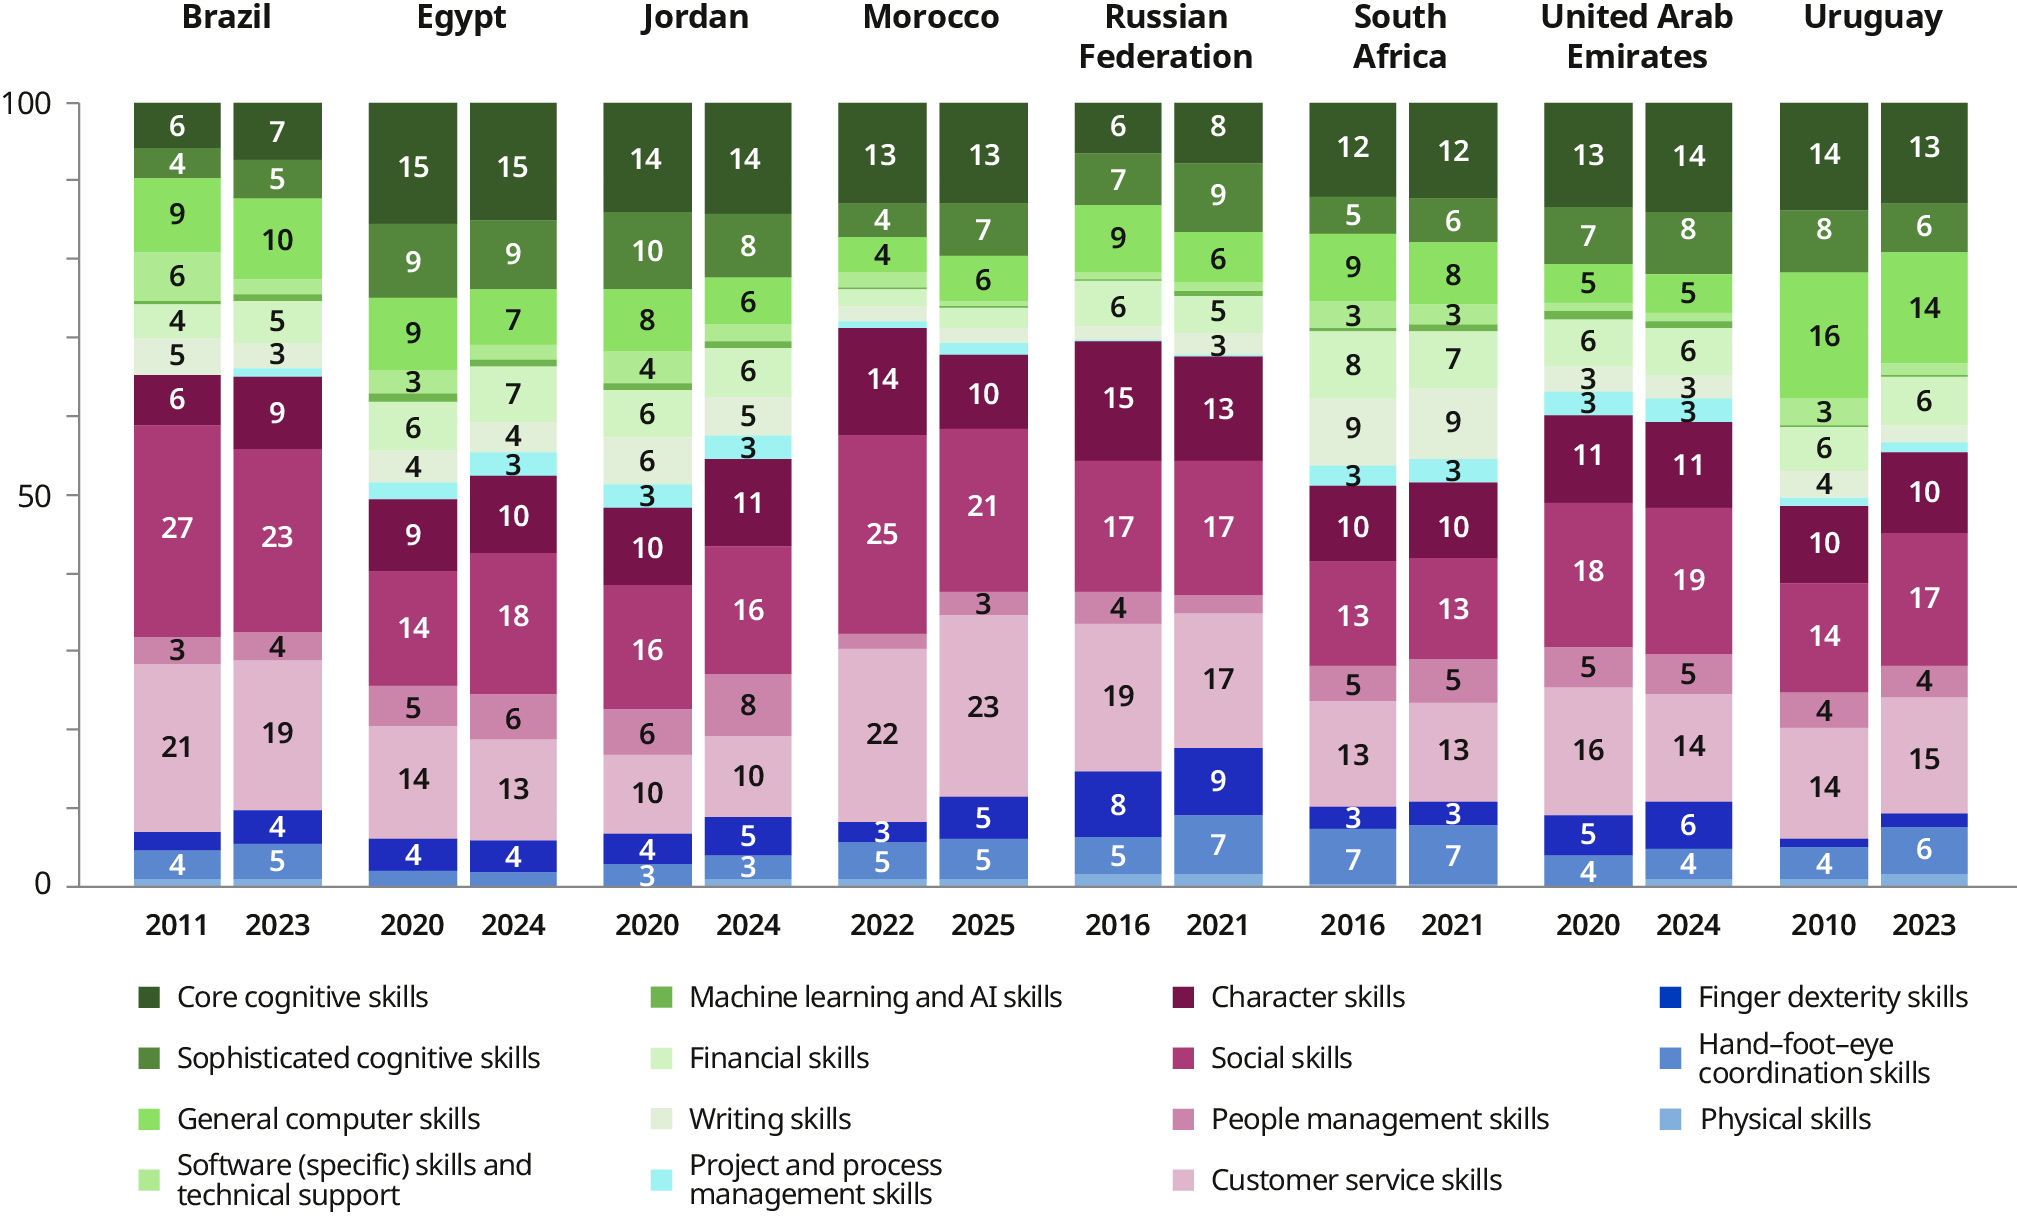
Note: The figure displays the share of a specific skill relative to the total occurrences of all skills in given years. The two years shown were selected based on data availability and to maximize the timespan. Labels below 3 per cent were omitted.
Source: Analysis based on vacancy data from BuscoJobs for Brazil and Uruguay (2010 and 2023), Adzuna for the Russian Federation and South Africa (2016 and 2021), ESCWA for Egypt, Jordan and the United Arab Emirates (2020 and 2024), and Veille+ for Morocco (2022 and 2025).
There are several possible reasons for this stability. In particular, the time span covered is relatively short: 13 years at most. Major changes related to the introduction of computers had likely been completed, while the full impact of recent developments related to generative AI can be expected to unfold in the coming years. This suggests that skill requirements do not change dramatically in the short or medium term. Additionally, technological change may progress more slowly in middle-income economies due to a sectoral composition less focused on technology-intensive sectors, unreliable access to electricity and the internet, and greater challenges in securing funding for new technologies (Gmyrek, Berg and Bescond 2023).
However, the apparent stability hides more nuanced, gradual transformations, including within skill subcategories. For example, in South Africa, the demand for social skills remained stable between 2016 and 2021, but software-specific skills underwent significant shifts (figure 3.4). Skills like employing Python (a programming language for data analysis and automation) and TypeScript (a version of JavaScript coding that yields fewer mistakes) have gained prominence. In contrast, skills broadly used in web development (for example, HTML, JavaScript and PHP) have lost relative relevance. Similar trends are observed in Brazil and the Russian Federation, as well as the United Kingdom, as noted by Costa et al. (2024).
Therefore, while core competencies and broader skill categories remain consistently vital over the medium term, specific skills – particularly in fast-evolving sectors like ICT – are rapidly changing. As another example, while the overall demand for machine learning and AI skills remains relatively low, its growth is noteworthy. The share of vacancies requiring such skills has seen significant increases in Brazil (from 0.5 to 1 per cent), the Russian Federation (from 0.3 to 0.7 per cent) and South Africa (from 0.5 to 0.8 per cent). This upward trend is expected to continue or accelerate with the advent of generative AI technologies.

Note: The size of each word represents the frequency in the data: the larger the word, the more often it appears in online job vacancies.
Source: Analysis based on Adzuna vacancy data for South Africa (2016–21).
Occupations and skill demand
Occupations are an important dimension of the demand for skills. For Brazil, table 3.3 shows that cognitive skills are more demanded at higher levels of the occupational hierarchy, while manual skills are predominantly sought in occupations assigned lower skill levels in the ISCO classification.52 Specifically, core and sophisticated cognitive skills and financial skills are most frequently required for managerial and professional positions, alongside the full set of socio-emotional skills, reflecting a complex skills portfolio. Customer service skills are most required for service and sales workers positions, while plant and machine operators and assemblers are most often required to possess hand–foot–eye coordination skills. Importantly, socio-emotional skills are central across all occupations and are the most frequently demanded skills in almost all of them. This trend is also observed in the other countries considered.
|
Skill categories |
ISCO 1 |
ISCO 2 |
ISCO 3 |
ISCO 4 |
ISCO 5 |
ISCO 7 |
ISCO 8 |
ISCO 9 |
|---|---|---|---|---|---|---|---|---|
|
Cognitive skills |
||||||||
|
Core cognitive skills |
36 |
32 |
18 |
9 |
8 |
33 |
8 |
6 |
|
Sophisticated cognitive skills |
17 |
21 |
16 |
5 |
5 |
4 |
2 |
2 |
|
General computer skills |
31 |
45 |
39 |
30 |
15 |
5 |
4 |
4 |
|
Software (specific) skills and technical support |
3 |
17 |
2 |
0 |
0 |
0 |
0 |
0 |
|
Machine learning and AI skills |
2 |
6 |
2 |
0 |
0 |
3 |
0 |
0 |
|
Financial skills |
23 |
21 |
24 |
9 |
5 |
4 |
4 |
2 |
|
Writing skills |
13 |
12 |
9 |
5 |
9 |
2 |
2 |
3 |
|
Project and process management skills |
8 |
3 |
3 |
2 |
2 |
1 |
1 |
1 |
|
Socio-emotional skills |
||||||||
|
Character skills |
29 |
26 |
20 |
25 |
27 |
11 |
17 |
24 |
|
Social skills |
74 |
66 |
66 |
72 |
68 |
38 |
66 |
64 |
|
People management skills |
42 |
11 |
5 |
4 |
4 |
2 |
3 |
3 |
|
Customer service skills |
60 |
50 |
57 |
63 |
84 |
26 |
26 |
23 |
|
Manual skills |
||||||||
|
Finger dexterity skills |
9 |
6 |
15 |
8 |
7 |
36 |
23 |
23 |
|
Hand–foot–eye coordination |
8 |
9 |
9 |
11 |
11 |
33 |
41 |
35 |
|
Physical skills |
4 |
2 |
2 |
3 |
3 |
3 |
13 |
4 |
|
Number of vacancies |
2 564 580 |
9 480 653 |
2 299 993 |
2 112 115 |
4 621 756 |
2 155 077 |
754 847 |
1 282 573 |
▪Q1 (0.5%–2.4%) ▪Q2 (2.5%–4.7%) ▪Q3 (4.8%–12.8%) ▪Q4 (12.9%–30.3%) ▪Q5 (30.4%–100%)
Key: ISCO categories: 1 – Managers: 2 – Professionals; 3 – Technicians and associate professionals; 4 – Clerical support workers; 5 – Services and sales workers; 7 – Craft and related trade workers; 8 – Plant and machine operators and assemblers; 9 – Elementary occupations.
Note: Certain values may appear to belong in a differently coloured range due to rounding. The shares displayed are calculated by dividing the number of vacancies for a particular occupation that require a specific skill by the total number of vacancies for that occupation. The category of skilled agricultural, forestry and fishery workers (ISCO 6) was excluded due to insufficient observations.
Source: Analysis based on BuscoJobs vacancy data (2010–23).
Further insights emerge when examining skills demand within occupations, which are exemplified here with Brazil. The skills mix demanded within some broad occupations – such as managers (ISCO 1), craft and related trade workers (ISCO 7) and elementary occupations (ISCO 9) – tends to remain relatively consistent. However, there is significant variability within other occupations, reflecting a broader range of tasks. For example, among clerical support, vacancies for customer service clerks (ISCO 42) primarily require customer service skills (82 per cent of vacancies) and social skills (73 per cent), with relatively fewer general computer skills (22 per cent). In contrast, vacancies for general and keyboard clerks (ISCO 41) emphasize general computer skills (45 per cent), alongside customer service skills (54 per cent) and social skills (71 per cent).
Moreover, vacancy descriptions for certain occupations often omit essential skills for the role, particularly for elementary occupations that typically require physical and manual skills. For example, in Brazil, the proportion of vacancies explicitly requesting these skills is notably low, ranging from 4 per cent for physical skills to 35 per cent for hand–foot–eye coordination skills (table 3.3). This could be due to differences in vacancy styles across sectors and occupations. Some vacancies may be considered largely self-explanatory regarding their skill requirements, emphasizing the importance of implicit knowledge among jobseekers, which can be specific to the country, sector or occupation (Fabo and Kureková 2022).53 As another example, only 15 per cent of Brazilian vacancies for personal care workers (ISCO 53) mention social skills, likely because the related job titles – such as child care worker or teacher’s assistant – are often considered self-explanatory. The omission of such occupation-specific skills makes accurate assessments of these skills challenging. Additionally, job postings for lower-skilled occupations tend to be shorter, possibly because employers invest less effort into recruiting for such jobs (Pellizzari 2011).
3.3.2. Skills supplied by workers
This section shifts the focus to the supply side, specifically the skills supplied by workers in Brazil and Uruguay, for which data are available in the sources used in this report. As such, the frequency of skills listed in applicants’ job histories is aggregated at the applicant level, capturing all skills acquired throughout their employment history. This approach provides a broad view of the skills available in the labour market during the period of analysis.54 It also provides insights into how applicants report skills on their profiles.
The skill distribution among applicants mirrors that of vacancies. Socio-emotional skills are the most prevalent, closely followed by cognitive skills, while manual skills are less common. Within specific skill subcategories, core cognitive, social and customer service skills account for around 50 per cent of all skills identified among applicants. In contrast, machine learning and AI, project and process management, software-specific skills, and physical skills are observed less frequently (figure 3.5).
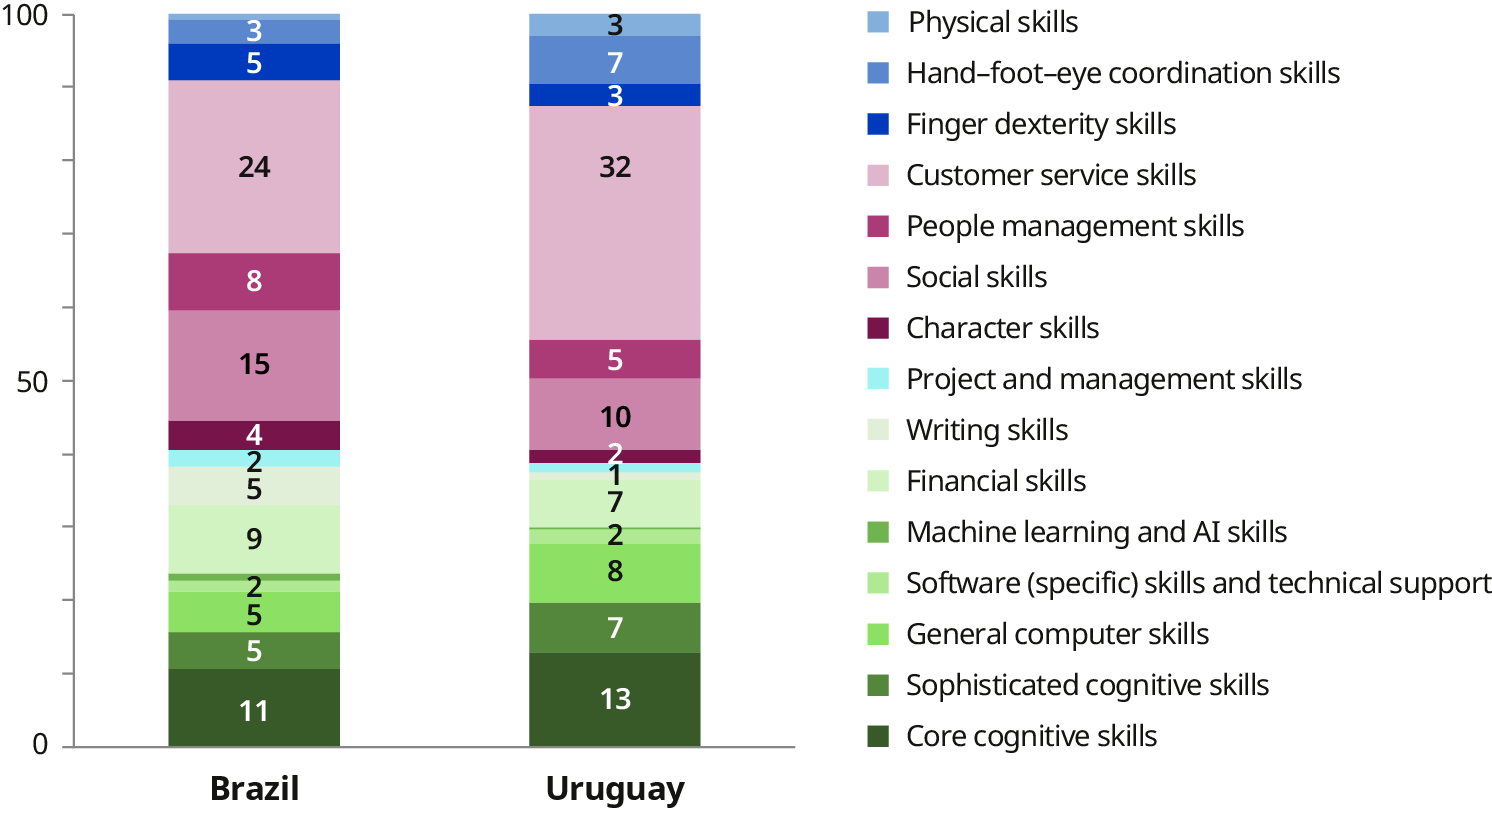
Note: The figure shows the share of a specific skill relative to the total number of skill occurrences. All skills mentioned across employment spells are aggregated at the individual-applicant level.
Source: Analysis based on BuscoJobs applicants’ data for Brazil and Uruguay (2010–23).
While Brazil and Uruguay exhibit a similar overall emphasis on cognitive and socio-emotional skills, there are notable differences in the subcategories of these broader skills groups. Uruguayan applicants showcase a higher prevalence of both core and sophisticated cognitive skills, as well as general computer skills. They also show a greater focus on customer service skills, whereas social skills tend to play a more important role in Brazil. The prominence of cognitive skills among Uruguayan applicants aligns with the strong demand reflected in vacancy data and a relatively high share of applicants with job spells in professional occupations. In contrast, the prevalence of social skills in Brazil appears relevant independently of the occupational composition or demand-side requirements.
Workers’ skill sets can be as diverse as workers are. In Brazil and Uruguay, men and women exhibit fairly similar skills profiles, though men generally use more words to describe slightly broader skill sets (see the top panel in figure 3.6). The most notable differences between women and men appear in customer service skills, which are more frequently reported by women (especially in Brazil), and manual skills, which are more often cited by men. In Brazil, men also report more people management skills, while in Uruguay, men highlight digital skills more prominently, particularly among professionals and technicians and associate professionals (ISCO 2 and 3). For manual skills, Brazilian men report more instances of finger dexterity skills, while in Uruguay, men more commonly report hand–foot–eye coordination and physical skills. These findings complement the existing literature on differences in skills between women and men (for example Black and Spitz-Oener 2010; Encinas-Martín and Cherian 2023) and may reflect occupational gender segregation (Cortes and Pan 2018; Hegewisch and Liepmann 2013).
-
Figure 3.6. Heterogeneity in applicants’ skill composition in Brazil and Uruguay, by sex, birth cohort and education
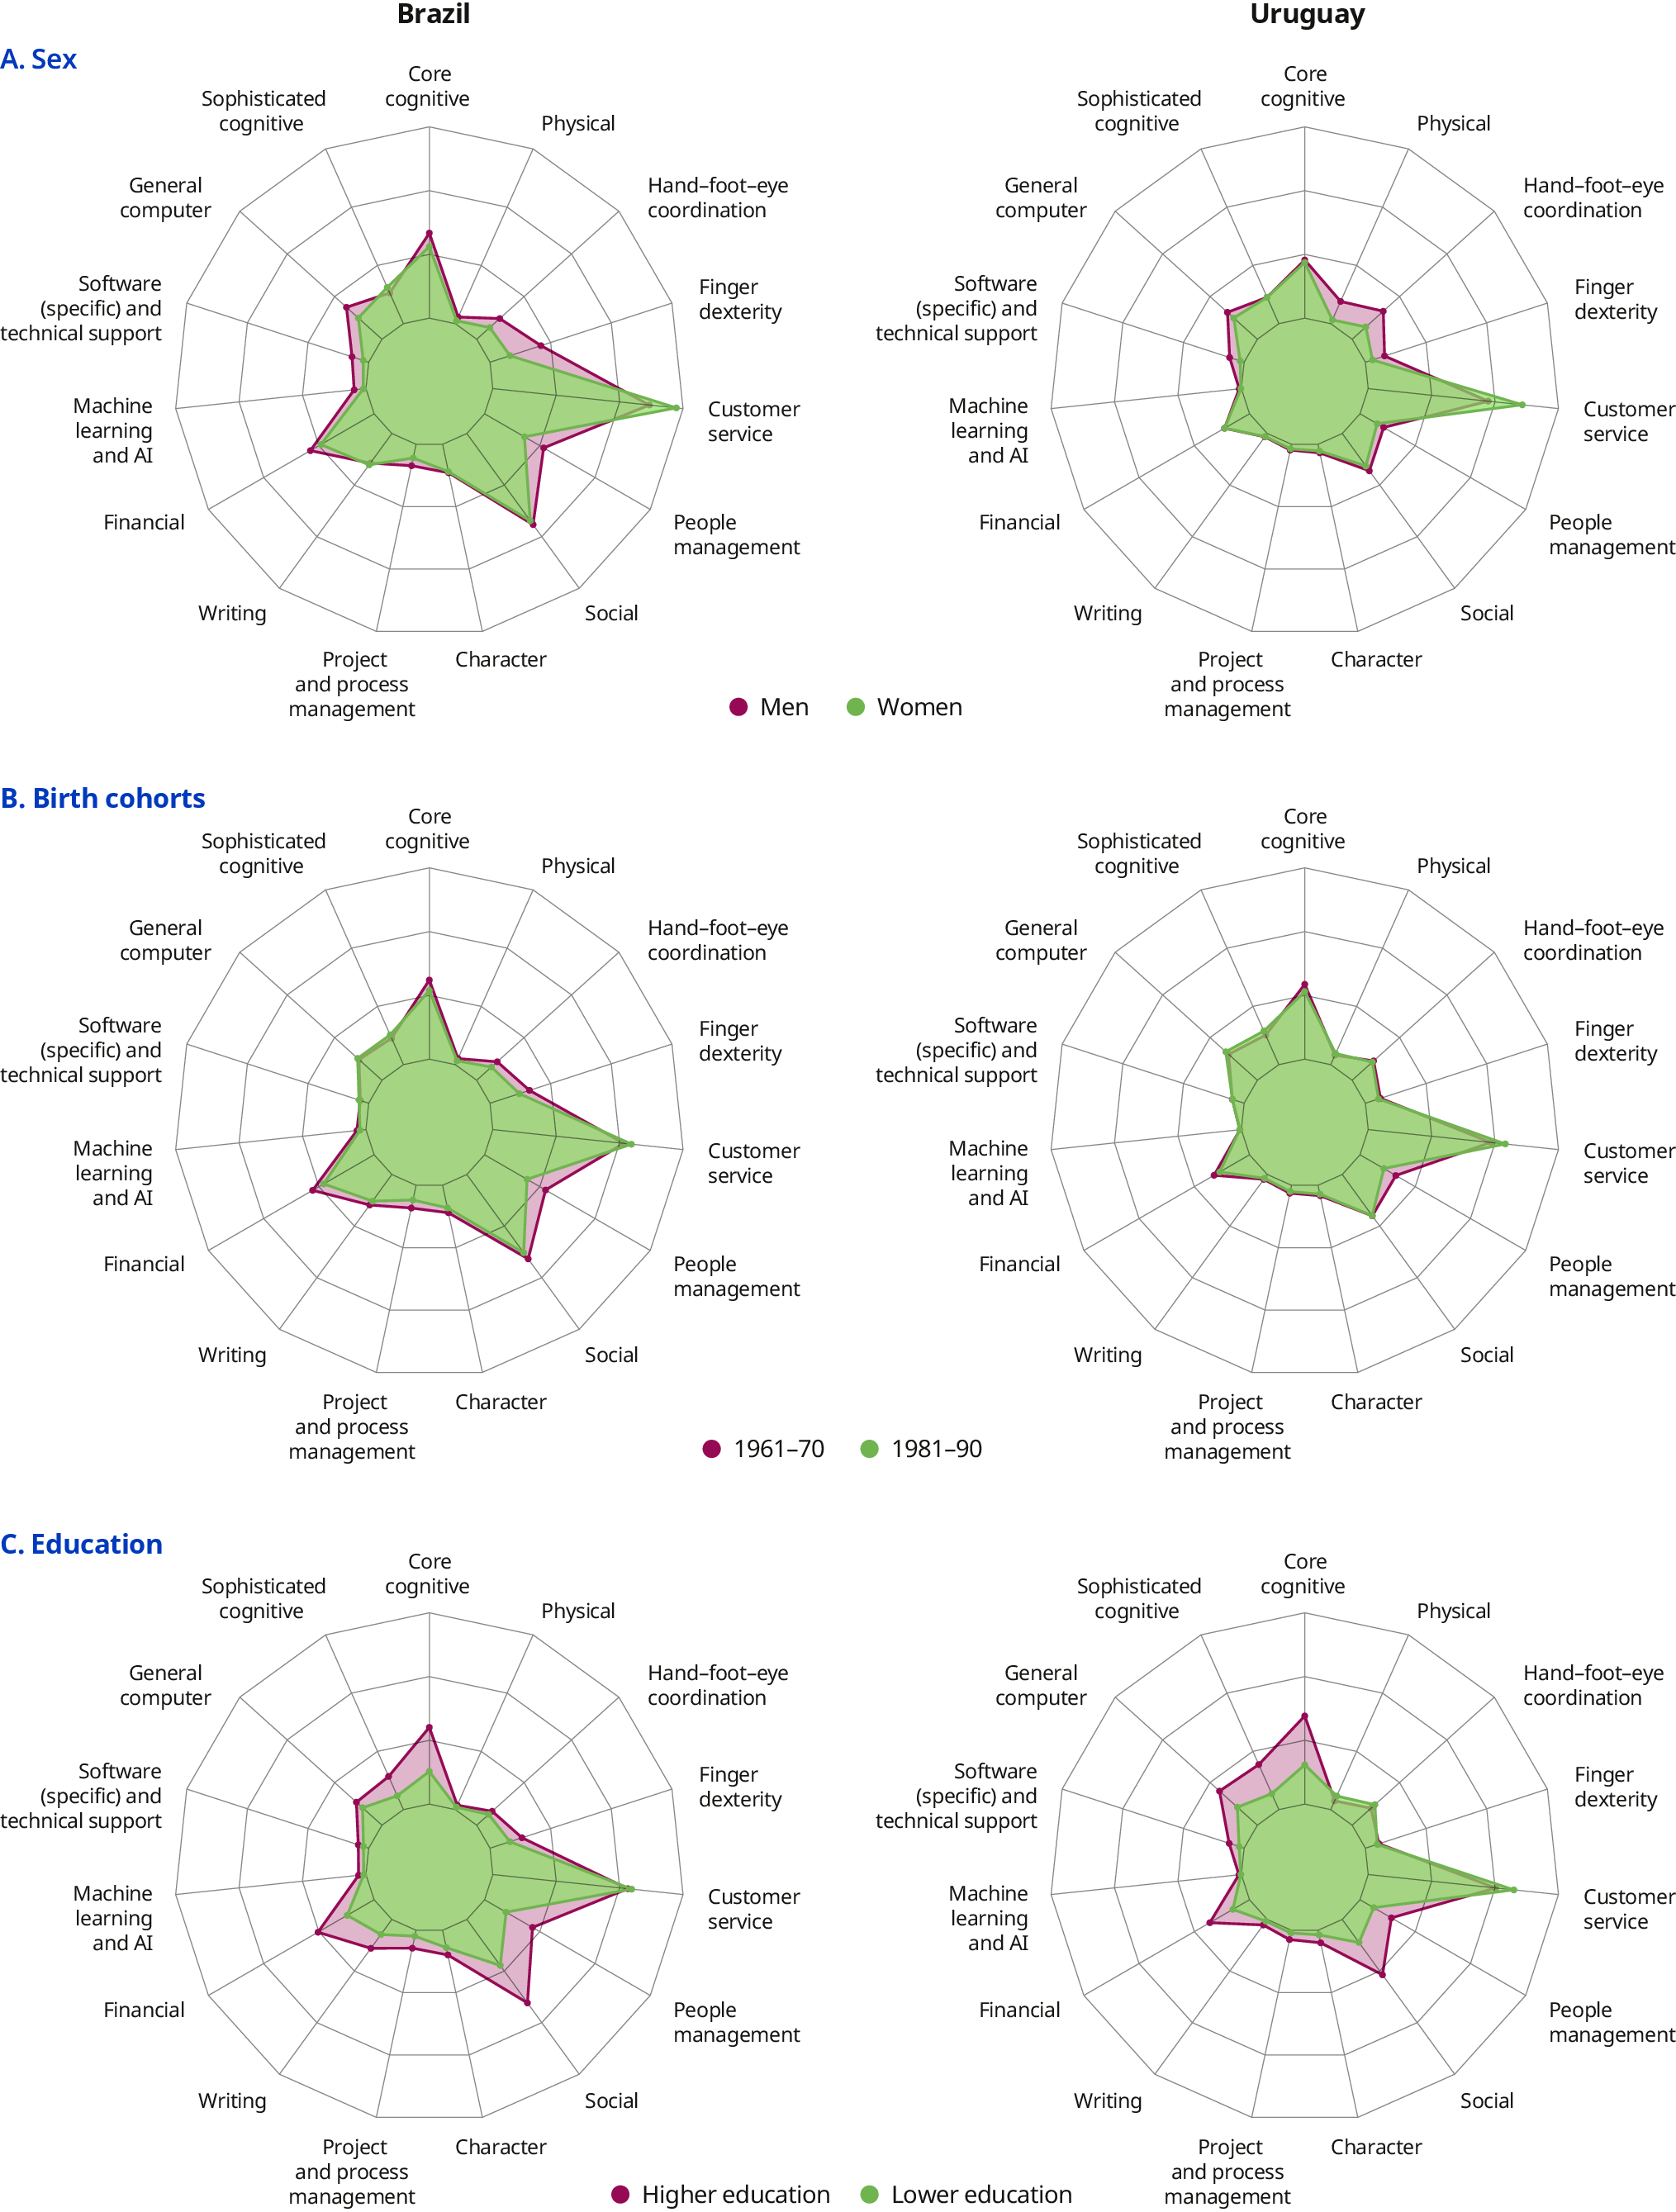
Note: The outermost ring of corresponds to 100 per cent of applicants mentioning a skill. Therefore, a marker further away from the centre means the given skill is more frequently reported in applicants’ employment histories. “Higher education” refers to individuals with vocational, technical or university education. “Lower education” includes individuals who do not report having completed any of these education types.
Source: Analysis based on BuscoJobs vacancy data (2010–23).
Age also plays a role in shaping workers’ skill sets. The middle panel in figure 3.6 compares the skills compositions of two cohorts – those born during the 1961–70 and 1981–90 periods – and reveals that older workers in Brazil have slightly broader skill sets, likely reflecting the accumulation of skills over their job histories, as the measure does not account for any potential skill decline over time. In contrast, differences are less pronounced in Uruguay. The most notable distinction is in people management skills, which are more prevalent among older workers, while general computer skills are more common among the younger generation. Other skills show minimal differences by age, such as sophisticated cognitive and character skills, suggesting that these skills remain relatively stable over the life cycle (Breit et al. 2024; Gander et al. 2020).
Lastly, notable differences exist in the distribution of skills by education level. The bottom panel of figure 3.6 shows that workers with higher education (with vocational, technical or university education) in Brazil and Uruguay report a broader range of skills, particularly the different types of cognitive and socio-emotional skills, compared to those with lower levels of education (individuals not reporting any of these types of education). It is possible that some of these differences come about because individuals with lower formal education levels do not describe their activities in as much detail: on average, the descriptions of their employment histories are shorter. Yet, for customer service skills in both countries and manual skills in Uruguay, individuals with lower levels of education are slightly overrepresented. When comparing university graduates with those who have vocational or technical training, the differences in skill sets are relatively small. This suggests that different types of education prepare individuals for distinct careers paths without necessarily resulting in large gaps in overall abilities. However, certain skills, such as software, financial or writing skills, are more frequently reported by individuals with university degrees. It is important to note that a significant share of the population aged 15 and above – estimated at 74.5 per cent in Uruguay – do not complete either of these educational paths (Escudero, Liepmann and Podjanin 2024).
Occupations and skill supply
Importantly, in contrast to the demand for skills, the skills composition reported by jobseekers varies significantly across occupations, as it is closely tied to the type of work performed. As shown in table 3.4, there are notable differences in the concentration of skills between occupations classified by ISCO-08 as requiring higher or lower skill levels. Managers (ISCO 1) and professionals (ISCO 2) report a broader range of skills, while plant and machine operators (ISCO 8) and workers in elementary occupations (ISCO 9) report a more limited set of skills. Clerical support workers and services and sales workers (ISCO 4 and 5) also have relatively concentrated skill sets, though they exhibit a comparatively higher prevalence of complementary cognitive skills.
In general, the skill sets highlighted by applicants across different job spells align with expected core skills for their respective occupations. For example, individuals who have worked as plant and machine operators (ISCO 8) or in elementary occupations (ISCO 9) tend to emphasize manual skills, with little mention of other competencies. Similarly, clerical support workers (ISCO 4) and services and sales workers (ISCO 5) predominantly emphasize customer service skills – the core component of their jobs – while reporting few additional skills. The analysis indicates that skills compositions reported by jobseekers in their profiles are more narrowly focused on the core skills of their occupations (for example job-specific skills) compared to the skills compositions of occupations found in job vacancies, which often list additional requirements, particularly character and social skills (see table 3.3).
|
Skill categories |
ISCO 1 |
ISCO 2 |
ISCO 3 |
ISCO 4 |
ISCO 5 |
ISCO 7 |
ISCO 8 |
ISCO 9 |
|---|---|---|---|---|---|---|---|---|
|
Cognitive skills |
||||||||
|
Core cognitive skills |
49 |
60 |
47 |
15 |
13 |
16 |
5 |
7 |
|
Sophisticated cognitive skills |
19 |
25 |
14 |
8 |
7 |
9 |
2 |
5 |
|
General computer skills |
17 |
22 |
24 |
12 |
8 |
17 |
4 |
8 |
|
Software (specific) skills and technical support |
4 |
13 |
9 |
1 |
2 |
6 |
1 |
1 |
|
Machine learning and AI skills |
1 |
1 |
1 |
0 |
0 |
3 |
0 |
0 |
|
Financial skills |
32 |
19 |
13 |
9 |
8 |
4 |
2 |
4 |
|
Writing skills |
6 |
2 |
1 |
1 |
1 |
1 |
0 |
1 |
|
Project and process management skills |
6 |
4 |
2 |
1 |
1 |
1 |
0 |
0 |
|
Socio-emotional skills |
||||||||
|
Character skills |
5 |
5 |
4 |
1 |
2 |
4 |
1 |
1 |
|
Social skills |
37 |
30 |
23 |
12 |
17 |
18 |
5 |
11 |
|
People management skills |
22 |
12 |
11 |
5 |
10 |
8 |
4 |
5 |
|
Customer service skills |
46 |
29 |
39 |
81 |
70 |
12 |
16 |
20 |
|
Manual skills |
||||||||
|
Finger dexterity skills |
3 |
3 |
5 |
2 |
3 |
42 |
7 |
16 |
|
Hand–foot–eye coordination |
9 |
5 |
7 |
6 |
8 |
14 |
66 |
38 |
|
Physical skills |
4 |
2 |
2 |
2 |
3 |
4 |
40 |
26 |
|
Number of vacancies |
12 450 |
77 809 |
34 236 |
276 362 |
103 475 |
10 265 |
10 651 |
26 789 |
▪Q1 (0.5%–1.6%) ▪Q2 (1.7%–4.1%) ▪Q3 (4.2%–8.5%) ▪Q4 (8.6%–18.7%) ▪Q5 (18.8%–100%)
Key: ISCO categories: 1 – Managers; 2 – Professionals; 3 – Technicians and associate professionals; 4 – Clerical support workers; 5 – Services and sales workers; 7 – Craft and related trade workers; 8 – Plant and machine operators and assemblers; 9 – Elementary occupations.
Note: Certain values may appear to belong in a differently coloured range due to rounding. The category of skilled agricultural, forestry and fishery workers (ISCO 6) was excluded due to insufficient observations.
Source: Analysis based on BuscoJobs applicants’ data (2010–23).
Against this background, Luu and Escudero (forthcoming) examine skills mismatches in Uruguay. First, they capture “skills tightness” as the ratio of vacancies requiring a given skill to the number of applicants showcasing that skill on a monthly basis. The second measure predicts the skills workers are expected to have, based on the occupations they report and the skills that vacancies require for those occupations in the data. The results suggest that, while a significant number of workers in the online labour market of the country possess skills that are relevant to employers’ needs, they often lack – or fail to effectively communicate – the complete set of skills employers are seeking. This indicates that barriers beyond skills gaps – such as the accuracy of skills reporting – may also be hindering effective labour market matching. Addressing these issues could involve supporting individuals in creating more complete and accurate applications that not only reflect their full range of skills but are also tailored to the specific requirements of the jobs they are applying for – ultimately improving the labour market matching process.
3.4. Skills bundles and skills interconnectedness
While the previous analysis assessed skills individually, skills do not exist in isolation. Instead, jobs typically require a diverse set of skills that work together to perform tasks effectively. By assessing these combinations using network analysis and complexity methods, the remainder of this chapter helps gain a better understanding of the interplay between different skill types and how these interconnections lead to better labour market outcomes. This answers the ultimate question of which skills need to be fostered for workers to access better jobs.
The relevance of skills bundles is reflected in the online job vacancy data analysed in this report. In Brazil, the Russian Federation, South Africa and Uruguay, for example, the majority of vacancies require three or more skills, and most applicants list two or more skills in their applications (figure 3.7). In line with these findings, the interconnectedness of skills is becoming an active area of investigation. Studies emphasize that the demand for, and remuneration of, a given skill often depends on the type of skills it is combined with (Deming and Kahn 2018; Rodrigues, Fernández-Macías and Sostero 2021; Stephany and Teutloff 2024).
-
Figure 3.7. Share of vacancies and applicants in selected countries, per number of identified skills (percentage)
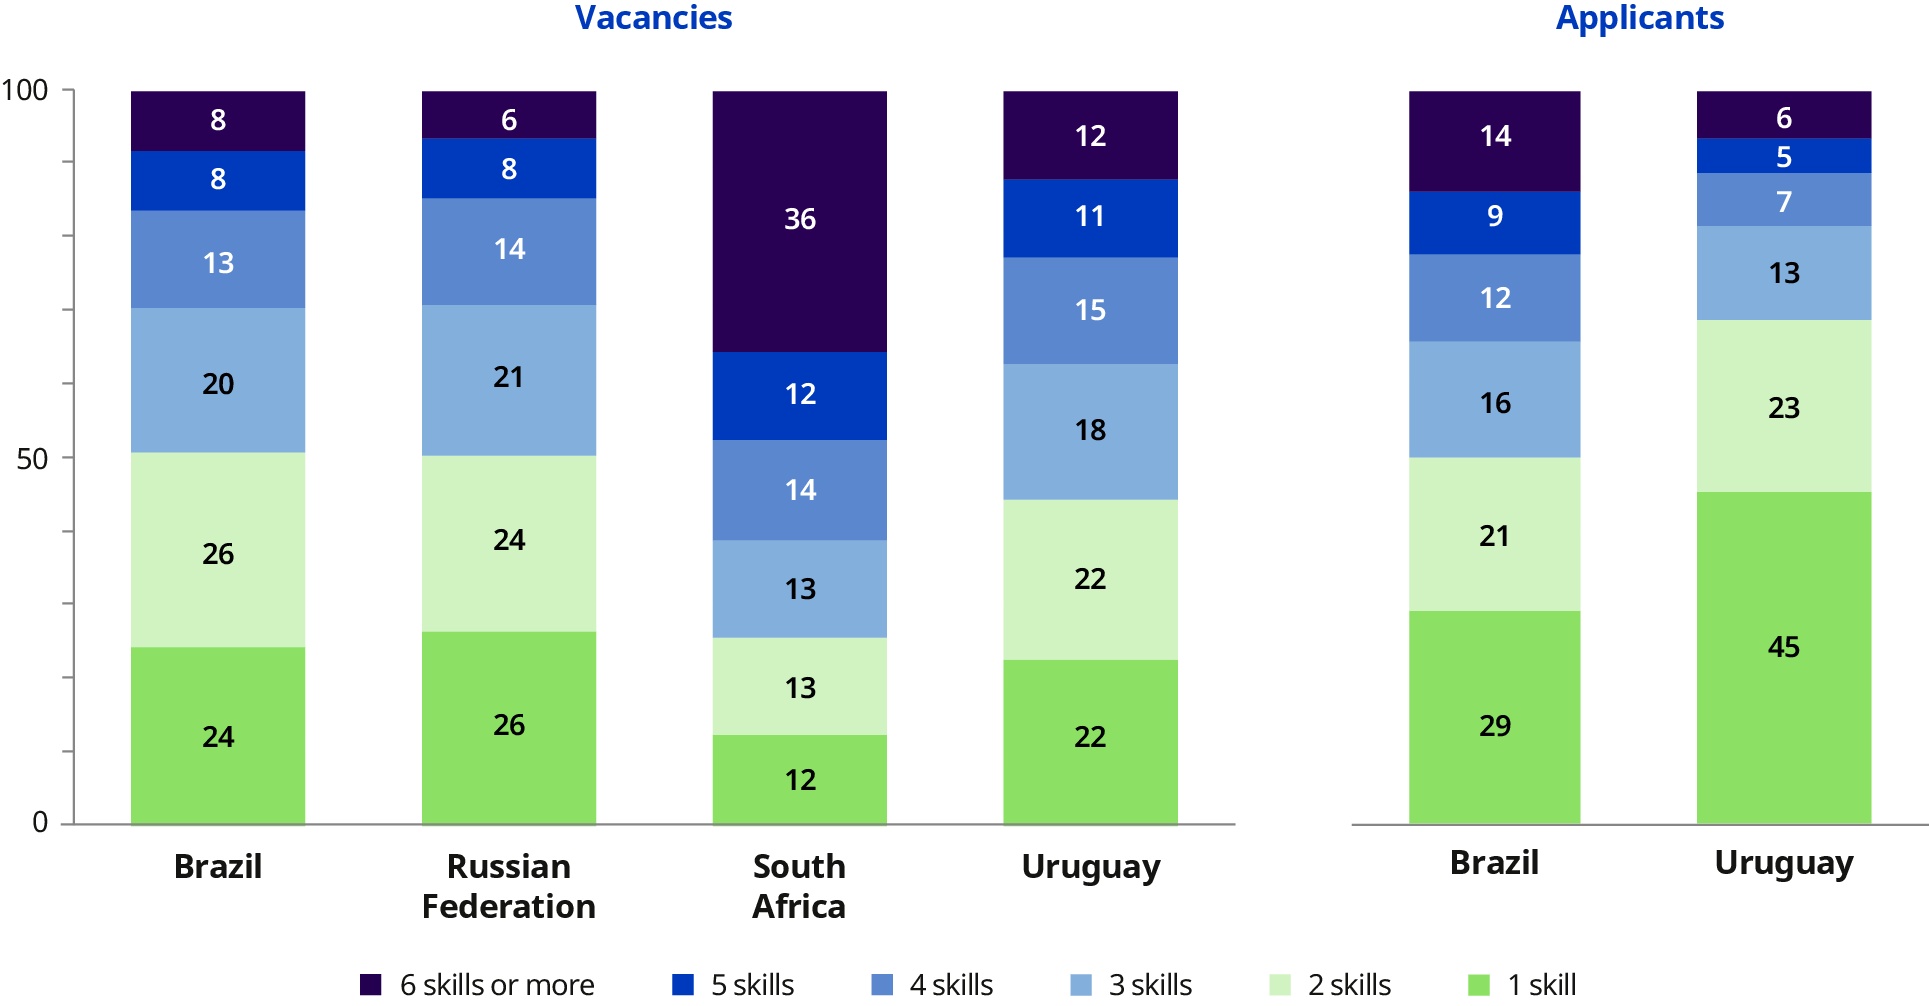
Source: Analysis based on BuscoJobs data for Brazil and Uruguay (2010–23) and Adzuna data for the Russian Federation and South Africa (2016–21).
3.4.1. Identifying skill interconnections
Figure 3.8 shows that there are strong connections between the skills listed in vacancies, as represented by the density of the lines linking them. Notable connections are visible among the four types of socio-emotional skills, as well as between these skills and cognitive skills (both core and sophisticated) and computer skills, across all countries considered.
The connection between social skills and core cognitive skills is most pronounced in Egypt, Jordan, the United Arab Emirates and Uruguay. There are some additional country-specific patterns. Brazil, for example, displays the most pronounced links between the various socio-emotional skills. For South Africa, the relevance of skills bundles is most evenly spread across the various skills. Even skills that are less frequently mentioned in vacancies are typically required in combination with core cognitive, character and social skills, respectively. For instance, of all South African vacancies that require machine learning and AI skills, 48 per cent also require core cognitive skills, 52 per cent character skills and 76 per cent social skills.
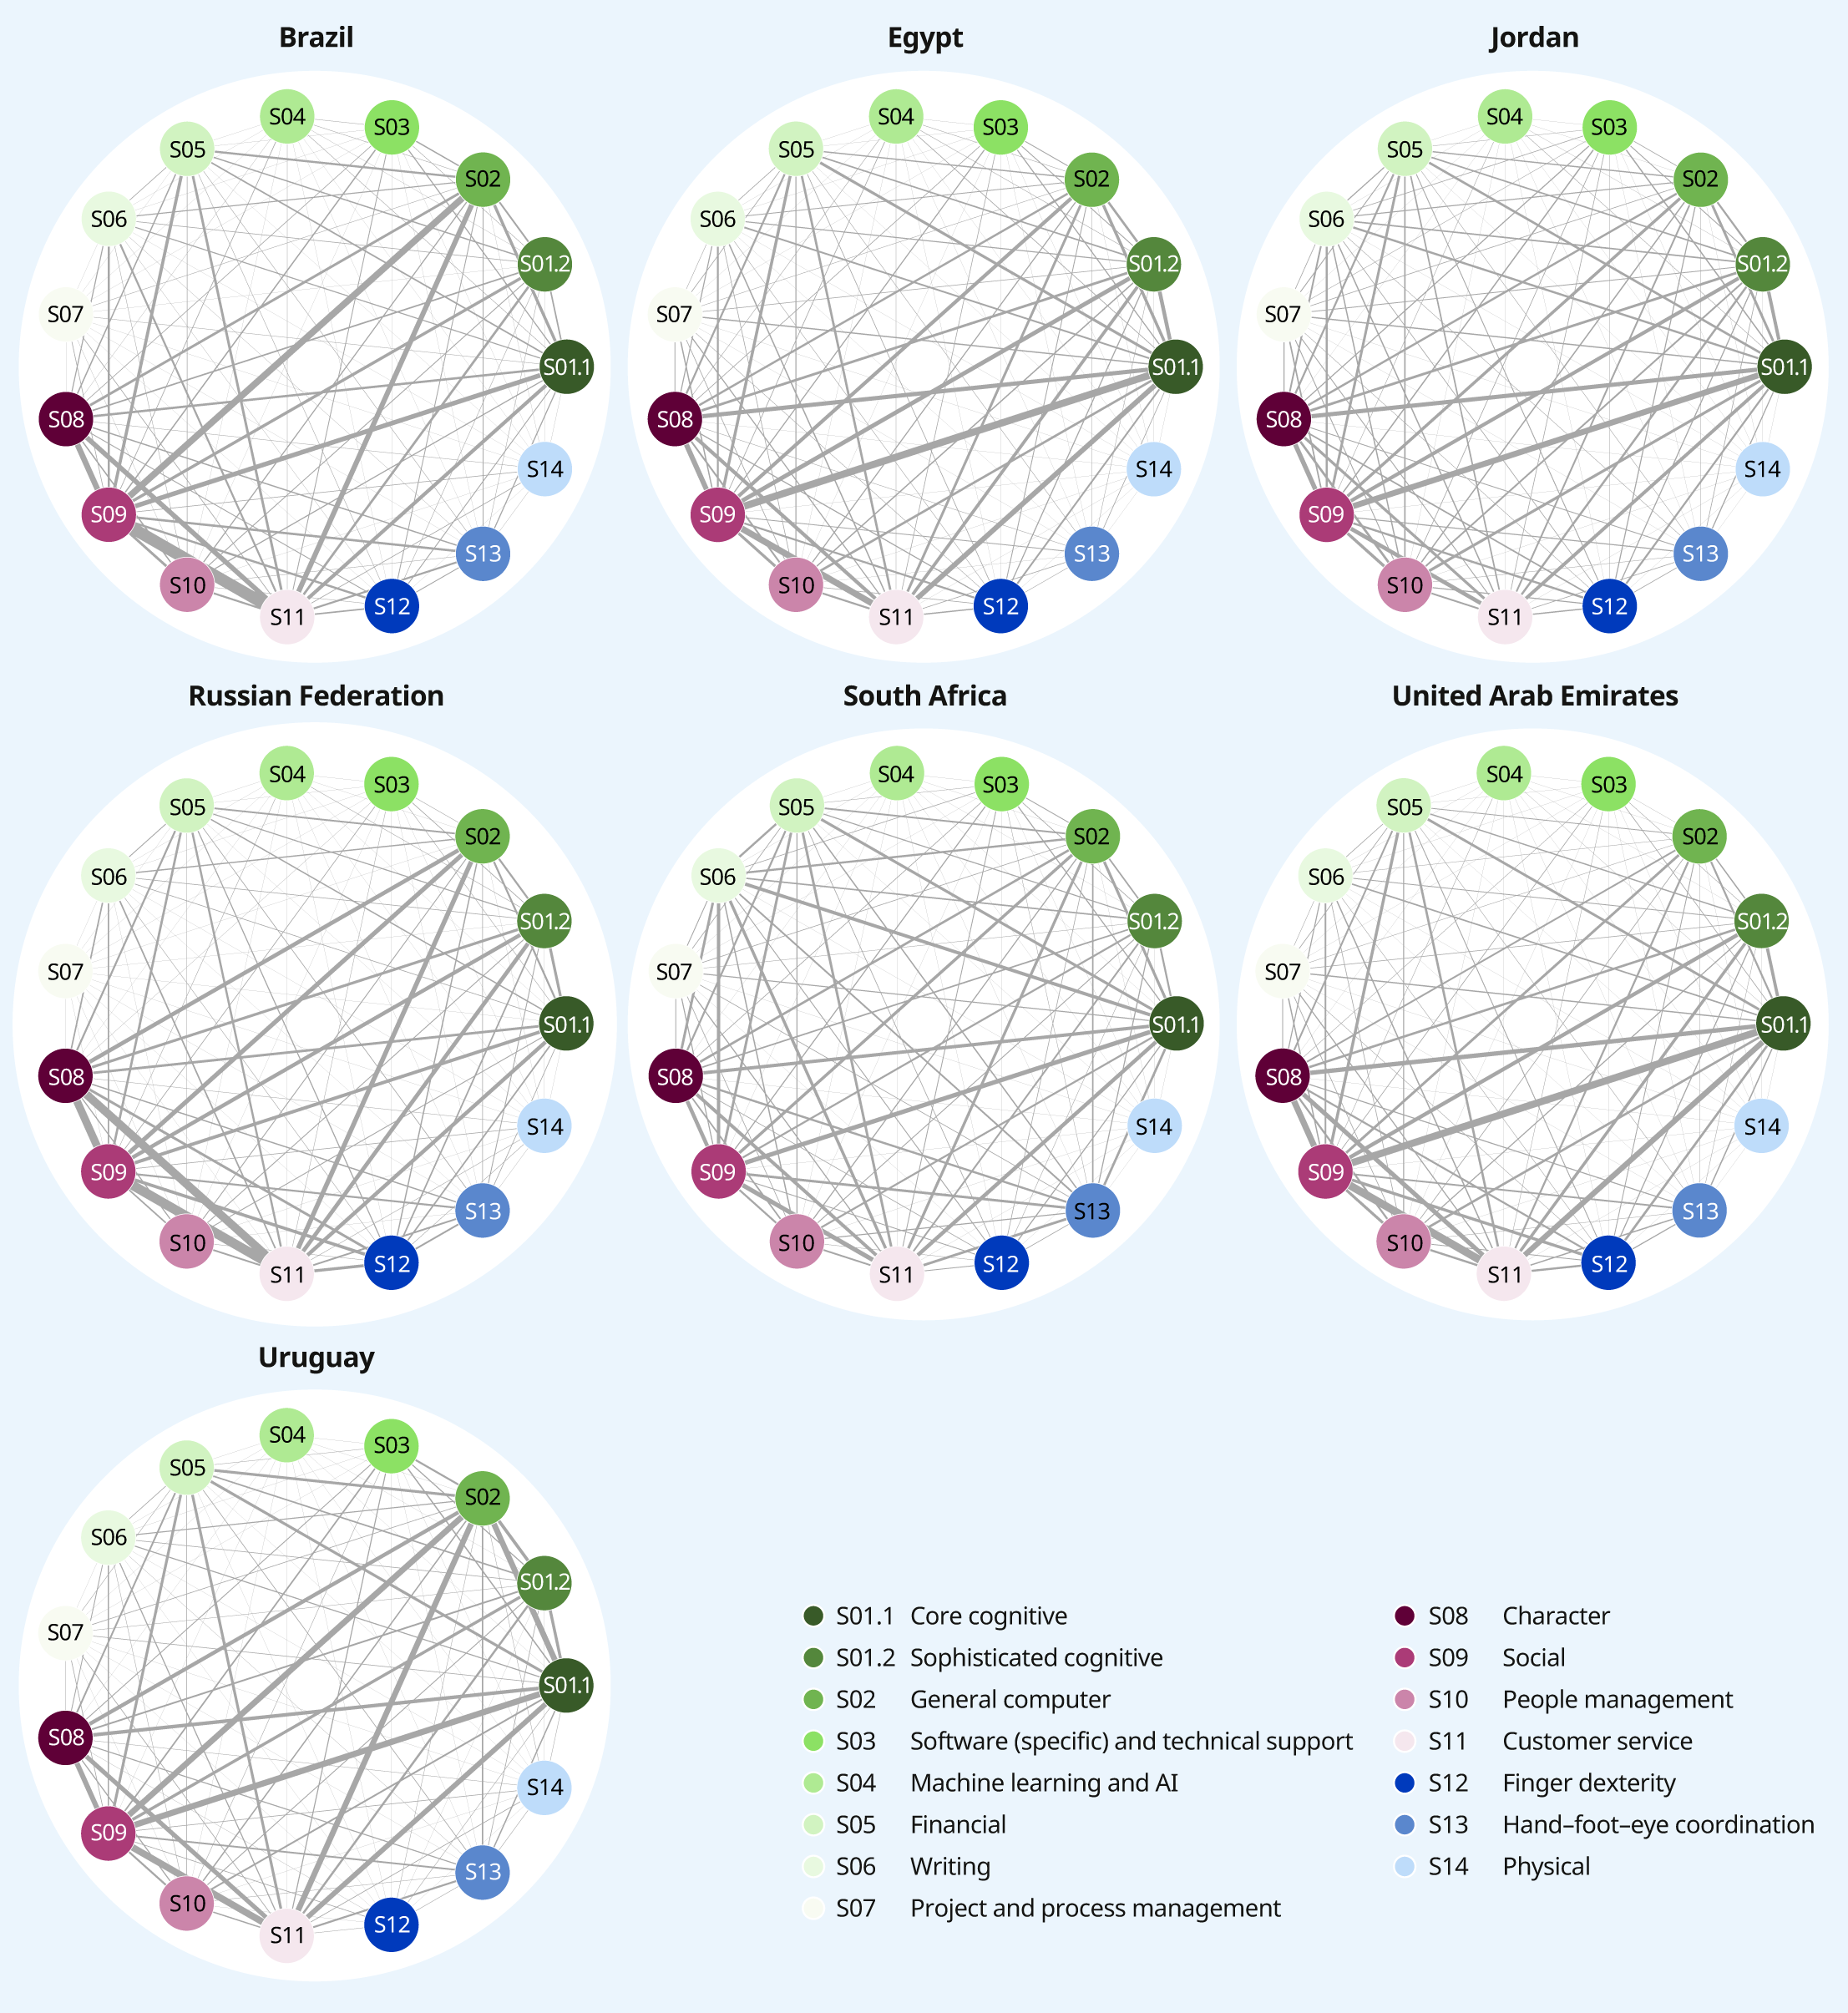
Note: Each skill network shows the relationships between skills in each country. Thicker lines indicate higher frequency of both skills being jointly required in job adverts.
Source: Analysis based on vacancy data from BuscoJobs Brazil and Uruguay (2010–23), Adzuna for the Russian Federation and South Africa (2016–21), and ESCWA for Egypt, Jordan and the United Arab Emirates (2020–24).
The frequency of some of these connections between skills is evident across different occupations, as shown for Brazil, the Russian Federation, South Africa and Uruguay in figure 3.9. For example, vacancies for both managerial and elementary occupations typically require core cognitive skills and general computer skills, combined with social and character skills, respectively. This underscores the fundamental importance of these skills bundles throughout the labour market. However, differences across occupations arise when looking at other combinations of skills. Vacancies for elementary occupations tend to emphasize a blend of manual and socio-emotional skills, while managerial ones naturally show fewer connections between manual and other types of skills. Instead, managerial occupations exhibit comparatively diversified skills bundles, including links between financial and writing skills, alongside core cognitive and all socio-emotional skills. In general, higher-level occupations within the occupational hierarchy require a more diverse and complex set of skills. They can therefore be considered more sophisticated from the skill perspective, as illustrated by the two measures of skills complexity and occupational sophistication described in box 3.4.
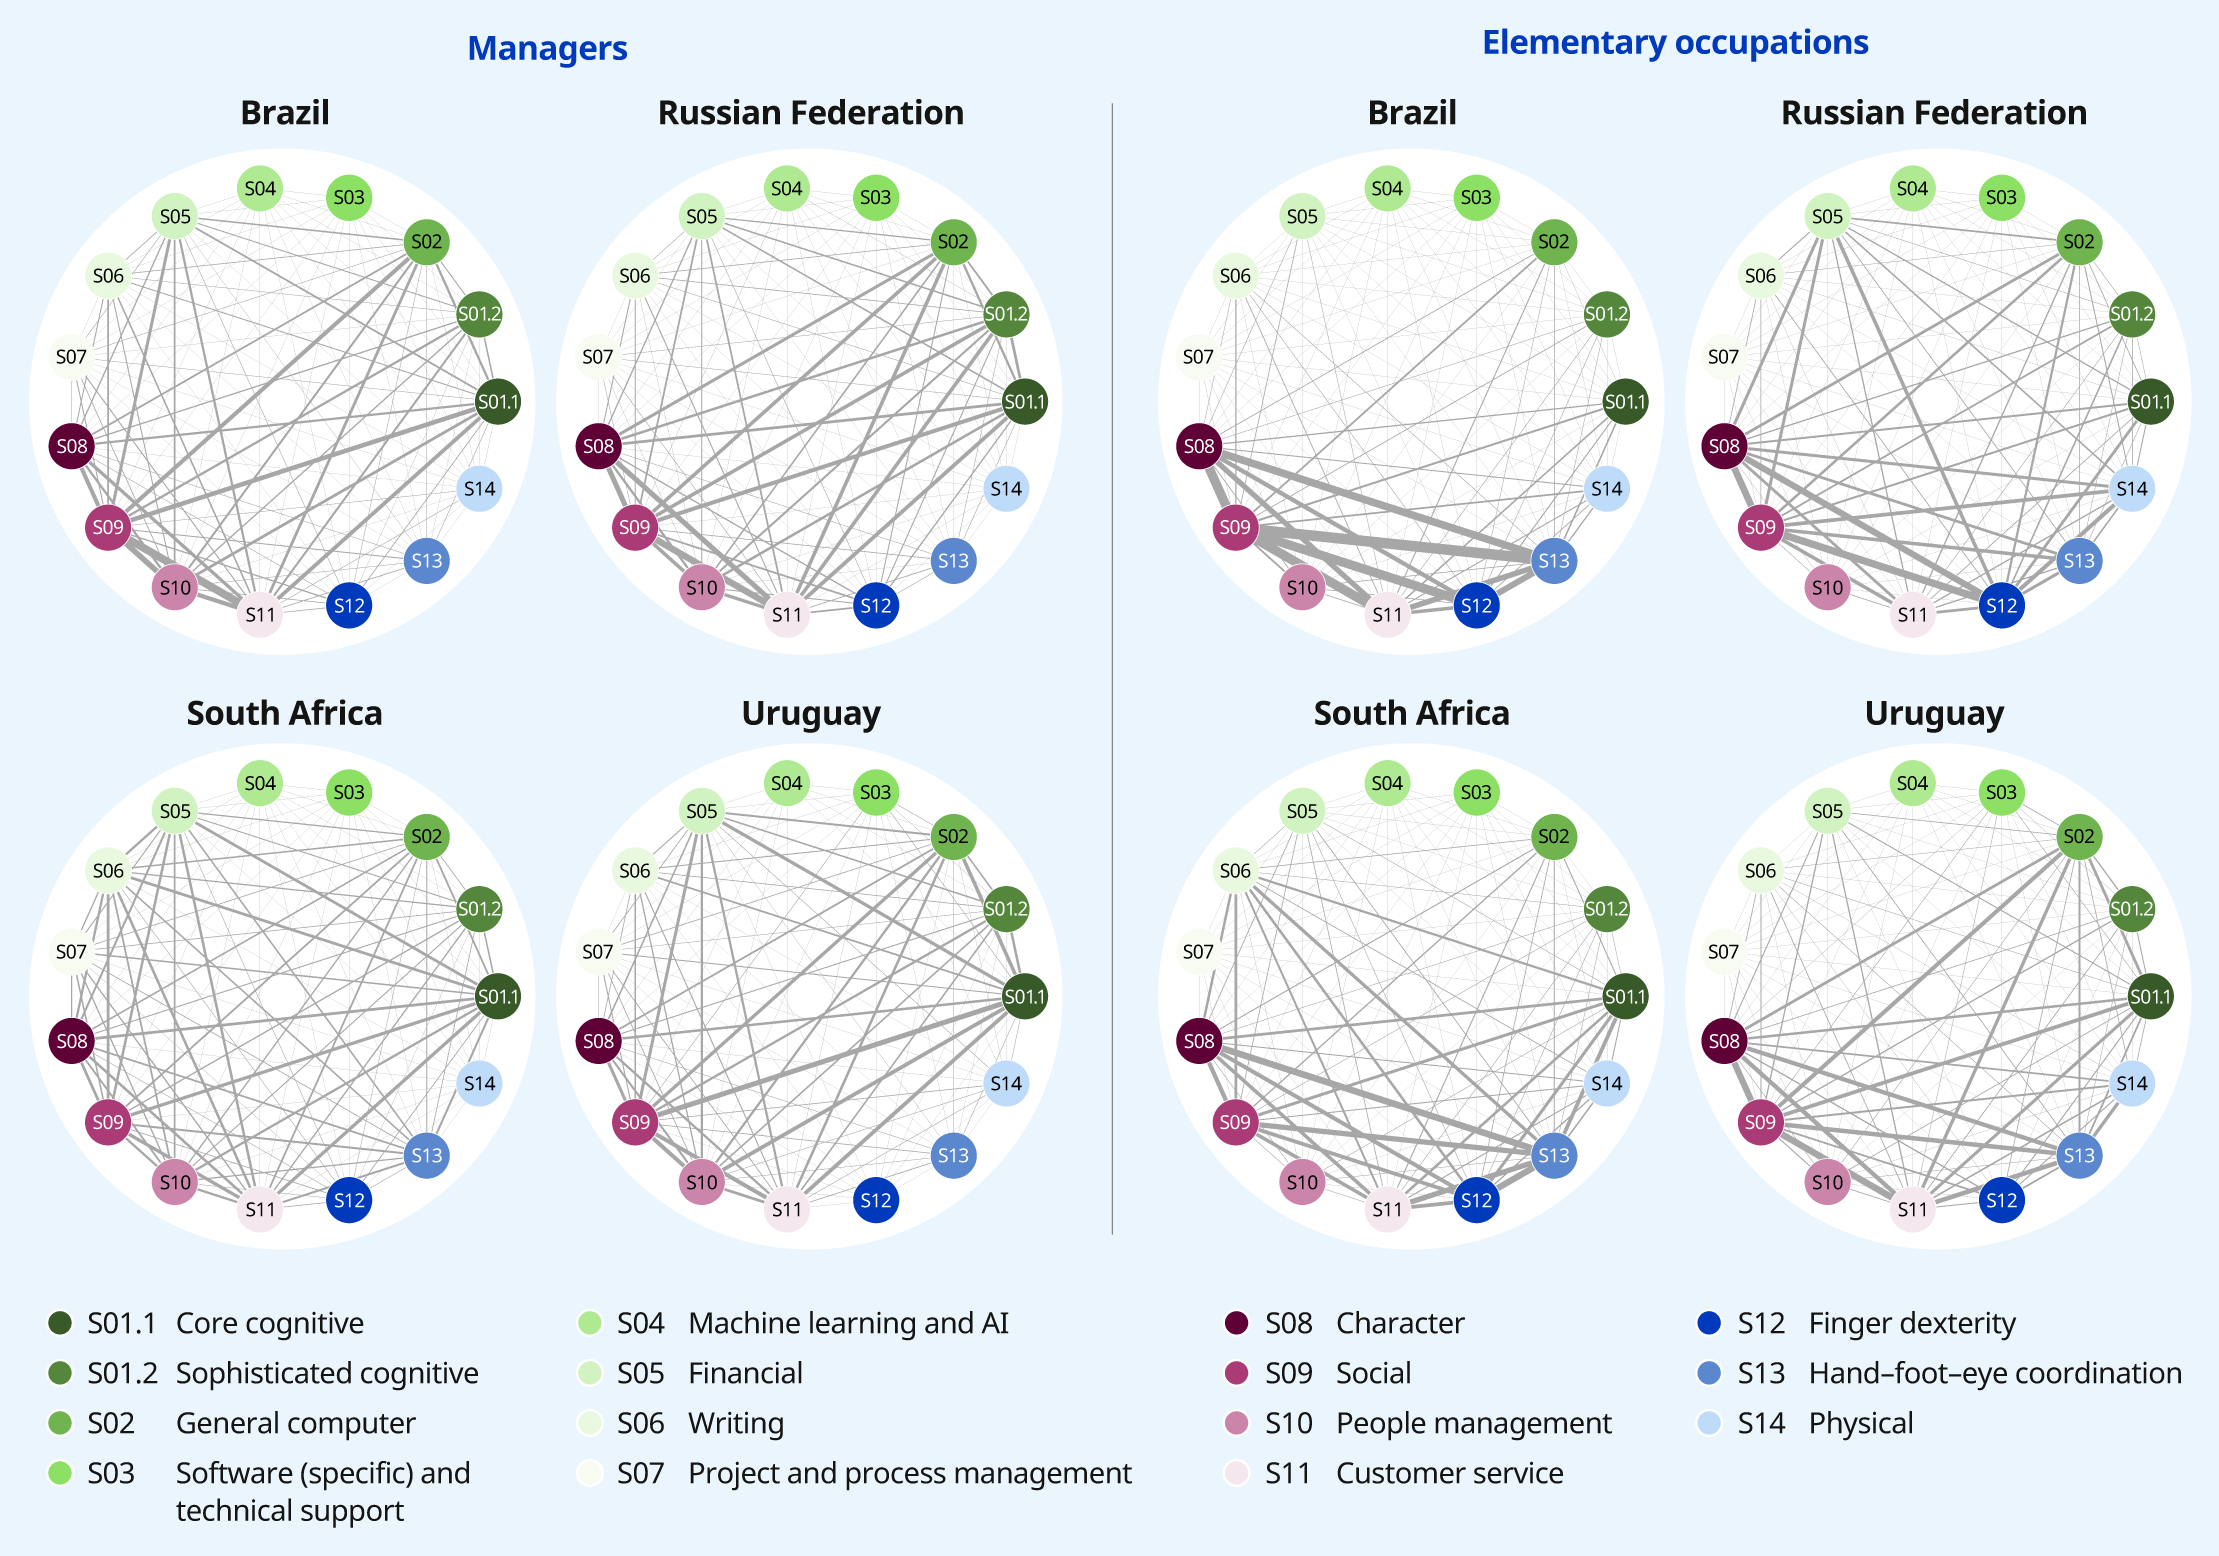
Note: Each skill network illustrates the relationships between skills within each country, separately for managers and elementary occupations. Thicker lines indicate higher frequency of both skills being jointly required in job adverts.
Source: Analysis based on vacancy data from BuscoJobs for Brazil and Uruguay (2010–23) and Adzuna for the Russian Federation and South Africa (2016–21).
The relationship between skills and occupations is not strictly linear. While higher-skill occupations, as classified by ISCO-08, typically offer better pay than lower-skill occupations, this is not always the case (see section 3.5). Within an occupation, certain roles may command higher pay depending on the diversity and difficulty of the required skill set. Accessing higher-skill occupations often requires a broader, more complex skill set, making these roles rarer and better compensated. This chapter uses two interrelated measures – the Skills Complexity Score and the Occupations Sophistication Score – to characterize the relationship between skills and occupations.
The Skill Complexity Score captures how challenging it is to acquire a particular skill, inferred from how specialized the skill is (as opposed to widely used), and whether it is predominantly found in more sophisticated occupations (defined in the next paragraph). Skills that build on multiple prerequisite skills receive a higher complexity score (see section 3.4.2). Skills that are common, or those that are rare but concentrated in less sophisticated occupations, are assigned lower complexity scores (Aufiero et al. 2024).
The sophistication score evaluates an occupation’s sophistication based on the quantity and complexity of skills it demands.55 It is calculated as the sum of skills required in an occupation, where each skill is weighted by its respective complexity score. As an occupation requires a greater number of more complex skills, its sophistication score increases.
Skill complexity and occupational sophistication are interconnected and computed through an iterative process in which the complexity of a skill is informed by the sophistication of the occupations in which it appears, and vice versa.
Table 3.5 presents the application of these two measures using vacancy data from South Africa. First, skills subcategories appear in order of their complexity score. Physical skills are omitted due to limited data coverage. The highest complexity scores are found for machine learning and AI skills, as well as for software and technical skills, followed by project and process management skills. These skills are the most complex and challenging to master, as they require a wide range of cognitive and socio-emotional skills to be performed effectively (further explored in section 3.4.2).
Then, occupations are ranked by their sophistication score, highlighting the five highest and lowest-ranked occupations (at the ISCO 2-digit level). As expected, managerial (ISCO 1) and professional occupations (ISCO 2) exhibit the highest sophistication, reflecting their requirements for a large number of complex skills. Conversely, less sophisticated occupations – such as specific service and sales roles – as well as some craft and related trades, show less skill complexity. Consistent with the ISCO-08 classification, sophistication tends to increase as one moves up the occupational hierarchy.
-
Table 3.5. Complexity of skills and sophistication of occupations based on South African vacancies, 2016–21
|
Complexity of skills |
|
|---|---|
|
Skills |
Complexity score |
|
Machine learning and AI |
40.5 |
|
Software (specific) and technical support |
16.0 |
|
Project and process management |
7.1 |
|
Sophisticated cognitive |
3.5 |
|
People management |
2.9 |
|
Financial |
2.4 |
|
Finger dexterity |
2.3 |
|
General computer |
1.9 |
|
Writing |
1.7 |
|
Hand–foot–eye coordination |
1.3 |
|
Core cognitive |
1.3 |
|
Character |
1.2 |
|
Customer service |
1.1 |
|
Social |
1.0 |
|
Sophistication of occupations |
|
|
Occupation (2-digit ISCO level) |
Sophistication score |
|
25. Information and communications technology professionals |
3.0 |
|
21. Science and engineering professionals |
2.0 |
|
11. Chief executives, senior officials and legislators |
1.9 |
|
12. Administrative and commercial managers |
1.9 |
|
13. Production and specialized services managers |
1.8 |
|
(…) |
|
|
93. Labourers in mining, construction, manufacturing and transport |
1.1 |
|
83. Drivers and mobile plant operators |
1.1 |
|
91. Cleaners and helpers |
1.1 |
|
53. Personal care workers |
1.1 |
|
94. Food preparation assistants |
1.0 |
Note: A higher complexity score means that a skill is more challenging to acquire. A higher sophistication score means that more skills are required by the occupation, and more complex ones.
Source: Analysis based on Adzuna vacancy data for South Africa (2016–21).
For applicants in Brazil and Uruguay, the patterns of skill interconnections broadly mirror those observed in vacancies. The intensity of these interconnections is generally lower, given the previous finding that applicants tend to report their skills less comprehensively in comparison to the skill descriptions in vacancies. When looking at different groups of workers by sex and education, the overall patterns remain consistent between these groups (see figure 3.10, which focuses on Uruguay). However, there are some distinctions: male applicants are slightly more likely to report skills bundles involving manual skills, whereas female jobseekers emphasize stronger combinations of customer service with core cognitive, financial and social skills. This pattern aligns with occupational gender segregation, where women are overrepresented in clerical support roles that require a mix of financial, customer service and complementary skills. In contrast, men are more frequently found in elementary occupations where manual and complementary skills are required jointly (see section 3.3).
When it comes to education, applicants with vocational or university education do not display strong differences in their skill networks compared to those without such qualifications. However, applicants without vocational or university education tend to highlight stronger connections between customer service skills and other skills, including general computer skills. The linkages among manual skills and between manual and customer service skills are also notable. In contrast, individuals with higher educational attainment tend to show slightly stronger links between financial and both sophisticated cognitive and people management skills, as well as between various cognitive and socio-emotional skills.
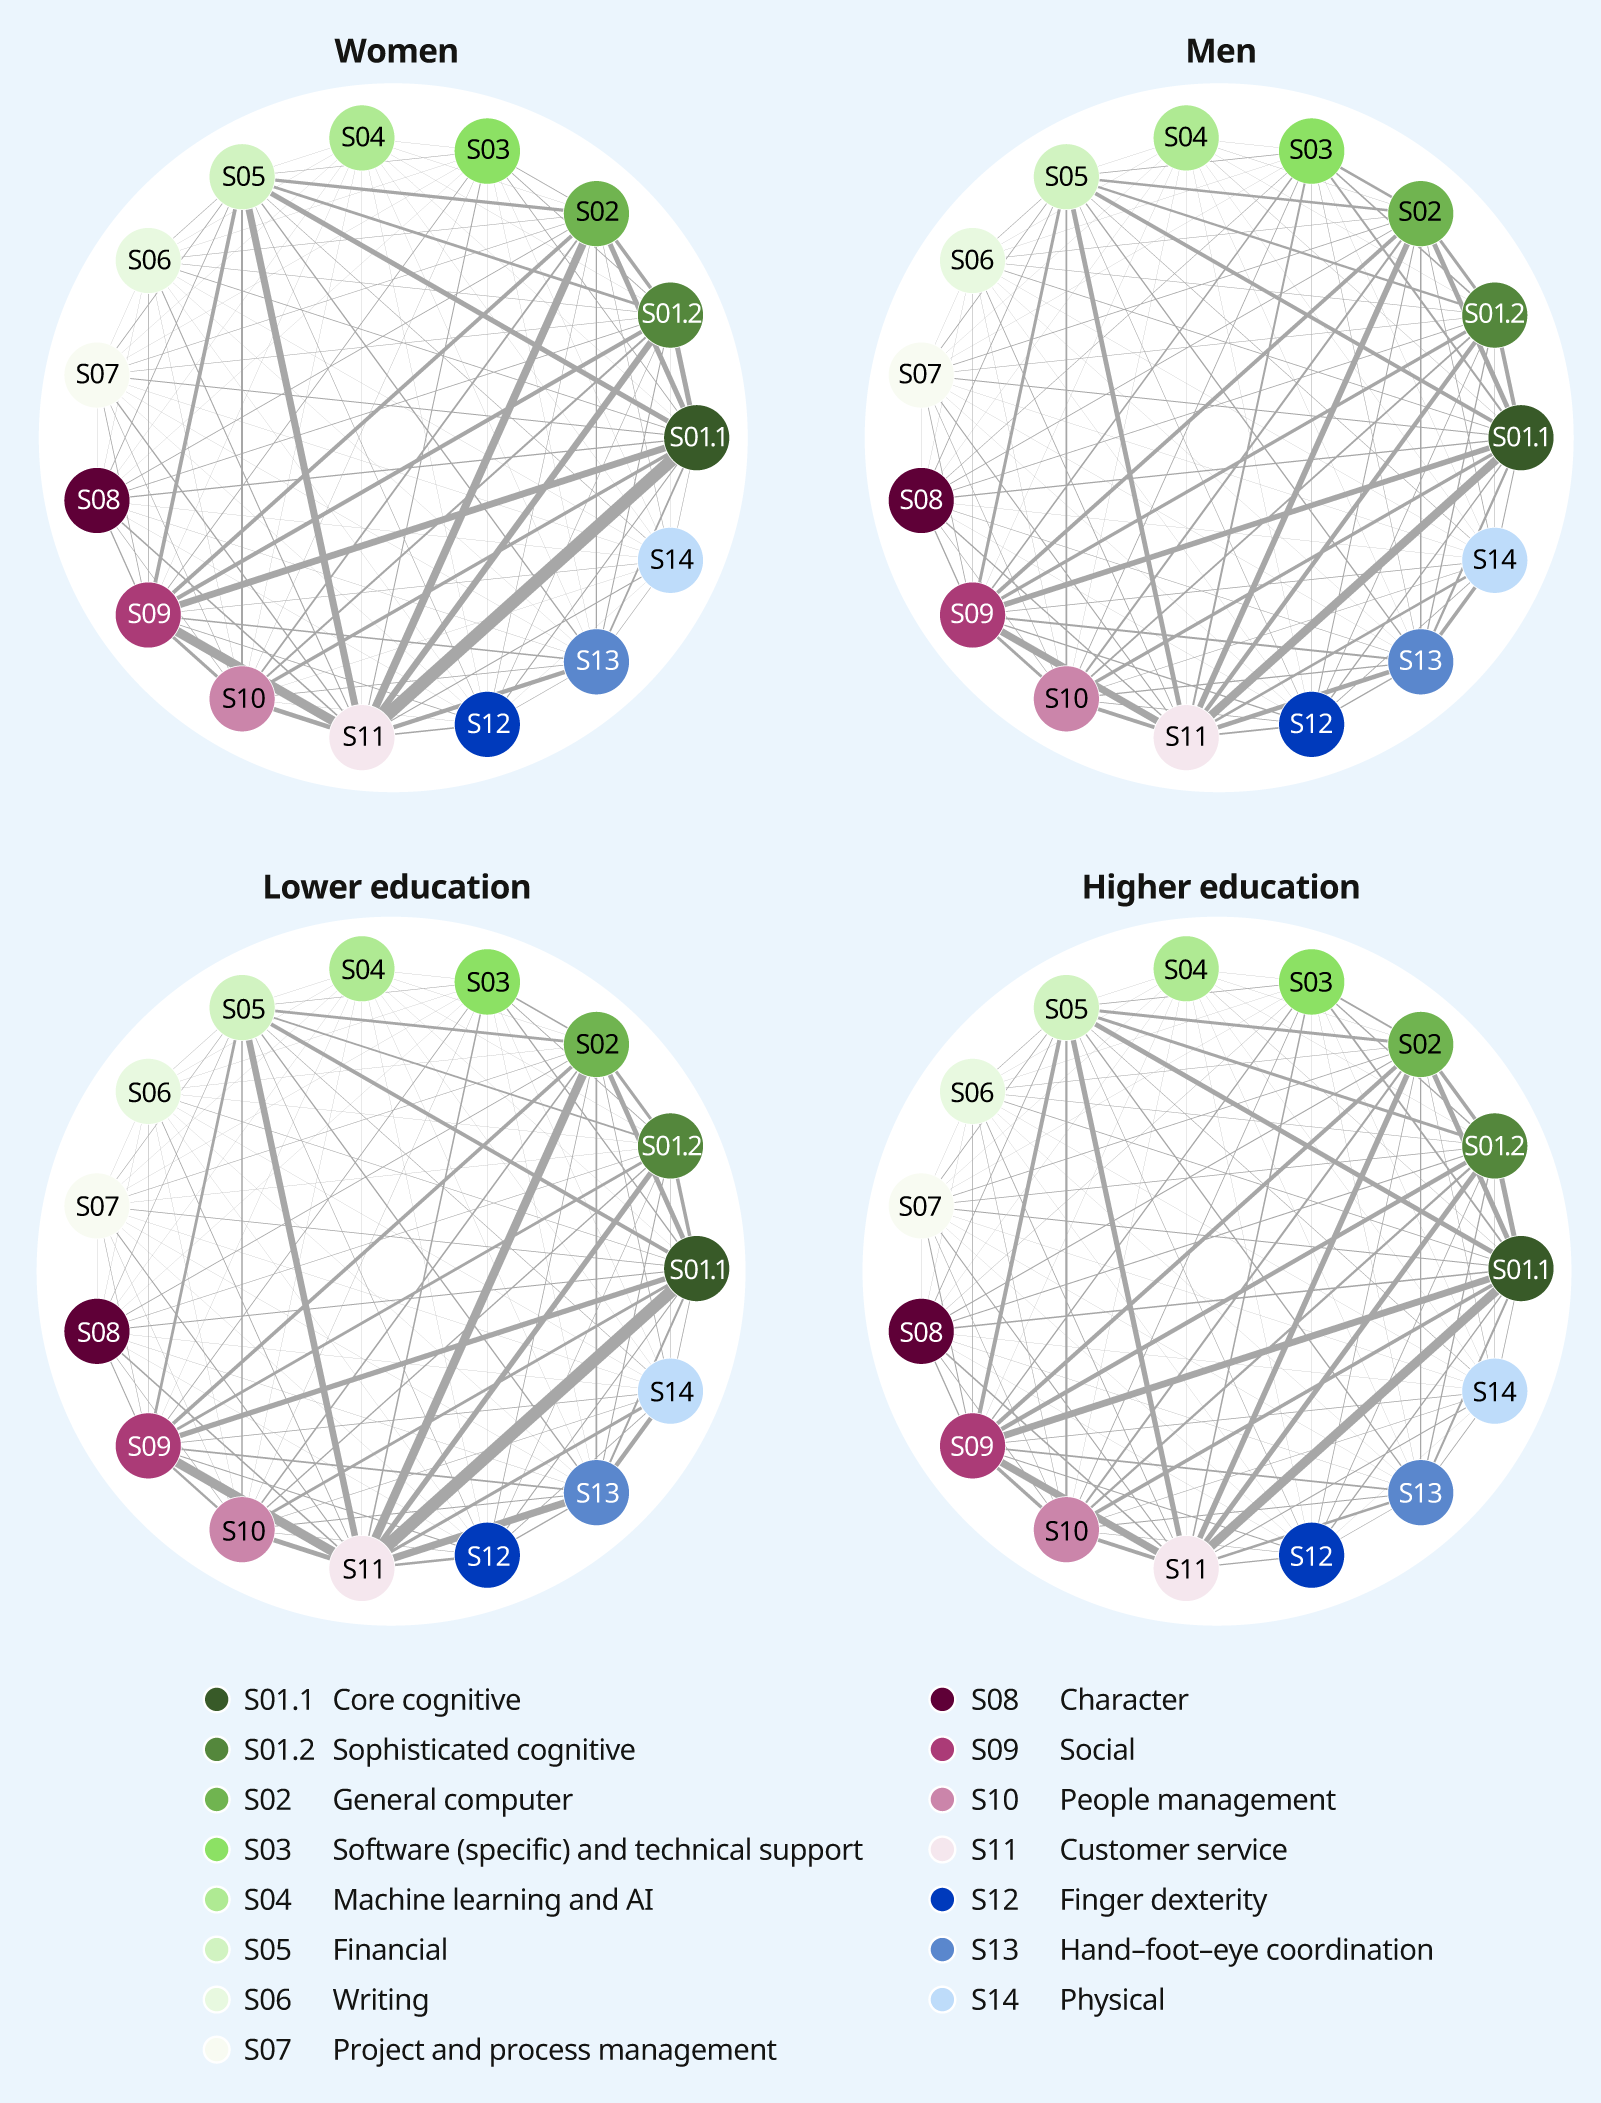
Note: Each skill network illustrates the relationships between skills mentioned in jobseekers’ employment histories, categorized by sex and education level. Thicker lines indicate higher frequency of both skills being jointly mentioned by jobseekers. Skills are aggregated across all job spells of a worker. “Higher education” refers to individuals with vocational or technical education, or university degrees. “Lower education” includes individuals who do not report having completed any of these education types.
Source: Analysis based on BuscoJobs applicants’ data for Uruguay (2010–23).
3.4.2. Characterizing skill interconnections
Having established the prominence of various skills bundles, this section further explores the nature of these interconnections in vacancy data. Using the bipartite network projection method introduced by Zhou et al. (2007), it examines the co-occurrence of skills in vacancies, the strength of the connections and their directionality. This analysis provides a more nuanced understanding of the underlying network structure, which is essential for determining how skills should be taught and learned, and for mapping the progression from prerequisite skills to more complex ones.
Figure 3.11 reveals two important patterns: first, several pairs of skills exhibit asymmetrical relationships, where the strength of the connection from one skill to another is significantly greater than in the opposite direction.56 This means that other skills are frequently observed alongside this skill in job vacancies, but not necessarily the other way around. This suggests that proficiency in one skill is often a prerequisite for acquiring or applying another, but not vice versa. Second, when these asymmetrical relationships are considered alongside the position and size of each node in the network, they reveal key dimensions of skill complexity. As noted earlier (box 3.4), skills that depend on many others – that is, those built on a broad base of foundational competencies – are assigned higher complexity scores.
In figure 3.11, such complex skills are represented by smaller nodes positioned at the top of the network. These more complex skills typically receive many incoming links from prerequisite skills but generate few outgoing links, except to other equally complex skills.57 Together, these patterns indicate that the most complex skills are those that require the support of other skills for mastery but are not themselves prerequisites for mastering other skills. Conversely, foundational skills may be less complex but are critical for the development of other more complex competencies.
-
Figure 3.11. Skills networks showing asymmetrical relationships based on vacancy data complexity scores, by country
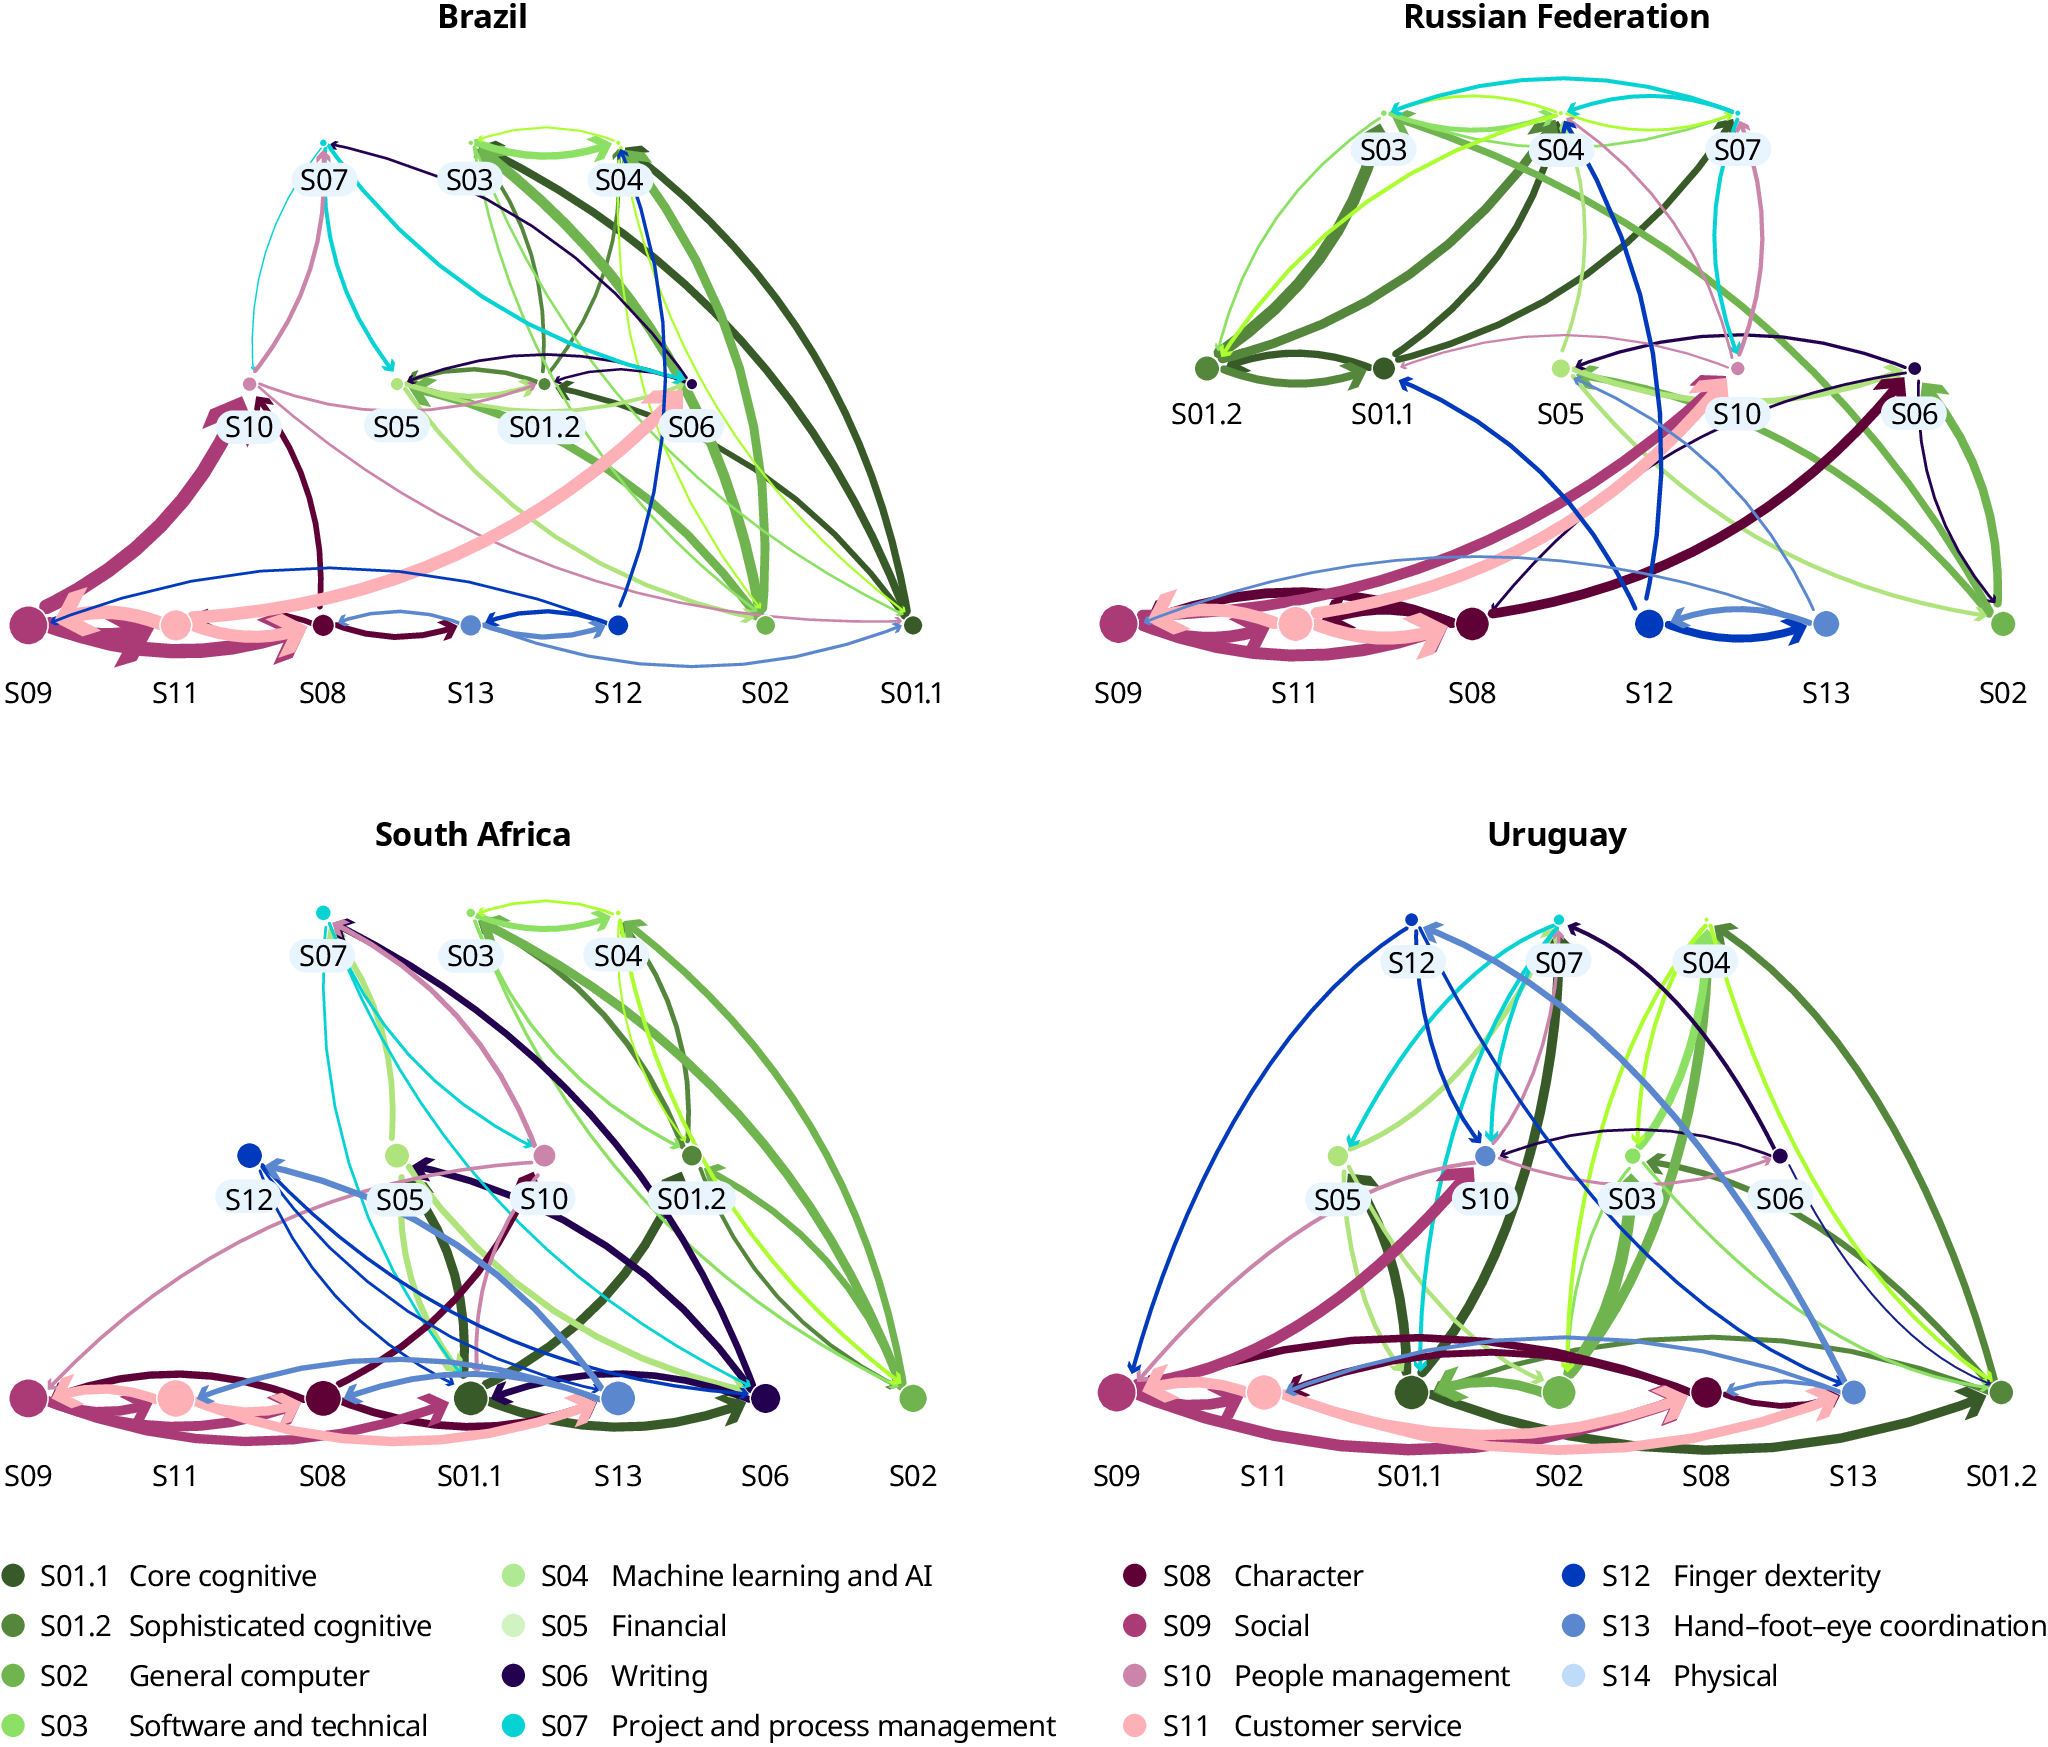
Note: Skills are arranged by complexity scores (see box 3.4) across three layers, from left to right and bottom to top. Smaller nodes represent more complex skills. Thicker lines indicate stronger connections between skills. Arrows denote directional importance: an arrow from skill A to skill B indicates a strong link in that direction. An asymmetrical relationship (a link going only in one direction) can be interpreted as a skill requirement: an arrow from skill A to skill B means that skill B requires skill A, with nearly all job vacancies that require skill B also listing skill A. Links going in both directions denote a symmetrical relationship that can be interpreted as a skills bundle. For each skill, only the three strongest connections are shown.
Source: Analysis based on vacancy data from BuscoJobs for Brazil and Uruguay (2010–23) and Adzuna for the Russian Federation and South Africa (2016–21).
The complexity of skills and the direction of their relationships are country-specific, as can be observed from the changing complexity and position of finger dexterity skills across countries. However, several common patterns emerge across countries. Machine learning and AI skills, as well as managerial skills (particularly project and process management) are consistently identified as the most complex. Machine learning and AI skills rely heavily on general computer and software-specific skills, as well as cognitive skills, and they also contribute to the development of other complex skills. Project and process management skills are among the most challenging to develop because they require a diverse mix of cognitive and socio-emotional skills. Core cognitive skills, general computer skills, customer service, and social and character skills are located at the base of the networks, showing their foundational role in supporting the development of higher-complexity skills.
Importantly, asymmetrical relationships between skills may vary in nature. Rodrigues, Fernández-Macías and Sostero (2021) distinguish between two types of asymmetrical relationships, both illustrated in figure 3.11. First, some skills evolve into more complex ones. For instance, software-specific skills require a foundation in basic computer skills but can later progress to more complex AI and machine learning skills. Second, some complex skills are composites that consist of multiple lower-level skills. Managerial skills exemplify this type of relationship, as they require a broad array of cognitive and socio-emotional skills.
In addition to asymmetrical interconnections, some pairs of skills exhibit reciprocal relationships, where skills have strong bidirectional links, indicating a high level of mutual reinforcement and complementarity in their development and use (the analysis is available upon request). Socio-emotional skills are a key example. They not only contribute to the development of other skills but are also enhanced by them. For instance, social skills (such as empathy, flexibility and assertiveness) can improve customer service skills, while customer service skills (like selling and advertising) can, in turn, strengthen social skills, such as communication and negotiation.
Both reciprocal and asymmetrical skill networks tend to remain stable over time, reflecting the general trend of stable consistent compositions over the years (see section 3.3.1). Understanding these relationships is crucial for distinguishing between skills that are fundamental to the development of other skills and those that work as integral components of a skills bundle, where skills are jointly needed to perform a job. This distinction provides valuable insights for designing more effective and comprehensive strategies to support skills development.
The analysis shows that socio-emotional skills, along with core cognitive and basic computer skills (to a slightly lesser extent), play a key role in acquiring and enhancing other, more complex skills. The importance of these prerequisite skills is supported by existing literature (Cedefop 2018; Cedefop et al. 2021; Weinberger 2014). For instance, Cedefop (2018) finds that adults employed in jobs requiring basic ICT skills also need strong basic skills (for example, literacy, numeracy – also referred to as foundational literacies) as well as planning and organization skills. Establishing a solid foundation in these “basic or foundational skills […] that are necessary for acquiring many important higher-level skills” (Rodrigues, Fernández-Macías and Sostero 2021, 10) enables workers to adapt more readily to evolving job requirements – though the pace of change varies across countries. It also facilitates upward occupational mobility and transitions into jobs with better work quality, as will be demonstrated in the next section.
Which skills are crucial for advancing to higher-level occupations?
Building on the complexity and occupational mobility literature, which explores task similarity and skill networks to understand career pathways and human capital portability (Gathmann and Schönberg 2010; Del Rio-Chanona et al. 2021), figure 3.12 illustrates potential occupational progression based on the skills composition of occupations. For each occupation, the outgoing arrows indicate the three most accessible career paths, determined by the skills most relevant to target occupations, as indicated by to vacancy requirements.58 Occupations with higher ISCO classifications and lower sophistication scores – representing occupations with less complex skill content (box 3.4) – are concentrated in the bottom left-hand corner and are largely dominated by manual skills. In contrast, occupations with lower ISCO classifications and higher sophistication scores, located at the top right-hand corner, tend to require broader and more diverse sets of skills. This convergence between the data-driven approach used in this chapter and the ISCO classification – which is developed by labour statisticians based on their deep knowledge of national labour markets – lends credibility to both methodologies, as it reproduces conceptually grounded occupational distinctions through independent, data-based means, providing a novel contribution to understanding occupational complexity.
Figure 3.12 additionally reveals that possible transitions between occupations that share similar skill sets do not occur necessarily within narrowly defined occupation families. This pattern suggests that skills are a more reliable predictor of occupational mobility than the ISCO family classification. For example, occupations that primarily require manual skills generally lead to other physically intensive roles, although some transitions to occupations dominated by socio-emotional skills or a mix of socio-emotional and manual skills are possible. As such, machine operators and assemblers (ISCO 82) may transition to other physically intensive occupations – such as metal, machinery, and related trade workers (ISCO 72) – or to agricultural, forestry and fishery labourers (ISCO 92), which require both social and physical skills. These roles can then lead to more complex occupations, such as market-oriented skilled agricultural workers (ISCO 61 and 62). Similarly, life science and health professionals (ISCO 22) – categorized as physically intensive roles – can transition to customer service clerks (ISCO 42), which require a mix of socio-emotional and manual skills.
-
Figure 3.12. Projected network of occupations (ISCO two-digit) based on the interconnectedness of skills (bundles), South Africa
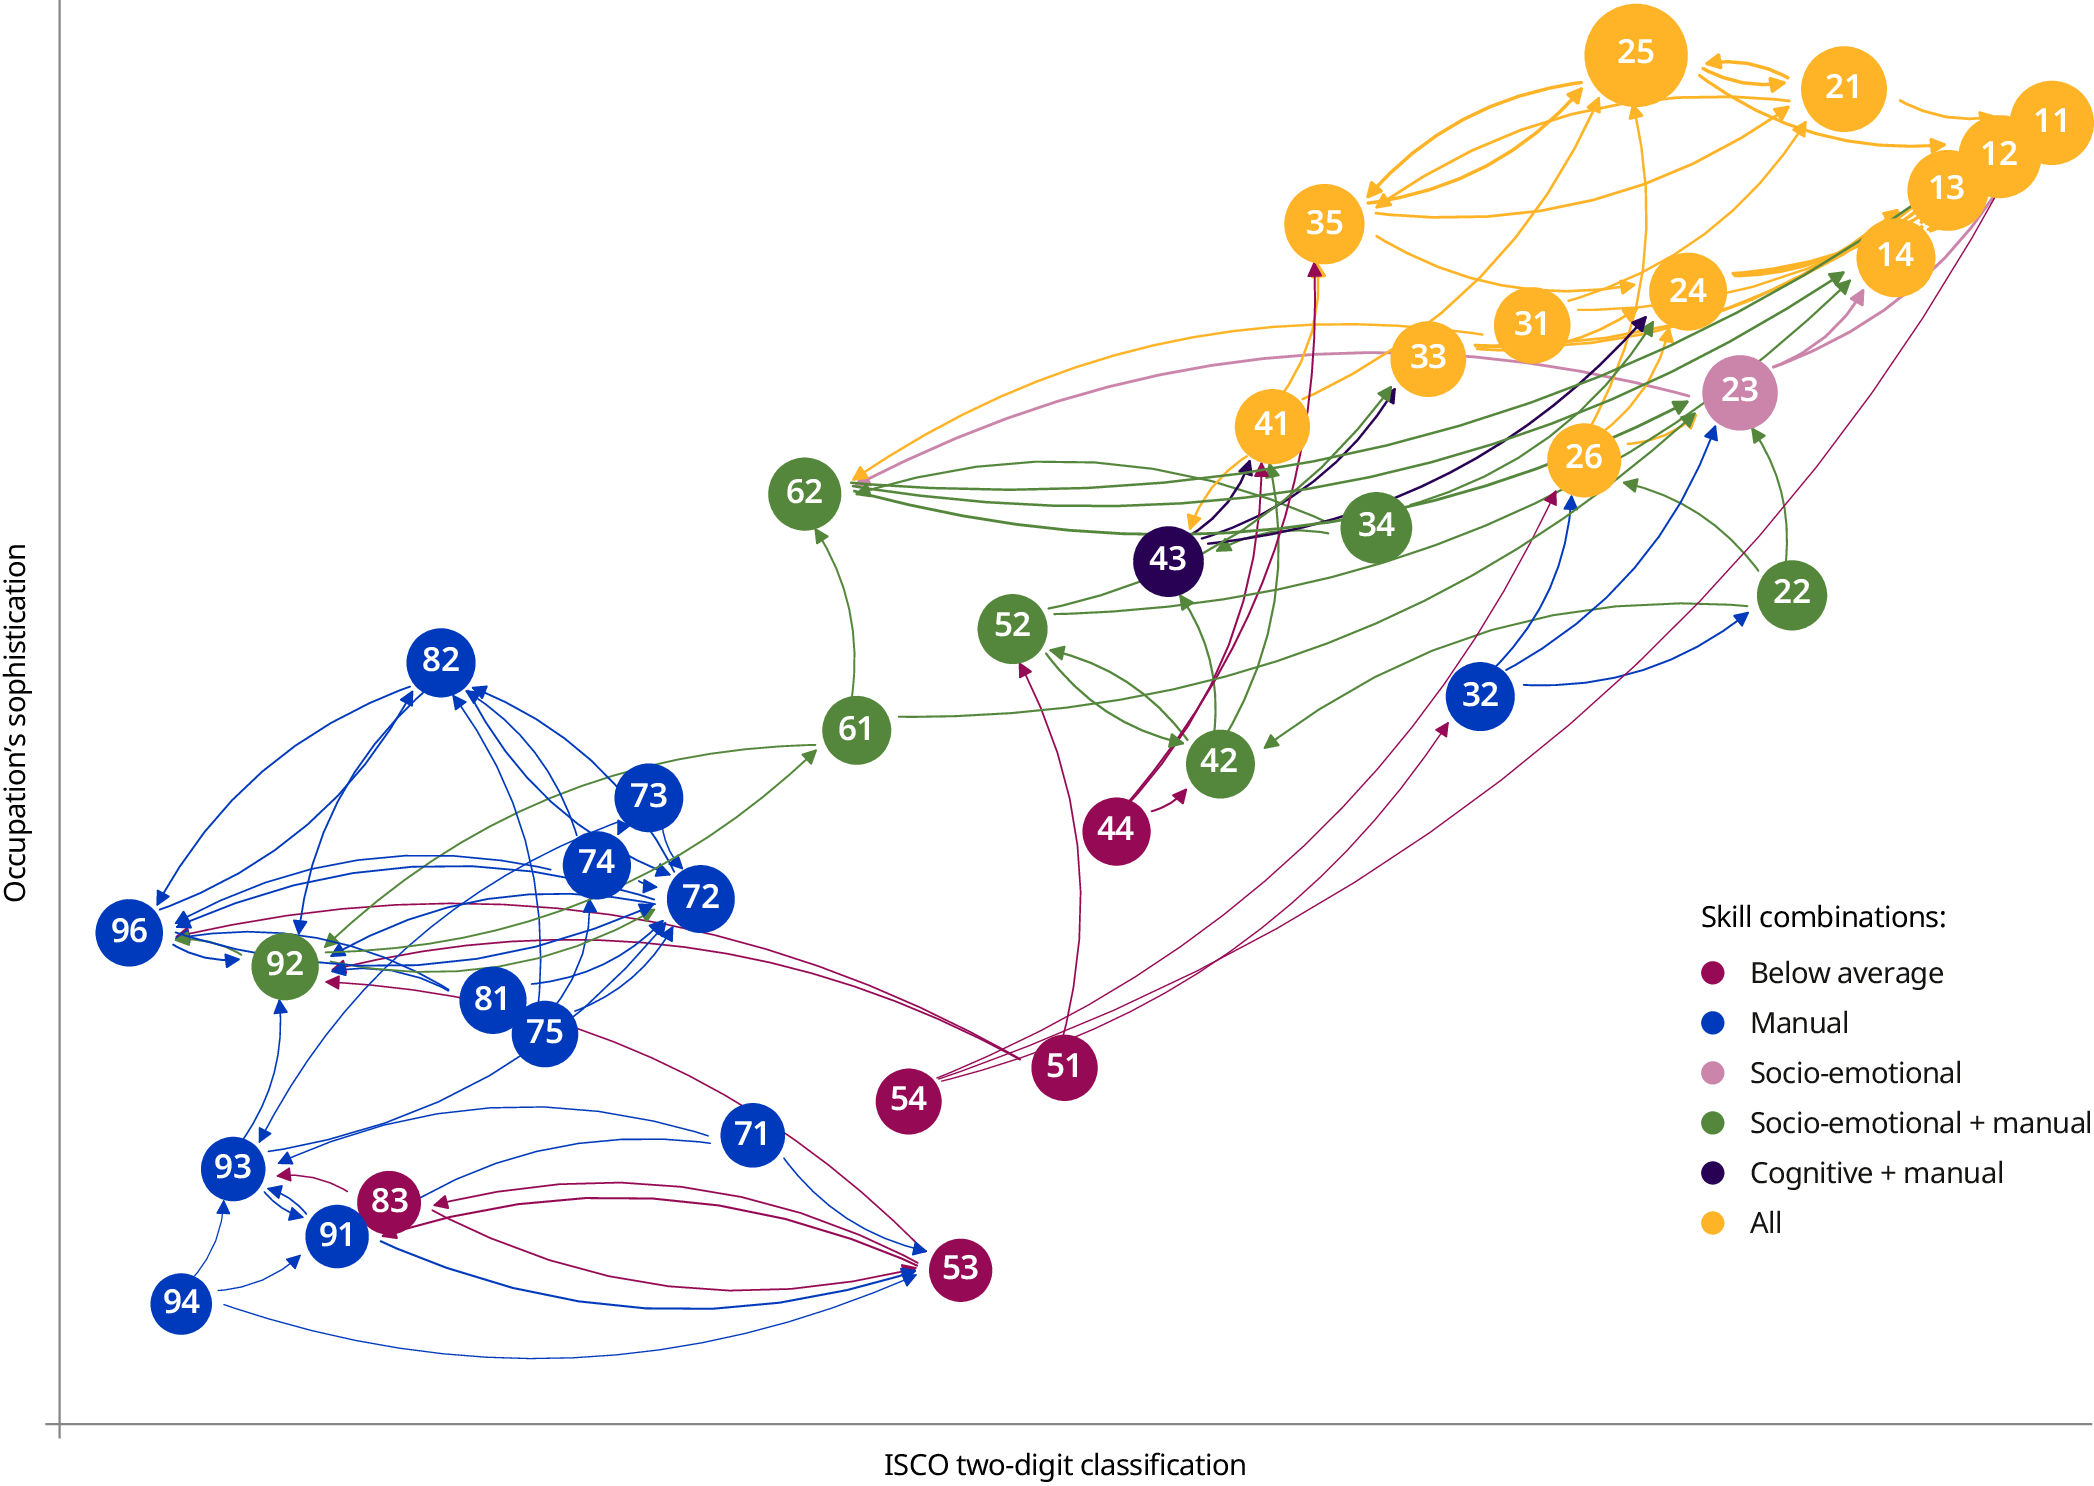
Note: Nodes are two-digit occupations arranged along the x-axis by ISCO classification numbers (from highest to lowest) and along the y-axis by sophistication (that is, the sum of the skills required, weighted by complexity – see box 3.4). Occupations with lower ISCO classification numbers and higher sophistication scores are thus placed in the top right corner. Larger nodes represent more complex occupations. Only skills appearing more frequently than the average across occupations are retained. An occupation is considered to require a skill category if at least half of the skills in that category are above the average across other occupations. Occupations are shown as “below average” if there are no skills categories with more than half of the skills above the average across occupations. Arrows indicate potential occupational paths based on the skills composition of occupations, with outgoing arrows pointing to the three most accessible occupations.
Source: ILO calculation based on Adzuna vacancy data for South Africa (2016–21).
When considering the skills necessary for advancing to higher-level occupations, socio-emotional skills appear to serve as a bridge for occupations dominated by manual skills, enabling them to transition to more complex roles. Adding cognitive skills further expands the pathway to the most sophisticated occupations. Workers in occupations demanding a balanced combination of cognitive, socio-emotional and manual skills occupy the upper sophistication quadrant, enabling them to transition into roles that require a flexible skill mix (orange nodes). For example, general and keyboard clerks (ISCO 41) can leverage their skill endowments to move into other mixed-skill roles within information and communications technology occupations (ISCO 35 and 25).
However, in South Africa, vacancy data suggest the possibility of more occupational transitions between closely related roles than in the other countries, reflecting the characteristics of the South African skill network. Brazil, the Russian Federation and Uruguay exhibit less defined clusters of occupations with similar skills, resulting in potential transitions among a wider range of occupations. This means that in these countries, skills are more diffusely spread across different occupations, making it easier for workers to move between jobs that may not appear closely related but share overlapping skill requirements. In the Russian Federation, for example, there is more interaction between physically intensive occupations, those requiring a combination of social and manual skills, and those that require a mix of skills from all categories. In this setting, machine operators and assemblers (ISCO 82) could potentially transition to careers as science and engineering professionals (ISCO 21), which require a blend of cognitive and manual skills. However, the feasibility of such transitions depends – among other factors – on whether individuals require additional training or education and, if so, how long this lasts. On the other hand, in all countries considered, domestic workers (included within ISCO 51 and 91) show some potential for mobility, though transitions tend to occur among occupations with similarly low skill intensity or a strong reliance on manual tasks.
3.5. Skills for better-quality employment opportunities
Having seen how prominent skills bundles are – and how strong some of their interconnections – it is important to understand which skills and skill combinations are linked to better jobs. Identifying the skills and skills bundles associated with more favourable worker outcomes is essential for understanding how skills development can lead to higher-quality employment. This section thus investigates how developing certain skills and their bundles can support individuals in accessing better-quality employment opportunities. The ILO defines job quality as “the sum of work and employment conditions that influence an employee’s well-being” (2023b, section 1.3) This concept can be measured using objective criteria – such as the respect and fulfilment of labour rights, including fair wages, social protection and safe working conditions – or subjective criteria that reflect workers’ own assessments of job quality, including job satisfaction.
Online vacancy data allow capturing several aspects of job quality. From these data, it is possible to derive indicators such as advertised wages and non-wage job characteristics, some of which reflect core labour rights, while others represent attributes commonly associated with better job quality. This section explores the connection between these indicators and specific skills, helping to identify which skills should be developed through lifelong learning initiatives to prioritize to improve individuals’ employment prospects.
3.5.1. How skills influence wage levels
While vacancy data do not allow for a direct measurement of adequate earnings that guarantee decent living standards for workers and their families (ILO 2023b), the data enable the assessment of the wage brackets – that is, minimum and maximum offered wages – associated with advertised positions. These wage brackets provide a valuable proxy for evaluating the earning potential of jobs, which is a crucial aspect of job quality, and offer insights into how different skills are associated with higher wages.59
Higher-paying jobs require more skills
Comparing the skills required for the highest-paying jobs (top 20 per cent) with those needed for the lowest-paying jobs (bottom 20 per cent) across the four reviewed countries shows that jobs requiring more skills offer higher wages (figure 3.13). While there is variation across countries, vacancies offering wages in the top 20 per cent tend to require a greater number of core and sophisticated cognitive skills, specialized and general computer skills, financial skills, social skills and people management skills. However, the specific skills most commonly associated with higher-paying vacancies vary across countries. For instance, in South Africa, the largest gap in skill requirements between higher- and lower-paying jobs is in financial and core cognitive skills, whereas in the Russian Federation, certain skilled manual roles are paid higher wages. Jobs requiring specific manual skills – such as finger dexterity for working with equipment, packing and sorting, or hand–foot–eye coordination for repairing, restoring, transporting and driving – can command higher wages. Jobs in building (ISCO 71), metal and machinery trades (ISCO 72), as well as machine operators (ISCO 81), assemblers (ISCO 82) and drivers (ISCO 83) often offer wages in the top income range. These roles tend to pay well because they are critical to industrial sectors (such as oil, gas and mining), where specialized expertise and the physical demands of the work drive up wages for qualified workers.
Some skills are more commonly required for lower-paying jobs. In most countries, this is the case for customer service skills, except for the United Arab Emirates. For other skills, this pattern varies more strongly by country. For example, character skills are more prominent in lower-wage postings in South Africa, while general computer skills are more common in lower-paying jobs in the Russian Federation. However, it is possible that the prevalence of certain skills in lower-paying jobs may not necessarily determine wages directly. Instead, differences in remuneration across occupations, as well as the importance of skills bundles, may influence these wage patterns, as will be examined next.
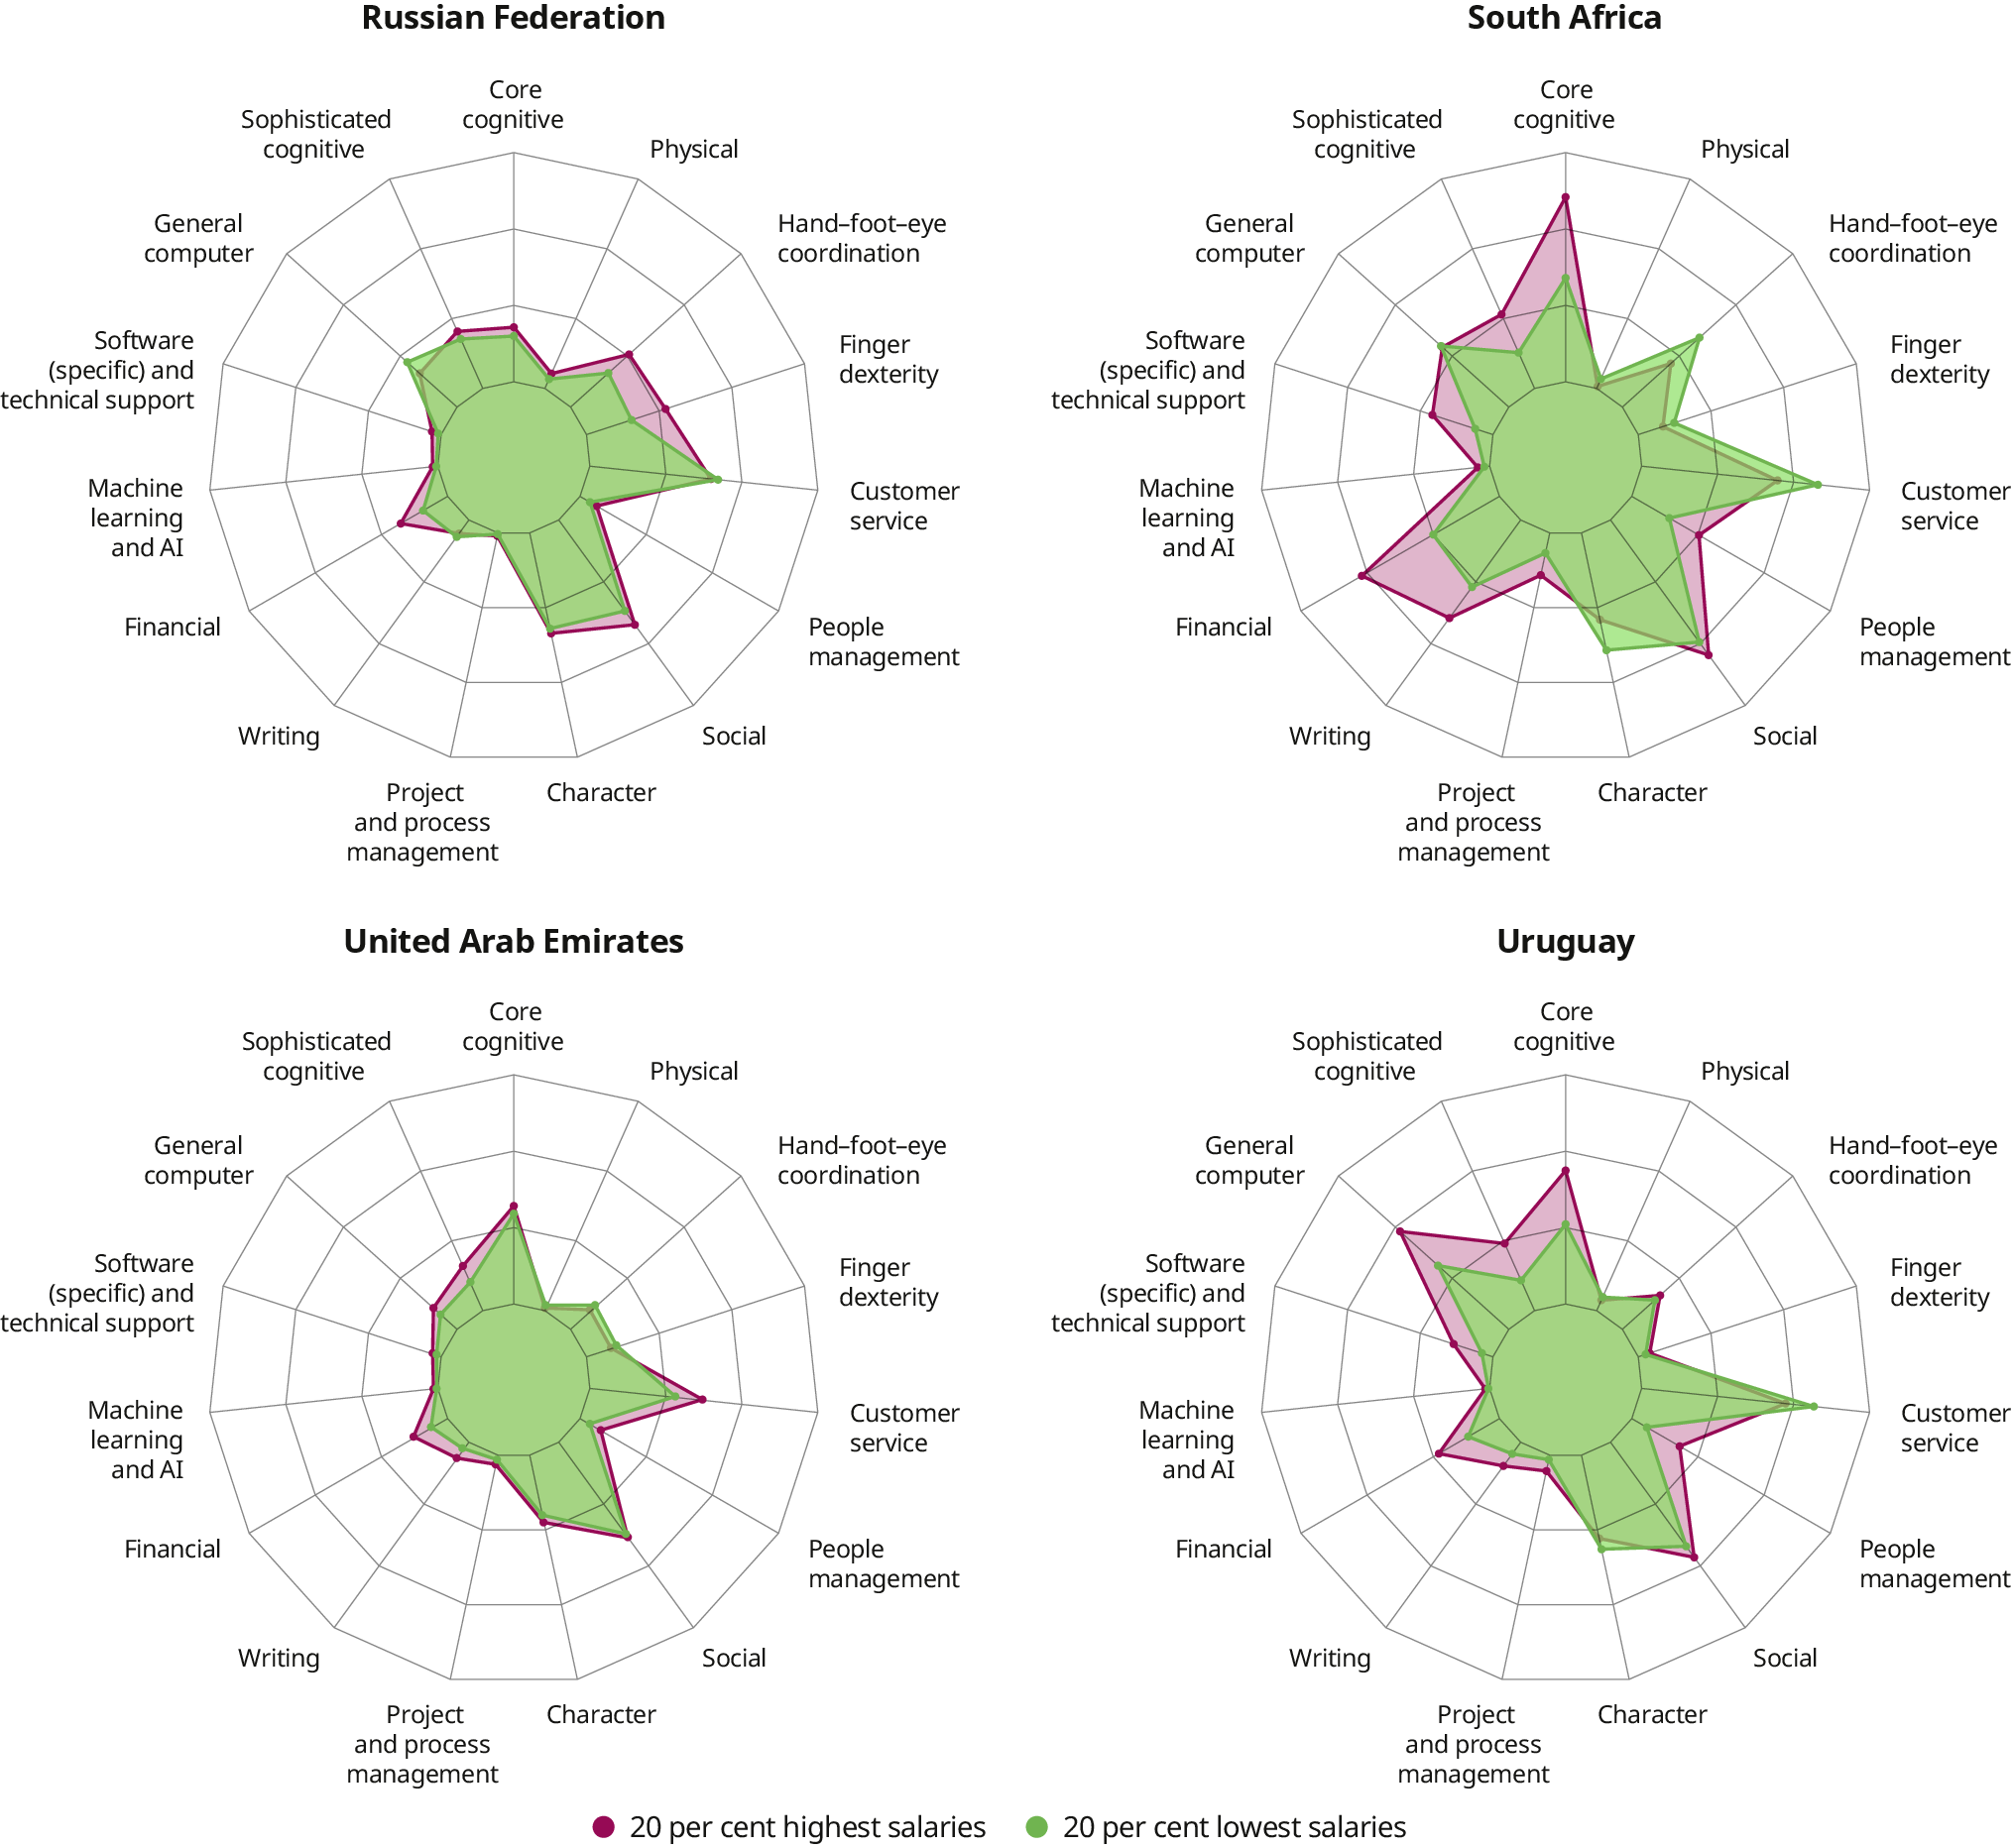
Note: The outermost ring corresponds to 100 per cent of vacancies mentioning a skill. Therefore, a marker further away from the centre means the given skill is more frequently mentioned in vacancies. Wages (in 2023 values) refer to the minimum wages advertised in the vacancies.
Source: Based on Adamczyk et al. (forthcoming) and El Hage Sleiman, Liepmann and Mokdad (2025). The analysis uses vacancy data from BuscoJobs for Uruguay (2010–23), Adzuna for the Russian Federation and South Africa (2016–21), and ESCWA for the United Arab Emirates (2020–24).
Skills matter for wages even within occupations, with cognitive skills suggesting the highest returns
The analysis has so far assessed country-level results across occupations, where it is possible that the relationships between skills and wages is influenced by occupational wage differences. Figure 3.14 includes occupational control variables, such that the estimated effects show how skills relate to wages within a given occupation. While providing informative insights, this analysis does not detect causal relationships between skills and wages, given that additional factors (such as firm or sectoral effects) are not accounted for.
-
Figure 3.14. Relationship between skills and wages controlling for occupation-specific factors, by country
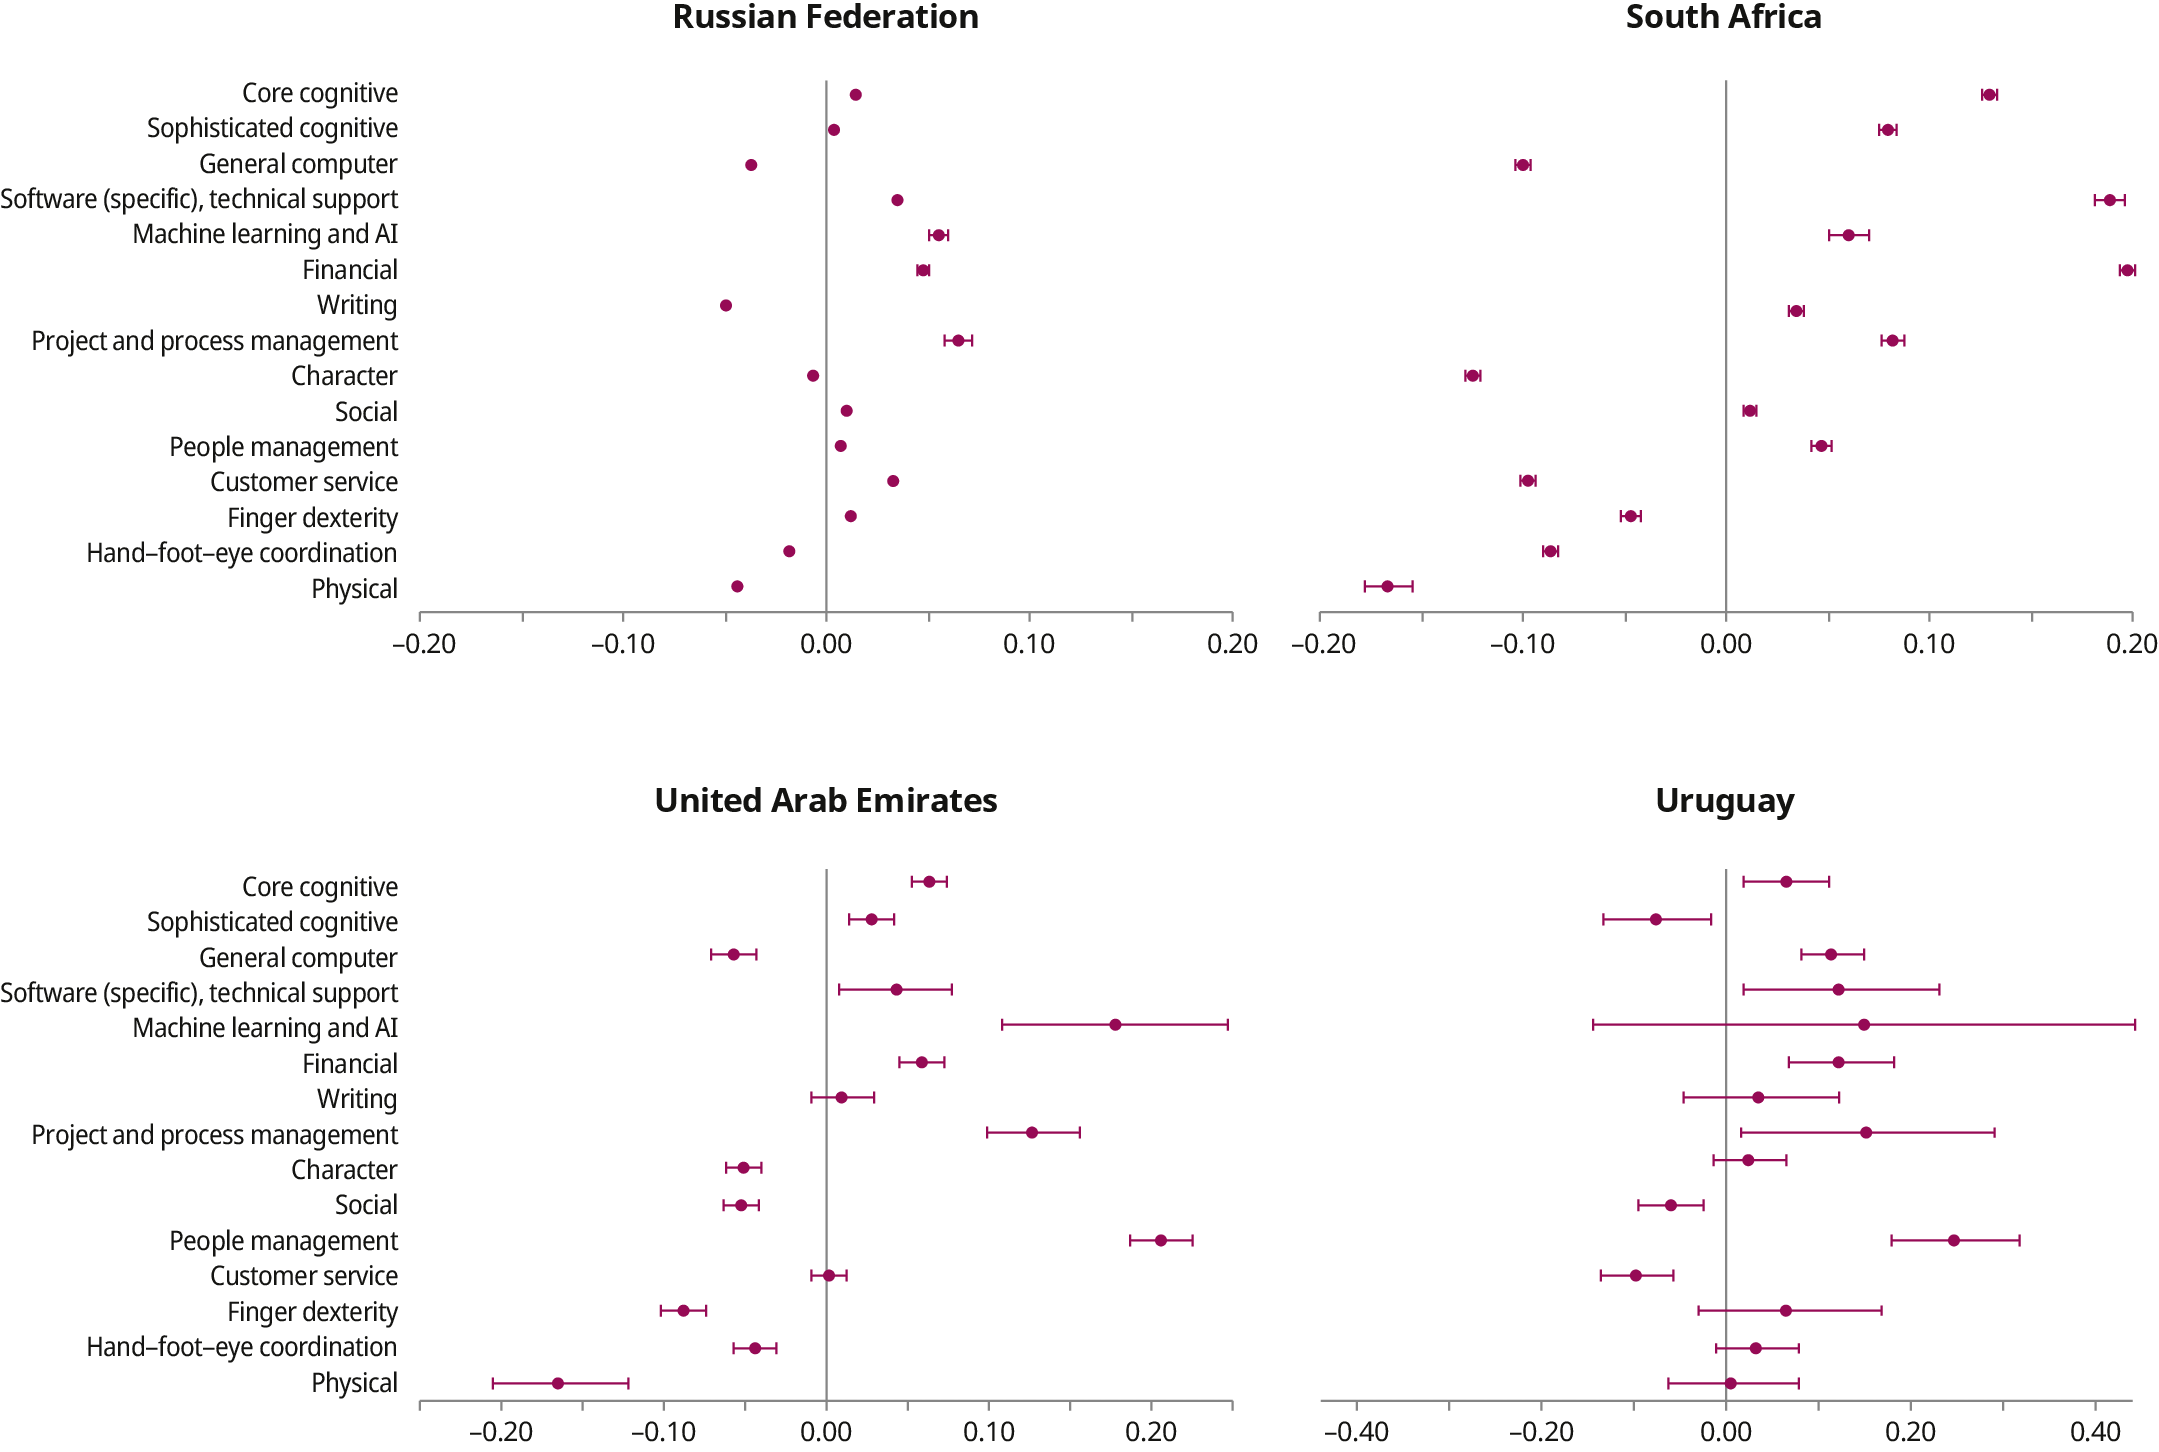
Note: The figure shows the results from vacancy-level regressions of logged wages (defined as the lowest monthly fixed wage advertised, adjusted to 2023 values) on 15 skill dummy variables (equal to 1 if a skill is mentioned in a job advert, 0 otherwise). Each graph comes from a separate regression and displays estimated coefficients with 95 per cent confidence intervals. Coefficients indicate the wage difference, in percentage, associated with a given skill, compared to otherwise observationally identical vacancies that do not reporting that skill. All regressions control for two-digit occupations, the number of words in a job advert, year and calendar month fixed effects, and part-time status (except for the United Arab Emirates, where this variable was unavailable). Large sample sizes mean coefficients are estimated with high precision for the Russian Federation and South Africa.
Source: Adamczyk et al. (forthcoming) and El Hage Sleiman, Liepmann and Mokdad (2025). The analysis is based on vacancy data from BuscoJobs for Uruguay (2010–23), Adzuna for the Russian Federation and South Africa (2016–21) and ESCWA vacancy data for the United Arab Emirates (2020–24).
Clearly, skills matter for wages even when one abstracts from occupational factors. Across countries, many of the cognitive skills are associated with higher wages. In South Africa, for example, wages are 20 per cent higher when financial skills are required in a posting. In the United Arab Emirates, posted wages are 18 per cent higher in vacancies requiring machine learning and AI skills. Meanwhile, posted wages are 7 per cent higher and 14 per cent higher, respectively, for vacancies in the Russian Federation and Uruguay requiring project and process management.60 Research from high-income countries reaches similar conclusions. Digital skills, for example, carry a significant wage premium in the United States (Alekseeva et al. 2021) and the United Kingdom (Sostero and Tolan 2022). Yet, the explicit requirement of basic cognitive skills can, in fact, be associated with lower wages. This is true for general computer skills, which – in comparison to otherwise observationally identical vacancies – yield a 10, 6 and 3 per cent decrease in wages in South Africa, the United Arab Emirates and the Russian Federation, respectively.
For socio-emotional skills, the findings are more varied. These skills are generally associated with a wage premium in the Russian Federation. In South Africa, by contrast, character and customer service skills are negatively related to wages. In the United Arab Emirates, character and social skills are those associated with a wage penalty. The same applies to social skills in Uruguay.
Why do certain socio-emotional skills not yield wage premiums, at least in some countries? As discussed in Chapter 4, skills wage premiums are shaped not only by market demand and supply, but also by socially constructed value judgements. For example, social skills are often associated with tasks and skills typically performed by women, such as in care work. Such skills – though essential – tend to be undervalued and underpaid (ILO 2023c; Osterman et al. 2022). One contributing factor is their connection to the unpaid labour that women disproportionately provide for their families, which can lead to the perception that these skills are less demanding. Additionally, the public good nature of care work results in market inefficiencies and underinvestment, further depressing the value of these skills (see section 4.2). Yet, as subsequent results in this section will show, socio-emotional skills still play a significant role in raising wages, as they complement cognitive skills (see also Deming and Kahn 2018; Weinberger 2014).
Manual skills are associated with lower wages in South Africa and the United Arab Emirates. The same is true for the Russian Federation, with the exception of finger dexterity skills. Despite variation across countries, manual skills generally do not yield noticeable wage premiums. This is relevant from a policy perspective, given that workers with low qualification levels often perform manual tasks (Roys and Taber 2022). Again, wage effects for manual skills can be positive when these skills are combined with complementary skills, as discussed below. A similar pattern was already shown in figure 3.12, where the presence of other skills enabled manual-skill occupations to move up the complexity ladder.
To complement this analysis, Adamczyk et al. (forthcoming) go one step further in abstracting from occupational factors. In theory, differences between jobs – such as varying levels of productivity or differences in firm structures – may influence observed relationships between skills and wages in ways unrelated to the true skill-related wage premium. To better isolate the effect of skills on wages, it is therefore essential to account for these job-specific factors. Deming and Kahn (2018), for example, assess returns to skills within narrowly defined occupations, while Marinescu and Wolthoff (2020) show that controlling for job titles is the most precise approach to understanding application dynamics. For South Africa, it is possible to include detailed controls for almost 4,000 job titles. While these controls slightly reduce the magnitude of skill effects on wages, the overall patterns remain consistent, indicating that skills continue to influence wages even within the same job.
To access high-paying jobs, complementary skills are required, particularly those belonging to the socio-emotional category
It could seem easy to conclude from the previous analysis that acquiring cognitive skills alone is sufficient for securing a high-paying job. However, as shown in section 3.4.1, skills do not exist in isolation. Many cognitive skills are strongly reinforced by others, mostly socio-emotional skills. The following therefore explores whether such skills bundles are also associated with higher wages.
Table 3.6 displays the five top-paying skills in four countries, together with the three skills that are most frequently demanded to complement the top-paying skills. In a majority of vacancies, these complementary skills are social, customer service and/or character skills. In South Africa, for example, financial skills – which yield a wage premium of 20 per cent – regularly require additional social and customer service skills (in 66 and 64 per cent of the vacancies, respectively). In Uruguay, general computer skills are associated with a 10.5-per-cent increase in wages. Of these vacancies, 54 per cent also request social skills, while 52 per cent search for complementary customer service skills. Among the skills with the highest remuneration, there are also a few examples of socio-emotional skills, which, in turn, require cognitive skills. In the United Arab Emirates, people management skills are related to a 20-per-cent increase in wages and are jointly required with core cognitive skills in 79 per cent of vacancies.
-
Table 3.6. Coefficients from regressions of log wages on skills, and frequency of the three most common complementary skills, by country
|
Skill in vacancies |
Coefficient |
Most common complementary skills |
|---|---|---|
|
Uruguay |
||
|
People management |
0.227*** |
Social (72%), Core cognitive (58%), Customer (49%) |
|
Project and process management |
0.140** |
Core cognitive (70%), Social (66%), Sophisticated cognitive (65%) |
|
Financial |
0.113*** |
Core cognitive (63%), Computer (61%), Social (60%) |
|
Software and technical |
0.113** |
Computer (70%), Social (56%), Core cognitive (51%) |
|
General computer |
0.105*** |
Social (54%), Core cognitive (52%), Customer (52%) |
|
United Arab Emirates |
||
|
People management |
0.204*** |
Social (94%), Core cognitive (79%), Customer (69%) |
|
Machine learning and AI |
0.176*** |
Social (88%), Core cognitive (84%), Customer (67%) |
|
Project management |
0.127*** |
Social (91%), Core cognitive (84%), Customer (73%) |
|
Core cognitive |
0.064*** |
Social (83%), Customer (62%), Character (51%) |
|
Financial |
0.059*** |
Social (82%), Core cognitive (73%), Customer (66%) |
|
South Africa |
||
|
Financial |
0.197*** |
Core cognitive (69%), Social (66%), Customer (64%) |
|
Software and technical |
0.189*** |
Social (70%), Core cognitive (69%), Computer (68%) |
|
Core cognitive |
0.129*** |
Social (73%), Customer (56%), Character (65%) |
|
Project management |
0.081*** |
Core cognitive (82%), Social (78%), Customer (73%) |
|
Sophisticated cognitive |
0.079*** |
Core cognitive (81%), Social (78%), Customer (68%) |
|
Russian Federation |
||
|
Project management |
0.065*** |
Customer (76%), Social (72%), Core cognitive (58%) |
|
Machine learning and AI |
0.054*** |
Sophisticated cognitive (70%), Social (69%), Customer (58%) |
|
Financial |
0.047*** |
Social (50%), Customer (49%), Character (41%) |
|
Software and technical |
0.026*** |
Sophisticated cognitive (77%), Social (71%), Customer (50%) |
|
Customer service |
0.024*** |
Social (57%), Character (49%), Computer (28%) |
Key: ** = significant at the 5 per cent level; *** = significant at the 1 per cent level.
Note: The table shows the three complementary skills most commonly mentioned in vacancies that contain the top five skills identified in figure 3.14 (coefficients), along with the share of vacancies requiring these complementary skills. Coefficients on skills correspond to the regressions displayed in figure 3.14 and can be interpreted as the wage increase associated with mentioning a skill in an otherwise identical vacancy.
Source: Analysis based vacancy data from Adzuna for the Russian Federation and South Africa (2016–21), BuscoJobs for Uruguay (2010–23), and ESCWA vacancy data for the United Arab Emirates (2020–24).
These findings highlight the fundamental role of socio-emotional skills as enablers of higher-paying, usually cognitive, skills. Even if some socio-emotional skills may not be valued in isolation – such as character, customer service and/or social skills, which can even carry a wage penalty as in South Africa, the United Arab Emirates and Uruguay – they are nevertheless required in conjunction with high-paying skills. As discussed in section 3.4, socio-emotional skills play the dual role, both enhancing and relying on other skills. Literature for the United States confirms this finding: Cortes, Jaimovich and Siu (2023) show that the relevance of socio-emotional skills has increased in higher-paying occupations, while Deming and Kahn (2018) and Weinberger (2014) demonstrate that the combination of socio-emotional and cognitive skills leads to significant wage premiums.61 Moreover, jobs intensive in both math and social skills have seen employment growth, whereas employment in jobs intensive in only math skills have declined (Deming 2017). Goulart, Rodríguez-Menés and Caroz Armayones (2022) shed further light on these relationships. In their qualitative study, hiring managers in Spain explain that applicants are often initially screened based on technical skills, requiring certifications or good results in a programming test. Subsequently, the most suitable candidate is chosen out of this pool based on the social and character skills demonstrated during interviews.
While manual skills do not tend to feature among the top-paying skills analysed in table 3.6, skill complementarities can also affect their remuneration. In their study of Indian firms, De Marzo, Mathew and Sbardella (2023) find that manual skills are better remunerated when combined with digital skills (box 3.5). Similarly, Senegalese workers with low formal qualification levels, who performed mostly manual labour for the construction of tracks of an express train, saw their earnings increase after they had participated in a training focused on conscientiousness (Allemand et al. 2023).
These findings have important implications for policy. While transitioning to entirely new roles can be complex, even for individuals with the required skills, our analysis demonstrates that such drastic changes may not always be necessary to achieve higher wages. Often, the key to improving wage potential lies in acquiring complementary skills, particularly those that are socio-emotional in nature. By recognizing the value of these complementary skills, policymakers can design targeted training programmes and initiatives that enhance workers’ socio-emotional competencies. This approach not only increases individual earning potential but also fosters a more skilled, adaptable and integrated workforce.
The task composition and skill requirements within occupations have evolved significantly over time (Hershbein and Kahn 2018). Recent studies using online vacancy and firm-level data have demonstrated the impact that specific skills have on wages and overall firm performance. In the United States, firms with higher revenue per worker tend to require more substantial cognitive and social skills (Deming and Kahn 2018). In India, digital skills are strongly linked to increased wages, firm growth, research and development investment, and exporting activities (De Marzo, Mathew and Sbardella 2023).
The demand for a broader range of skills within firms is closely associated with engagement in more complex activities, which in turn enhance economic performance. The literature underscores the complementarity between cognitive and social skills in driving higher wages and improved firm outcomes, such as the likelihood of being publicly traded or achieving higher revenue per worker (Deming and Kahn 2018). Interestingly, while manual skills alone correlate with lower wages in Indian firms, when combined with digital skills, they are linked to higher wages and greater involvement in firms’ exporting activities (De Marzo, Mathew and Sbardella 2023).
The findings suggest that firms demanding diverse transferable skill sets are better positioned to leverage technological advancements, emphasizing the critical role of organizational decisions in structuring tasks and skills to improve firm performance.
3.5.2. The relationship between skills and non-wage attributes
Beyond wages, various employment conditions and job characteristics shape job quality. Online vacancy data enable the identification of non-wage job attributes62 that reflect aspects of job quality, including certain labour rights and other desirable features of employment. However, they do not allow comparison between formal and informal jobs. Non-wage job attributes include various forms of variable earnings, fringe benefits, working conditions and broader workplace characteristics. Adamczyk, Delaporte and Escudero (2025) rely on empirical literature (mainly Maestas et al. 2023; Sockin 2021), along with their own adaptations, to develop a taxonomy of non-wage job attributes extracted from online vacancies (table 3.7). This taxonomy, underpinned by a keyword-based dictionary, was applied to vacancy data from Brazil, the Russian Federation, South Africa and Uruguay, using NLP techniques akin to the ones used for the creation of skill variables.
As presented in figure 3.15, the prevalence of advertised non-wage attributes in job vacancies varies across the four countries analysed, highlighting differences in employer practices and job market expectations. The share of vacancies mentioning at least one of these attributes is highest in the Russian Federation (75 per cent), followed by Uruguay (51 per cent), Brazil (49 per cent) and South Africa (35 per cent).
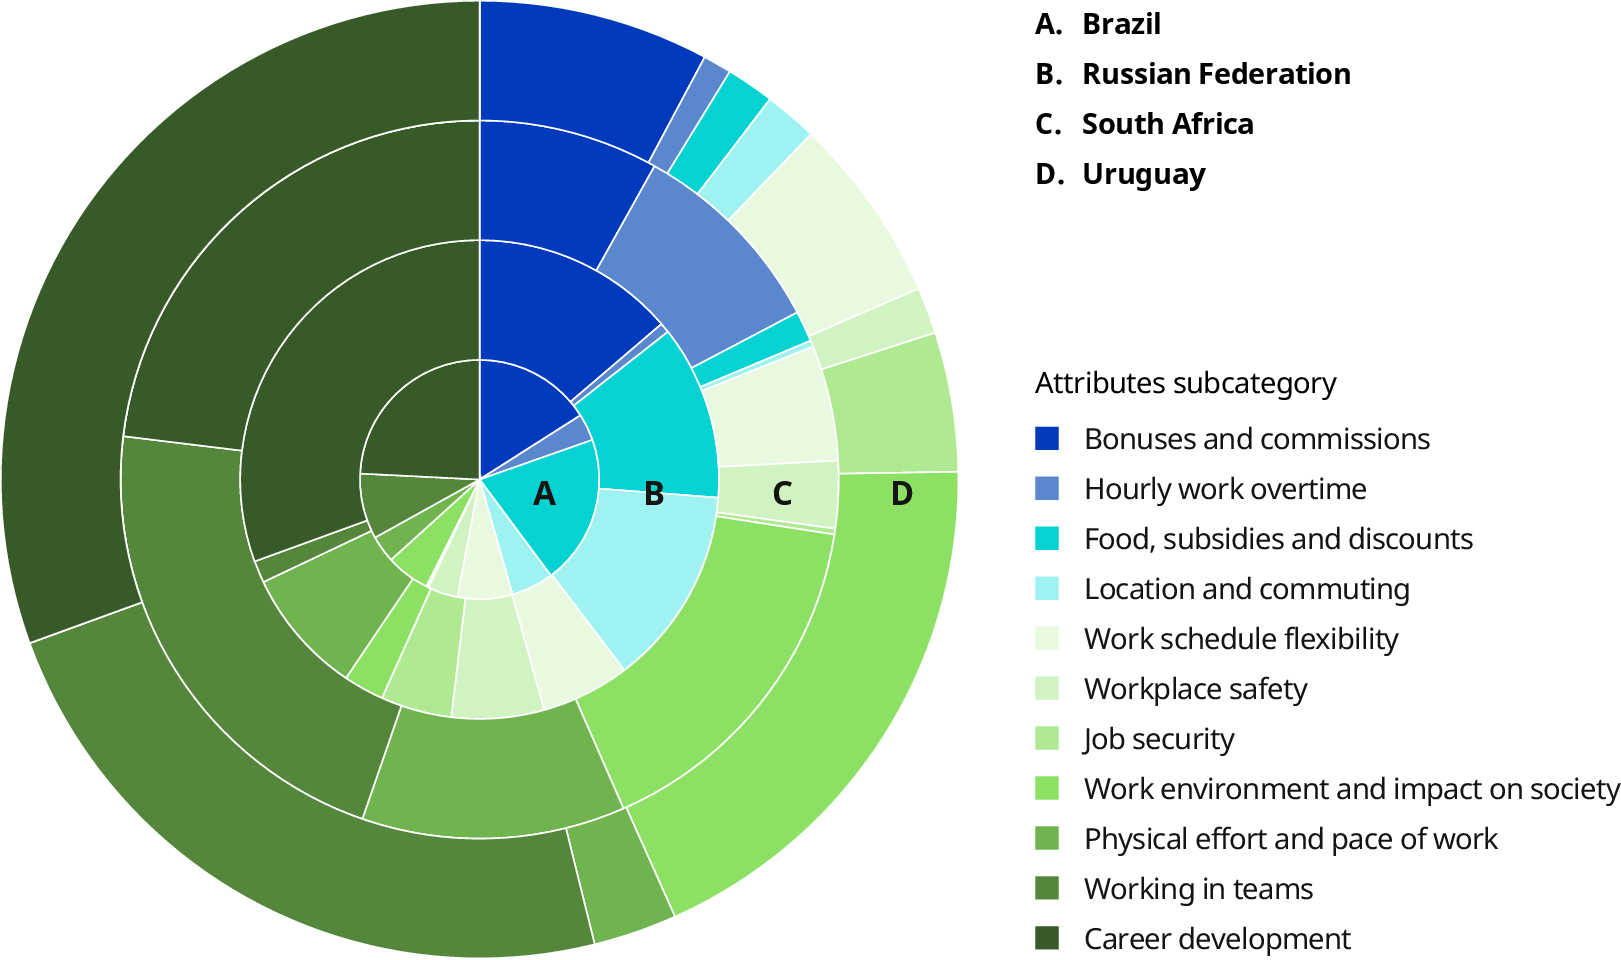
Source: Analysis based on BuscoJobs vacancy data for Brazil and Uruguay (2010–23), and Adzuna vacancy data for the Russian Federation and South Africa (2016–21).
Despite these differences, certain commonalities emerge. Opportunities for career development consistently ranks among the most frequently mentioned attributes, particularly in Uruguay (59 per cent) and the Russian Federation (57 per cent), reflecting an emphasis on training and career growth opportunities. Working in teams is also prominent, especially in Uruguay (45 per cent) and Brazil (14 per cent), where collaborative work environments are emphasized. Additionally, work environment and impact on society is widely advertised in Uruguay (36 per cent) and to a lesser extent in Brazil (9 per cent), suggesting a focus on workplace culture and corporate social responsibility. On the other hand, financial incentives, such as bonuses and commissions, are prominently featured in Brazil (25 per cent) and the Russian Federation (25 per cent), as well as food, subsidies and discounts accounting for 31 per cent in Brazil and 22 per cent in the Russian Federation. Interestingly, location and commuting is an important advertised factor in the Russian Federation (25 per cent) but is less important in Brazil and Uruguay, and almost absent in South Africa (0.4 per cent).
In contrast, some attributes appear less frequently in online job postings. Labour rights and social protection benefits, such as health insurance, paid time off and retirement contributions, are seldom mentioned, particularly in Uruguay, where legal requirements may make explicit advertisement unnecessary. Similarly, office space and amenities and work equipment and allowances are rarely highlighted across all four countries. Only in Brazil is health insurance mentioned more prominently (in about 10 per cent of postings), while in the Russian Federation, paid time off appears relatively more frequently (20 per cent).
Given these variations, 11 non-wage attributes were selected for the analysis of the relationship between skills and job quality, as summarized in table 3.7. Seven of these attributes are positively associated with job satisfaction and employee well-being and are therefore called “amenities”, with some also aligning with labour rights. For contrast, two disamenities were included, indicating low job quality. These classifications are based on a literature review, including sentiment analysis and willingness-to-pay studies (Goldin 2015; Maestas et al. 2023; Mas and Pallais 2017; Sockin and Sockin 2025; Wiswall and Zafar 2018, among others). Additionally, two job characteristics were included without prior classification as amenities or disamenities, as their effects can be either positive or negative depending on the group and context. Their categorization will therefore be determined empirically.
|
Subcategory |
Definition |
Type |
|---|---|---|
|
Variable earnings |
||
|
Bonuses and commissions |
Encompasses various forms of financial incentives and rewards aimed at motivating and compensating employees based on their performance within the organization. |
Amenity |
|
Hourly work and overtime |
Encompasses conditions associated with working beyond regular hours, on an hourly base or during specific periods within an employment arrangement (for example, seasonal work). It considers factors that are typically mandated by employers rather than forged voluntarily and is thus generally considered disamenities in the literature. |
Disamenity |
|
Fringe benefits |
||
|
Food and services subsidies, and other employee discounts |
Encompasses benefits related to food, housing, transportation and various subsidies or discounts offered to employees. |
Amenity |
|
Working conditions |
||
|
Work schedule flexibility |
Includes various aspects related to the flexibility of work schedules and arrangements, such as options for telecommuting, remote work, part-time employment and flexible hours. Additionally, it covers practices that support a better work–life balance, including offering rest days or weekends off and promoting family-friendly work policies. |
Amenity |
|
Workplace safety |
Pertains to all aspects related to ensuring a safe working environment for employees, in particular creating a secure, hazard-free workplace that prioritizes well-being. |
Amenity |
|
Job security |
Encompasses all aspects related to ensuring job security, stability and financial protection for employees. |
Amenity |
|
Workplace attributes |
||
|
Work environment and impact on society |
Provides insight into the organization’s commitment to creating a positive workplace and contributing positively to the community and society as a whole. |
Amenity |
|
Physical effort and pace of work |
Evaluates the physical demands and pace of the job, including physically demanding tasks, rotating shifts and fast work pace. It considers factors typically mandated by employers. |
Disamenity |
|
Working in teams |
Assesses the collaborative aspects of the job, providing insight into the team-oriented nature of the work environment. |
Amenity or disamenity |
|
Opportunities for career development |
Assesses the opportunities for personal and professional growth and development within the organization, including learning, training, mentoring, career advancement, etc. |
Amenity |
|
Location and commuting |
Focuses on factors related to the workplace’s geographical location and how employees commute to and from work. |
Amenity or disamenity |
Note: The following non-wage attributes were excluded from the analysis given insufficient presence in vacancies of all countries analysed: paid time off; health insurance; retirement contributions; office space and amenities; work equipment; and allowances. Cases of “amenity” or “disamenity” are attributes where the association with job satisfaction depends on workers’ individual preferences.
Source: Adamczyk, Delaporte and Escudero (2025).
Relationship between skills and amenities
The relationship between required skills and advertised workplace attributes varies by country.63 Yet, certain patterns consistently emerge.
In terms of workplace characteristics, jobs that emphasize opportunities for career development, working in teams and work environment and impact on society are more likely to require socio-emotional skills – particularly social and customer service skills – and cognitive competencies. However, these jobs show little connection – or even an inverse relationship – with manual skills. In Brazil, these associations are especially strong, suggesting that vacancies highlighting professional growth and collaboration typically seek candidates with a combination of cognitive and socio-emotional skills (table 3.8).
|
|
1 |
2 |
3 |
4 |
5 |
6 |
7 |
8 |
9 |
10 |
11 |
|---|---|---|---|---|---|---|---|---|---|---|---|
|
Core cognitive |
–0.05 |
–0.01 |
–0.10 |
–0.02 |
0.09 |
0.05 |
–0.01 |
0.13 |
–0.01 |
0.14 |
0.11 |
|
Sophisticated cognitive |
–0.07 |
–0.02 |
–0.06 |
0.00 |
0.08 |
0.04 |
0.00 |
0.09 |
–0.06 |
0.08 |
0.12 |
|
General computer |
–0.03 |
–0.02 |
–0.05 |
0.00 |
0.09 |
0.02 |
0.01 |
0.08 |
–0.11 |
0.08 |
0.10 |
|
Software (specific) and technical support |
–0.03 |
0.00 |
–0.08 |
–0.03 |
0.20 |
0.01 |
–0.02 |
0.10 |
–0.05 |
0.09 |
0.04 |
|
Machine learning and AI |
0.03 |
0.00 |
–0.05 |
–0.02 |
0.07 |
0.01 |
–0.01 |
0.05 |
–0.03 |
0.05 |
0.03 |
|
Financial |
–0.02 |
–0.01 |
–0.02 |
0.03 |
0.01 |
0.01 |
0.03 |
0.06 |
–0.07 |
0.04 |
0.05 |
|
Writing |
0.02 |
–0.01 |
–0.03 |
–0.01 |
0.02 |
0.02 |
0.00 |
0.07 |
–0.05 |
0.06 |
0.08 |
|
Project and process management |
0.01 |
–0.01 |
–0.02 |
0.00 |
–0.01 |
0.00 |
0.00 |
0.02 |
–0.03 |
0.01 |
0.06 |
|
Character |
0.01 |
0.03 |
–0.06 |
–0.03 |
0.09 |
0.02 |
–0.01 |
0.18 |
–0.02 |
0.19 |
0.15 |
|
Social |
0.01 |
–0.01 |
0.00 |
0.01 |
0.05 |
0.00 |
–0.02 |
0.11 |
–0.15 |
0.22 |
0.12 |
|
People management |
–0.02 |
–0.01 |
–0.07 |
–0.03 |
0.05 |
0.04 |
0.01 |
0.06 |
–0.05 |
0.09 |
0.12 |
|
Customer service |
0.17 |
–0.01 |
0.01 |
–0.02 |
–0.01 |
–0.06 |
–0.02 |
0.08 |
–0.06 |
0.04 |
0.10 |
|
Finger dexterity |
–0.05 |
0.02 |
0.03 |
0.01 |
–0.06 |
0.12 |
–0.02 |
0.00 |
0.02 |
0.02 |
0.00 |
|
Hand–foot–eye coordination |
–0.03 |
0.02 |
0.00 |
0.02 |
–0.05 |
0.03 |
–0.01 |
0.04 |
0.19 |
–0.01 |
–0.02 |
|
Physical |
0.00 |
0.03 |
0.00 |
–0.01 |
0.01 |
0.01 |
0.00 |
0.06 |
0.00 |
0.03 |
0.05 |
▪ 0.200 to 0.249 ▪ 0.150 to 0.199 ▪ 0.100 to 0.149 ▪ 0.050 to 0.099 ▪ 0.010 to 0.049 ▫ 0.000 to –0.000 ▪ –0.010 to –0.050 ▪ –0.051 to –0.100 ▪ –0.101 to –0.150 ▪ –0.151 to –0.199
Key: 1= Bonuses and commissions; 2 = Hourly work and overtime; 3 = Food subsidies and discounts; 4 = Location and commuting; 5 = Work schedule flexibility; 6 = Workplace safety; 7 = Job security; 8 = Work environment; 9 = Physical effort; 10 = Working in teams; 11 = Career development.
Note: The table displays Spearman correlations, which measure the strength and direction of the relationship between the rank of each pair of amenities (rows) and skills (columns) across job adverts in Brazil. Only job adverts containing at least one skill and one amenity are included.
Source: Analysis based on BuscoJobs vacancy data for Brazil (2010–23).
On the other hand, as expected, physical effort and pace of work tends to be associated with manual skills while being less relevant for cognitive or socio-emotional competencies. Meanwhile, location and commuting shows little connection with skills.
Within the realm of working conditions, work schedule flexibility tends to align with roles requiring technical cognitive skills – such as computer, software, and machine learning and AI skills – which suggests that professionals in ICT and related fields may enjoy greater autonomy over their schedules. However, this pattern is not equally strong across all countries, indicating that flexibility in technical jobs may depend on local labour market conditions. In contrast, vacancies requiring manual skills consistently lack schedule flexibility, where structured shifts may dominate.
Workplace safety is more frequently mentioned in jobs requiring cognitive skills and people management abilities in Brazil and South Africa – consistent with the idea that labour rights are more commonly reflected in higher-skilled vacancies – though correlations are small. Job security, meanwhile, has little connection to skill requirements, except in Uruguay, where it is negatively correlated with all skills.
Finally, within variable earnings and fringe benefits, jobs offering bonuses and commissions are more likely to emphasize customer service skills in Brazil and Uruguay. In the Russian Federation and South Africa, this extends to all socio-emotional skills and more complex cognitive skills – such as sophisticated cognitive and financial skills – indicating that commission-based pay structures are particularly common in jobs that require a specific combination of cognitive and strong socio-emotional abilities. This pattern may also reflect the types of occupations in which such pay structures are more prevalent – such as sales and finance roles – which tend to demand these skills. Similarly, food, subsidies and discounts tend to be more common in jobs that do not require advanced cognitive skills, reinforcing their association with less specialized roles. Meanwhile, hourly work and overtime appear across roles of varying skill levels, with no strong link to specific competencies.
More complex jobs come with greater and higher-value amenities
The analysis of the relationship between non-wage attributes and job complexity64 shows that vacancies requiring more complex skills consistently offer higher-value amenities, particularly opportunities for career development, working in teams and work environment and impact on society (figure 3.16). This is in line with above correlations showing that these amenities are more prevalent in roles demanding advanced cognitive and socio-emotional skills (table 3.8).
-
Figure 3.16. Distribution of advertised non-wage attributes in the 20 per cent most and least complex vacancies, by country
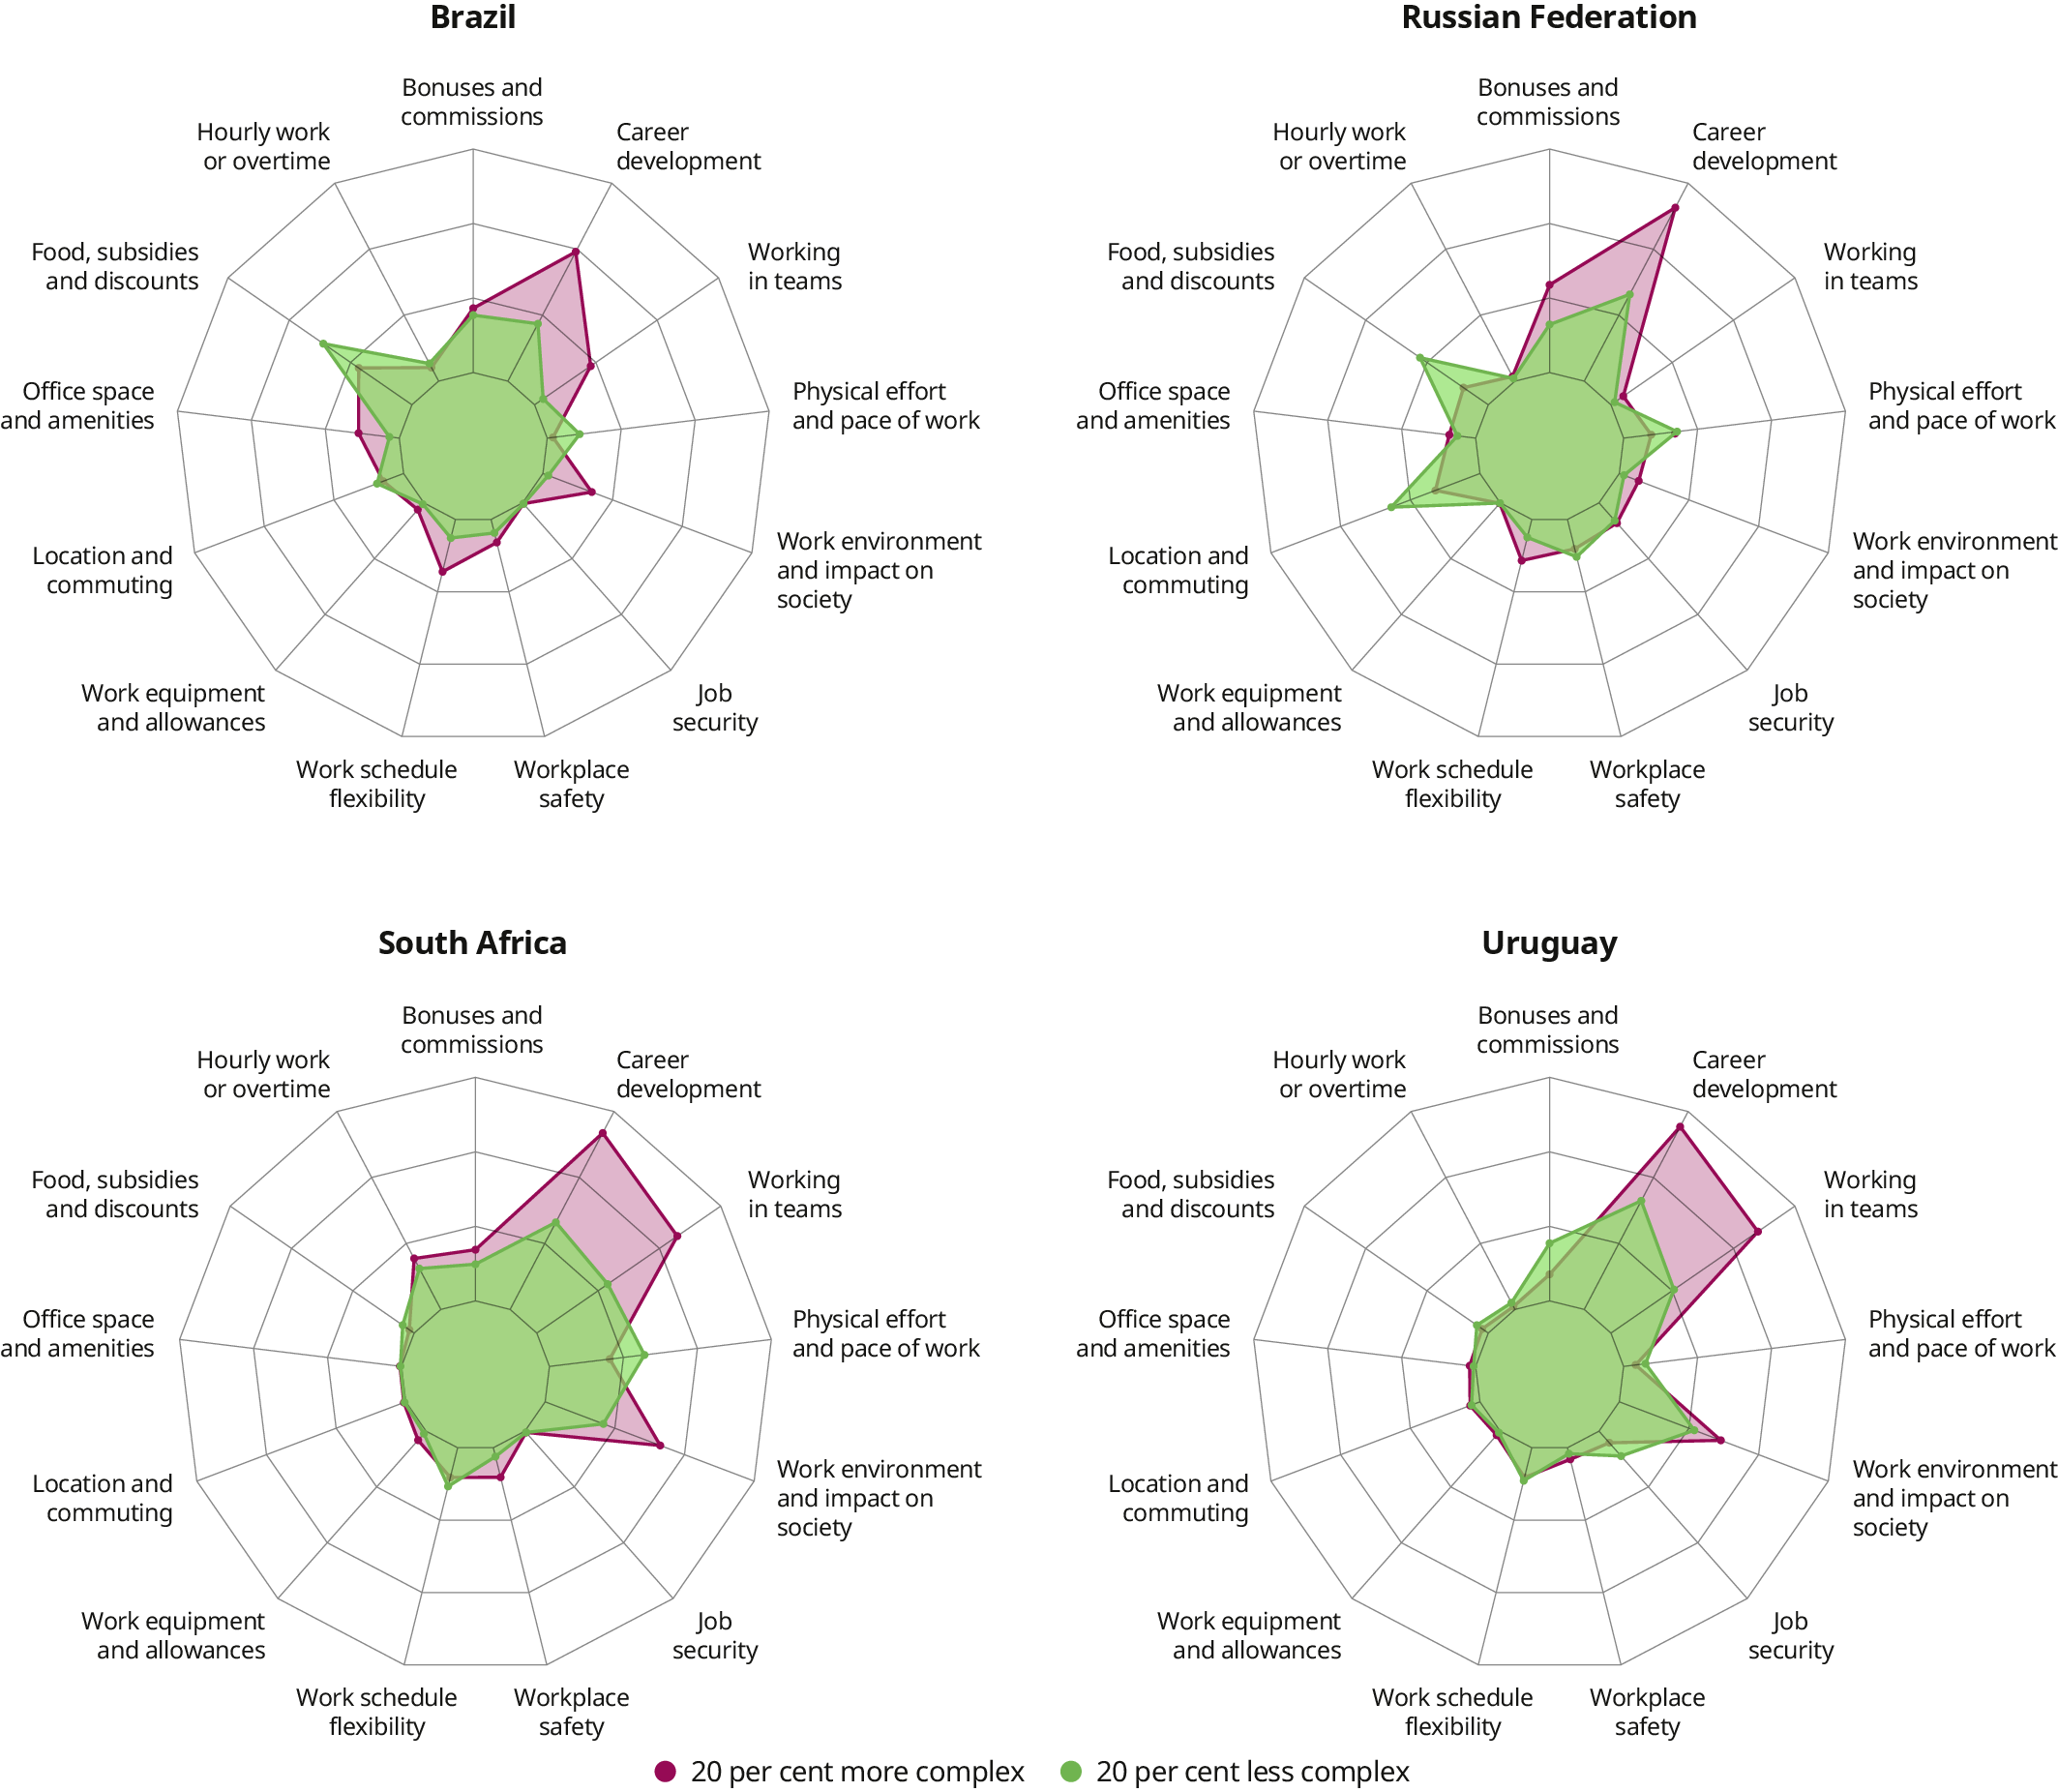
Note: The outermost ring corresponds to 100 per cent of vacancies mentioning an attribute. Therefore, a marker further away from the centre means the attribute is more frequently mentioned. Vacancy complexity is calculated as the sum of the square root–transformed complexity scores of all skills required in the vacancy, by country (see box 3.4).
Source: Analysis based on BuscoJobs vacancy data for Brazil and Uruguay (2010–23), and Adzuna vacancy data for the Russian Federation and South Africa (2016–21).
Beyond these core trends, certain amenities are linked to more complex jobs in specific countries. Work schedule flexibility is more commonly found in Brazil and the Russian Federation, suggesting that roles with more complex skills in these markets allow for greater autonomy. In South Africa, hourly work or overtime and workplace safety are more frequently associated with jobs requiring more complex skills. Bonuses and commissions are also more common in higher-complexity jobs, though this trend is strongest in the Russian Federation and, to a lesser extent, in Brazil and South Africa.
Conversely, less complex jobs are more likely to feature food, subsidies and discounts, as well as the disamenity of physical effort and pace of work. In the Russian Federation, location and commuting also play a more prominent role in lower-complexity jobs.
These patterns hold when comparing non-wage attributes offered in vacancies across higher- and lower-skilled occupations (for example, managers and elementary occupations), reinforcing the link between job complexity and the benefits provided.
However, more amenities do not necessarily mean higher wages
Interestingly, while more complex skills are typically linked to higher-paying jobs (section 3.5.1) and more complex jobs tend to offer greater and higher-value amenities, the association between salary levels and amenities depends on the strategic role that these attributes play at different job levels. Jobs in the top 20 per cent of wages do not consistently provide more or better job attributes compared to those in the bottom 20 per cent (figure 3.17). In some cases, amenities commonly associated with complex roles are also prevalent in lower-paying jobs. For instance, opportunities for career development is more frequently advertised in the lowest-paid jobs in Brazil and the Russian Federation, suggesting that lower-wage roles may emphasize training and skill development as a means of career progression. Conversely, location and commuting benefits are more commonly found in the highest-paid vacancies in the Russian Federation, likely reflecting the need to attract highly skilled professionals by compensating for geographic constraints.
-
Figure 3.17. Distribution of advertised non-wage attributes for the 20 per cent highest and lowest salaries, by country
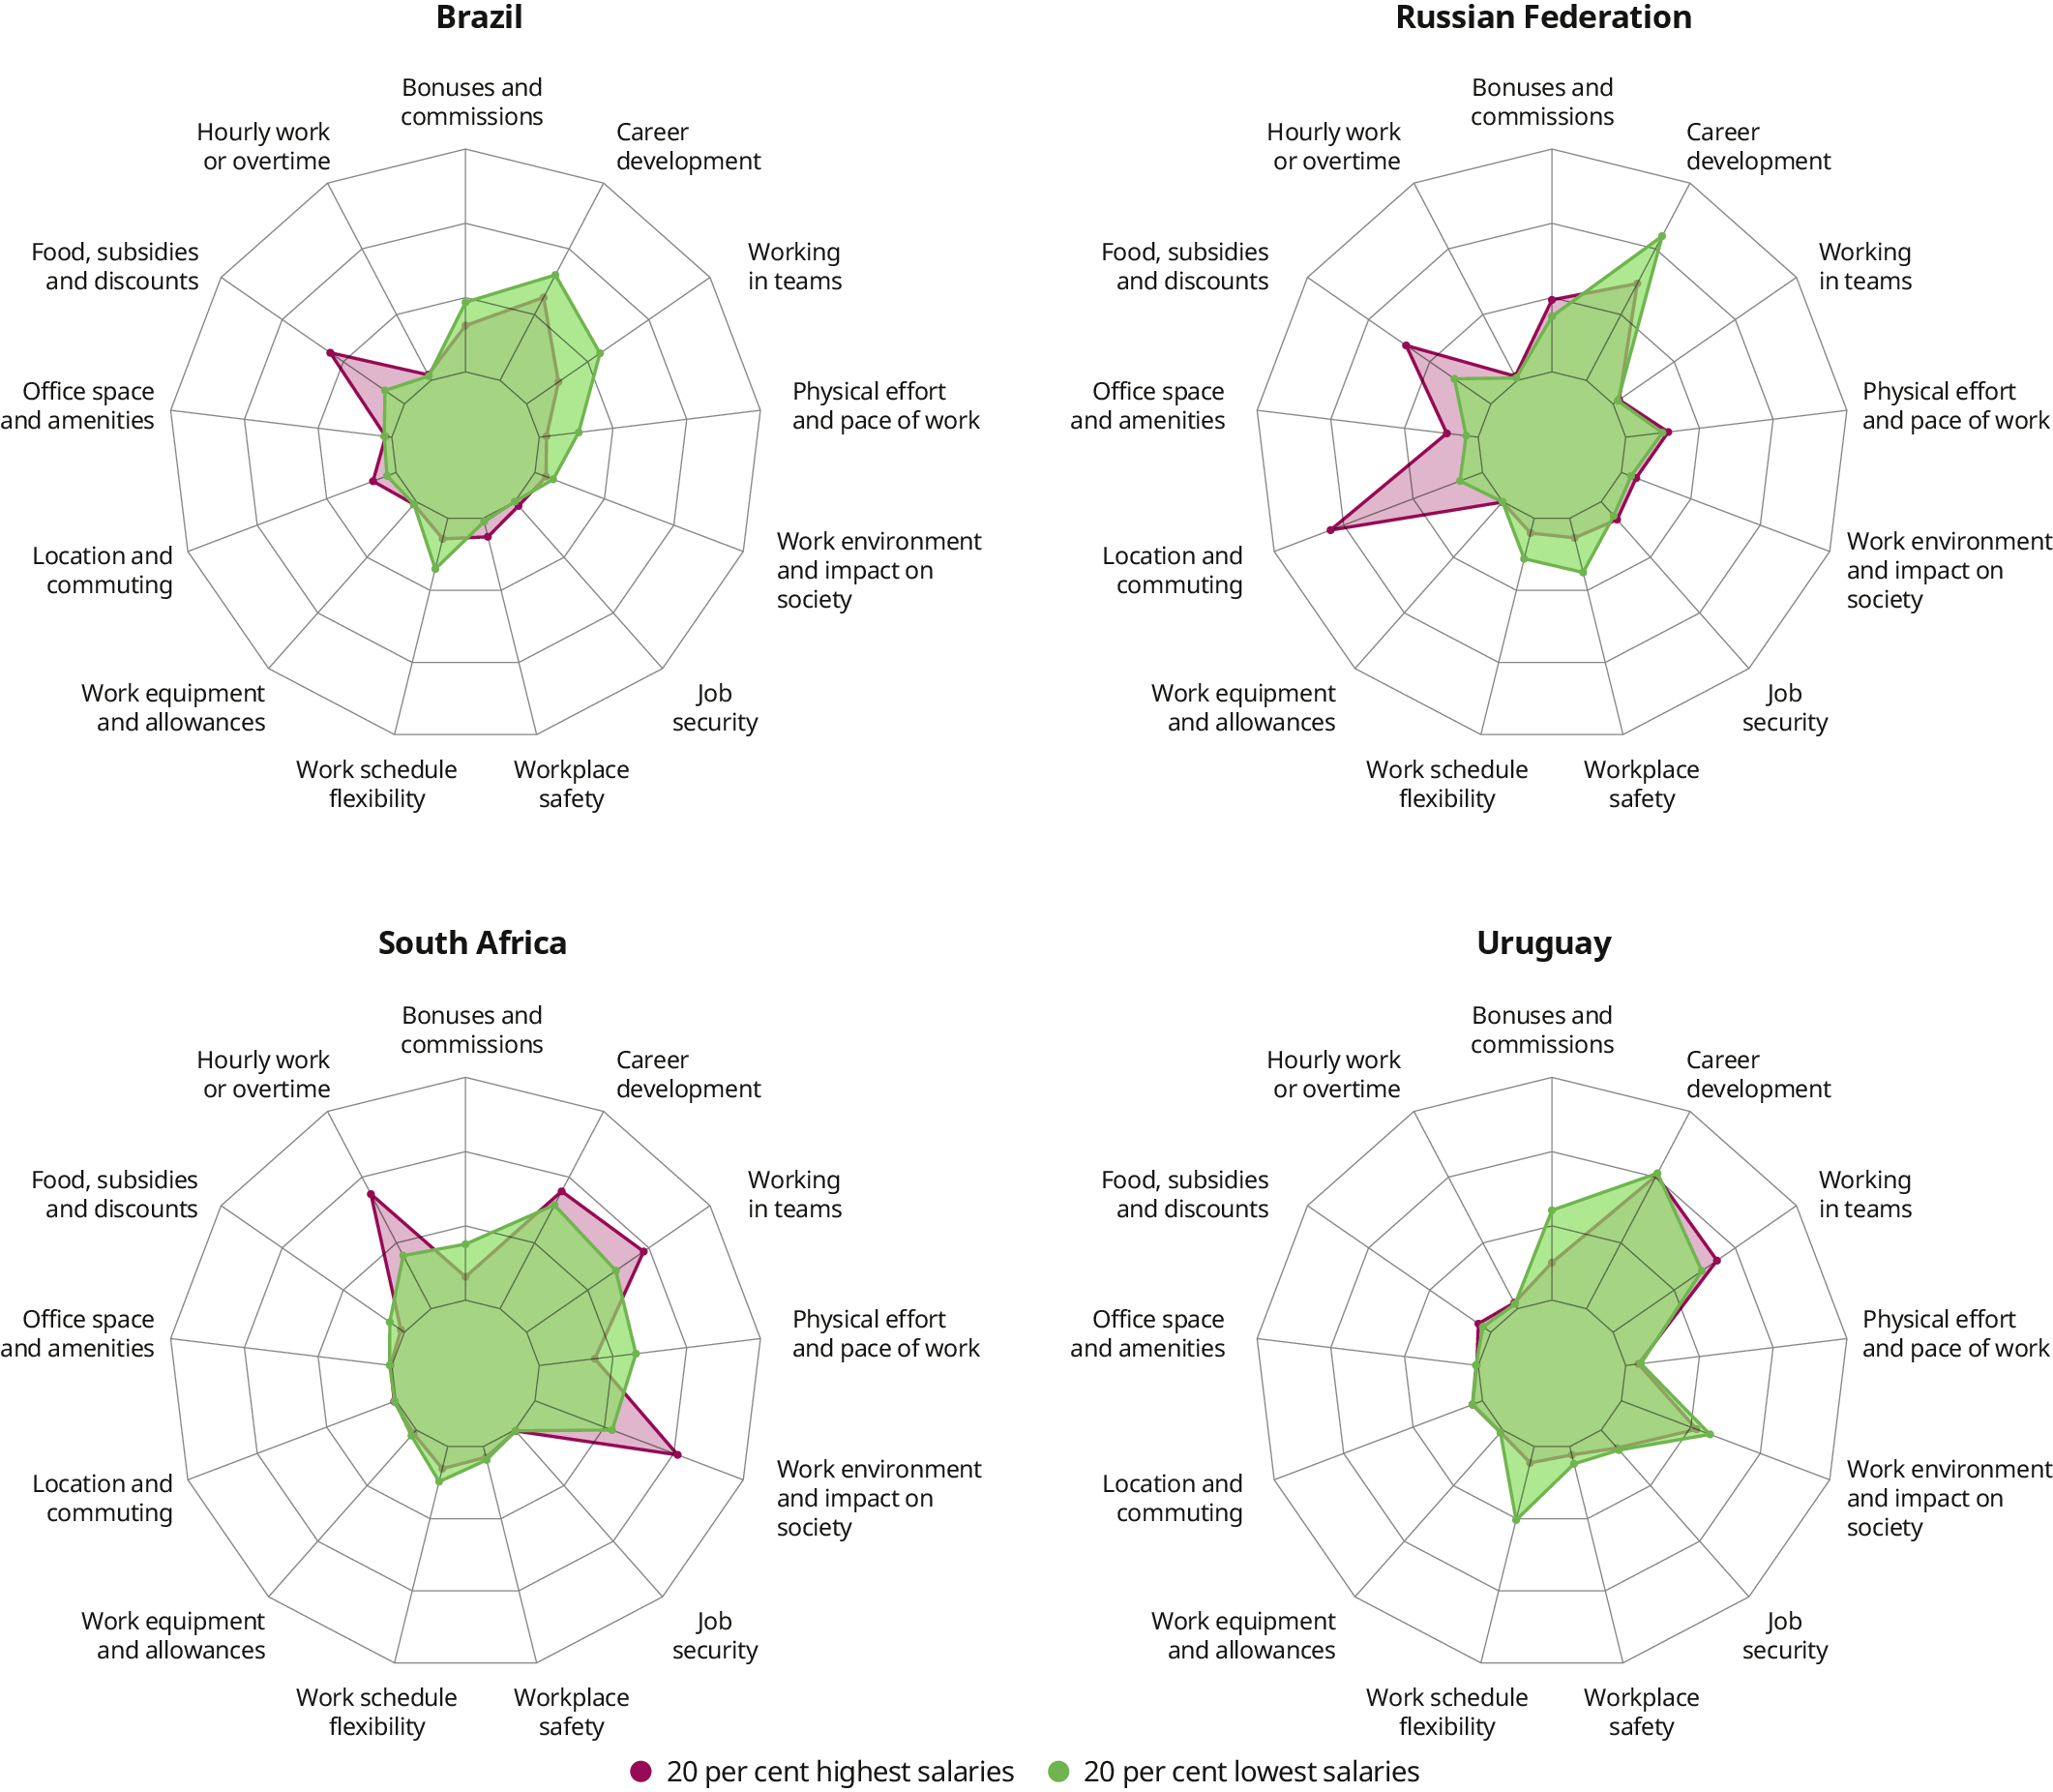
Note: The outermost ring corresponds to 100 per cent of vacancies mentioning an attribute. Therefore, a marker further away from the centre means that the attribute is more important. Wages (in 2023 values) are measured as the lowest advertised wage in the vacancies.
Source: Analysis based on BuscoJobs vacancy data for Brazil and Uruguay (2010–23), and Adzuna vacancy data for the Russian Federation and South Africa (2016–21).
This discrepancy arises because amenities serve different strategic purposes depending on the job level. In lower-wage positions, employers may emphasize training opportunities to attract workers by offering career advancement prospects rather than immediate financial rewards. In contrast, high-paying jobs may provide commuting allowances to secure top talent, particularly when roles require relocation or frequent travel.
These descriptive patterns provide new evidence on how skills, wages and non-wage job attributes interact across different contexts and job types.65 They align with the extensive literature on compensating differentials, which suggests that jobs with less desirable characteristics (such as low wages, long hours or relocation requirements) may offer non-monetary benefits to attract and retain workers (Lamadon, Mogstad and Setzler 2022; Sorkin 2018; Taber and Vejlin 2020). Such compensating differentials are evident in lower-paying jobs of Brazil and Uruguay, which tend to offer a greater number of valuable amenities. In contrast, for higher-paying jobs in the Russian Federation, higher wages are often accompanied by a mix of attractive amenities and attributes more commonly associated with less complex or lower quality jobs – such as location and commuting support and food subsidies. This suggests that beyond classic compensating differentials, other labour market factors – such as industry norms, job competition and regulatory requirements – also shape how non-wage job attributes are distributed across wage levels.
3.6. Conclusion
This chapter has shown how developing specific skills – and the right combinations of them – can support individuals in accessing better-quality employment opportunities, with a focus on countries in regions often overlooked in the skills literature. It studied skills dynamics in Brazil, Egypt, Jordan, Morocco, South Africa, the Russian Federation, the United Arab Emirates and Uruguay, while drawing on existing research from countries such as the United States for additional context. Given the scarcity of granular and longitudinal data on skills in the selected countries, the analysis leveraged big data from online vacancies (and applicant data, where available). This was possible thanks to the application of ILO methodologies, which were specifically developed for this report to categorize and elicit skills and amenities variables from unstructured text data. Moreover, the chapter benefited from a collaboration with UN ESCWA and Veille+ in Morocco to enlarge the number of countries studied.
While the data come with certain limitations – for example, the online labour market tends to overrepresent professional occupations and differs in sectoral composition from the broader labour market – they nonetheless provide a critical source of insight, particularly in contexts where traditional skills data are scarce or absent.
In summary, the chapter identified key findings in four areas.
First, socio-emotional skills are the most strongly demanded, followed by cognitive skills. While manual skills are less frequently observed in vacancies, they remain relevant, with differences by occupation. Overall, the shares of broad skill categories demanded are relatively stable over time. However, amid this stability, specific skills – especially advanced software, and machine learning and AI – are evolving rapidly, even though they still represent a small share of total demand. On the supply side, the skill distribution among applicants closely mirrors that of vacancies. Interestingly, men and women report broadly similar skill profiles – though women more frequently cite customer service skills, while manual skills are more often reported by men – reflecting their occupational distribution.
Second, skills do not exist in isolation but rather as part of interconnected skills bundles. Enterprises require a blend of different skills, where various socio-emotional skills are strongly interconnected among themselves and also with cognitive skills, and, to a lesser extent, manual skills. Network analysis allowed to further characterize the interconnectedness of skills: socio-emotional skills, along with core cognitive and general computer skills act as foundational competencies that support the development of higher-complexity skills. Prominent examples of higher-complexity skills are machine learning and AI as well as managerial skills, in particular project and process management.
Third, higher wages are generally associated with a greater number of higher-complexity skills, with cognitive skills yielding the highest wage returns. Socio-emotional skills show more varied results and sometimes even negative wage effects – a conclusion that will be revisited in section 4.2. However, socio-emotional skills still play a significant role in boosting wages, as they are often required alongside cognitive skills. These findings underscore the fundamental role of socio-emotional skills as enablers of more complex, higher-paying skills – a pattern also observed in the United States (Deming and Kahn 2018; Weinberger 2014) and India (De Marzo, Mathew and Sbardella 2023). By contrast, manual skills rarely yield wage premiums in any of the countries considered. While manual skills may not be valued on their own, complementarities with other skills can enhance their remuneration.
Finally, skills are a pathway to jobs offering better amenities. Vacancies demanding more complex skills – often a mix of advanced cognitive and socio-emotional skills – consistently offer higher-value amenities, such as opportunities for career development, working in teams and impact on society. However, some of these amenities commonly associated with complex roles are also prevalent in some lower-paying jobs, suggesting that jobs with undesirable characteristics may compensate for low wages by offering non-monetary benefits to attract workers.
38 World Bank, “The STEP Skills Measurement Program”, https://microdata.worldbank.org/index.php/catalog/step/?page=1&ps=15&repo=step.
39 O*NET, “O*Net OnLine”, https://www.onetonline.org/.
40 Matsuda, Ahmed and Nomura (2019) and Nomura et al. (2017) present extensive scoping studies covering many aspects but assess skills only briefly, while Archibong et al. (2022) focus on gendered application behaviours.
42 Relative to the United States, Uruguay differs in several aspects, including its comparatively lower GDP per capita, higher informal employment rate and stronger labour market regulation (Escudero, Liepmann and Podjanin 2024). These characteristics make Uruguay more representative of Latin America than of the high-income country group. The economy of the United Arab Emirates is shaped by oil exports. The country’s longer-term growth is expected to be influenced by the degree to which it fosters economic diversification (ILO 2025).
43 For the Russian Federation and South Africa, 8 million and 4.7 million vacancies were analysed, respectively.
44 BuscoJobs is a job board which hosts vacancies directly from employers and contains applicants’ current labour market biographies, including descriptions of job episodes from current and past employment. For Brazil, vacancies are additionally web-scraped from other online sources. For Uruguay, data from around 140,000 vacancies and 278,000 applicants were analysed. The analogue sample sizes are 25.3 million and 515,000, respectively, for Brazil.
45 The sample sizes are around 336,000 vacancies for Egypt, 73,000 vacancies for Jordan and 1,122,000 vacancies for the United Arab Emirates.
46 The data comprise over 900,000 unique job postings from major job portals.
47 For example, in Uruguay, elementary occupations account for 7 per cent of the online vacancies. This yields a meaningful sample size, although elementary occupations are under-represented: they comprise 19 per cent in the household survey (Escudero, Liepmann and Podjanin 2024).
48 Distinguishing between specific core, digital and technical skills, that framework provides guidance on skills integration into national policies. While the taxonomy used here was instead developed for high-level analysis of skills dynamics, it is possible to cross-walk skills between the two frameworks, with details available from the ILO upon request.
49 Already with the existing taxonomy, paid care workers (who can be identified through relevant occupations and/or industries) are assigned the combinations of cognitive, socio-emotional and manual skills applicable to their work (see section 4.2). While their specific skill of “caring for and assisting others” overlaps with the socio-emotional category of the existing taxonomy (including “empathy” under “social skills”), capturing all dimensions of this skill could be further developed. The skill of “caring for and assisting others” is not only relevant for care workers, but also for other jobs, such as retail workers, waiters, managers and professionals. Pietrykowski (2017) shows that, in the United States, “caring for and assisting others” is associated with workers earning higher wages if they are employed in higher-wage, male-dominated occupations. In contrast, the use of the same skill is associated with lower wages for workers employed in lower-wage occupations. This suggests that the remuneration of skills is partly determined by how social and cultural processes shape the perception of skills’ valuation (Osterman et al. 2022), a topic further explored in section 4.2.
50 ESCO provides more aggregated skills concepts, divided into “knowledge”, “language skills and knowledge”, “skills” and “transversal skills”. Similarly to the higher-level O*NET categorizations, these concepts are not directly applicable to social science research. Cortes, Jaimovich and Siu (2023) demonstrate the complexity of such an application when using O*NET data.
51 This chapter focuses on the relative rather than the absolute importance of skills to account for country differences in the number of skills required. Online vacancies in South Africa list more skills than those in Brazil, the Russian Federation and Uruguay, for example, which may reflect different communication styles across countries (see box 3.2).
52 The ISCO classification primarily groups occupations by common tasks, but its numbering scheme reflects a hierarchical order in terms of skill intensity, reflecting the work nature and the typical level of formal education and experience or on-the-job training required. Managers and professionals (ISCO 1 and 2) are assigned skill levels 3 and 4 (the highest); technicians (ISCO 3) are assigned skill level 3; clerical support, services and sales, craft and related trade workers, and plant and machine operators (ISCO 4 to 8) are assigned skill level 2; and elementary occupations (ISCO 9) are assigned skill level 1, the lowest (ILO 2012).
53 Sostero and Tolan (2022) posit that well-established skills are described in less detail in job ads and that common jobs even become synonymous with the underlying skill set, requiring no further explanation. Goulart, Rodríguez-Menés and Caroz Armayones (2022) confirm in qualitative interviews with hiring managers that job titles or specific degrees are deemed sufficient for a range of well-defined jobs.
54 However, it does not account for potential skill decline or loss over time due to disuse (de Grip and van Loo 2002). See Luu and Escudero (forthcoming) for a complementary analysis of changes in the skills offered within an individual’s life span.
55 While the term commonly used in the literature is “fitness score” (Tacchella et al. 2012), this chapter uses “sophistication” instead for greater clarity.
56 Pairs of skills are considered asymmetrical when the strength of the connection in one direction is at least ten times greater than the connection in the opposite direction.
57 An incoming link to a skill A from skill B implies that when skill B appears in a vacancy, skill A is also likely to appear. But the reverse might not be true: skill A may appear without skill B. This directionality suggests a hierarchical or dependent relationship: foundational skills tend to generate outgoing links because they are needed for many other skills.
58 The focus is on skills that are transferable across occupations, which are important for occupational mobility. In future analyses, it would be promising to also consider occupation-specific skills (some of which can be captured with the taxonomy presented in this chapter) and entry barriers, including formal qualification requirements.
59 Not all vacancies list wages. Those that do typically list both the minimum and maximum wages offered. This analysis focuses on the minimum wage offered, as this variable has fewer missing values and is a relevant predictor of job application patterns (Escudero, Liepmann and Vergara 2025). The analysis only includes vacancies with a minimum wage greater than zero. Additionally, it disregards the lowest and highest 1 per cent of wages. Across the countries reviewed, vacancies meeting this criterion and containing information on skills range from 18.1 per cent in Uruguay, to 30.1 per cent in South Africa and 77.2 per cent in the Russian Federation (Adamczyk et al., forthcoming). While vacancies posting wages may not be a random sample, Escudero, Liepmann and Vergara (2025) show that the industrial and occupational distributions are similar regardless of wage-posting status in Uruguay, mitigating bias concerns at least in these two dimensions.
60 Surprisingly, results for sophisticated cognitive skills in Uruguay go against the general pattern. This changes only slightly when controlling for experience requirements and industry, such that the negative coefficient does not seem to be caused by certain institutions or entry-level positions disproportionately requiring such skills (for example, data analysis). Instead, the effects are heterogeneous across occupations. They are negative for clerical support workers (ISCO 5) and craft and related trades workers (ISCO 7), and positive for plant and machine operators and assemblers (ISCO 8).
61 As discussed in section 2 of Chapter 4, these findings need to be nuanced for care work.
62 The empirical literature often refers to these non-wage job attributes as “amenities”. In this report, the term “attributes” is used as a more neutral alternative, particularly as some of these features cannot be assumed to have a positive or negative value. When accounting for their relationship with job satisfaction and job quality. However, this report refers to these attributes as “amenities” or “disamenities” depending on their direction of association.
63 The following shows results for Brazil, but results for the Russian Federation, South Africa and Uruguay are available from the ILO.
64 The complexity of a job vacancy is defined as the sum of the complexity scores of all skills required in the vacancy, calculated at the country level. Each skill is assigned a complexity score (see box 3.4), which is then square root–transformed to reduce variability and ensure no single skill disproportionately influences the overall measure. The job complexity score is obtained by summing the transformed complexity scores of all skills identified in the job advertisement.
65 As a promising avenue for future research, further econometric analysis could disentangle the role of skills from occupational effects and assess how skills influence the relationship between wages and non-wage benefits.
-
References
Acemoglu, Daron, and David Autor. 2011. “Skills, Tasks and Technologies: Implications for Employment and Earnings”. In Handbook of Labor Economics, vol. 4B, edited by Orley Ashenfelter and David Card, 1043–1171. Amsterdam, Netherlands: Elsevier. https://doi.org/10.1016/S0169-7218(11)02410-5.
Adamczyk, Willian, Simon Boehmer, Isaure Delaporte, Verónica Escudero and Hannah Liepmann. 2025. “Developing a New Method to Uncover Skills Trends in Emerging Economies Using Online Data and NLP Techniques”. ILO Methodological Brief. https://doi.org/10.54394/HQQX3200.
Adamczyk, Willian, Isaure Delaporte and Verónica Escudero. 2025. “Measuring Quality of Employment in Emerging Economies: A Methodology for Assessing Job Amenities Using Big Data”. ILO Methodological Brief. https://doi.org/10.54394/YNLL0477.
Adamczyk, Willian, Isaure Delaporte, Verónica Escudero and Hannah Liepmann. Forthcoming. “The Returns to Skills in Terms of Wages and Non-Wage Amenities: Evidence from Online Vacancy Data”. ILO Working Paper.
Alekseeva, Liudmila, José Azar, Mireia Giné, Sampsa Samila and Bledi Taska. 2021. “The Demand for AI Skills in the Labor Market”. Labour Economics 71: 102002. https://doi.org/10.1016/j.labeco.2021.102002.
Allemand, Mathias, Martina Kirchberger, Sveta Milusheva, Carol Newman, Brent Roberts and Vincent Thorne. 2023. “Conscientiousness and Labor Market Returns: Evidence from a Field Experiment in West Africa”. World Bank Policy Research Working Paper No. 10378. https://doi.org/10.1596/1813-9450-10378.
Almeida, Rita K., Carlos H.L. Corseuil and Jennifer P. Poole. 2017. “The Impact of Digital Technologies on Routine Tasks: Do Labor Policies Matter?”. World Bank Policy Research Working Paper No. 8187. http://documents.worldbank.org/curated/en/880331504875104459.
Almlund, Mathilde, Angela Lee Duckworth, James Heckman and Tim Kautz. 2011. “Personality Psychology and Economics”. In Handbook of the Economics of Education, vol. 4, edited by Eric A. Hanushek, Stephen Machin and Ludger Woessman, 1–181. Amsterdam, Netherlands: Elsevier. https://doi.org/10.1016/B978-0-444-53444-6.00001-8.
Archibong, Belinda, Francis Annan, Anja Benshaul-Tolonen, Oyebola Okunogbe and Ifeatu Oliobi. 2022. Firm Culture: Examining the Role of Gender in Job Matching in an Online African Labor Market. PEDL Research Papers. Private Enterprise Development in Low-Income Countries. https://grp.cepr.org/publications/pedl-working-paper/firm-culture-examining-role-gender-job-matching-online-african.
Ash, Elliott, and Stephen Hansen. 2023. “Text Algorithms in Economics”. Annual Review of Economics 15: 659–688. https://doi.org/10.1146/annurev-economics-082222-074352.
Atalay, Enghin, Phai Phongthiengtham, Sebastian Sotelo and Daniel Tannenbaum. 2020. “The Evolution of Work in the United States”. American Economic Journal: Applied Economics 12 (2): 1–34. https://doi.org/10.1257/app.20190070.
Atencio-De-Leon, Andrea, Munseob Lee and Claudia Macaluso. 2025. “Does Turnover Inhibit Specialization? Evidence from a Skill Survey in Peru”. American Economic Review: Insights 7 (1): 56–70. https://doi.org/10.1257/aeri.20230657.
Aufiero, Sabrina, Giordano De Marzo, Angelica Sbardella and Andrea Zaccaria. 2024. “Mapping Job Fitness and Skill Coherence into Wages: An Economic Complexity Analysis”. Scientific Reports 14: 11752. https://doi.org/10.1038/s41598-024-61448-x.
Autor, David H., Frank Levy and Richard J. Murnane. 2003. “The Skill Content of Recent Technological Change: An Empirical Exploration”. The Quarterly Journal of Economics 118 (4): 1279–1333. https://doi.org/10.1162/003355303322552801.
Autor, David H., Lawrence F. Katz and Melissa S. Kearney. 2006. “The Polarization of the U.S. Labor Market”. American Economic Review 96 (2): 189–194. https://doi.org/10.1257/000282806777212620.
Autor, David H., Caroline Chin, Anna Salomons and Bryan Seegmiller. 2024. “New Frontiers: The Origins and Content of New Work, 1940–2018”. The Quarterly Journal of Economics 139 (3): 1399–1465. https://doi.org/10.1093/qje/qjae008.
Bhorat, Haroon, Kezia Lilenstein, Morné Oosthuizen and Amy Thornton. 2020. “Wage Polarization in a High-Inequality Emerging Economy: The Case of South Africa”. UNU-WIDER Working Paper No. 2020/55. United Nations University World Institute for Development Economics Research. https://doi.org/10.35188/UNU-WIDER/2020/812-2.
Black, Sandra E., and Alexandra Spitz-Oener. 2010. “Explaining Women’s Success: Technological Change and the Skill Content of Women’s Work”. The Review of Economics and Statistics 92 (1): 187–194. https://doi.org/10.1162/rest.2009.11761.
Breit, Moritz, Vsevolod Scherrer, Elliot M. Tucker-Drob and Franzis Preckel. 2024. “The Stability of Cognitive Abilities: A Meta-Analytic Review of Longitudinal Studies”. Psychological Bulletin 150 (4): 399–439. https://doi.org/10.1037/bul0000425.
Buehler, Andreas F., Patrick Lehnert and Uschi Backes-Gellner. 2024. “Curriculum Updates in Vocational Education and Changes in Graduates’ Skills and Wages”. Journal of Education and Work 37 (5–6): 458–482. https://doi.org/10.1080/13639080.2025.2456844.
Burmann, Kathrin, and Thorsten Semrau. 2022. “The Consequences of Social Category Faultlines in High- and Low-Context Cultures: A Comparative Study of Brazil and Germany”. Frontiers in Psychology 13: 1082870. https://doi.org/10.3389/fpsyg.2022.1082870.
Cedefop (European Centre for the Development of Vocational Training). 2018. Insights into Skill Shortages and Skill Mismatch: Learning from Cedefop’s European Skills and Jobs Survey. Cedefop Reference Series, 106. https://data.europa.eu/doi/10.2801/645011.
Cedefop, European Commission, European Training Foundation, ILO, OECD and UNESCO. 2021. Perspectives on Policy and Practice: Tapping into the Potential of Big Data for Skills Policy. http://data.europa.eu/doi/10.2801/25160.
Clarke, Linda, Christopher Winch and Michaela Brockmann. 2013. “Trade-Based Skills versus Occupational Capacity: The Example of Bricklaying in Europe”. Work, Employment and Society 27 (6): 932–951. https://doi.org/10.1177/0950017013481639.
Cortes, Guido Matias, Nir Jaimovich and Henry E. Siu. 2023. “The Growing Importance of Social Tasks in High-Paying Occupations: Implications for Sorting”. The Journal of Human Resources 58 (5): 1429–1451. https://doi.org/10.3368/jhr.58.5.0121-11455R1.
Cortes, Patricia, and Jessica Pan. 2018. “Occupation and Gender”. In The Oxford Handbook of Women and the Economy, edited by Susan L. Averett, Laura M. Argys and Saul D. Hoffman, 425–452. Oxford: Oxford University Press. https://doi.org/10.1093/oxfordhb/9780190628963.013.1.
Costa, Rui, Zhaolu Liu, Christopher Pissarides and Bertha Rohenkohl. 2024. Old Skills, New Skills: What Is Changing in the UK Labour Market? Institute for the Future of Work. https://doi.org/10.5281/ZENODO.10400598.
de Grip, Andries, and Jasper van Loo. 2002. “The Economics of Skills Obsolescence: A Review”. In The Economics of Skills Obsolescence, edited by Andries de Grip, Jasper van Loo and Ken Mayhew. Research in Labor Economics, vol. 21. Leeds, UK: Emerald Group Publishing. https://doi.org/10.1016/S0147-9121(02)21003-1.
De Marzo, Giordano, Nanditha Mathew and Angelica Sbardella. 2023. Who Creates Jobs with Broad Skillsets? The Crucial Role of Firms. ILO Working Paper No. 94. https://doi.org/10.54394/KFYG1195.
Debortoli, Stefan, Oliver Müller and Jan vom Brocke. 2014. “Comparing Business Intelligence and Big Data Skills: A Text Mining Study Using Job Advertisements”. Business and Information Systems Engineering 6 (5): 289–300. https://aisel.aisnet.org/bise/vol6/iss5/5.
Del Rio-Chanona, R. Maria, Penny Mealy, Mariano Beguerisse-Díaz, François Lafond and J. Doyne Farmer. 2021. “Occupational Mobility and Automation: A Data-Driven Network Model”. Journal of the Royal Society Interface 18 (174): 20200898. https://doi.org/10.1098/rsif.2020.0898.
Deming, David J. 2017. “The Growing Importance of Social Skills in the Labor Market”. The Quarterly Journal of Economics 132 (4): 1593–1640. https://doi.org/10.1093/qje/qjx022.
Deming, David J., and Lisa B. Kahn. 2018. “Skill Requirements across Firms and Labor Markets: Evidence from Job Postings for Professionals”. Journal of Labor Economics 36 (S1): S337–S369. https://doi.org/10.1086/694106.
Deming, David J., and Kadeem Noray. 2020. “Earnings Dynamics, Changing Job Skills, and STEM Careers”. The Quarterly Journal of Economics 135 (4): 1965–2005. https://doi.org/doi:10.1093/qje/qjaa021.
El Hage Sleiman, Sama, Hannah Liepmann and Tia Mokdad. 2025. "Skills Dynamics in the Arab Region: New Evidence from Online Vacancy Data". ILO Regional Research Brief. https://doi.org/10.54394/VSLG4564..
Encinas-Martín, Marta, and Michelle Cherian. 2023. Gender, Education and Skills: The Persistence of Gender Gaps in Education and Skills. OECD. https://doi.org/10.1787/34680dd5-en.
Erichsen, Gerald. 2019. “Is English Bigger Than Spanish, and What Does That Mean?”. ThoughtCo., 13 August 2019. https://www.thoughtco.com/spanish-fewer-words-than-english-3079596.
Escudero, Verónica, Hannah Liepmann and Ana Podjanin. 2024. “Using Online Vacancy and Job Applicants’ Data to Study Skills Dynamics”. In Big Data Applications in Labor Economics, Part B, edited by Benjamin Elsner and Solomon W. Polachek, 35–99. Research in Labor Economics, vol. 52B. https://doi.org/10.1108/S0147-91212024000052B023.
Escudero, Verónica, Hannah Liepmann and Damián Vergara. 2025. “Directed Search, Wages, and Non-Wage Amenities: Evidence from an Online Job Board”. ILO Working Paper No. 136. https://doi.org/10.54394/YWML9238.
European Commission. n.d. “The ESCO Classification”. https://esco.ec.europa.eu/en/classification.
Fabo, Brian, and Lucia M. Kureková. 2022. “Methodological Issues Related to the Use of Online Labour Market Data”. ILO Working Paper No. 68. https://doi.org/10.54394/ZZBC8484.
Fleisher, Mathew S., and Suzanne Tsacoumis. 2012. O*NET® Analyst Occupational Skills Ratings: Procedures Update. Human Resources Research Organization (prepared for the National Center for O*NET Development). https://www.onetcenter.org/dl_files/AOSkills_ProcUpdate.pdf.
Gander, Fabian, Jennifer Hofmann, René T. Proyer and Willibald Ruch. 2020. “Character Strengths – Stability, Change, and Relationships with Well-Being Changes”. Applied Research in Quality of Life 15 (2): 349–367. https://doi.org/10.1007/s11482-018-9690-4.
Gangl, Markus, Walter Müller and David Raffe. 2003. “Conclusions: Explaining Cross-National Differences in School-to-Work Transitions”. In Transitions from Education to Work in Europe: The Integration of Youth into EU Labour Markets, edited by Walter Müller and Markus Gangl, 277–305. Oxford: Oxford University Press. https://doi.org/10.1093/0199252475.003.0010.
Gathmann, Christina, and Uta Schönberg. 2010. “How General Is Human Capital? A Task-Based Approach”. Journal of Labor Economics 28 (1): 1–49. https://doi.org/10.1086/649786.
Gmyrek, Paweł, Janine Berg and David Bescond. 2023. “Generative AI and Jobs: A Global Analysis of Potential Effects on Job Quantity and Quality”. ILO Working Paper No. 96. https://doi.org/10.54394/FHEM8239.
Goldin, Claudia. 2015. “Hours Flexibility and the Gender Gap in Pay”. Center for American Progress. https://www.americanprogress.org/article/hours-flexibility-and-the-gender-gap-in-pay-2/.
Goos, Maarten, Alan Manning and Anna Salomons. 2014. “Explaining Job Polarization: Routine-Biased Technological Change and Offshoring”. American Economic Review 104 (8): 2509–2526. https://doi.org/10.1257/aer.104.8.2509.
Goulart, Kimberly Seung, Jorge Rodríguez-Menés and Josep Maria Caroz Armayones. 2022. “Job Descriptions, from Conception to Recruitment: A Qualitative Review of Hiring Processes”. JRC Working Papers Series on Labour, Education and Technology No. 2022/06. Joint Research Centre. https://hdl.handle.net/10419/266549.
Hampf, Franziska, and Ludger Woessmann. 2017. “Vocational vs. General Education and Employment over the Life Cycle: New Evidence from PIAAC”. CESifo Economic Studies 63 (3): 255–269. https://doi.org/10.1093/cesifo/ifx012.
Hanushek, Eric A., Guido Schwerdt, Ludger Woessmann and Lei Zhang. 2017. “General Education, Vocational Education, and Labor-Market Outcomes over the Lifecycle”. The Journal of Human Resources 52 (1): 48–87. https://doi.org/10.3368/jhr.52.1.0415-7074R.
Hegewisch, Ariane, and Hannah Liepmann. 2013. “Occupational Segregation and the Gender Wage Gap in the US”. In Handbook of Research on Gender and Economic Life, edited by Deborah M. Figart and Tonia L. Warnecke, 200–217. Cheltenham, UK: Edward Elgar. https://doi.org/10.4337/9780857930958.00024.
Hershbein, Brad, and Lisa B. Kahn. 2018. “Do Recessions Accelerate Routine-Biased Technological Change? Evidence from Vacancy Postings”. American Economic Review 108 (7): 1737–1772. https://doi.org/10.1257/aer.20161570.
Hjort, Jonas, and Jonas Poulsen. 2019. “The Arrival of Fast Internet and Employment in Africa”. American Economic Review 109 (3): 1032–1079. https://doi.org/10.1257/aer.20161385.
ILO. 2007. Portability of Skills. GB.298/ESP/3. https://labordoc.ilo.org/permalink/41ILO_INST/j3q9on/alma993963773402676.
———. 2012. International Standard Classification of Occupations: Volume 1 – Structure, Group Definitions and Correspondence Tables. ISCO–08. https://labordoc.ilo.org/permalink/41ILO_INST/j3q9on/alma994679653402676.
———. 2021. Global Framework on Core Skills for Life and Work in the 21st Century. https://researchrepository.ilo.org/esploro/outputs/995218804002676.
———. 2023a. “Changing Demand for Skills in Digital Economies and Societies”. ILO Policy Brief. https://researchrepository.ilo.org/esploro/outputs/995271999202676.
———. 2023b. A Rough Guide to Measuring Job Quality in Market Systems Development: Operational Guidance. https://labordoc.ilo.org/permalink/41ILO_INST/j3q9on/alma995339593002676.
———. 2023c. World Employment and Social Outlook 2023: The Value of Essential Work. https://doi.org/10.54394/OQVF7543.
———. 2025. World Employment and Social Outlook: Trends 2025. https://doi.org/10.54394/IZLN1673.
———. n.d. “International Standard Classification of Occupations (ISCO)”. ILOSTAT. https://ilostat.ilo.org/methods/concepts-and-definitions/classification-occupation.
Jaimovich, Nir, and Henry E. Siu. 2020. “Job Polarization and Jobless Recoveries”. The Review of Economics and Statistics 102 (1): 129–147. https://doi.org/10.1162/rest_a_00875.
Kanungo, Rabindra N., and Sasi Misra. 1992. “Managerial Resourcefulness: A Reconceptualization of Management Skills”. Human Relations 45 (12): 1311–1332. https://doi.org/10.1177/001872679204501204.
Kureková, Lucia Mýtna, Miroslav Beblavý, Corina Haita and Anna-Elisabeth Thum. 2016. “Employers’ Skill Preferences across Europe: Between Cognitive and Non-Cognitive Skills”. Journal of Education and Work 29 (6): 662–687. https://doi.org/10.1080/13639080.2015.1024641.
Lamadon, Thibaut, Magne Mogstad and Bradley Setzler. 2022. “Imperfect Competition, Compensating Differentials, and Rent Sharing in the US Labor Market”. American Economic Review 112 (1): 169–212. https://doi.org/10.1257/aer.20190790.
Lewandowski, Piotr, Albert Park, Wojciech Hardy, Yang Du and Saier Wu. 2022. “Technology, Skills, and Globalization: Explaining International Differences in Routine and Nonroutine Work Using Survey Data”. The World Bank Economic Review 36 (3): 687–708. https://doi.org/10.1093/wber/lhac005.
Lewandowski, Piotr, Albert Park and Simone Schotte. 2023. “Global Divergence in the De-Routinization of Jobs”. In Tasks, Skills, and Institutions: The Changing Nature of Work and Inequality, edited by Carlos Gradín, Piotr Lewandowski, Simone Schotte and Kunal Sen, 33–52. Oxford: Oxford University Press. https://doi.org/10.1093/oso/9780192872241.003.0003.
Luu, Trang, and Verónica Escudero. Forthcoming. “Measuring Skill Mismatch Using Online Jobs Portal Data: The Case of Uruguay”. ILO Working Paper.
Maestas, Nicole, Kathleen J. Mullen, David Powell, Till von Wachter and Jeffrey B. Wenger. 2023. “The Value of Working Conditions in the United States and Implications for the Structure of Wages”. American Economic Review 113 (7): 2007–2047. https://doi.org/10.1257/aer.20190846.
Marconi, Gabriele, Loris Vergolini and Francesca Borgonovi. 2023. “The Demand for Language Skills in the European Labour Market: Evidence from Online Job Vacancies”. OECD Social, Employment and Migration Working Papers, No. 294. https://doi.org/10.1787/e1a5abe0-en.
Marinescu, Ioana, and Ronald Wolthoff. 2020. “Opening the Black Box of the Matching Function: The Power of Words”. Journal of Labor Economics 38 (2): 535–568. https://doi.org/10.1086/705903.
Mas, Alexandre, and Amanda Pallais. 2017. “Valuing Alternative Work Arrangements”. American Economic Review 107 (12): 3722–3759. https://doi.org/10.1257/aer.20161500.
Matsuda, Norihiko, Tutan Ahmed and Shinsaku Nomura. 2019. “Labor Market Analysis Using Big Data: The Case of a Pakistani Online Job Portal”. World Bank Policy Research Working Paper No. 9063. http://documents.worldbank.org/curated/en/527881574272281519.
Minkov, Michael, and Anneli Kaasa. 2022. “Do Dimensions of Culture Exist Objectively? A Validation of the Revised Minkov–Hofstede Model of Culture with World Values Survey Items and Scores for 102 Countries”. Journal of International Management 28 (4): 100971. https://doi.org/10.1016/j.intman.2022.100971.
Naudé, Wim, Adam Szirmai and Nobuya Haraguchi. 2016. “Structural Transformation in Brazil, Russia, India, China and South Africa (BRICS)”. UNU-MERIT Working Paper Series, No. 2016–016. United Nations University – Maastricht Economic and Social Research Institute on Innovation and Technology. https://ideas.repec.org//p/unm/unumer/2016016.html.
Nomura, Shinsaku, Saori Imaizumi, Ana Carolina Areias and Futoshi Yamauchi. 2017. “Toward Labor Market Policy 2.0: The Potential for Using Online Job-Portal Big Data to Inform Labor Market Policies in India”. World Bank Policy Research Working Paper No. 7966. https://hdl.handle.net/10986/26133.
OECD (Organisation for Economic Co-operation and Development). 2019. Skills Matter: Additional Results from the Survey of Adult Skills. https://doi.org/10.1787/1f029d8f-en.
Osterman, Paul, Nichola Lowe, Bridget Anderson, Joe William Trotter, Natasha Iskander and Rina Agarwala. 2022. “A Forum on the Politics of Skills”. ILR Review 75 (5): 1348–1368. https://doi.org/10.1177/00197939221110097.
Pellizzari, Michele. 2011. “Employers’ Search and the Efficiency of Matching”. British Journal of Industrial Relations 49 (1): 25–53. https://doi.org/10.1111/j.1467-8543.2009.00770.x.
Pietrykowski, Bruce. 2017. “The Return to Caring Skills: Gender, Class, and Occupational Wages in the US”. Feminist Economics 23 (4): 32–61. https://doi.org/10.1080/13545701.2016.1257142.
Piroşcă, Grigore. 2016. “Communicational Features in High/Low Context Organizational Culture: A Case Study of Romania and Russia”. Valahian Journal of Economic Studies 7 (4): 7–12. https://www.proquest.com/scholarly-journals/communicational-features-high-low-context/docview/1950619813/se-2.
Reijnders, Laurie S.M., and Gaaitzen de Vries. 2018. “Technology, Offshoring and the Rise of Non-Routine Jobs”. Journal of Development Economics 135: 412–432. https://doi.org/10.1016/j.jdeveco.2018.08.009.
Rodrigues, Margarida, Enrique Fernández-Macías and Matteo Sostero. 2021. “A Unified Conceptual Framework of Tasks, Skills and Competences”. JRC Working Papers Series on Labour, Education and Technology, No. 2021/02. Joint Research Centre. https://publications.jrc.ec.europa.eu/repository/handle/JRC121897.
Roys, Nicolas A., and Christopher R. Taber. 2022. “Skill Prices, Occupations, and Changes in the Wage Structure for Low Skilled Men”. NBER Working Paper No. 26453. National Bureau of Economic Research. http://www.nber.org/papers/w26453.
Sockin, Jason. 2021. “Show Me the Amenity: Are Higher-Paying Firms Better All Around?”. CESifo Working Paper No. 9842. https://doi.org/10.2139/ssrn.3957002.
Sockin, Jason, and Michael Sockin. 2025. “A Pay Scale of Their Own: Gender Differences in Variable Pay”. CESifo Working Paper No. 11608. http://dx.doi.org/10.2139/ssrn.3512598.
Sorkin, Isaac. 2018. “Ranking Firms Using Revealed Preference”. The Quarterly Journal of Economics 133 (3): 1331–1393. https://doi.org/10.1093/qje/qjy001.
Sostero, Matteo, and Songül Tolan. 2022. “Digital Skills for All? From Computer Literacy to AI Skills in Online Job Advertisements”. JRC Working Papers Series on Labour, Education and Technology, No. 2021/07. Joint Research Centre. https://publications.jrc.ec.europa.eu/repository/handle/JRC130291.
Spitz-Oener, Alexandra. 2006. “Technical Change, Job Tasks, and Rising Educational Demands: Looking Outside the Wage Structure”. Journal of Labor Economics 24 (2): 235–270. https://doi.org/10.1086/499972.
Stephany, Fabian, and Ole Teutloff. 2024. “What Is the Price of a Skill? The Value of Complementarity”. Research Policy 53 (1): 104898. https://doi.org/10.1016/j.respol.2023.104898.
Strietska-Ilina, Olga, Christine Hofmann, Mercedes Durán Haro and Shinyoung Jeon. 2011. Skills for Green Jobs: A Global View – Synthesis Report Based on 21 Country Studies. ILO. https://researchrepository.ilo.org/esploro/outputs/995341593402676.
Taber, Christopher, and Rune Vejlin. 2020. “Estimation of a Roy/Search/Compensating Differential Model of the Labor Market”. Econometrica 88 (3): 1031–1069. https://doi.org/10.3982/ECTA14441.
Tacchella, Andrea, Matthieu Cristelli, Guido Caldarelli, Andrea Gabrielli and Luciano Pietronero. 2012. “A New Metrics for Countries’ Fitness and Products’ Complexity”. Scientific Reports 2 (1): 723. https://doi.org/10.1038/srep00723.
Taras, Vas, Piers Steel and Bradley L. Kirkman. 2011. “Three Decades of Research on National Culture in the Workplace: Do the Differences Still Make a Difference?”. Organizational Dynamics 40 (3): 189–198. https://doi.org/10.1016/j.orgdyn.2011.04.006.
Tinbergen, Jan. 1974. “Substitution of Graduate by Other Labour”. Kyklos 27 (2): 217–226. https://doi.org/10.1111/j.1467-6435.1974.tb01903.x.
WEF (World Economic Forum). 2023. Future of Jobs Report 2023: Insight Report. https://www.weforum.org/publications/the-future-of-jobs-report-2023/.
———. 2024. Putting Skills First: Opportunities for Building Efficient and Equitable Labour Markets – Insight Report. https://www.weforum.org/publications/putting-skills-first-opportunities-for-building-efficient-and-equitable-labour-markets/.
Weinberger, Catherine J. 2014. “The Increasing Complementarity between Cognitive and Social Skills”. The Review of Economics and Statistics 96 (5): 849–861. https://doi.org/10.1162/REST_a_00449.
Wiswall, Matthew, and Basit Zafar. 2018. “Preference for the Workplace, Investment in Human Capital, and Gender”. The Quarterly Journal of Economics 133 (1): 457–507. https://doi.org/10.1093/qje/qjx035.
World Bank, UNESCO and ILO. 2023. Building Better Formal TVET Systems. Principles and Practice in Low- and Middle-Income Countries. https://labordoc.ilo.org/permalink/41ILO_INST/j3q9on/alma995320392002676.
Zhou, Tao, Jie Ren, Matúš Medo and Yi-Cheng Zhang. 2007. “Bipartite Network Projection and Personal Recommendation”. Physical Review E 76 (4): 046115. https://doi.org/10.1103/PhysRevE.76.046115.
4.1. Introduction
Building on the analysis presented in Chapters 1 and 2 on the evolution of lifelong learning and existing gaps in participation – and expanding on Chapter 3, which examined the role of skills in improving employment outcomes – this chapter investigates how skills acquisition and valuation strengthen the resilience of workers and firms amid global transformations. As part of Part 2 of the report, it still focuses on the world of work and explores how evolving skill dynamics shape adaptability and inclusion. The findings help inform the policy questions addressed in Chapter 5, such as how lifelong learning systems can support workers in acquiring in-demand skill sets and the role that policy interventions play in enabling this process.
Today, several overlapping global transformations are reshaping the world of work. Digital technologies – including automation, AI and big data – have led to redesigned jobs, workplace structures and skills requirements across sectors. In parallel, environmental sustainability has become a critical driver of change. The urgency of climate change is accelerating shifts in production and employment, fuelling demand for greener jobs, sustainable practices, skills for climate mitigation and adaptation, and disaster risk management (ILO 2018; Strietska-Ilina et al. 2011). Demographic shifts, including population ageing, are transforming the composition and needs of the workforce in many countries. One immediate implication is the growing demand for care work, which presents both opportunities and challenges (Addati et al. 2018; ILO 2024a). These structural changes are further compounded by the rise of platform work (ILO 2021; Pinedo Caro, O’Higgins and Berg 2021), the spread of remote and hybrid work models, growing pressures on globalization (Corley-Coulibaly, Sekerler Richiardi and Ebert 2023) marked by fragmentation of supply chains and the multilateral trading system, and migration (Kuptsch and Mieres 2025). These global transformations represent deep societal transitions, significantly reshaping economies, political systems and societal relationships (ILO 2025a). Together, these developments place new demands on education and training systems.
In this context, skills development plays a pivotal role. As emphasized by the ILO Centenary Declaration for the Future of Work,66 strengthening everyone’s capabilities through effective lifelong learning and quality education is essential to ensure that all can benefit from the opportunities, and withstand the disruptions, of a rapidly changing world of work. Skills development enables workers and firms to stay adaptable and competitive in a rapidly evolving labour market. It empowers workers and enterprises alike to actively shape a future of work that is inclusive, equitable and sustainable. Yet, the effectiveness of skills policies also depends on ensuring proper recognition and adequate valuation of skills, as well as alignment with evolving labour market needs (ILO 2023a). Addressing these challenges requires coordinated action by governments, social partners, and education and training institutions to create accessible, just, responsive and flexible lifelong learning systems.
Against this backdrop, this chapter focuses on three major global transformations – demographic change, the green transition and digitalization – that are particularly relevant for understanding today’s skills challenges and opportunities. While each transformation reshapes labour markets in distinct ways, this chapter deliberately highlights specific aspects of these transformations, since they reveal critical dimensions of how the acquisition and valuation of skills enable workers and enterprises to thrive in the evolving world of work.
First, the demographic transition highlights the widespread undervaluation of skills, using care work as a key example. As societies age, the demand for care work grows; yet, the skills required for these roles often remain under-recognized and poorly rewarded. This undervaluation of workers’ skills and the related job quality deficits contribute to persistent labour shortages, as care workers are discouraged to join or remain in care jobs. Second, the green transition illustrates that technical and environmental competencies are necessary but not sufficient. Enabling a just and sustainable transition requires a broader mix of skills – both core and technical skills, across cognitive, socio-emotional and manual domains, as well as green-specific skills – to support a workforce that can adapt and innovate. Third, digitalization reveals how skills mediate the impacts of digital exposure on employment, determining whether regions with higher demand for certain skills – such as digital, socio-emotional or problem-solving skills – are better positioned to benefit from technological change or risk being left behind.
Together, these three transformations provide a lens for examining a comprehensive spectrum of skills challenges that must be addressed to build resilience: adequate recognition and valuation of skills, diverse and adaptable skills portfolios, and the capacity of skills to help workers and firms navigate disruptive change.
4.2. Valuing skills in care work to accompany demographic shifts
Skilling, upskilling and reskilling are important for enabling workers to perform their work well, adapt to transformative changes in labour markets and contribute to enterprise productivity. They can also contribute to achieving broader societal goals, including active citizenship, collective organization or social cohesion. Yet, achieving these broader goals requires avoiding an overly narrow focus on skills development aimed solely at maintaining workers’ competitiveness, as this risks placing a disproportionate burden on workers. A more nuanced approach recognizes that for skills development to translate into improved employment outcomes and broader societal benefits, labour markets and societies must also properly value the skills being acquired and used (ILO 2023a).
Care work serves as a particularly clear example of the broader issue of skills undervaluation. This section focuses on paid care work in the context of population ageing as one important aspect of demographic change, which is expected to strongly increase the demand for care services in many regions. Without concerted policy action, this rising demand will exacerbate the issue of skills undervaluation, leading to labour shortages and broader negative consequences on labour markets and societies. Generally, the example of paid care work illustrates the need for skills investment to be complemented by a fundamental shift in how skills are recognized, rewarded and socially valued – especially in sectors that generate social value and face rising demand.
4.2.1. Rising demand for care work
Across the world, populations are becoming older on average (figure 4.1). Globally, the share of persons aged 65 and above was estimated at 6.1 per cent in 1990 and 10.4 per cent in 2025 and is projected to reach 16.3 per cent in 2050 (UNDESA, n.d.). Population ageing is the combined result of a sustained drop in fertility rates, longer life expectancy and – at the regional or country level – insufficient net migration to offset population ageing.
-
Figure 4.1. Estimated and projected share of the population aged 65 and above, 1990–2050, by region (percentage)
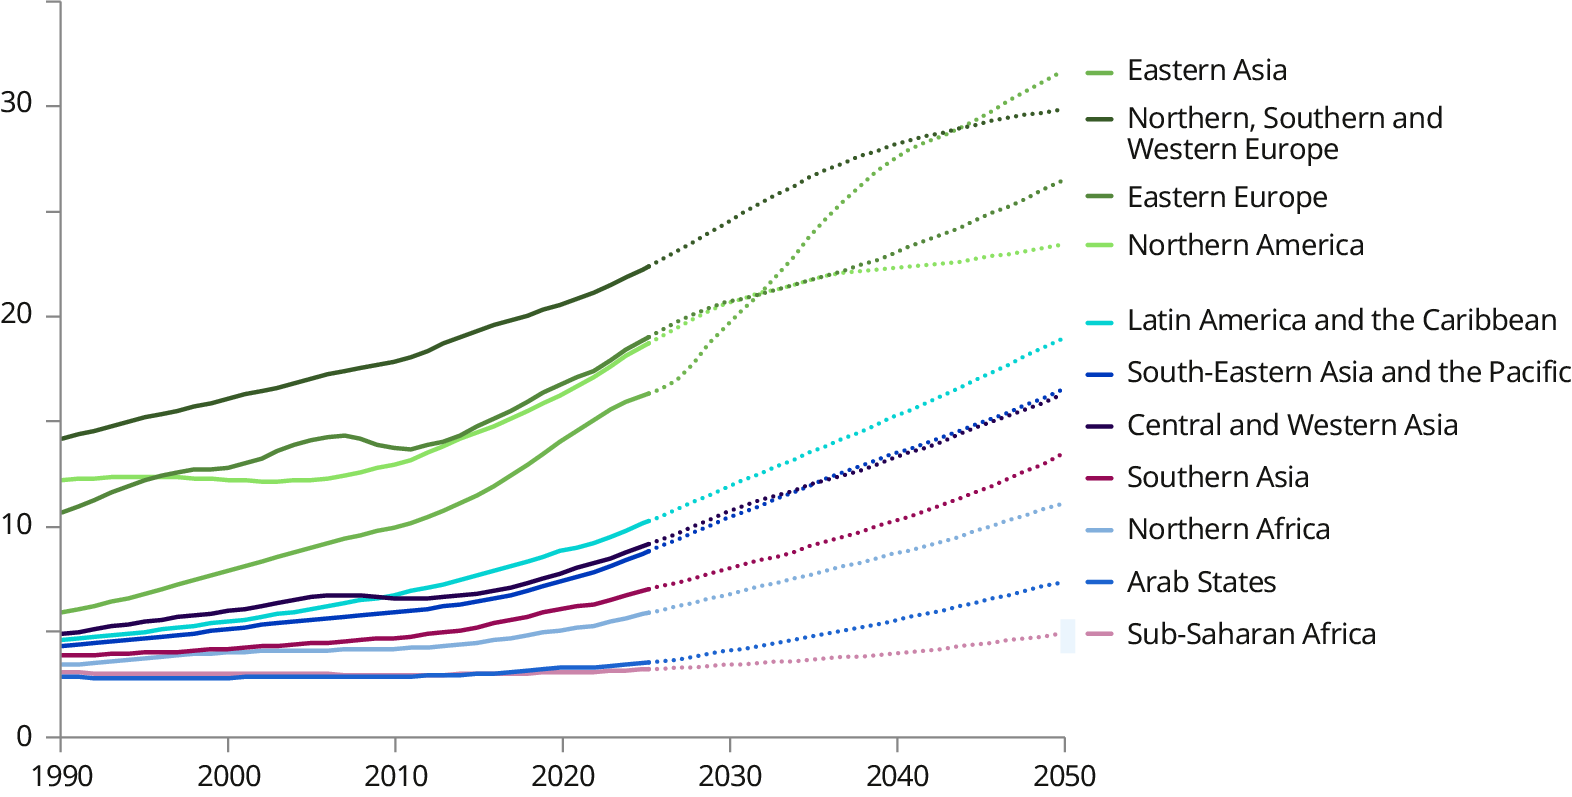
Note: The figure assumes a median projection scenario.
Source: ILO calculations based on UNDESA, "World Population Prospects 2024”.
The Asia and the Pacific region, for example, is projected to be the fastest-ageing region of the world. This process is most rapid in Eastern Asia due to developments in countries such as Japan and the Republic of Korea, but also China (ILO 2024b). The share of older persons has also increased in Latin America and the Caribbean. While this demographic transition is strongest in Chile, Costa Rica and Uruguay, no country in the region, including the larger ones, is excluded from the general trend (ECLAC 2022). In Europe and Northern America, population ageing started even earlier. For several decades, total fertility rates have been well below replacement levels in countries such as Germany, the Russian Federation, Spain and the United Kingdom (see FRED, n.d.). As such, Northern, Southern and Western Europe, Eastern Europe and Northern America are projected to be among the four regions with the largest share of individuals aged 65 and above in 2050. In contrast, the comparatively young populations in Africa and the Arab States are at the other end of the spectrum. Total fertility rates are highest in sub-Saharan Africa (at 4.72 children per woman in 2020). The populations in the region are fast-growing and among the youngest in the world (Sciubba 2022).
Population ageing is driving a sharp increase in the demand for elderly care. Figure 4.2 shows the estimated demand for long-term care workers needed to support individuals aged 65 and above with significant care needs. The figure assumes that these services are provided by paid workers rather than unpaid family members and that, depending on a country’s income level, there is a ratio of 2.5 or 3 care recipients per carer (de Henau 2022). The analysis also assumes that such carer-to-patient ratios continue to be required for patients with severe care needs, even when new technologies (such as lifting machines or robots) are introduced to perform heavy manual tasks (Lee, Iizuka and Eggleston 2025). Based on these assumptions, the global demand for long-term care workers is estimated to rise from 85.2 million in 2023 to 158.1 million in 2050. Eastern and Southern Asia have the highest projected demand, with 45.5 and 31.5 million workers needed, respectively. All regions will experience a marked growth in the share of employment this care demand represents, particularly in Northern, Southern and Western Europe and Eastern Asia, where this theoretical employment share should exceed 6 per cent by 2050. The global employment share is projected to reach 3.8 per cent, with sub-Saharan Africa being the only region not expected to see a significant rise.
-
Figure 4.2. Estimated need for long-term care workers (millions) and related share in the employed population (percentage), 2023 and 2050, by region
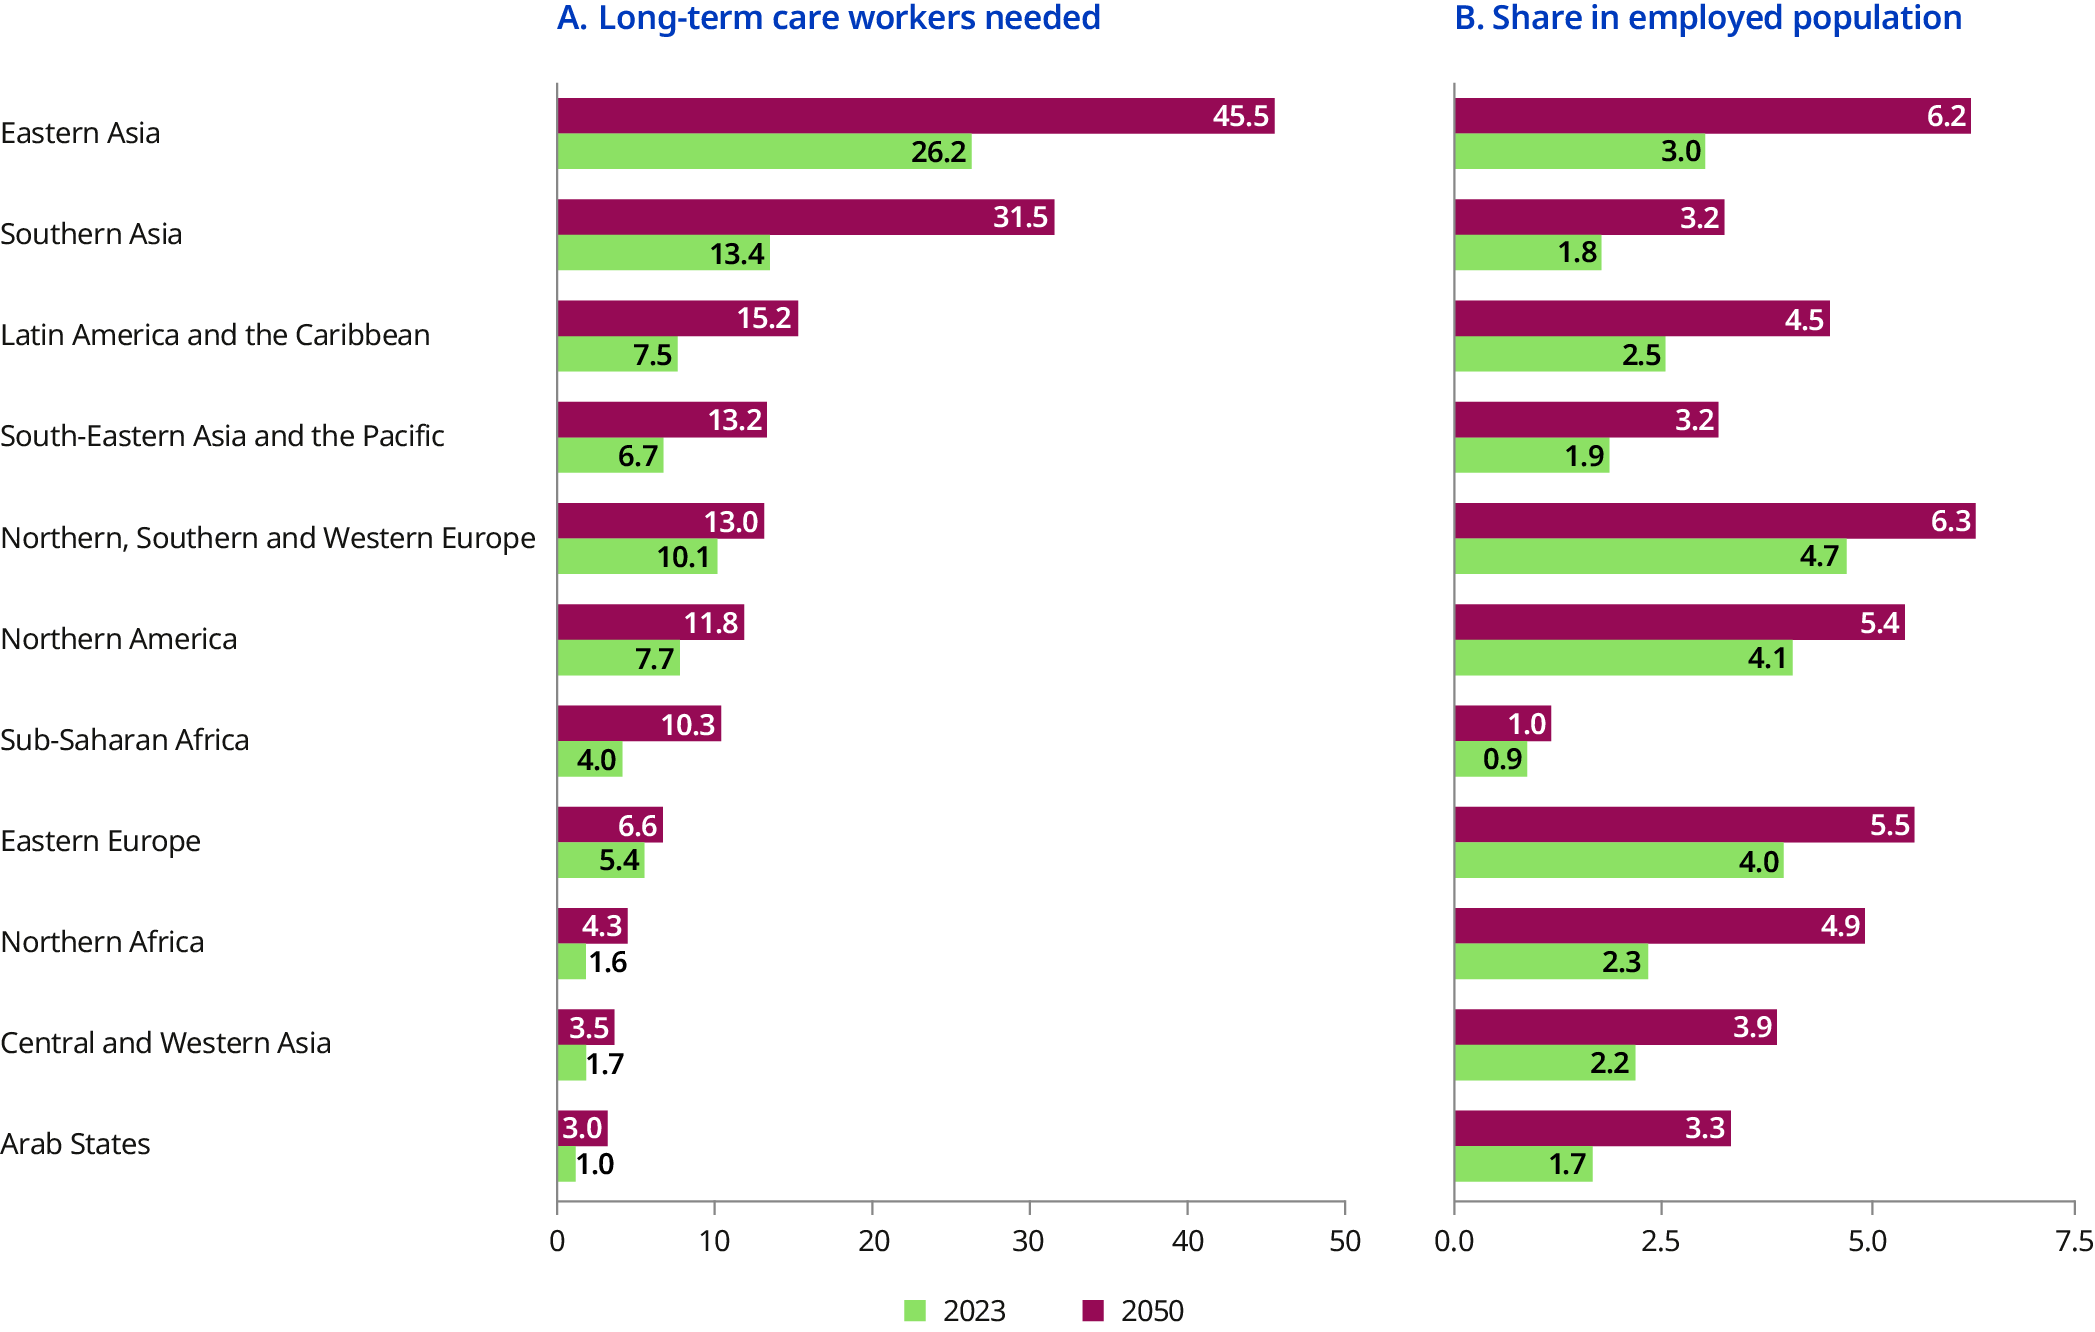
Note: Following de Henau (2022), long-term care refers to a range of services to persons aged 65 and above “facing important functional limitations in their day-to-day activities”, provided in community-based or institutional residential environments. The figures rely on estimates from the World Health Organization on populations’ life expectancy and average health status. They assume a recipient-to-carer ratio of 2.5:1 in upper-middle- and high-income countries, and of 3:1 in low- and lower-middle-income countries. See also ILO (2022) and ILO (2024b).
Source: ILO calculations.
The true demand for elderly care work may be higher if the assumed carer ratio does not suffice to fully address severe care needs – which would increase complementary labour by unpaid family members. Today, there are millions of unpaid – predominantly female – family care workers. Family care responsibilities are the main reason for women not being integrated into the labour force – especially in Africa, the Arab States and parts of Asia (ILO 2024c).
In addition, paid elderly care work spans a range of additional occupations beyond long-term care. These include health professionals and health associate professionals, providing healthcare services to elderly patients. Different types of domestic workers engage in indirect care activities, such as cleaning and cooking, which are often intertwined with personal care activities. Comprehensively defined, paid care work comprises all of these jobs, which represent “activities and relations involved in meeting […] physical, psychological and emotional needs” (Addati et al. 2018, 6; see also ILO, n.d. a). This implies that care work is highly heterogeneous, including workers with diverse formal qualification levels who span the wage spectrum.67
4.2.2. Paid care workers and their working conditions
As is the case for unpaid care work, the different types of paid care work are predominantly performed by women. Figure 4.3 illustrates this for selected occupations and sectors that are most relevant for elderly care activities. In almost all regions, most workers in these occupations and sectors are women. In addition, the share of women tends to increase in those care occupations that pay lower average wages. Relatively fewer women thus work in the better-paid occupations of health professionals and health associate professionals. In contrast, cleaners and helpers in households – who are often excluded from minimum wages and other types of labour protection (ILO 2020) – have the highest share of women, ranging from 85.1 per cent in Africa to 95.4 per cent in the Americas. Finally, the pattern for the Arab States is partly different. In this region, female employment shares among the selected care workers are lower due to the overall low labour force participation of women (see ILO 2025b).
-
Figure 4.3. Share of women working within selected care occupations and sectors, by region (percentage)
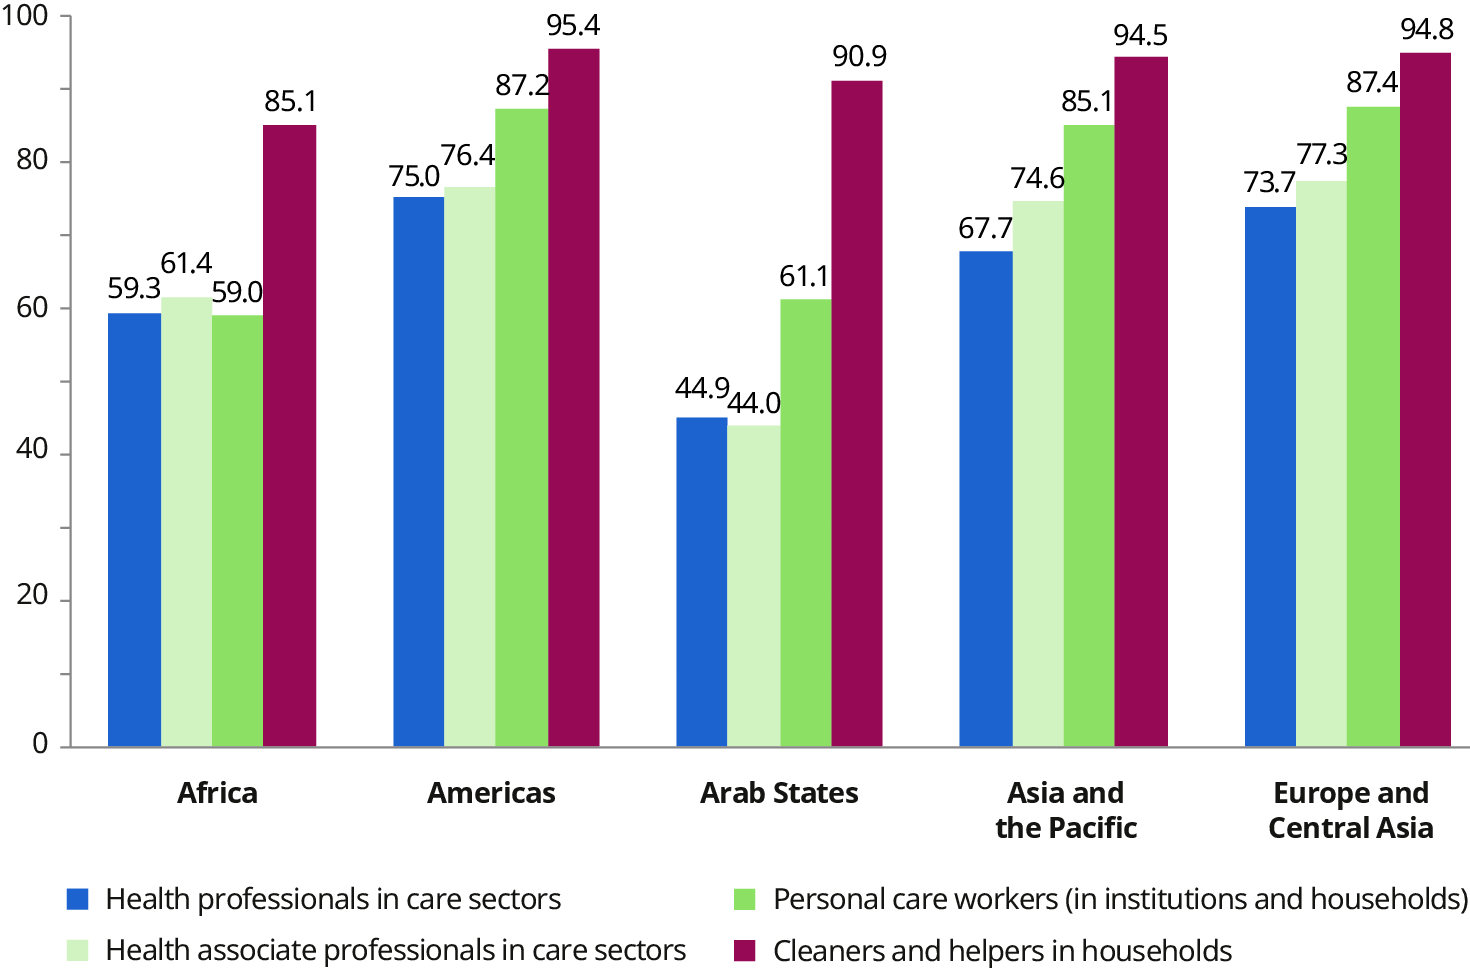
Note: The figure focuses on examples that are relevant for elderly care. “Care sectors” are defined as education, human health activities, residential care activities and social work activities without accommodation. See Addati et al. (2018) and ILO (n.d. a) for underlying concepts. Results are weighted by countries’ employment levels and based on the latest year with available data.
Source: ILOSTAT, based on ILO Harmonized Microdata from 106 countries (63.2 per cent of global employment).
In addition, care work is often performed by migrant workers (ILO 2023a). In the harmonized microdata from ILOSTAT, this can be captured, though imperfectly, by assessing the employment share of foreign-born individuals. These represent a significant share of care workers especially in high-income economies. For example, there are many foreign-born personal care workers in Australia (43.9 per cent), Israel (39.4 per cent) and Switzerland (35.9 per cent). Comparing this to examples from other regions, the share of foreign-born personal care workers is lower in Chile (though still significant at 12.5 per cent) and in the middle-income economies of Argentina (5.1 per cent) and Türkiye (4.1 per cent).
Following an economic logic, the substantial and growing demand for care workers may be expected to translate into them earning comparatively high wages and benefiting from good working conditions. However, this is regularly not the case. An older study by Budig and Misra (2010) is unique in that it compares wages of care workers in 12 countries from different regions. Controlling for workers’ personal characteristics, their educational attainment and selected job characteristics, in most countries there are wage penalties for care workers. These are particularly pronounced in Mexico (–38.6 per cent), France (–32.9 per cent), Hungary (–24.9 per cent), the Russian Federation (–19.3 per cent) and the United States (–16.8 per cent). Notable exceptions are Sweden and, to a smaller degree, Germany, where care workers have higher wages than non-care workers. The care wage penalties in other countries are partly explained by lower wages in female-dominated occupations and sectors. In addition, care wage penalties are smaller in countries with less overall wage inequality, higher union density and higher public spending on care work. More recent studies often focus on the United States. Folbre, Gautham and Smith (2023), for example, estimate that providing care services in the United States is associated with a 19 per cent wage reduction for female and male workers, compared to providing business services.
Work quality issues for care workers extend beyond wage penalties. Depending on the type of care work, such issues may entail long and unpredictable working hours, a heavy workload, a lack of labour and social protection, and a disproportionate exposure to violence and harassment at work (Addati et al. 2018; ILO 2023a). This was confirmed by an online survey among care workers employed in institutional settings in countries of all income levels. Significant shares of workers reported that staff shortages occured “often” or “always”, ranging from over 40 per cent in Nepal to over 80 per cent in Belgium. This finding correlated with a perceived negative impact on the quality of provided care services and a decline in workers’ physical and mental health. In total, 65 per cent of the surveyed care workers aged 18 to 34 stated that they would not be able to sustain their careers until they retired (UNI Global Union 2025).
The discrepancy between care workers providing crucial services and performing demanding tasks and them being exposed to poor working conditions became especially visible during the COVID-19 pandemic. During this time, care work was widely recognized as one of the essential activities guaranteeing the functioning of societies and markets. This necessitated working in proximity with others and entailed elevated risks of infection. The work demands for care workers increased substantially during the pandemic, because they needed to meet the care demands of COVID-19 patients, implement new occupational safety and health measures, and compensate for increased workplace absences (ILO 2023a). In the United States, care workers rarely received financial compensation for working under hazardous conditions during the pandemic (Folbre, Gautham and Smith 2021). As another example, community healthcare workers in India continued to receive low and delayed wages despite being responsible for COVID-19 prevention, first-contact care, hospital transfers and other essential support (ILO 2023a).
4.2.3. Valuation of paid care workers’ skills
These findings suggest that the skills of care workers are not fully valued.68 As shown in Chapter 3, possessing certain skills and skills bundles is essential for workers to access higher wages and better employment conditions. Yet, social norms also affect the value attached to given skills. For paid care workers, there is an overlap between the – often socio-emotional, but also cognitive and manual – tasks that they perform, on the one hand, and unpaid family care work, on the other hand. Scholars have argued that this association has shaped cultural ideas of the value of paid care work (see, for example, Dwyer 2013; Folbre, Gautham and Smith 2023). In addition, paid care workers may have relatively high levels of intrinsic motivation and feel emotionally attached to the care recipients. This commitment is frequently relied upon in ways that lead to comparatively low remuneration. It can similarly reduce care workers’ willingness to bargain for higher wages (Dwyer 2013; Folbre, Gautham and Smith 2023). Finally, lower wages for care workers are consistent with women bargaining less for higher remuneration than men (Biasi and Sarsons 2022).
Pietrykowski (2017) directly studies the returns to different socio-emotional skills in the United States, comparing skills returns at different points of the wage distribution. Particularly interesting are the findings for the skill of “assisting and caring for others”: Working in an occupation that relies more strongly on this skill was found to be negatively associated with wages among lower-wage workers. The same effect became positive among workers earning higher wages and when they worked in an occupation where at least 60 per cent of the workforce were men.
These arguments seem to be at odds with the finding that socio-emotional skills – which are closely related to the task of caring for others – facilitate workers’ access to jobs of better quality (recall Chapter 3). There is a gender dimension to this finding, as the stronger reliance on socio-emotional skills has facilitated women’s integration into jobs requiring such skills and increased their wages. The fact that women started using more interactive skills over time has been associated with a closing of the gender wage gap in Germany (Black and Spitz-Oener 2010). Borghans, Ter Weel and Weinberg (2014) use a conceptual framework in which women are more likely to develop socio-emotional skills as adolescents and later work in occupations that place greater emphasis on such skills. For the United States, they show that the growing returns to socio-emotional skills mirror the closing of the gender wage gap until the 1990s. Similarly, the increased importance of socio-emotional skills in higher-paying occupations between 1980 and 2016 was associated with more women working in these occupations in the United States (Cortes Cortes, Jaimovich and Siu 2023). This was a result of women’s adaptability to the automation of routine-intensive work processes and led to a decline of the gender wage gap (Cortés et al. 2024).
According to Deming (2017), socio-emotional skills enhance team collaboration, leading to higher productivity and, as a consequence, better wages for workers. Similarly, workers with strong socio-emotional skills are argued to be more effective at meeting the individual needs of their clients or patients, resulting in higher productivity and wages. However, this economic theory requires the absence of market distortions for wages to correspond closely to workers’ productivity.
There are several reasons why this condition is less likely to hold for care workers (England, Budig and Folbre 2002; Folbre, Gautham and Smith 2023). First, care workers create social value or so-called public goods that extend beyond direct outcomes for the care recipients. For example, care workers contribute to a functioning healthcare system and their work allows patients’ family members to be employed. This leads to inefficiently low levels of care provision and remuneration for care workers and care institutions in competitive markets. While public investments are one instrument to counteract such inefficiencies, public expenditure on care services has been curtailed in many countries (see also ILO 2023a; Razavi and Staab 2010). Second, measuring even the more immediate productivity of care workers is challenging, given that it entails outcomes – like patients’ enhanced well-being or life expectancy – that are difficult to conceptualize (see also Esquivel 2019). This results in incomplete information for employers and clients, which represents another distortion in wage setting. Finally, lower-wage care workers may have fewer possibilities for negotiating pay, especially when they lack collective representation or come from marginalized groups (see also Addati et al. 2018; Dwyer 2013).
As a consequence, even if it is reasonable to assume that the use of socio-emotional skills positively affects the productivity of care workers, this may not result in significantly higher wages for them. Figure 4.4 explores the relationship between socio-emotional skills and wages, comparing care services and business services in the United States. Interestingly, the two types of services are associated with similar levels of formal qualifications, and both require significant use of socio-emotional skills. In addition, the previously discussed market features play a smaller role for business services, which are less likely to be associated with the creation of public goods and outputs that are difficult to assess. Skill use is measured at the detailed occupational level. The analysis considers, for both sectors, the effect of working in an occupation that relies more strongly on socio-emotional skills in comparison to working in an occupation that relies less strongly on such skills. Socio-emotional skills are captured by an index, based on averaged skills variables capturing coordination of action, negotiation, persuasion and social perceptiveness (Deming 2017).
-
Figure 4.4. Wage and salary income returns to socio-emotional skills used in care services and business services, United States, by sex and education level, 2015–24 (percentage)
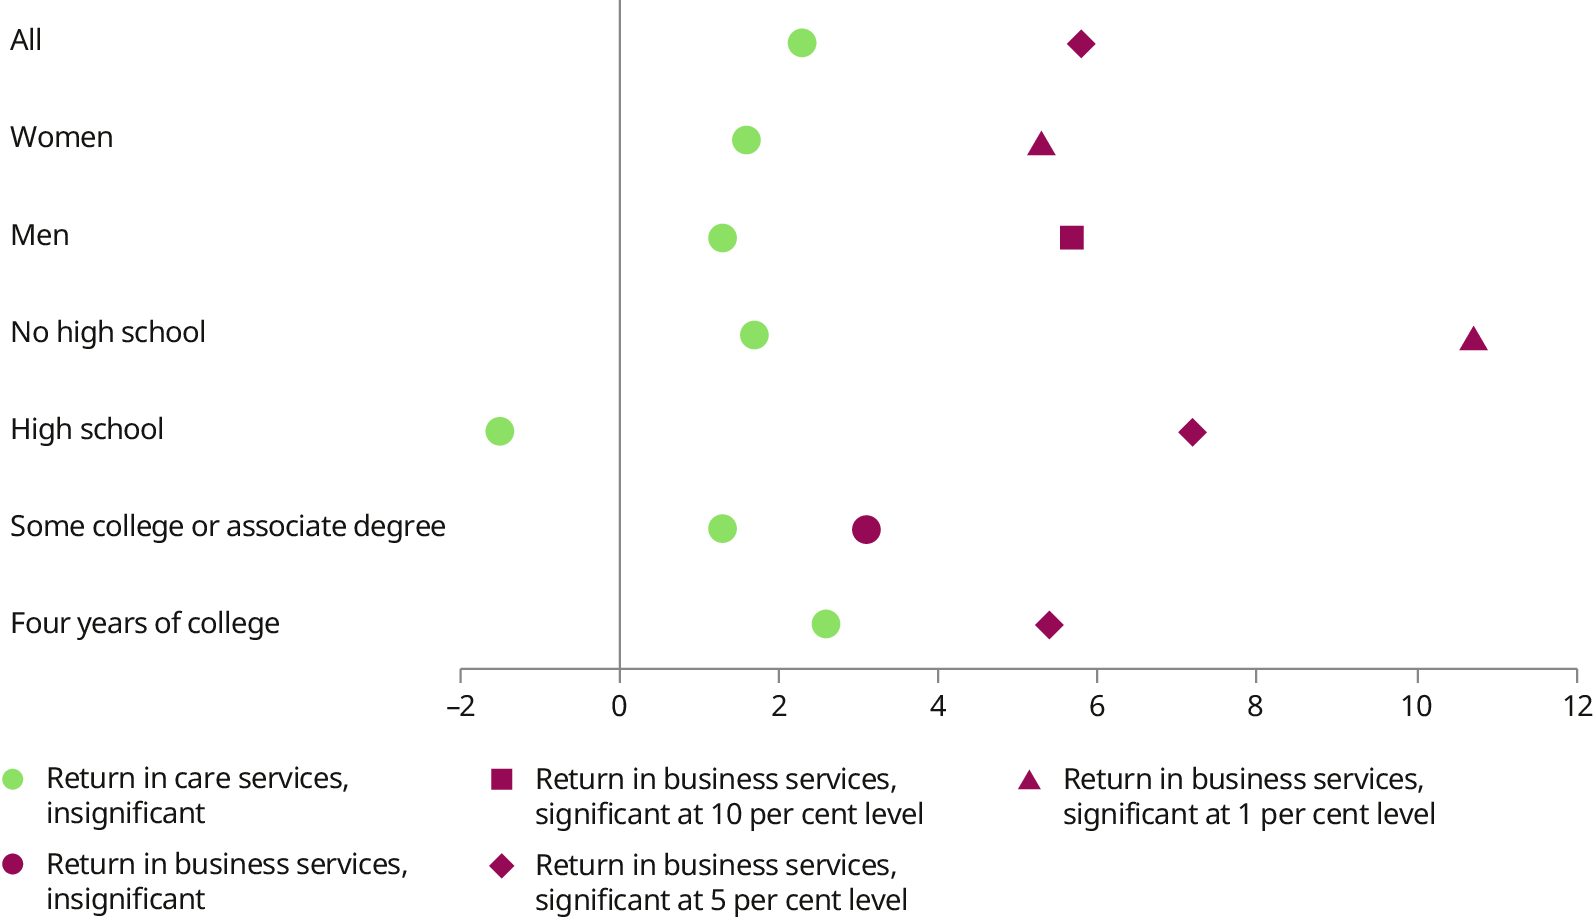
Note: The figure shows the increase in annual wage and salary income (2023 values) in care services and business services when a worker’s use of their occupational-level socio-emotional skills increases (by one standard deviation). The different markers represent various levels of statistical significance. The underlying analysis regresses individuals’ logged incomes on interactions of an index for socio-emotional skills with different sectors. Sectors follow the definition of Folbre, Gautham and Smith (2023). The underlying model also accounts for “other services” and “non-services”. Included control variables are occupational indices for cognitive and manual skills, sectoral, year and state fixed effects, regional population density (four categories), age and its square, educational attainment (four categories), the number of work weeks (six categories), weekly working hours and their square, sex and race/ethnicity (five categories). Robust standard errors were clustered at the two-digit occupational level.
Source: Liepmann and Hegewisch (2025), based on the Current Population Survey as provided by Flood et al. (n.d.) and 2021 O*NET data as processed by Carpenter et al. (2022).
The occupation-level returns to socio-emotional skills in business services are indeed economically meaningful (figure 4.4). Looking at the results for all workers, an increase (by one standard deviation) in the use of occupation-level socio-emotional skills increases wage and salary incomes by 5.8 per cent in business services. This effect is statistically significant and around 2.5 times larger than the estimated returns in care services (2.3 per cent), which are instead statistically indistinguishable from zero. The pattern is similar for men and women and for workers with different levels of formal qualification, with particularly stark differences observed among workers with lower educational attainment. The findings suggest that care workers do not benefit from the positive returns to socio-emotional skills, despite their work requiring high levels of such skills. In addition, similar patterns arise when looking at the individual components of the skills index, that is, considering separately coordination of action, negotiation, persuasion and social perceptiveness (not shown).
Of course, care and business services also require cognitive and manual skills, and the analysis controls for these. Interestingly, the occupation-level returns to these skills tend to be similar for both types of services: cognitive skills are associated with large and statistically significant wage premiums, while manual skills suggest smaller and imprecisely estimated returns (not shown). Therefore, it is the remuneration of socio-emotional skills that appears to drive the differential skills returns between care and business services.
These findings provide empirical evidence for the 2024 resolution concerning decent work and the care economy (ILO 2024a): “[w]hile care work is highly demanding and often requires high levels of skills and specialized knowledge, skills are not always fully recognized and valued accordingly” (para. 5). At an abstract level, this necessitates “raising public awareness about the social and economic value of care work” by governments and social partners (para. 30(e)). More concretely, it requires measures like the promotion of skills recognition and certification as well as a primary responsibility for the state for “care provision, funding, regulation and ensuring high standards […]” (para. 24).
As all other workers, care workers need adequate skills and appropriate training to perform their work well and access good working conditions (see Chapter 3 and section 5.3). Yet, the adequate valuation of their skills by societies and markets is equally important. Given population ageing in many regions of the world, the issue of adequate valuation will only gain in relevance. Addressing this issue is a means to meet the rapidly increasing demand for care work and improve the working conditions of care workers.
4.3. Skills to navigate the green transition
4.3.1. Environmental transformations and their impact on labour markets
Alongside demographic shifts, environmental transformations – driven by climate change, biodiversity loss, pollution and related challenges such as desertification, rising sea levels and soil degradation – are reshaping labour markets worldwide (ILO 2018, 2019b; UNEP 2023a, 2023b). Climate change is already disrupting employment, particularly in vulnerable regions and sectors such as agriculture and construction, with heat stress alone projected to cost the equivalent of 80 million full-time jobs by 2030 (ILO 2019b). In response, countries are transitioning to greener economies (see examples in box 4.1), though at different speeds. By 2021, 40 countries had adopted some form of national carbon pricing mechanism, covering about 16 per cent of global greenhouse gas emissions (World Bank 2021). This shift is altering employment patterns through new regulations, technologies, business models and related investments in infrastructure and skills.
Shifting towards a greener economy:
-
The shift to a greener economy has supported 16.2 million jobs in renewable energy globally in 2023, surpassing fossil fuel employment. However, skills shortages remain a major barrier to scaling up investments and deployment, particularly in solar, wind and grid infrastructure (IRENA and ILO 2024).
-
Investments in renewable energy and energy efficiency to achieve net-zero carbon emission by 2050 could create an additional 46 million jobs by 2030,69 compared to a business-as-usual scenario, offsetting the projected loss of 8 million jobs in carbon-intensive sectors, such as extractive industries (ILO 2024d).
Examples of adoption of environmental regulations:
-
The EU has committed to reducing its greenhouse gas emissions by 55 per cent by 2030 under the European Green Deal, one of the most ambitious climate frameworks globally (European Commission 2020).
-
Costa Rica has pioneered environmental protection through its National Decarbonization Plan, aiming for carbon neutrality by 2050, relying on renewable sources for to over 99 per cent of its electricity (Government of Costa Rica 2019).
-
India, despite being the world’s third-largest emitter, has set a goal to achieve 40 per cent of its energy capacity from non-fossil fuel sources by 2030, though it still faces challenges in phasing out coal (Government of India 2018).
While the employment effects of climate change have been well documented, the transition towards a greener economy is harder to quantify. A large body of research examines the employment effects of environmental regulation adoption (Cole, Elliott and Strobl 2008; Kahn and Mansur 2013). The existing literature, primarily focusing on high-income countries, has shown varied impacts. For example, in the United States, air quality regulations led to significant job losses in pollution-intensive sectors (Greenstone 2002; Walker 2011) while other studies highlight minimal impacts or even positive effects through innovation and green industry employment growth (Cole and Elliott 2007; Vona, Marin and Consoli 2019).
Importantly, models focusing solely on short-term disruption often overlook longer-term gains. Structural simulations and empirical studies from countries like China and South Africa point to net job creation when green policies are part of broader reforms (Li and Jin 2024; Rutovitz 2010; Rutovitz and Atherton 2009). In low- and middle-income countries, green fiscal stimuli have demonstrated short-term employment gains, particularly in infrastructure and water management projects (Schwartz, Andres and Dragoiu 2009). Recent global and regional assessments, such as the ILO (2024e) and the Inter-American Development Bank’s Net Zero 2050 scenario (IDB 2019), also project net positive outcomes when policies and regulations promote necessary investments.
Beyond jobs, environmental regulations are also influencing firm competitiveness (Dechezleprêtre and Sato 2017; Yoo and Heshmati 2019). Firms adopting green practices can achieve higher productivity, for example, by attracting and retaining environmentally conscious talent, boosting employee motivation, improving operational efficiency via energy and resource savings, and fostering innovation in sustainable processes. This alignment between firm values and worker expectations can further support sustainable business models, as later discussed in the section. Consumers’ preferences reinforce this dynamic: firms with green practices are increasingly favoured by eco-conscious customers, strengthening their market position. Foreign-owned firms also play a role as they tend to adopt greener practices, improving energy efficiency and accelerating the diffusion of environmental standards (Brucal, Javorcik and Love 2018; Eskeland and Harrison 2003).
4.3.2. Identifying green skills
While the pace and direction of the green transition ultimately depend on political will, policy coherence and institutional commitment, equipping workers with the necessary skills is essential to ensure a just and sustainable shift (ILO 2018, 2023b; Strietska-Ilina et al. 2011). Research has shown that environmental transformations have already begun to shift skill requirements, with green jobs tending to demand higher levels of cognitive and technical skills, formal education and cross-cutting competencies, such as collaboration and adaptability (Borgonovi et al. 2023; Consoli et al. 2016; Marin and Vona 2019). However, key knowledge gaps remain – especially regarding regional disparities, the quality of green jobs and how to ensure just transitions for all workers, including those in declining sectors (Hamilton et al. 2022; Ruppert Bulmer et al. 2021). Addressing these gaps requires an improved measurement of the skills needed in face of the green transition – a contribution this chapter seeks to make.
To help fill these gaps and provide actionable insights for skills policy and lifelong learning systems, this section examines two interrelated but distinct concepts: green skills and skills for green jobs (see box 4.2 for definitions). Green skills – such as environmental awareness and technical competencies related to sustainable practices – are directly linked to performing environmentally focused tasks. Identifying these skills is a crucial first step in understanding how the labour market is evolving to support the green transition. However, most green jobs typically require a broader combination of skills beyond those that are explicitly environmental. This broader category, referred to as skills for green jobs, includes for instance cognitive and socio-emotional skills, which vary by occupation and sector but are essential for delivering work that contributes to environmental goals.
The terms “green skills” and “skills for green jobs” are often used interchangeably in the literature. Yet, distinguishing between them is crucial for designing effective skills policies and for measurement purposes.
Green skills refer to specific competencies that enable individuals to carry out activities that directly contribute to environmental sustainability. These can include, for example, competencies needed to operate solar panels, manage waste, maintain renewable energy systems, apply energy-efficient construction techniques or sort recyclable materials.
In this chapter, we adopt a narrower and operational definition aligned with a task-based approach. While green skills refer to the broader concept, our measurement is more closely aligned with skills required to perform green tasks. In particular, we identify environmentally related keywords – such as “solar panels” or “waste management” – that appear in job descriptions. While these keywords are not full task statements, their presence in job ads serves as a proxy for green tasks. Their identification in job descriptions suggests that the associated jobs require the skills to perform those green tasks (that is, green skills). This pragmatic approach, commonly used today in the literature on green tasks, aligns with how green skill trends are often tracked in vacancy data (Granata and Posadas 2024; Vona et al. 2018). It differs slightly from the broader skills measurement approach in Chapter 3, which directly captures tasks and attributes present in job descriptions.
Skills for green jobs, by contrast, was introduced in the ILO by Strietska-Ilina et al. (2011) and defined as “’skills’ that are necessary for the successful performance of tasks for green jobs […] and to make any job greener. That includes both core and technical skills and covers all types of occupations that contribute to the process of greening products, services and processes, not only in environmental activities but also in brown sectors” (Gregg, Strietska-Ilina and Büdke 2015, 12). Hence, skills for green jobs include cognitive, socio-emotional and manual skills that are not inherently “green” but are essential in jobs that support the green transition. These skills are measured using the comprehensive skills approach presented in Chapter 3 (Adamczyk et al. 2025; Escudero, Liepmann and Podjanin 2024).
Measuring green skills remains challenging due to the absence of a standardized global definition (ILO 2025c; Strietska-Ilina et al. 2011). Data limitations persist, especially in low- and middle-income countries, where there are no surveys in place to capture green skills. However, several initiatives have sought to fill this gap. The EU has developed indicators to track skill needs for the green transition. The ILO identified specific technical skills critical to a just transition (ILO 2019a). Other attempts include the use of occupational classifications – like O*NET in the United States – to tag green tasks and competencies. Despite these efforts, no universally accepted measurement standard currently exists.
This chapter builds on recent advances by Granata and Posadas (2024), who developed a “green dictionary” through a comprehensive review of over 70 sources in the labour environmental economics literature, with an inclusive methodology in terms of geographical coverage of the sources used. The resulting database contains words, word roots and expressions directly associated with environmental sustainability, offering a novel tool for identifying green tasks through text analysis across different databases. This chapter adopts the narrow version of the World Bank’s dictionary (which includes only the terms that are tagged as “green” and excludes the terms tagged as “green potential”), and expands that list further, incorporating input from ILO experts (for more information about the process, see Delaporte, Escudero and Adamczyk 2025). This ILO green dictionary is then applied to online job vacancy data using NLP to detect and measure the presence of green tasks in job postings (see box 4.3). The identification of keywords associated with green tasks in job vacancies suggests that these jobs require the skills needed to carry out such green tasks.
Green tasks are identified using the ILO green dictionary – a refined and expanded version of Granata and Posadas’ dictionary – which contains various words, word roots and expressions directly associated to environmental sustainability (Delaporte, Escudero and Adamczyk 2025).
To structure this identification process, environmentally-relevant terms are grouped into nine categories reflecting key sustainability domains: (i) alternative energy systems; (ii) energy efficiency and consumption; (iii) sustainable building and construction; (iv) emissions, pollution and sustainable transportation; (v) recycling and waste management; (vi) sustainable agriculture, forestry and food production; (vii) natural resource conservation; (viii) environmental awareness; and (ix) environmental certifications and compliance (see figure 4.5 for an application to South African vacancy data).
-
Figure 4.5. Word clouds depicting words matched for green tasks categories, South Africa
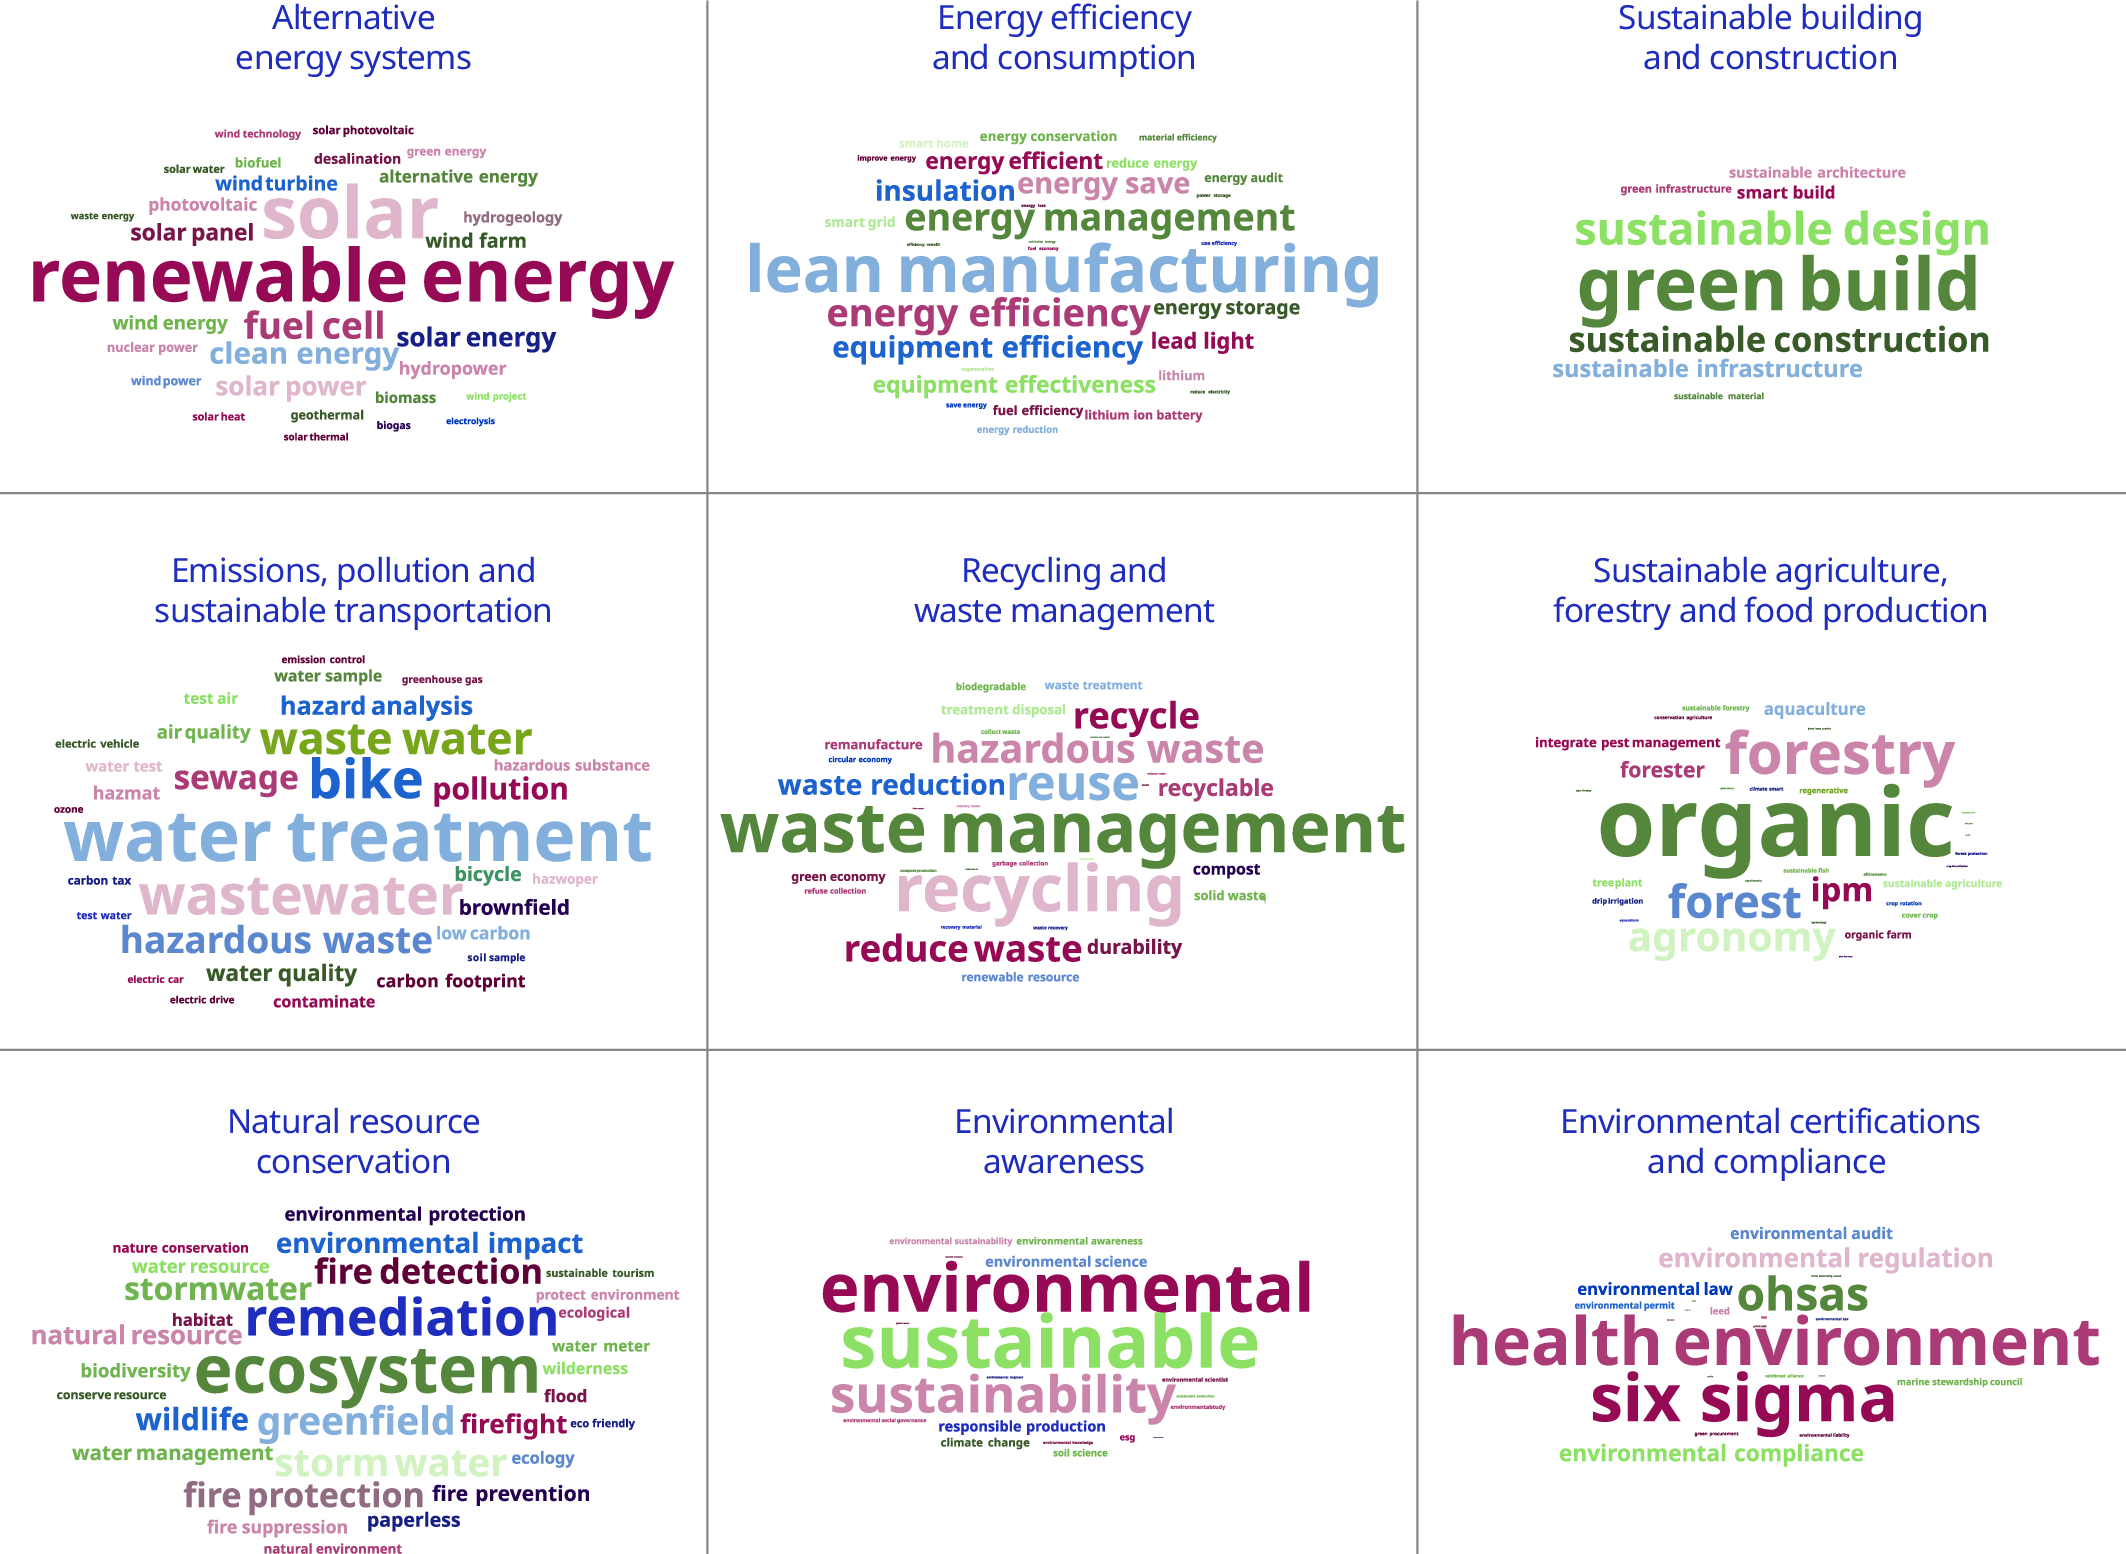
Note: The size of a word reflects how often it appears in the data: the bigger the word, the more frequently it is found in online job vacancies.
Source: Analysis based on Adzuna vacancy data for South Africa (2016–21).
Green skills mismatches: Demand and supply in comparison
Examining the presence of green tasks in both vacancies (reflecting employer demand) and job histories descriptions (reflecting worker-reported tasks performed), particularly in low- and middle-income countries, helps illustrate how the green transition is unfolding at different speeds across contexts (Granata and Posadas 2024; OECD 2023; Strietska-Ilina et al. 2011; Vona et al. 2018). However, empirical evidence remains scarce and most available insights come from global aggregations that may mask national and sectoral specificities. For example, the Global Green Skills Report (LinkedIn 2023), which draws on LinkedIn data for a large number of countries, offers a broad perspective by tracking the presence of green skills in job postings and worker profiles. The report finds that the share of workers with at least one green skill increased by 12.3 per cent between 2022 and 2023, while job postings requiring green skills rose nearly twice as fast – by 22.4 per cent. Despite this momentum, it estimates that only one in eight workers worldwide currently possesses any green skill, underscoring the magnitude of the global shortfall.
With these insights in mind, this chapter provides country-specific evidence on the dynamics of green tasks using detailed online job vacancy and applicant data for Brazil and Uruguay. By leveraging the ILO green dictionary, the analysis identifies not only the overall presence of green tasks but also their distribution across nine subcategories – enhancing the granularity and policy relevance of the findings (figure 4.6). Between 2010 and 2023, 2.5 per cent of job vacancies in Uruguay included at least one green task, compared to 2.3 per cent of applicants reporting such tasks. In Brazil, both shares were higher, at 5.8 per cent for vacancies and 8.3 per cent for applicants. Despite the differences in levels, the demand–supply gap is relatively narrow, especially in Uruguay, suggesting a relatively balanced green labour market in contrast to the global picture painted by LinkedIn (2023). Furthermore, although overall levels remain low in absolute terms, the narrow gap is unlikely to pose a major constraint – especially given the importance of skills bundles highlighted in Chapter 3 and the fact that green-specific skills are required alongside other core and technical skills.
-
Figure 4.6. Share of applicants’ job spell descriptions and job vacancies reporting green tasks in Brazil and Uruguay, by subcategory (percentage)
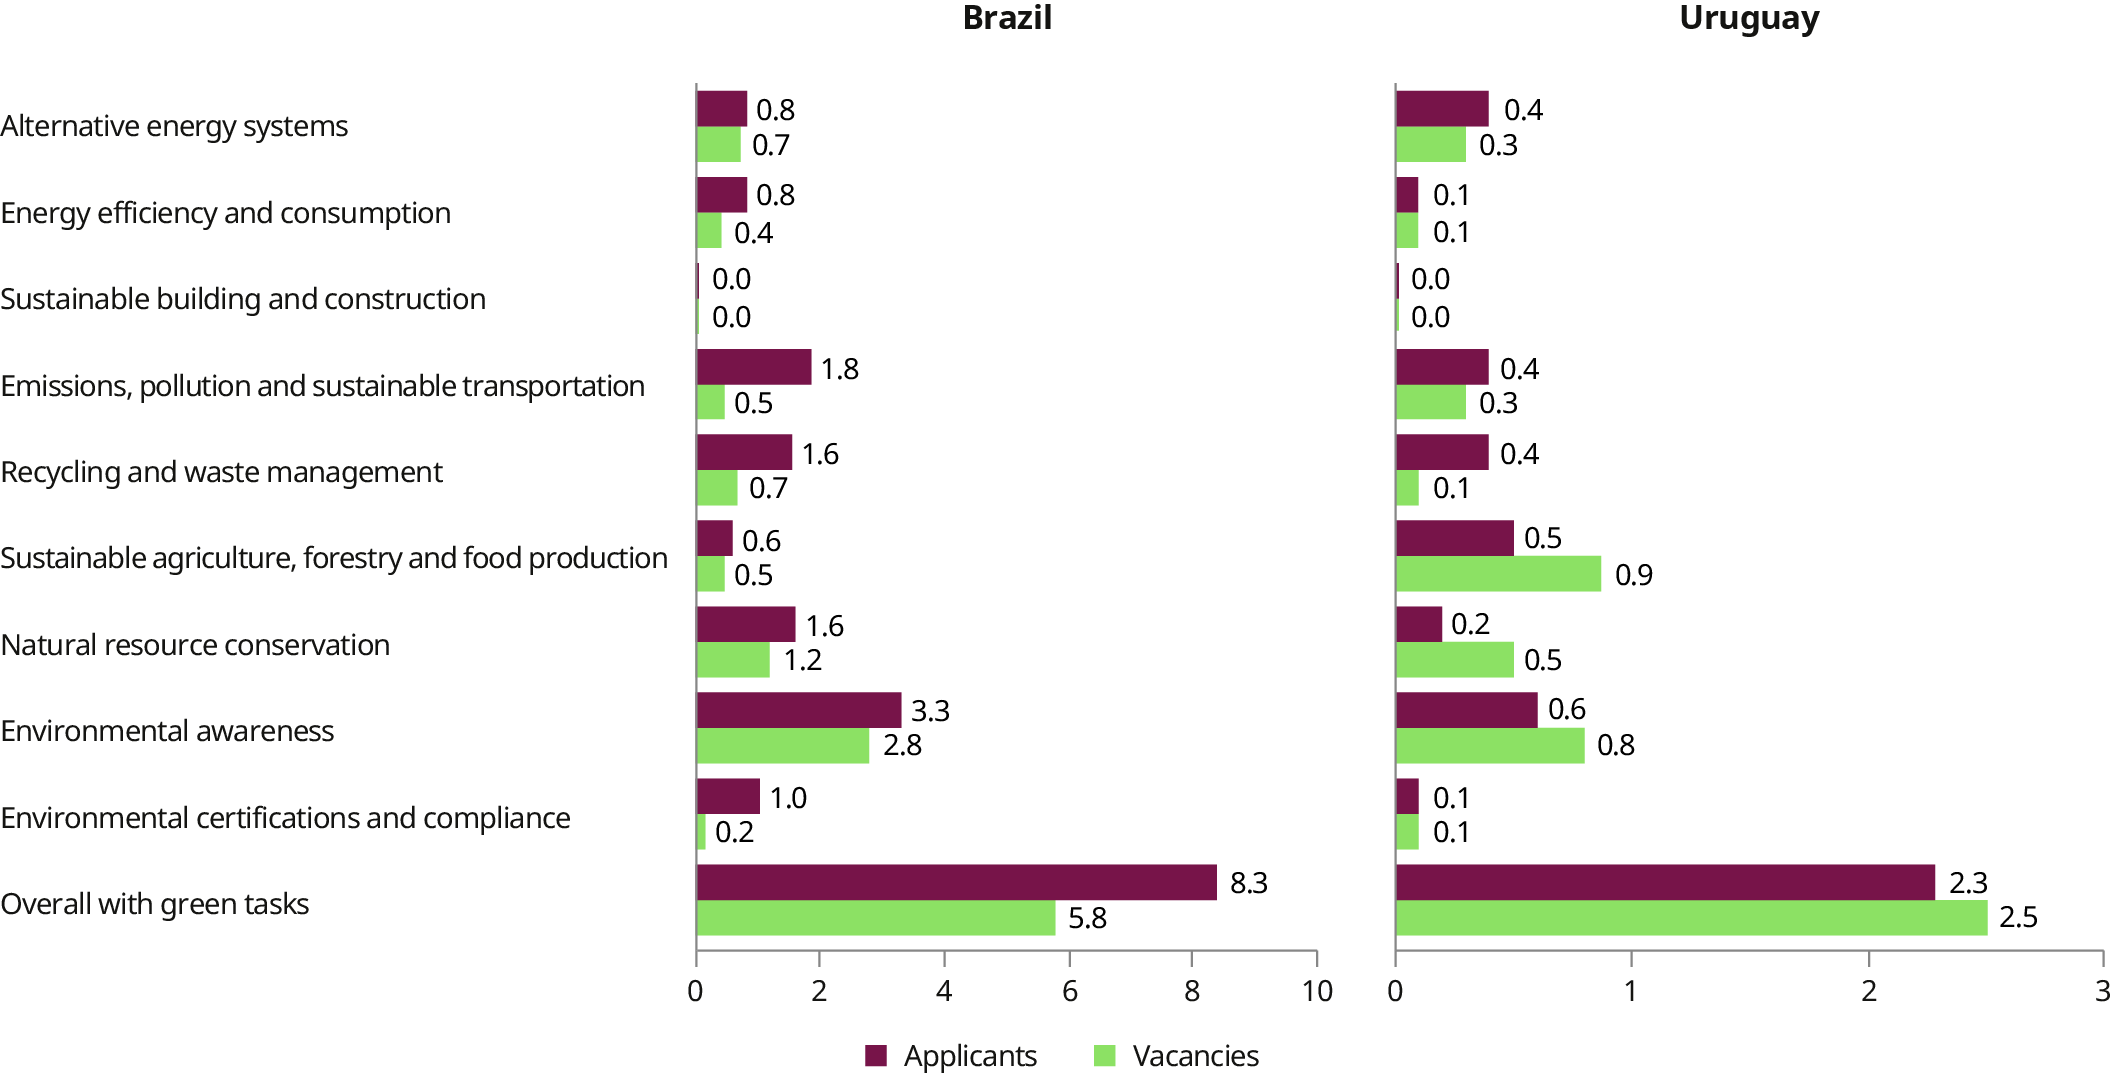
Source: The analysis uses BuscoJobs vacancy and applicant data for Brazil (2010–23) and Uruguay (2010–23).
These results highlight the importance of grounding green skills analyses in country-specific data, since national patterns may diverge from global-level findings. When disaggregating by subcategory, a surplus is observed among applicants in areas such as: (i) alternative energy systems; (ii) energy efficiency and consumption; (iii) emissions, pollution and sustainable transportation; and (iv) environmental certifications and compliance. Conversely, employers – particularly in Uruguay – more frequently post vacancies mentioning tasks in areas such as natural resource conservation and environmental awareness.
Beyond the potential presence of green skills mismatches, there is broad recognition that these skills are essential to managing the transition to more sustainable economies (ILO 2025c). In response, many countries have begun integrating green-specific competences into their lifelong learning and TVET systems – through curriculum reforms, new certifications and the inclusion of green elements across occupational standards (see box 4.4). These efforts reflect a growing understanding that both new labour market entrants and current workers need continuous opportunities to develop green skills as technologies, regulations and business models evolve. As this integration progresses, it is crucial to address inequalities related to sex, age, education, socio-economic background and geography – ensuring that green skills strategies foster, rather than undermine, a just and inclusive transition.
Countries are beginning to integrate green skills into lifelong learning and TVET systems, offering useful lessons for policy. For instance:
-
Viet Nam: The programme “Reform Technical and Vocational Education and Training in Viet Nam” promotes environmental and digital skills training, equipping workers in sectors such as energy, forestry and wastewater management, supporting the country’s twin green and digital transition. It fosters partnerships between policymakers, businesses and TVET institutions to create a more flexible and equitable TVET system that ensures inclusive, demand-driven training.
-
South Africa: The programmes “Skills Development for a Green Economy II” and its follow-up “Career Path Development for Employment” have promoted the development of green skills through a dual approach that combines theoretical instruction at TVET institutions with practical, on-the-job training in collaboration with industry partners. In collaboration with TVET institutions, industry stakeholders and sector education and training authorities, these initiatives updated training curricula and developed new qualifications tailored to emerging green markets.
Together, these experiences highlight the willingness of countries to align skills strategies with climate and industrial policies, embedding sustainability across existing programmes. The examples illustrate that integrating green skills is not a parallel agenda but a means to strengthen lifelong learning systems to prepare workers and enterprises for environmental transformations.
Source: ILO (2025d).
4.3.3. “Greenness” of jobs and occupations
Despite several authoritative definitions, there is no single, universally adopted definition of a green job across institutions and contexts (Bowen and Kuralbayeva 2015). A widely cited one defines green jobs as those in various sectors that contribute to preserving or restoring environmental quality (UNEP et al. 2008). More recently, the ILO defined green jobs as decent jobs that contribute to preserving or restoring the environment, whether in traditional sectors such as manufacturing and construction, or in emerging sectors like renewable energy and energy efficiency (ILO, n.d. b). This dual focus on environmental and social goals was reaffirmed in the 2023 resolution of the International Labour Conference (ILO 2023c). Additionally, the ILO distinguishes between green occupations, which directly support environmental protection, sustainability or energy efficiency, and brown occupations, which are typically associated with high environmental impacts, such as those in the fossil fuel industry (Strietska-Ilina et al. 2011).
In this chapter, green jobs and green occupations are classified by their degree of “greenness” based on the green tasks identified in vacancies, using the ILO green dictionary discussed above. Vacancies that mention at least one of these tasks are classified as green vacancies, while those that do not are classified as non-green (see box 4.5). Green vacancies are further differentiated into lighter green vacancies – which feature a lower share of green tasks among all listed skills – and darker green vacancies – which show a high concentration of such tasks. In line with the literature from high-income countries (see, for example, Bachmann et al. 2024), this distinction helps capture the varying degrees of environmental content across different roles. At the occupational level, green occupations are defined as those in which green tasks are systematically present in a significant share of vacancies, as detailed in box 4.5.
This chapter classifies vacancies by their degree of “greenness” using a task-based approach, applying NLP techniques to online job postings, drawing on the ILO green dictionary described in box 4.3. Specifically, the share of green tasks relative to all required skills is calculated at the vacancy level for each country analysed (Delaporte, Escudero and Adamczyk 2025).
Vacancies are then grouped into three categories based on their share of green tasks:
-
Non-green vacancies: Vacancies with no mention of green tasks (that is, a share of zero), which include both neutral and brown vacancies.
-
Lighter green vacancies: Vacancies for which the share is below the mean among all green vacancies.
-
Darker green vacancies: Vacancies for which the share is equal to or above the mean for green vacancies.
This approach builds on the notion of “shades of green” introduced by the ILO co-authored report (UNEP et al. 2008), which remains useful for distinguishing varying degrees of environmental relevance across jobs.
To classify ISCO-08 two-digit occupations by their degree of greenness, the share is calculated by summing all green tasks identified in vacancies within a given ISCO-08 two-digit occupation and dividing that by the total number of all skills listed across all those vacancies. Occupations are then divided into quintiles: those in the lowest quintile are considered non-green, while those in the highest quintile are classified as darker green. Occupations in the middle three quintiles are considered lighter green.
It is important to note that online job postings may omit certain skills and tasks that are implicitly expected. As a result, online vacancies may underreport certain green skills or tasks. Another limitation of this method is that online job postings often do not represent the full labour market. To address this and ensure broader coverage of occupations and sectors, results from the task-based approach applied to vacancies are compared with a task-based approach applied to occupational descriptions. This alternative method applies the ILO green dictionary directly to occupational task descriptions in the ISCO-08 manual (Adamczyk et al., 2026).
As for vacancies, the green share is calculated for each ISCO-08 two-digit occupation. Occupations are then divided into quintiles to identify non-green, lighter green and darker green occupations. While both methods yield broadly similar classifications of green occupations, this chapter relies on the task-based approach applied to vacancy data for two reasons. First, it allows for country-specific analyses, whereas the ISCO occupational descriptions are common among all countries and do not allow to capture variation across country contexts. Second, the vacancy-based method captures variation within occupations over time, whereas the occupation-based method can only measure composition effects across time. The monitoring of changes over time at the country level is an essential feature for understanding how green tasks or skills evolve in dynamic labour markets. Still, the convergence of the two methods is an important validation of the representativity of the ILO approach based on online vacancy data.
Table 4.1 presents the ISCO-08 two-digit occupational groups with their corresponding share of green tasks as a proportion of all identified skills in job vacancies in Brazil, Morocco, the Russian Federation, South Africa and Uruguay.
|
|
Occupations |
Brazil |
Morocco |
Russian Federation |
South Africa |
Uruguay |
|---|---|---|---|---|---|---|
|
11 |
Chief executives, senior officials and legislators |
2.9 |
2.0 |
1.9 |
3.0 |
1.0 |
|
12 |
Administrative and commercial managers |
2.6 |
1.8 |
0.9 |
1.6 |
0.9 |
|
13 |
Production and specialized services managers |
3.5 |
1.2 |
1.5 |
1.8 |
0.8 |
|
14 |
Hospitality, retail and other services managers |
2.1 |
0.8 |
0.3 |
0.6 |
0.0 |
|
21 |
Science and engineering professionals |
6.0 |
3.5 |
2.6 |
3.2 |
1.9 |
|
22 |
Health professionals |
3.0 |
3.9 |
0.5 |
1.1 |
0.7 |
|
23 |
Teaching professionals |
1.4 |
1.3 |
0.6 |
0.5 |
6.6 |
|
24 |
Business and administration professionals |
2.5 |
0.8 |
0.8 |
0.9 |
2.2 |
|
25 |
Information and communications technology professionals |
2.3 |
1.0 |
1.0 |
0.8 |
0.3 |
|
26 |
Legal, social and cultural professionals |
1.5 |
2.1 |
1.0 |
0.9 |
0.4 |
|
31 |
Science and engineering associate professionals |
5.0 |
3.2 |
1.7 |
2.6 |
0.4 |
|
32 |
Health associate professionals |
6.0 |
1.7 |
0.5 |
1.3 |
0.7 |
|
33 |
Business and administration associate professionals |
1.4 |
0.9 |
0.7 |
1.1 |
0.9 |
|
34 |
Legal, social, cultural and related associate professionals |
2.1 |
0.6 |
0.3 |
1.2 |
0.3 |
|
35 |
Information and communications technicians |
2.7 |
0.6 |
0.6 |
0.6 |
0.2 |
|
41 |
General and keyboard clerks |
2.1 |
0.5 |
0.4 |
0.5 |
0.2 |
|
42 |
Customer services clerks |
1.6 |
0.3 |
0.6 |
0.5 |
0.3 |
|
43 |
Numerical and material recording clerks |
2.5 |
0.4 |
1.8 |
0.2 |
0.3 |
|
44 |
Other clerical support workers |
n/a |
0.5 |
0.3 |
0.6 |
0.7 |
|
51 |
Personal service workers |
2.8 |
0.4 |
1.0 |
1.0 |
2.3 |
|
52 |
Sales workers |
2.0 |
0.8 |
0.6 |
0.5 |
0.4 |
|
53 |
Personal care workers |
0.9 |
0.5 |
1.3 |
0.4 |
0.2 |
|
54 |
Protective services workers |
8.1 |
0.8 |
1.3 |
1.6 |
1.2 |
|
61 |
Market-oriented skilled agricultural workers |
0.6 |
3.2 |
3.2 |
3.6 |
n/a |
|
62 |
Market-oriented skilled forestry, fishery and hunting workers |
24.3 |
18.2* |
23.0 |
2.4 |
n/a |
|
71 |
Building and related trades workers (excluding electricians) |
5.0 |
5.6 |
2.6 |
2.5 |
0.8 |
|
72 |
Metal, machinery and related trades workers |
5.8 |
2.3 |
1.7 |
2.3 |
1.9 |
|
73 |
Handicraft and printing workers |
1.7 |
4.5 |
2.1 |
1.9 |
n/a |
|
74 |
Electrical and electronic trades workers |
6.4 |
2.5 |
2.3 |
2.4 |
1.3 |
|
75 |
Food processing, woodworking, garment and other craft and related trades workers |
3.1 |
1.6 |
1.3 |
1.7 |
1.3 |
|
81 |
Stationary plant and machine operators |
7.6 |
3.3 |
2.2 |
2.4 |
3.0 |
|
82 |
Assemblers |
3.3 |
1.8 |
0.9 |
3.3 |
2.1 |
|
83 |
Drivers and mobile plant operators |
6.6 |
0.9 |
2.0 |
1.1 |
0.6 |
|
91 |
Cleaners and helpers |
13.3 |
1.9 |
2.1 |
0.9 |
1.3 |
|
92 |
Agricultural, forestry and fishery labourers |
17.8 |
2.5 |
0.9 |
0.0 |
n/a |
|
93 |
Labourers in mining, construction, manufacturing and transport |
4.9 |
0.6 |
2.4 |
1.0 |
0.6 |
|
94 |
Food preparation assistants |
6.8 |
0.3 |
0.9 |
0.6 |
0.5 |
|
95 |
Street and related sales and services workers |
3.8 |
0.0 |
9.5 |
n/a |
n/a |
|
96 |
Refuse workers and other elementary workers |
9.2 |
0.6 |
3.9 |
1.5 |
0.2 |
Key: * = estimates based on a sample size of vacancies of fewer than 100 observations (should be interpreted with caution); n/a = data not available.
Note: The method for classifying occupations by degree of greenness is explained in box 4.5.
Source: The analysis uses vacancy data from BuscoJobs for Brazil (2010–23) and Uruguay (2010–23), Adzuna for the Russian Federation (2016–21) and South Africa (2016–21), and Veille+ for Morocco (2022–25).
Two key insights emerge. First, certain occupations consistently exhibit higher green shares, reflecting their close alignment with environmental objectives and technical functions. These include science and engineering professionals (ISCO 21), skilled trades (ISCO 71–74), and plant and machine operators (ISCO 81–83), which generally show greater green skill intensity across most countries. For example, job postings in ISCO 21 frequently include terms such as “environmental”, “sustainable”, “stormwater” and “wastewater”, indicating roles in designing, implementing or maintaining environmentally compliant systems. In ISCO 71–74, references to “solar panels” and “renewable energy” suggest work linked to the installation and maintenance of green technologies. ISCO 81–83 postings include references to logistics tasks involving managing recyclable materials or overseeing eco-friendly processes.
Second, for occupations not traditionally associated with environmental functions, the presence of green tasks varies across countries. This is evident in occupations such as personal care workers (ISCO 53), labourers in mining, construction, manufacturing and transport (ISCO 93), food preparation assistants (ISCO 94), and refuse workers and other elementary occupations (ISCO 96). Brazil, in particular, exhibits relatively high green shares in many of these roles, indicating a broader integration of environmental competencies into service and lower-skilled manual jobs. Job postings in ISCO 93 in Brazil, for instance, frequently mention tasks related to sustainability (for example, complying with sustainability guidelines or regulation), recycling (for example, preparing and stacking materials for reuse), and water and sewage management (for example, repairing piping or unclogging networks). In contrast, Uruguay, Morocco and South Africa register substantially lower green shares in these same occupations. Overall, these patterns highlight the need for tailored skills policies that consider both occupational structures and each country’s trajectory in the green transition.
4.3.4. Beyond green skills: Skills for green jobs
Green skills – such as environmental awareness and technical know-how – are essential for the green transition, but they are only part of the broader skill set needed. This chapter builds on the definition of green vacancies and green occupations presented above to examine the specific skills they require. While green vacancies and green occupations require at least one green task, they also demand a broader set of skills – referred to as skills for green jobs. These include a wide range of cognitive, socio-emotional and manual skills that enable workers to adapt to green technologies and processes. These broader skill sets are measured using the comprehensive skills approach presented in Chapter 3 (Adamczyk et al.2025; Escudero, Liepmann and Podjanin 2024).
Most evidence from high-income countries shows that green jobs tend to demand more complex skill sets than non-green jobs. For instance, studies using US data show that green occupations are typically more intensive in analytical and technical skills and involve fewer routine tasks (Vona et al. 2018). They also rely more heavily on high-level abstract skills, such as those requiring reasoning, and are typically associated with higher levels of education, work experience and on-the-job training (Consoli et al. 2016). By contrast, other research finds that non-green jobs differ from green jobs in only a few skill-specific dimensions, suggesting that most green job transitions could be supported through targeted on-the-job training (Bowen, Kuralbayeva and Tipoe 2018). Still, little is known about these patterns in low- and middle-income countries.
To help fill this gap, this section provides new evidence from five countries not previously studied in the literature. Recognizing that required skills vary substantially across occupations (see Chapter 3), the analysis focuses on within-occupation comparisons, examining the skills profiles – that is, the required combination of cognitive, socio-emotional or manual skills – of green and non-green vacancies within the same ISCO occupational group. Two major ISCO-08 groups are examined: ISCO 1 (managers) and ISCO 9 (elementary occupations).
Figure 4.7 reveals notable differences in skill profiles between green and non-green vacancies. Among ISCO 1, green vacancies generally require more advanced skills, particularly in the area of cognitive skills. In Morocco, the Russian Federation, South Africa and Uruguay, green managerial positions exhibit higher demand for sophisticated cognitive skills, core cognitive abilities, computer literacy (or advanced digital skills in the case of the Russian Federation), project and process management, and financial competencies. These jobs also show stronger requirements for socio-emotional skills, especially those related to social interaction, and people management.
-
Figure 4.7. Skill profiles for green and non-green vacancies in ISCO occupational groups 1 and 9, by country
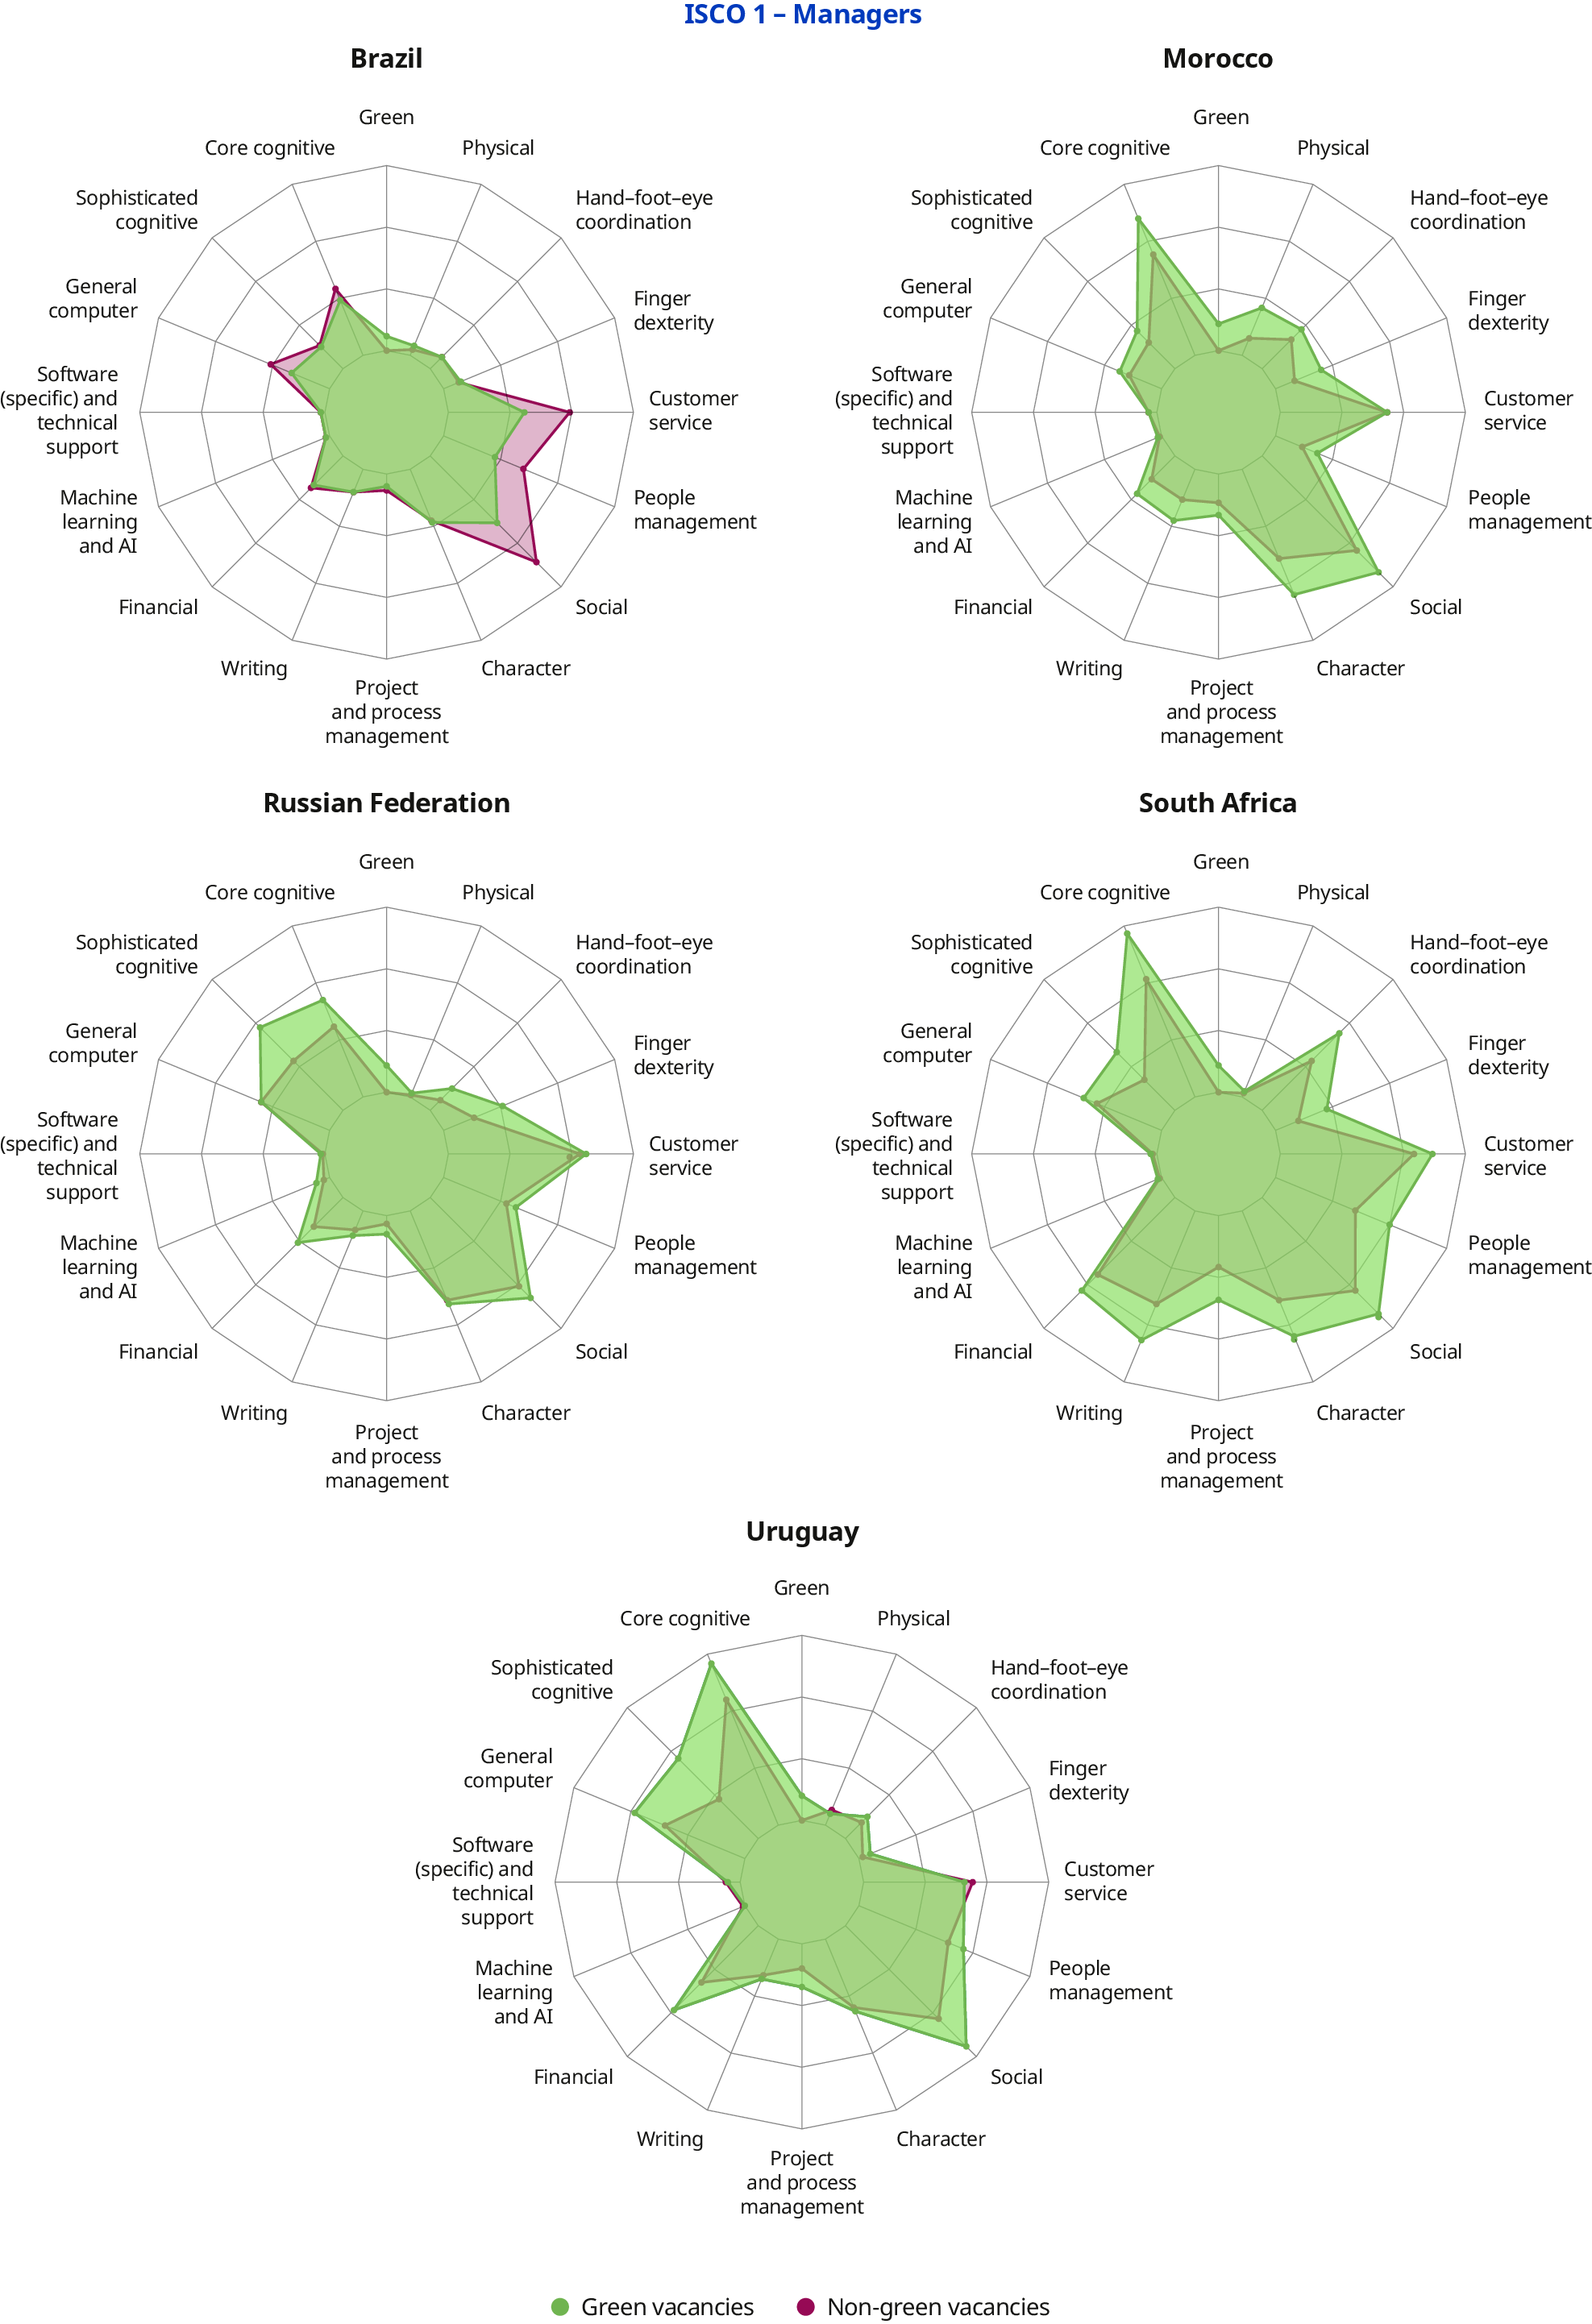
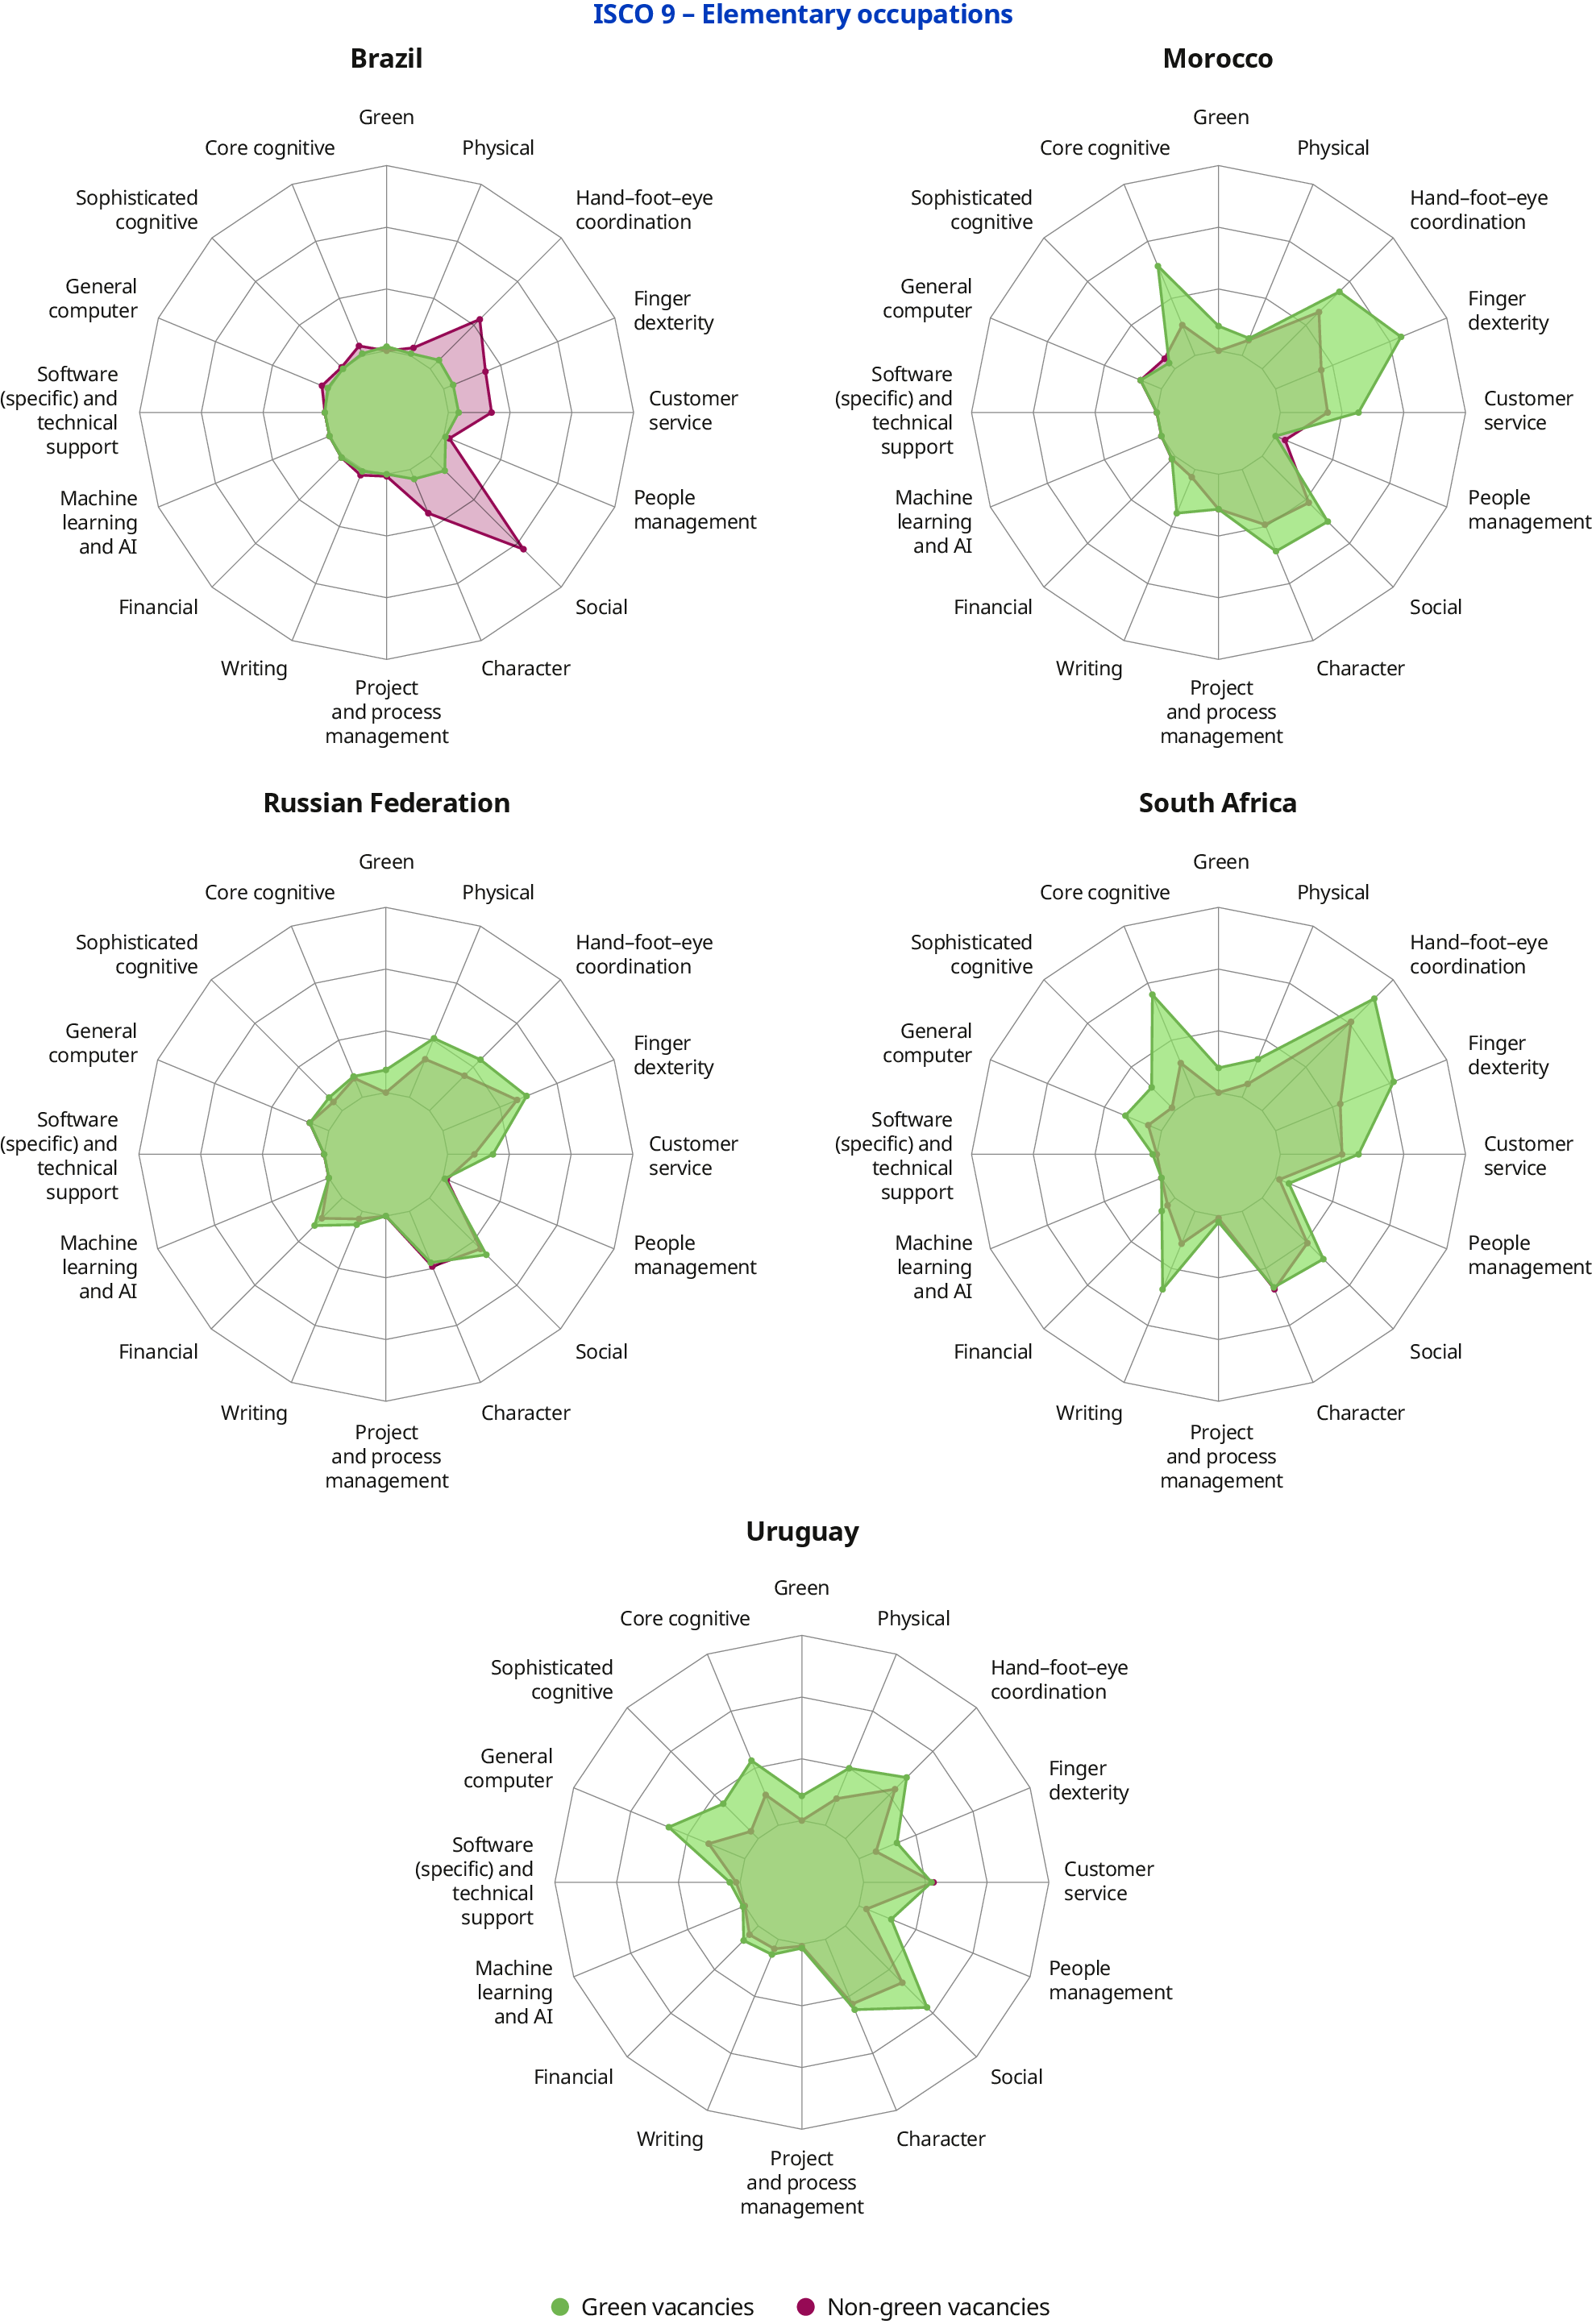
Note: The outermost ring corresponds to 90 per cent of vacancies mentioning a skill. Therefore, a marker further away from the centre means the given skill is more frequently advertised.
Source: The analysis uses vacancy data from BuscoJobs for Brazil (2010–23) and Uruguay (2010–23), Adzuna for the Russian Federation (2016–21) and South Africa (2016–21), and Veille+ for Morocco (2022–25).
However, cross-country differences are evident. In Morocco, the Russian Federation and South Africa, green managerial jobs require more of nearly every skill type compared to non-green ones – with the gap being especially pronounced in South Africa. In contrast, in Brazil, the differences in skill requirements between green and non-green managerial jobs are minimal. In some cases – such as computer skills, core cognitive skills and socio-emotional skills – non-green jobs even exhibit slightly higher skill requirements.
These patterns extend to lower-skilled occupations as well. In ISCO 9, green vacancies still tend to demand a more intensive mix of skills compared to non-green ones, though the differences are less pronounced than in higher-skilled occupations. In South Africa, for example, green vacancies in elementary occupations require stronger core cognitive and physical skills, suggesting that green roles may set a higher threshold for basic functional competencies. Similarly, in the Russian Federation, green vacancies in ISCO 9 show higher demand for finger dexterity and customer service skills. Morocco also displays noticeable gaps, with green vacancies in elementary occupations requiring higher levels of core cognitive abilities, finger dexterity and hand–foot–eye coordination skills compared to non-green roles. Lastly, Brazil, once again, is unique in showing higher skill requirements for non-green roles in this occupational group, while the skill requirements for green vacancies are negligible.
4.3.5. Job quality and equity
While green vacancies typically require a broader – and often more advanced – set of skills, ensuring a just transition means that these vacancies must also provide decent wages and working conditions. This is a prerequisite to be considered a green job, according to the ILO definition (ILO, n.d. b). Such conditions are essential to avoid exacerbating existing labour market inequalities.
The existing literature – primarily focused on high-income economies – shows that while green jobs often differ from neutral or brown jobs in terms of skills and educational requirements, they show fewer differences in working conditions. In the United States, for instance, low-carbon jobs tend to require higher skill levels across a broad set of competencies, yet many still offer relatively low wages, particularly in emerging green sectors (Vona et al. 2018). In contrast, Saussay et al. (2022) find that while low-carbon jobs in the United States are associated with a significant wage premium, this premium has declined over time. Without proactive policies and targeted investment, the green transition could therefore deepen existing disparities in the labour market (OECD 2023).
This section sheds light on the issue in countries less represented in the literature, by comparing average posted wages for green and non-green vacancies in the Russian Federation, South Africa and Uruguay, focusing on three broad occupational groups at the one-digit ISCO level (ISCO 1, 7 and 9), selected to capture a range of different occupations. Figure 4.8 shows that among managers (ISCO 1), all three countries show a clear wage premium for green vacancies, particularly in the Russian Federation and Uruguay. In craft and related trades (ISCO 7), green vacancies offer higher wages only in the Russian Federation, while there are no clear differences in posted wages between green and non-green vacancies in South Africa and there is a wage premium for non-green ones in Uruguay. The most striking pattern appears in elementary occupations (ISCO 9). In South Africa, green vacancies offer substantially higher wages than non-green ones, suggesting that even lower-skilled green roles may be associated with better pay in certain contexts. In contrast, the Russian Federation and Uruguay show little difference in this group. These findings suggest that while green roles can offer higher wages, the presence and size of the premium depends on both the occupation and the broader labour market context.
-
Figure 4.8. Posted wage ratios for green and non-green vacancies in ISCO occupational groups 1, 7 and 9, by country
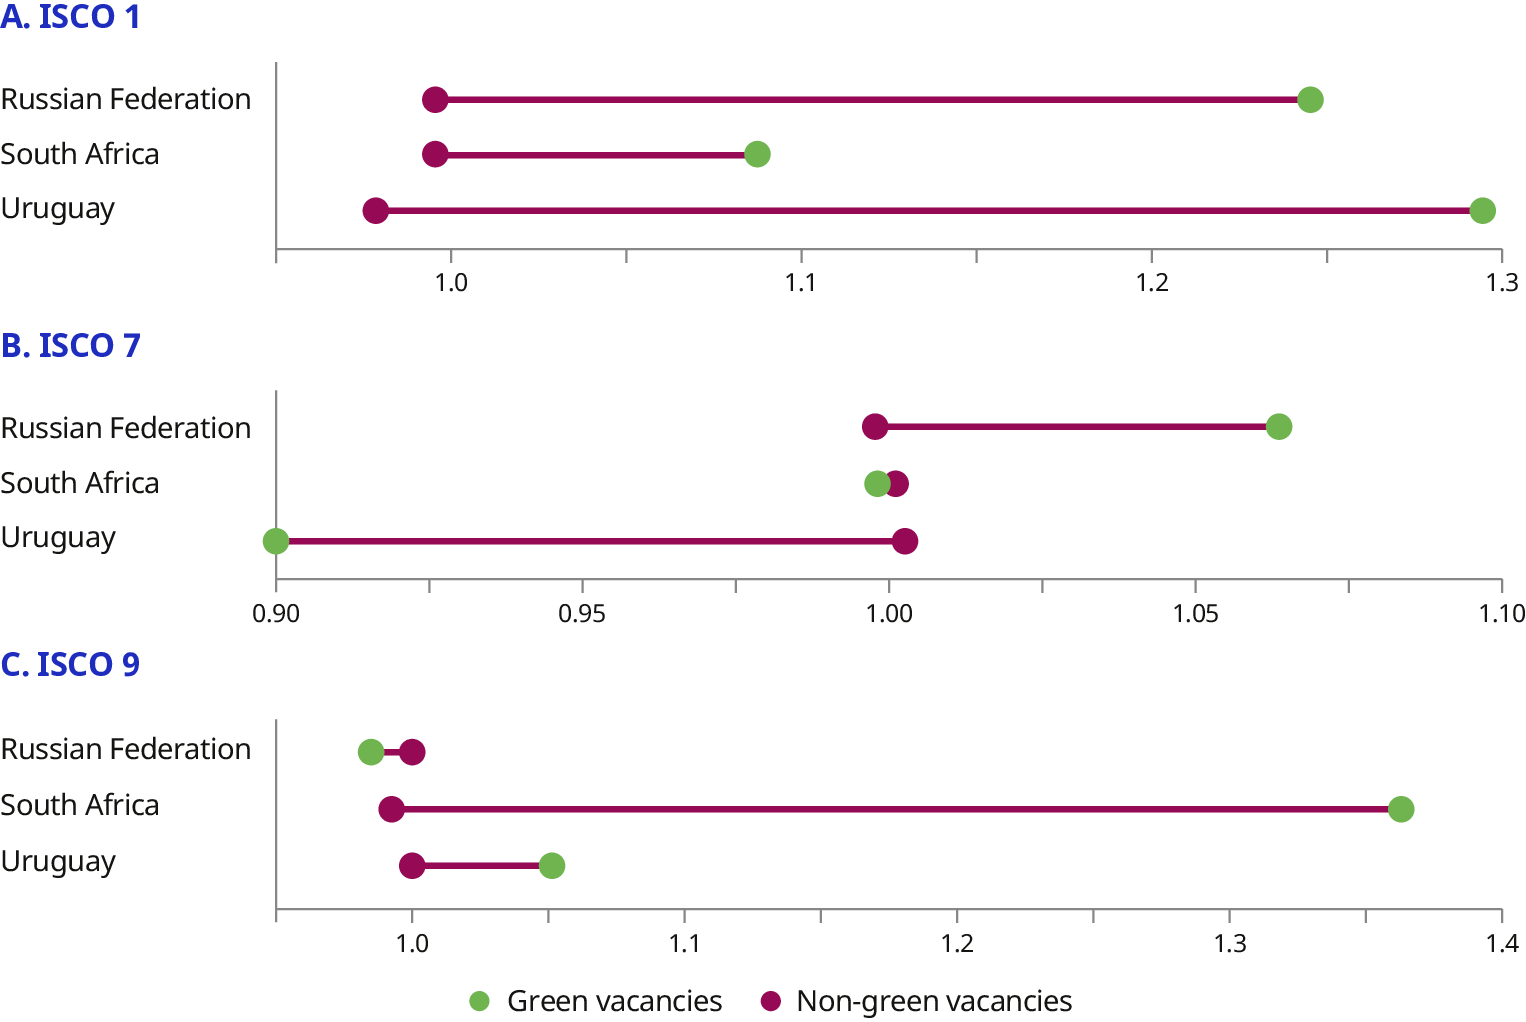
Note: Posted wage ratios are defined as the average posted wage for non-green (or green) vacancies divided by the average for all vacancies within each country–occupation cell.
Source: The analysis uses vacancy data from BuscoJobs for Uruguay (2010–23), and Adzuna for the Russian Federation (2016–21) and South Africa (2016–21). Brazil and Morocco were excluded from the analysis due to insufficient information on posted wages.
Alongside wages, green jobs and non-green jobs may differ in their various employment conditions and job characteristics. As discussed in Chapter 3, Adamczyk, Delaporte and Escudero (2025) rely on empirical literature (mainly Maestas et al. 2023; Sockin 2021) and own adaptations to develop a taxonomy to capture non-wage job characteristics in online vacancies. This taxonomy, underpinned by a keyword-based dictionary, was applied to the online vacancy data of Brazil, the Russian Federation, South Africa and Uruguay, using NLP techniques akin to the ones used for the creation of skill variables. The creation of these variables enables the exploration of differences in work attributes between green and non-green vacancies.
Figure 4.9 compares the prevalence of non-wage job attributes advertised in green and non-green vacancies within specific occupational groups, focusing on both managerial occupations (ISCO 1) and elementary ones (ISCO 9). Across countries and occupational levels, opportunities for career development consistently emerges as the most frequently advertised attribute in green vacancies, reflecting an emphasis on learning opportunities and skills enhancement. This is often accompanied by references to teamwork and a positive work environment and societal impact, suggesting that green vacancies tend to promote collaboration and a sense of purpose. While these patterns are more pronounced among managerial skilled occupations, they also extend – albeit less prominently – to elementary roles, especially in South Africa. By contrast, labour rights, social protection benefits and other job attriburtes – such as bonuses and commissions, hourly work or overtime, paid time off, job security, workplace safety and schedule flexibility – are infrequently mentioned across green vacancies, regardless of occupational level.
-
Figure 4.9. Prevalence of non-wage job attributes for green and non-green vacancies in ISCO occupational groups 1 and 9, by country
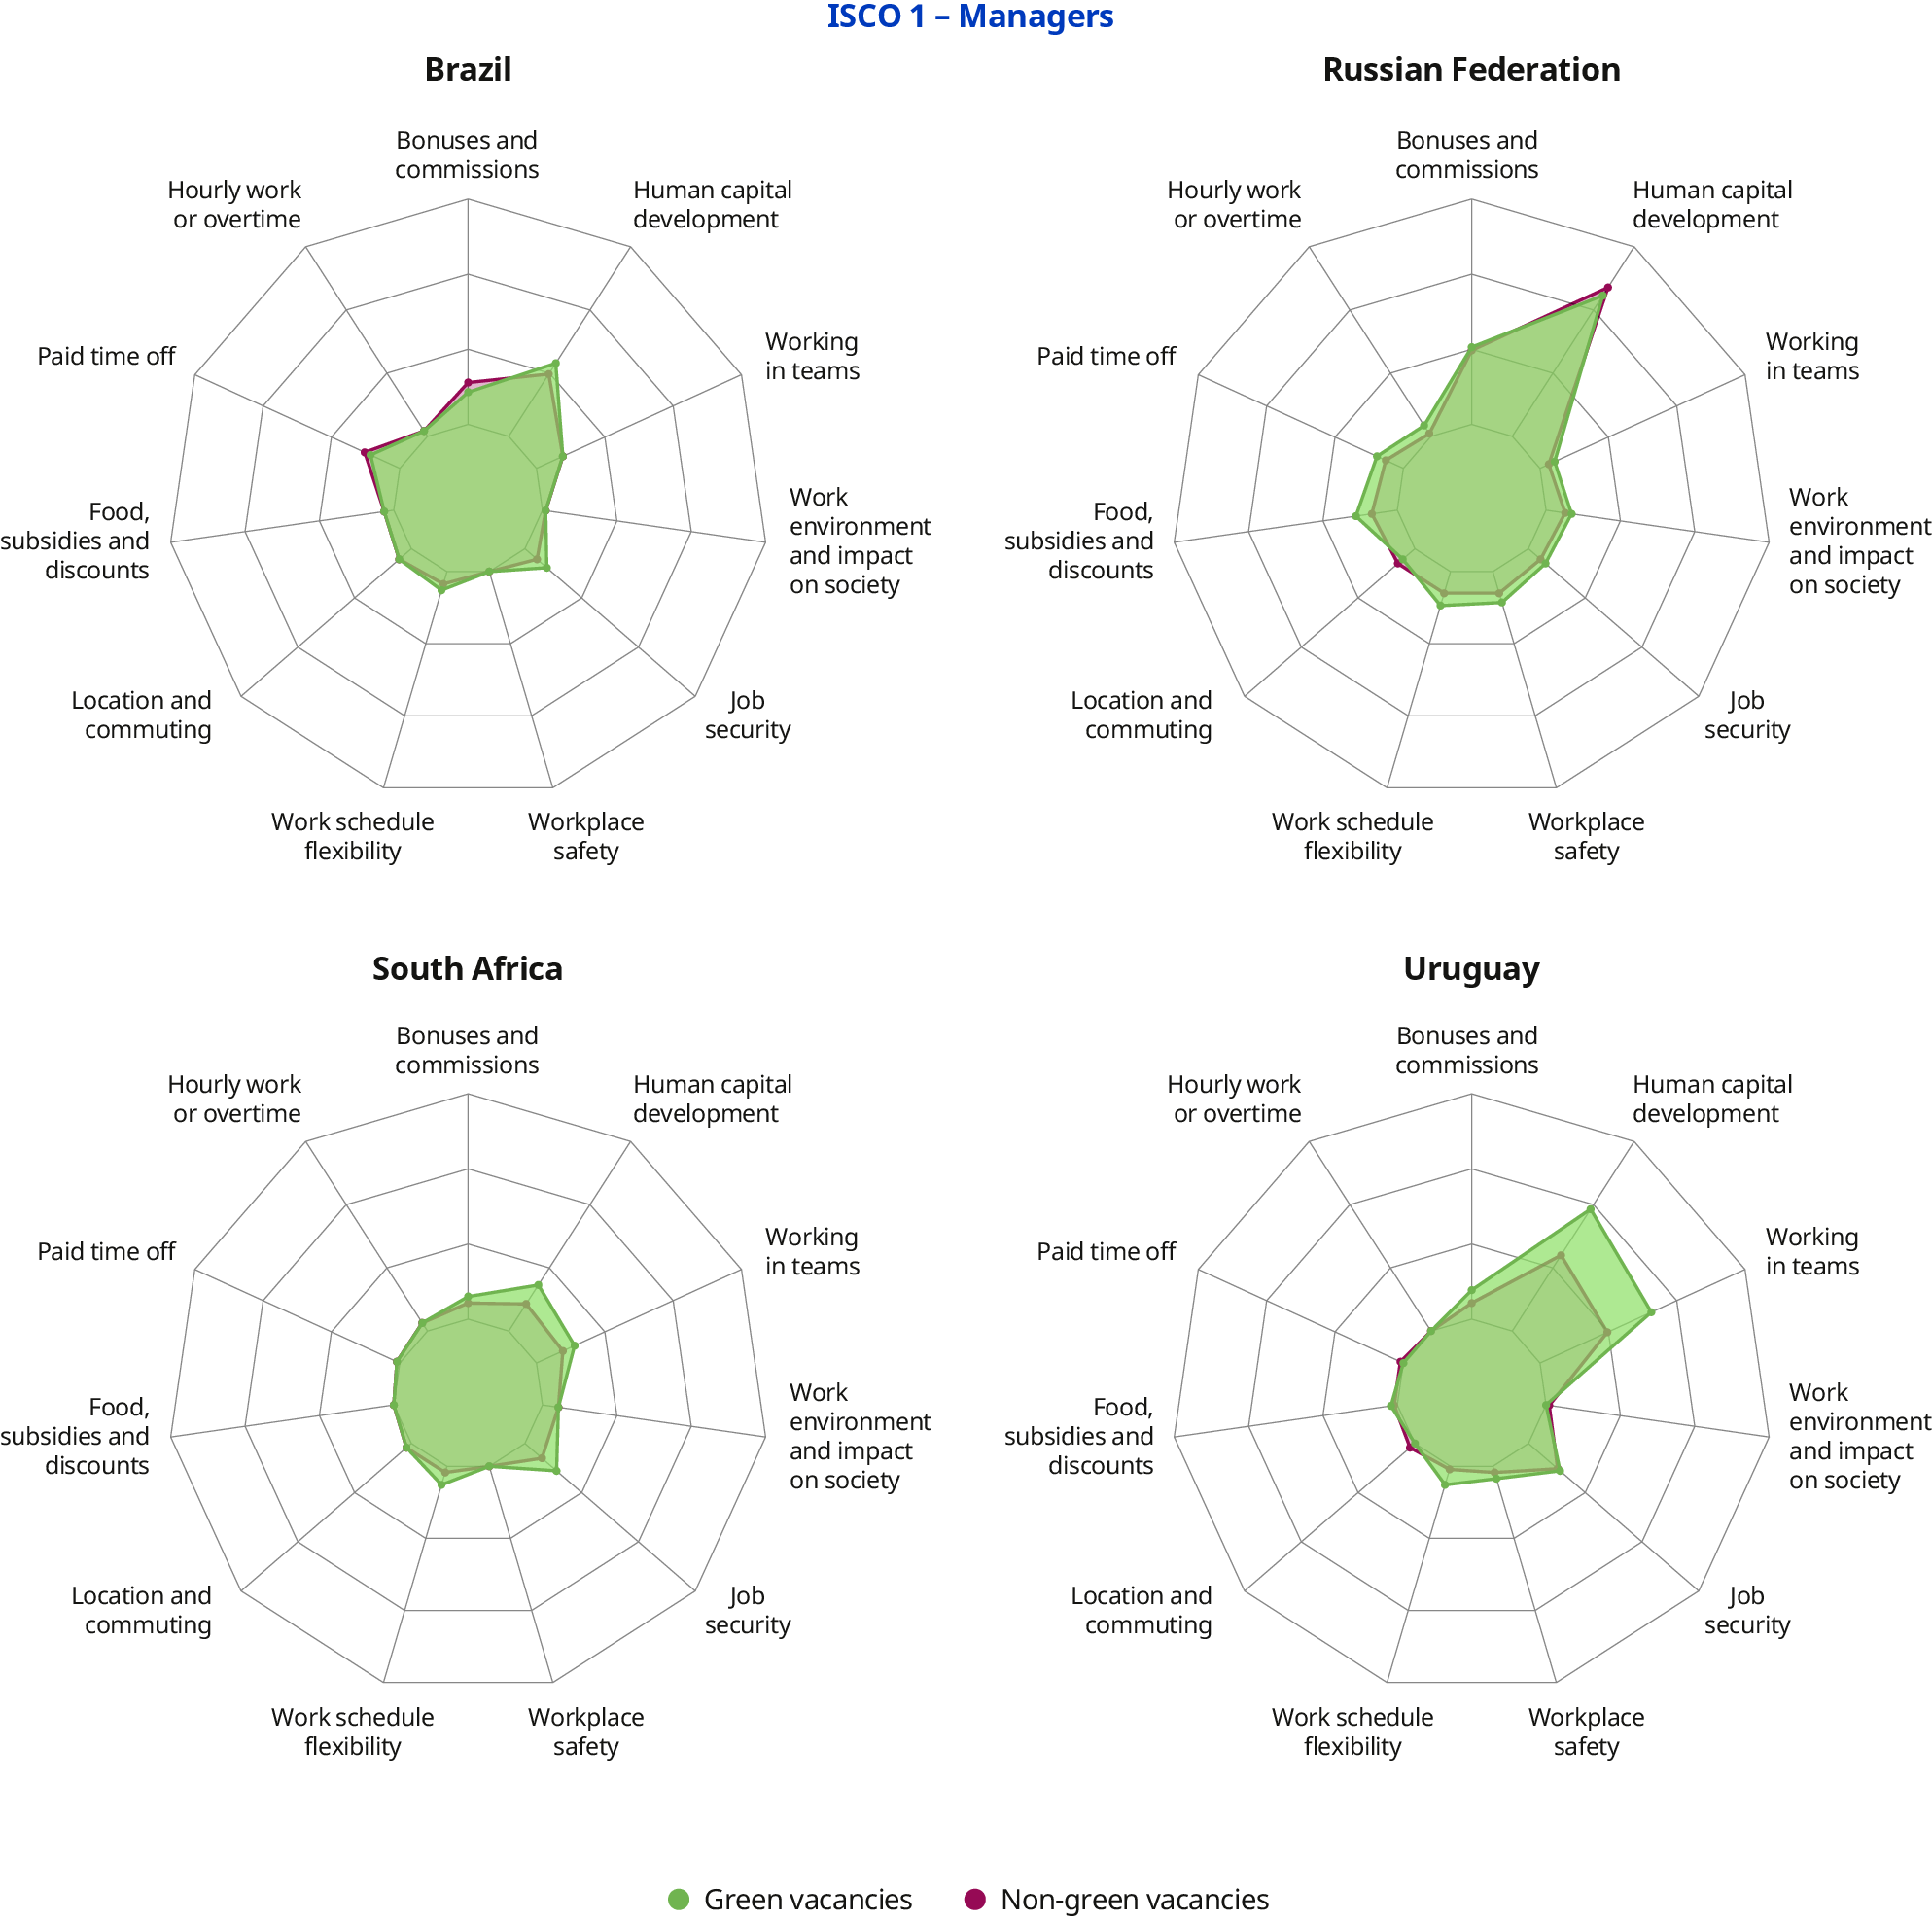
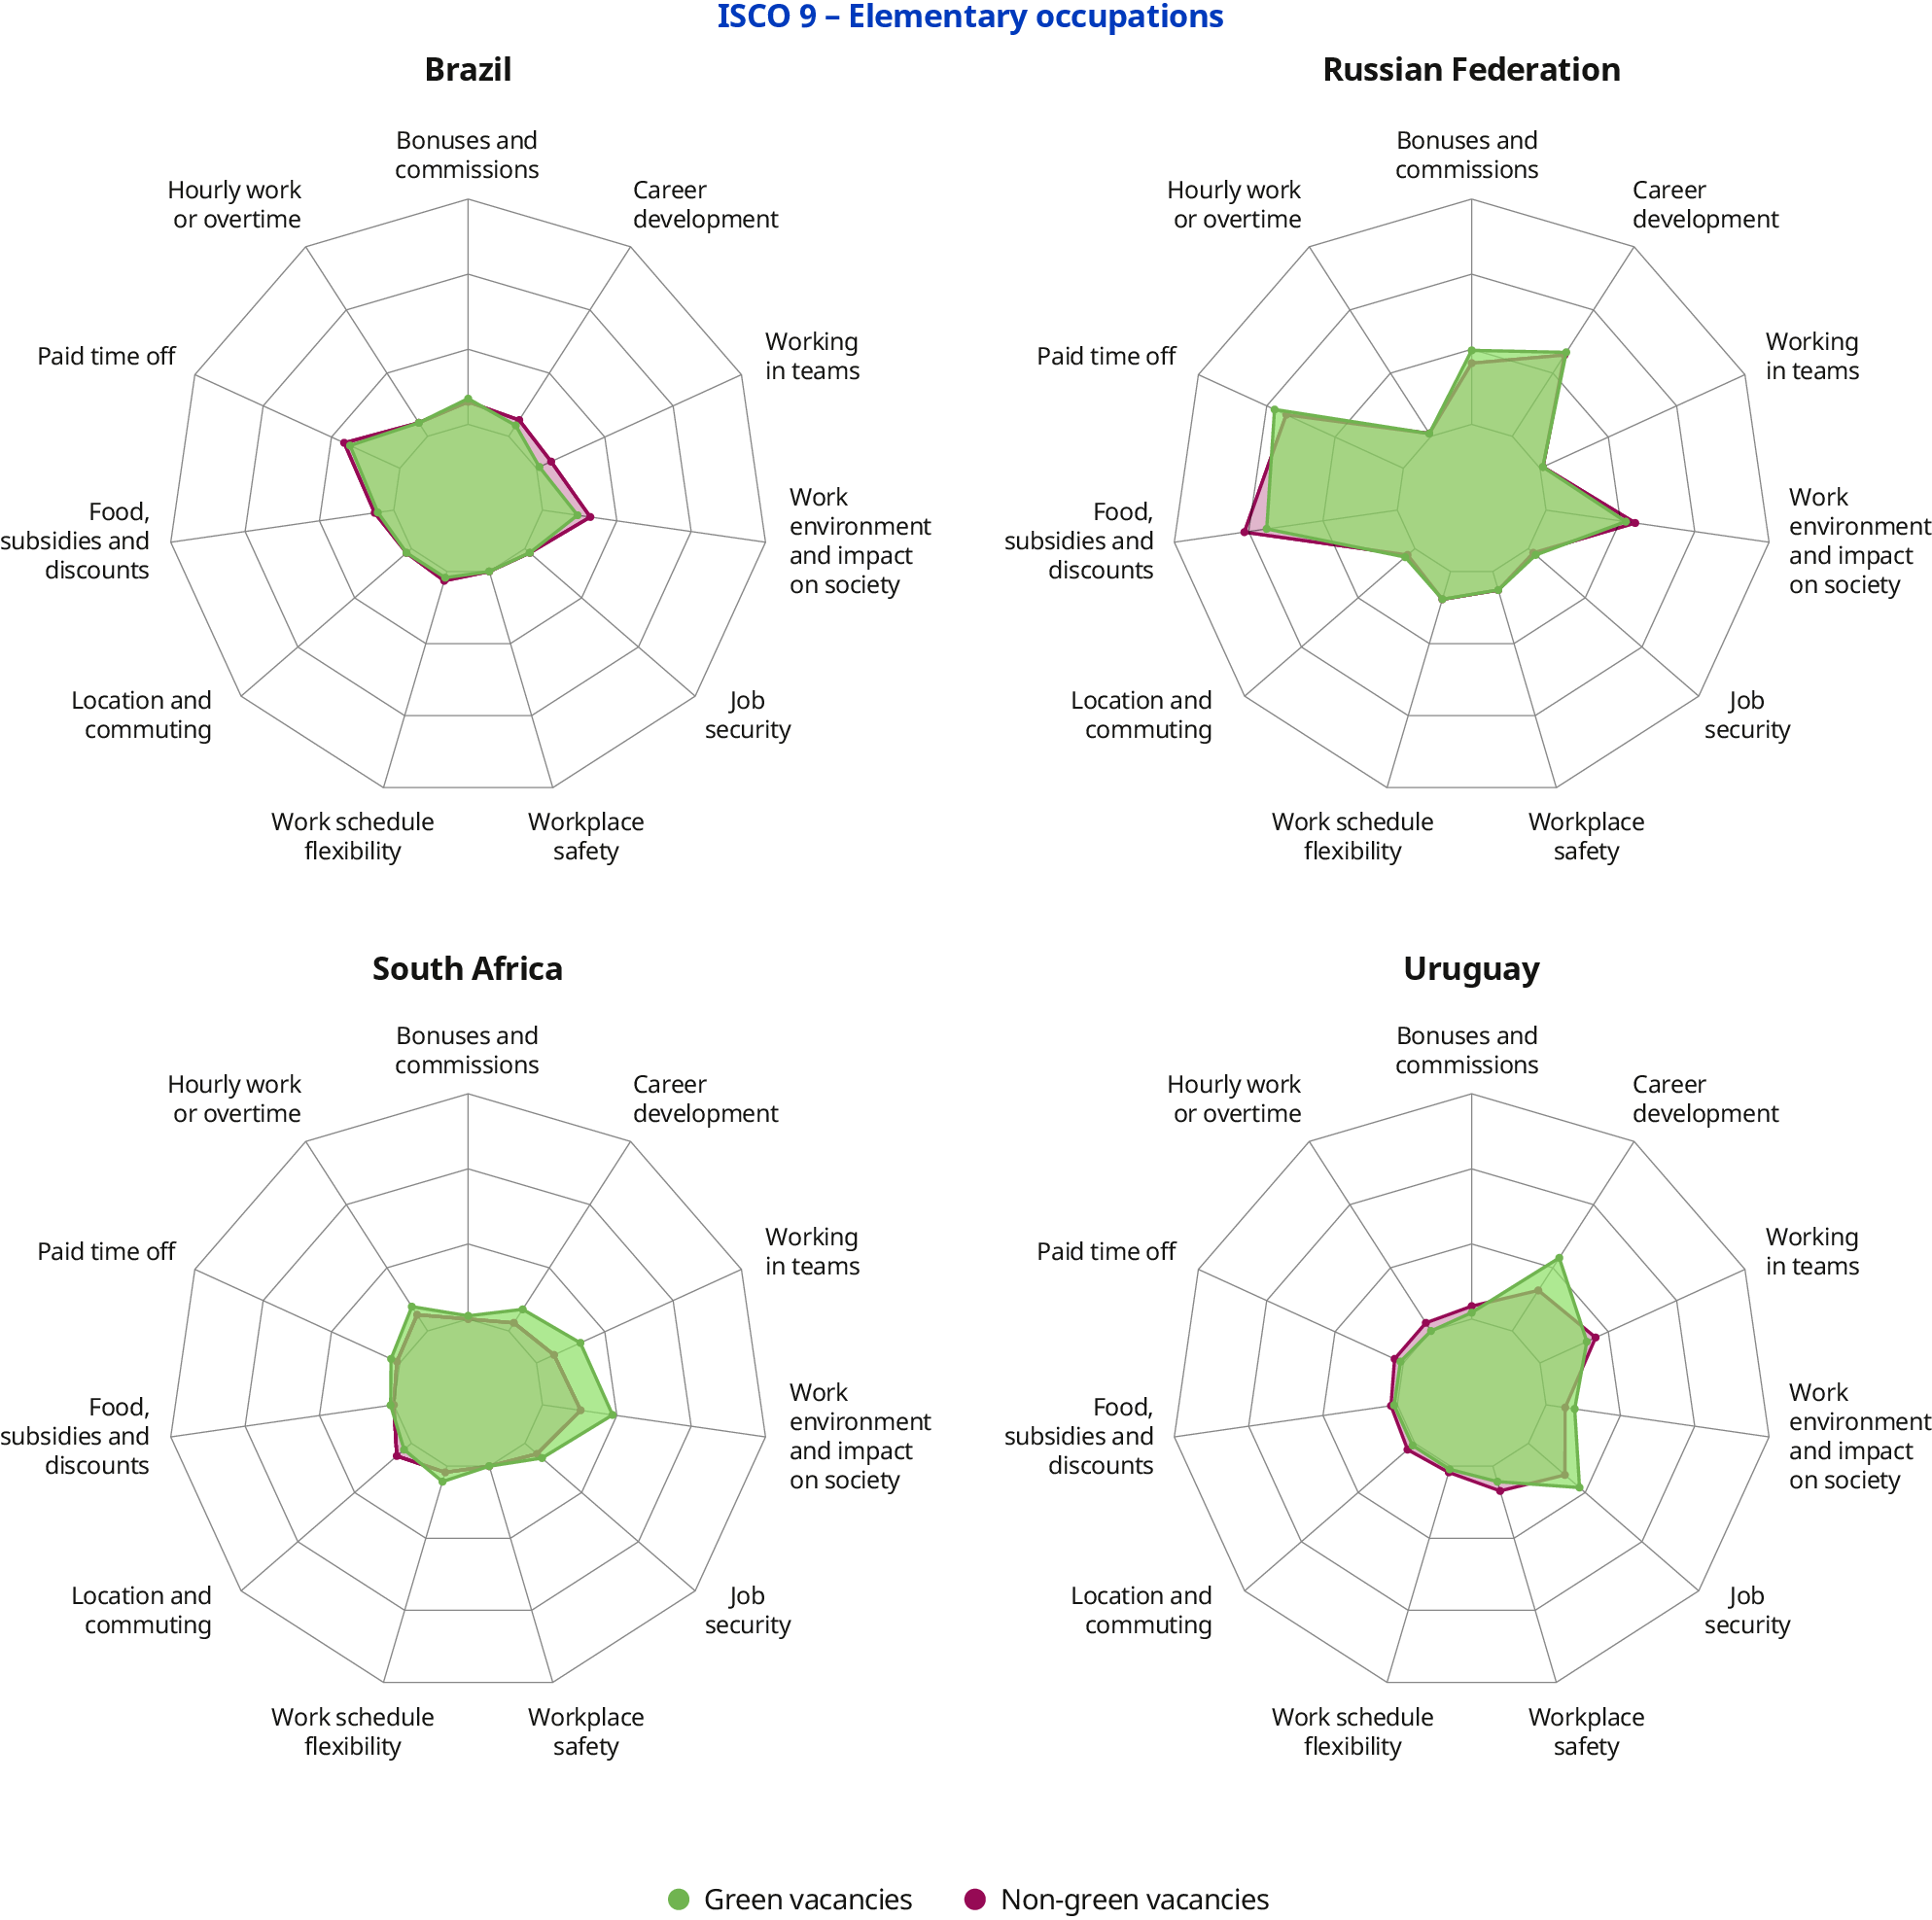
Note: The outermost ring corresponds to 70 per cent of vacancies mentioning a job attribute. Therefore, a marker further away from the centre means the given attribute is more frequently advertised.
Source: The analysis uses vacancy data from BuscoJobs for Brazil (2010–23) and Uruguay (2010–23), and Adzuna for the Russian Federation (2016–21) and South Africa (2016–21).
To conclude, the green transition is reshaping both skill demands and job characteristics in important ways. Green vacancies typically require higher skill requirements, encompassing a broad set of competencies – including technical, cognitive, socio-emotional, manual and green-specific skills, such as environmental awareness and sustainability expertise. As the transition accelerates and the share of green jobs grows, equipping workers with these skills will be crucial to ensure their adaptability and employability, and protect them from job loss. However, the development and mastering of green-specific tasks in the workplace remain gradual, underscoring the need for more proactive investment in skills policies to prepare workers for the evolving demands of a greener economy.
Moreover, green jobs, in some contexts, offer better wages and certain desirable non-wage attributes, such as opportunities for career development and teamwork. However, these advantages are not uniform across countries or occupations. While green vacancies yield notable wage premiums in some occupations, others show limited or no difference compared to non-green ones. Importantly, countries with lower initial shares of green jobs are not yet benefiting equally from the transition and show little indication of catching up (Adamczyk et al., forthcoming; OECD 2023).
These patterns underscore the need for targeted skills policies that go beyond the promotion of green skills alone. Supporting the development of versatile, transferable competencies is essential to ensure broader access to quality green jobs, particularly in low- and middle-income countries. Crucially, this effort must be inclusive – ensuring that all groups, especially those at risk of being left behind, have equitable opportunities to acquire these skills. Achieving this requires lifelong learning policies that provide flexible, continuous opportunities for reskilling and upskilling throughout workers’ lives, enabling adaptation as green technologies and labour market needs evolve. Thus, the green transformation can advance both environmental goals and inclusive, sustainable labour market outcomes. As the next section will demonstrate, similar conclusions emerge in the context of the digital transformation.
4.4. Skills for adaptability in the digital transformation
4.4.1. Digital transformation and its impact on labour markets
The last few decades have also witnessed a rapid expansion in digital technologies, including AI, machine learning, robotics, autonomous systems and the Internet of Things. The extent to which countries, industries and occupations are exposed to and adopt these technologies significantly influences their impacts on employment and skills. Greater exposure and adoption can drive job creation in technology-intensive sectors while transforming or even displacing jobs in others. Slower adoption, particularly in low- and middle-income countries, may limit opportunities but also shield these countries from potential negative impacts.
Exposure to digital technologies
To assess global exposure to emerging digital technologies across countries, various measures of exposure have been developed in the literature. These measures typically aim to capture the degree to which new technologies are relevant to specific industries or occupations. Some approaches rely on survey data containing detailed information on tasks (Arntz, Gregory and Zierahn 2016; Gmyrek, Winkler and Garganta 2024), while others use patent data to identify how technologies are integrated into production processes or influence the tasks required for certain jobs (Dechezleprêtre et al. 2021; Mann and Püttmann 2023; Prytkova et al. 2024). Importantly, the effects of digital technologies on employment outcomes will depend on the level of exposure (and ultimate adoption), which varies across countries and income groups, as well as on complementary factors such as the workforce skills composition, organizational practices, institutions and regulations that shape how these technologies translate into real impacts.
To illustrate the cross-country variation in digital technology exposure, figure 4.10 displays average exposure scores using the TechXposure measure (Prytkova et al. 2024). This measure captures exposure to 40 digital technologies70 that have emerged over the past decade, based on NLP methods – such as sentence transformers – applied to patent data. Exposure reflects the relevance of the 40 technologies to an industry, either through integration into production processes or by enhancing the industry’s output. These relevance scores were then interacted with employment shares by industry at the first subnational administrative level, using harmonized labour force and household surveys from ILOSTAT for years close to 2010. This approach enables comparison of average exposure to emerging digital technologies across income groups and regions (Delaporte, Escudero and Petit, forthcoming). To facilitate comparison, subnational regions are grouped into quartiles based on their exposure – ranging from low to high exposure.
-
Figure 4.10. Global overall exposure to emerging digital technologies at the first subnational administrative level
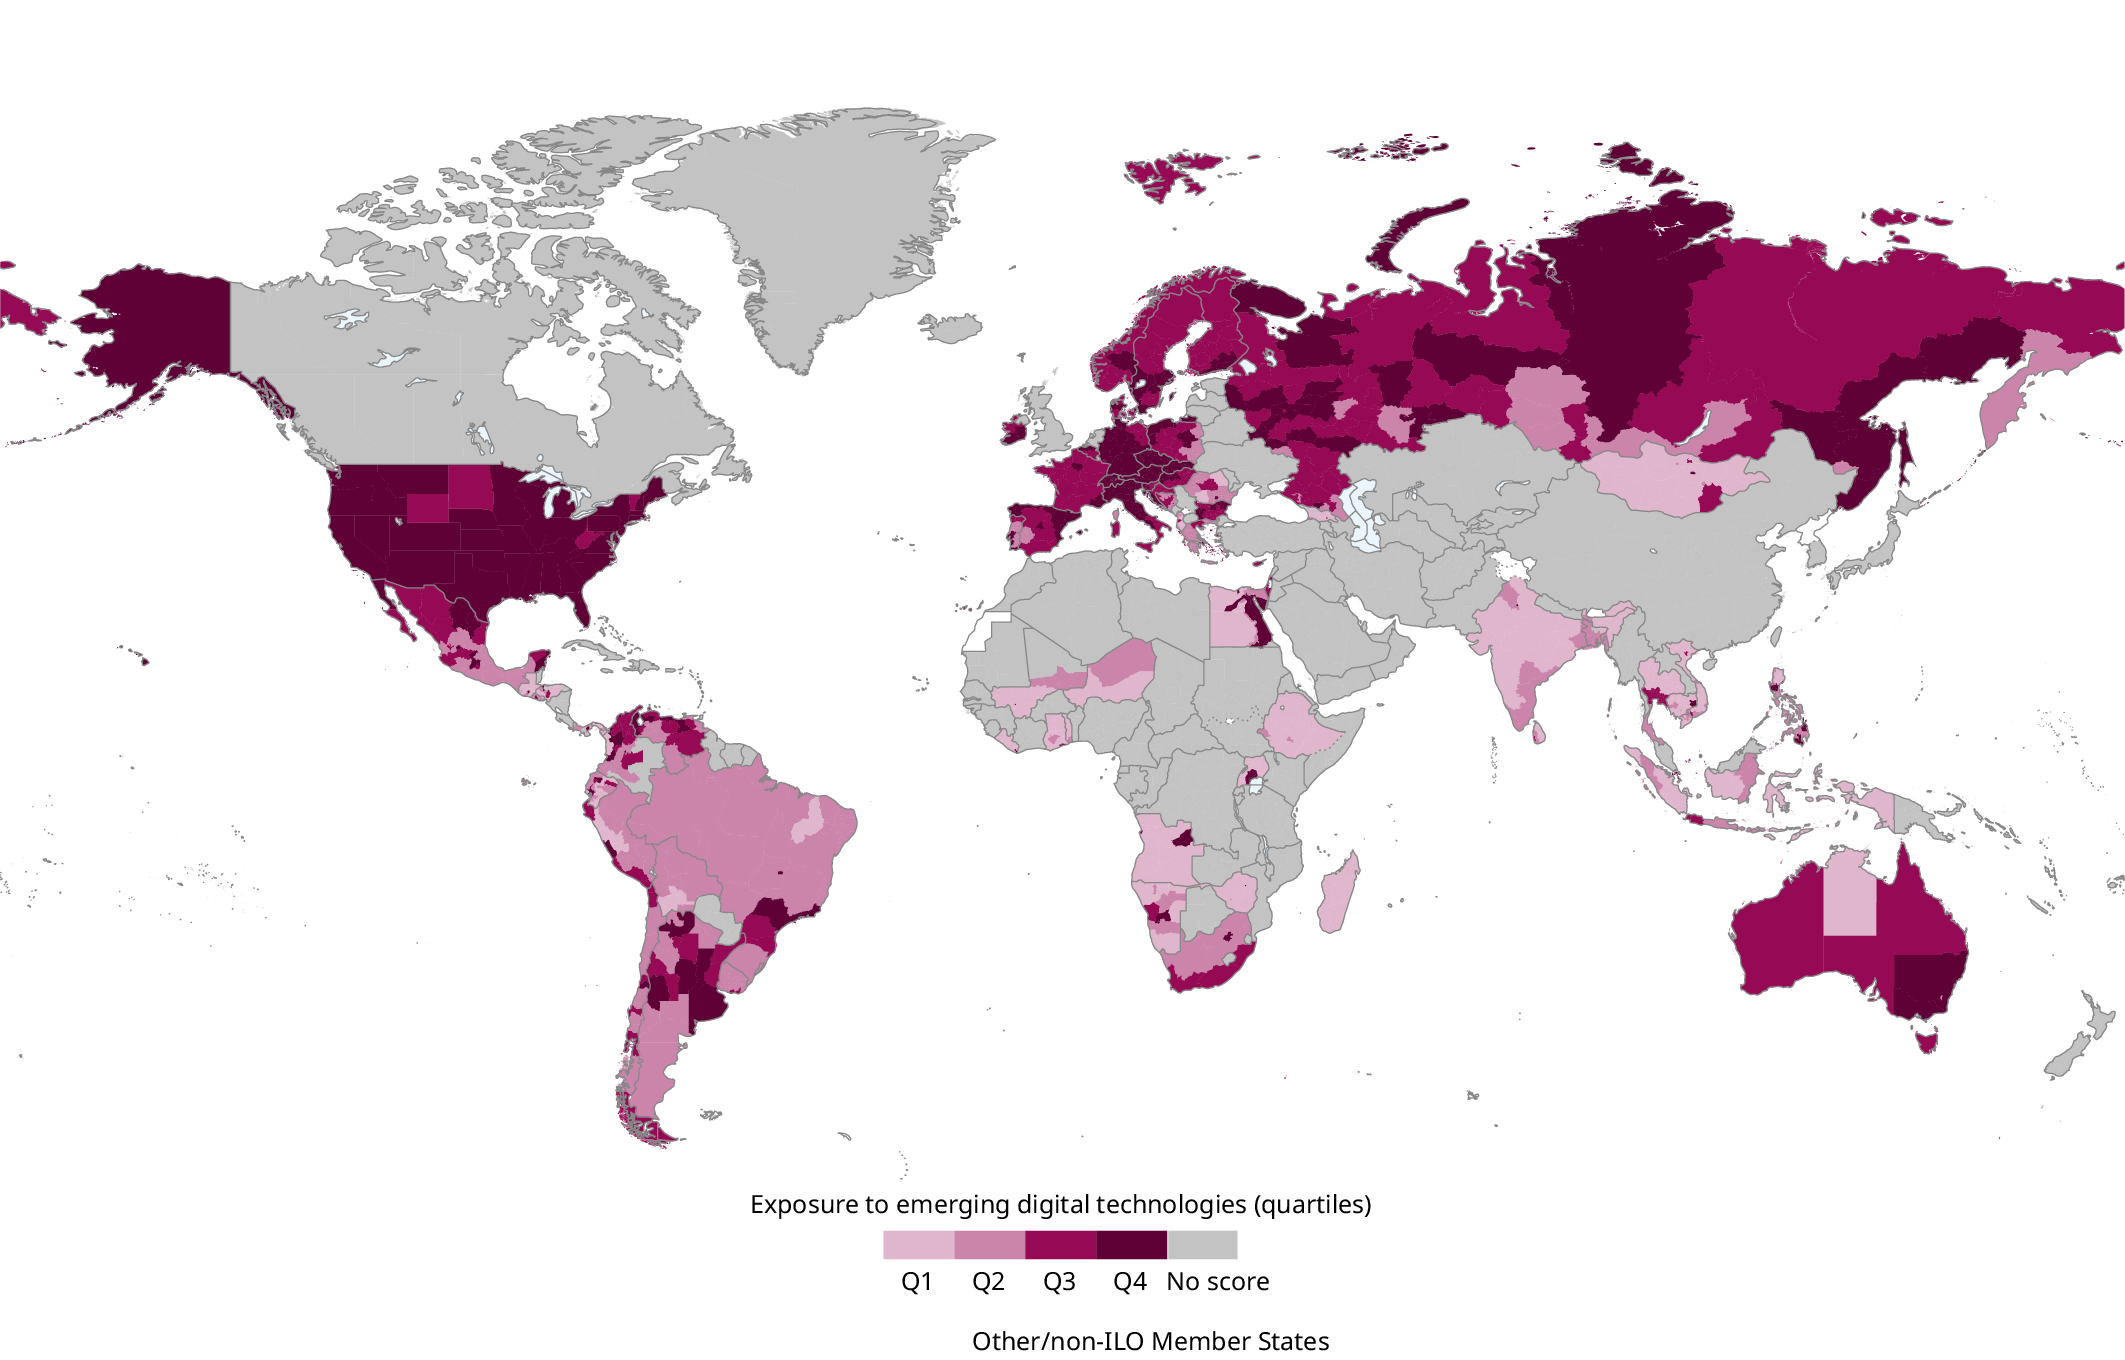
Disclaimer: Boundaries shown do not imply endorsement or acceptance by the ILO. See full disclaimer: ilo.org/disclaimer.
Note: Data at the first subnational administrative level were available for 70 countries (9 low-income countries, 16 lower-middle-income countries, 19 upper-middle-income countries and 26 high-income countries).
Source: Delaporte, Escudero and Petit (forthcoming).
High-exposure regions (Q4) are concentrated in parts of Northern America (notably the United States and parts of Mexico), Europe (including much of Northern, Western and parts of Eastern Europe), Australia and some parts of Southern America (notably regions in Argentina and Chile). Several areas in Western Asia and parts of Southern Africa also register high exposure. This reflects the 2010 industry composition of these subnational regions, which tended to specialize in sectors more exposed to emerging digital technologies. For example, Bangkok’s employment was dominated by wholesale and retail trade alongside a sizeable manufacturing base, while parts of the United States concentrated AI-intensive logistics and technology services. In contrast, lower-exposure areas (Q1 and Q2) are concentrated in sub-Saharan Africa, Southern and South-Eastern Asia, Central America and parts of Eastern Europe. Many of these areas likely face constraints, such as limited digital infrastructure (Gmyrek, Winkler and Garganta 2024), lower technological adoption rates and lower investment in emerging technologies.
While examining the average exposure to digital technologies across countries is informative, it is important to distinguish between exposure and adoption of emerging digital technologies, as adoption levels may differ widely across countries. Importantly, exposure and adoption are positively correlated (see box 4.6). Even when adoption progresses more slowly than exposure, the growing diffusion and influence of digital technologies are already fundamentally changing the world of work – reshaping traditional job roles and altering the skills required to perform them. Digitalization is also changing the structure of entire industries, from manufacturing and logistics to finance and healthcare. While there is general agreement that technological change has profound implications for employment, the scale and direction of these effects remain subjects of ongoing debate, as it is discussed next.
Global exposure to digital technologies refers to the extent to which individuals, firms or economies are affected by digital innovations. It is typically measured through indicators like internet penetration, digital infrastructure availability and access to digital platforms. Exposure is therefore closely tied to the potential for adopting and utilizing digital technologies but does not guarantee their widespread use.
Global adoption of digital technologies refers to the actual integration of digital tools into economic activities, measured through metrics like business automation rates and ICT usage in the workplace. Adoption depends on factors like skilled labour, infrastructure and supportive policies.
A gap between exposure and adoption often exists, especially in low- and middle-income countries, where exposure may be high but adoption is limited due to a lack of resources, sufficient infrastructure (Gmyrek, Winkler and Garganta 2024), a skilled workforce or regulatory support. By contrast, high-income countries generally see a smaller gap due to better access to these complementary assets.
Exposure and adoption of digital technologies are nevertheless often positively correlated. On average, as exposure increases, adoption increases proportionally (Saka, Eichengreen and Aksoy 2022). As expected, high-income countries tend to exhibit high exposure and high adoption, while lower-income countries display lower exposure and lower adoption rates.
The impacts of technological advancements on labour markets
Technological change – through ICT, automation, robotics and AI – has profoundly reshaped labour markets, altering job structures and skill demand across countries and sectors. Earlier trends (in the late twentieth century) were driven by what academics term skill-biased technical change, which favoured high-skilled workers and displaced low-skilled ones (Acemoglu 1998; Juhn, Murphy and Pierce 1993; Perugini and Pompei 2009).
As technology progressed, the literature identified a shift toward routine-biased technical change, where automation reduced demand for middle-skill routine jobs while boosting demand for both high-skill cognitive and low-skill manual work (Acemoglu and Autor 2011; Autor, Levy and Murnane 2003). This led to the well-known phenomenon of job polarization.
More recent research shows that effects of specific technologies vary by context. In high-income countries, industrial robots have displaced low-skilled manufacturing jobs (Acemoglu and Restrepo 2020) but complemented high-skilled roles in Europe (Dauth et al. 2021; Humlum 2019). In low- and middle-income countries, slower robot adoption has tempered direct employment impacts (de Vries et al. 2020). Meanwhile, ICT adoption has generally favoured high-skilled, non-routine cognitive roles (Akerman, Gaarder and Mogstad 2015; Caldarola et al. 2022; Goos, Manning and Salomons 2009), expanding formal employment in African service sectors (Hjort and Poulsen 2019) and restructuring labour demand in Brazil and Chile, for instance (Almeida, Corseuil and Poole 2017; Almeida, Fernandes and Viollaz 2020).
Automation technologies have also driven complex labour markets dynamics, particularly in high-income countries. In the United States, automation in the service sector has tended to boost employment overall (Mann and Püttmann 2023). By contrast, automation in manufacturing has been shown to reduce employment, as documented in the United States (Acemoglu and Restrepo 2019) and in OECD countries (Arntz, Gregory and Zierahn 2016). These effects have disproportionately impacted low-qualified workers, who have faced higher risks of job loss due to automation than their high-skilled counterparts (Arntz, Gregory and Zierahn 2016).
Lastly, the emergence of AI marks another significant shift (Acemoglu et al. 2022; Carbonero et al. 2023). While concerns have grown that AI could increasingly affect tasks traditionally performed by both high-skilled workers and entry-level workers, current evidence suggests that, rather than fully replacing jobs, AI tends to restructure tasks within jobs (Gmyrek, Berg and Bescond 2023). This reorganization requires new skill mixes, which may reduce hiring for certain non-AI roles (Acemoglu et al. 2022).
These impacts of technological change are not uniform: high-income countries have experienced faster job displacement and polarization, while slower adoption in low- and middle-income countries – due to differences in industrial structure, workforce skills and digital access – has delayed both risks and benefits. Recent evidence also shows that impacts vary widely by the type of technology (Prytkova et al. 2024). Although the literature provides valuable insights into the labour market impacts of specific technologies – particularly in high-income countries – it often focuses on narrow sets of technologies (for example, robots or AI), limited geographies or specific sectors. Much less is known about the broader employment impacts of exposure to emerging digital technologies across diverse economic contexts, especially in low- and middle-income countries. To fill this gap, this chapter uses the TechXposure index and relies on an instrumental-variable shift–share approach to estimate the causal effect of digital technology exposure on employment outcomes using a large, globally representative dataset (see Delaporte, Escudero and Petit (forthcoming) for more details about the methodology).
The findings, summarized in table 4.2, suggest that greater exposure to emerging digital technologies is, on average, associated with a positive impact on employment-to-population ratios71 over the period 2014 to 2019.72 However, the effects are not uniform across country income groups or regions. First, countries differ in their average level of exposure. For example, low-income countries show the lowest average exposure to emerging digital technologies (0.50), while high-income countries exhibit the highest (0.76). Second, there is variation in exposure across subnational regions within the same group – for example, within low-income countries or within sub-Saharan Africa. To account for differences in baseline exposure levels across countries, the analysis focuses on relative disparities between subnational regions within each group. Specifically, the effects of digital technology exposure on subnational employment are assessed relative to the within-group standard deviation.
Results show that low-income countries experienced the largest employment gains (+1.39 percentage points (pp) during the five-year period for one within-group standard deviation change in digital exposure), followed by high-income and upper-middle-income countries. In contrast, lower-middle-income economies recorded the weakest growth. This can be explained by the fact that, in low-income countries, digital transformation is often at an early diffusion stage and concentrated in complementary, labour-enhancing technologies (for example, mobile services, e-commerce enablement, payment platforms and logistics digitization). At the subregional level, sub-Saharan Africa saw the most substantial gains, with employment-to-population ratios rising by 1.17 pp during the five years. Northern Africa also experienced large increases (+0.51 pp), followed by Latin America and the Caribbean (+0.46 pp), Northern, Southern and Western Europe (+0.45 pp) and Eastern Europe (+0.44 pp). Northern America, the Pacific Islands, and Central and Western Asia saw moderate improvements (+0.39, +0.36 and +0.24 pp, respectively). By contrast, the Arab States saw negligible change (+0.09 pp), while some parts of Asia experienced declines: employment-to-population ratios fell in Eastern Asia (–0.55 pp) and South-Eastern Asia (–0.35 pp). These results highlight the heterogeneous nature of digitalization’s employment impacts: although the net effect is positive, instances of job loss and displacement remain evident in several contexts.
When further disaggregating by sex, age and educational level within income groups, several distinct patterns emerge. In low-income countries, digital exposure had strong and inclusive effects: employment-to-population ratios rose by 0.86 pp for women and 0.53 pp for men, with substantial gains also observed among youth (aged 15 to 24) and prime-age workers (aged 25 to 54). Notably, individuals with low education levels benefited the most (+1.63 pp), in contrast with a decline among the middle-educated ones (–0.26 pp). This suggests that, in these contexts, digitalization may be associated with the expansion of lower-skilled digital work, rather than high-skill technology-intensive employment. In lower-middle-income countries, effects were negligible across all groups. By contrast, upper-middle- and high-income countries displayed moderate and more evenly distributed gains, with increases in employment-to-population ratios among men as well as both low- and high-educated workers, suggesting labour market polarization.
At the subregional level, some regions show broadly inclusive employment gains from digital exposure. In sub-Saharan Africa, positive effects were recorded across sex, age and education groups, with stronger gains for women (+0.76 pp) and low-educated workers (+1.52 pp). Northern Africa also exhibited inclusive trends, with notable increases for low-educated individuals (+0.52 pp) and relatively balanced impacts across age groups. Europe followed a somewhat different pattern, where both low- and high-educated workers benefited to the detriment of middle-educated workers. Other regions show more concentrated or uneven effects. In Northern America, gains were moderate but skewed toward women (+0.32 pp), prime-age workers (+0.38 pp) and high-educated workers (+0.62 pp). In Latin America and the Caribbean, the benefits were largely captured by high-educated men. The Arab States registered negligible employment gains but these were concentrated mostly among men, prime-age workers and those with high education – suggesting a less inclusive pattern. Lastly, Eastern and South-Eastern Asia saw declines in employment, particularly among prime-age and older workers and those with low or medium education.
Taken together, these findings suggest that while digitalization can generate net employment gains, these benefits are unevenly distributed across regions and groups, and they may mask job losses for specific segments of the workforce. Evidence also indicates that aggregate outcomes can conceal differing effects across types of digital technologies.
-
Table 4.2. Estimated effects of exposure to emerging digital technologies on employment at the first subnational administrative level, 2014–19, by country income group and subregion (percentage point)
|
|
E |
SD |
All |
Women |
Men |
Workers aged 15 to 24 |
Workers aged 25 to 54 |
Workers aged 55 and above |
Low education level |
Middle education level |
High education level |
|||||||||
|---|---|---|---|---|---|---|---|---|---|---|---|---|---|---|---|---|---|---|---|---|
|
Exposure (standardized) |
|
|
1.16 |
*** |
0.70 |
*** |
0.46 |
*** |
0.22 |
*** |
0.73 |
*** |
0.20 |
*** |
1.23 |
*** |
–0.09 |
|
–0.05 |
|
|
Income group |
||||||||||||||||||||
|
Low-income |
0.50 |
0.39 |
1.39 |
*** |
0.86 |
*** |
0.53 |
*** |
0.43 |
*** |
0.76 |
*** |
0.18 |
*** |
1.63 |
*** |
–0.26 |
*** |
0.02 |
|
|
Lower-middle-income |
0.53 |
0.60 |
0.39 |
*** |
0.27 |
*** |
0.12 |
** |
0.07 |
* |
0.30 |
*** |
0.04 |
|
0.48 |
*** |
0.08 |
|
–0.19 |
*** |
|
Upper-middle-income |
0.69 |
0.42 |
0.65 |
*** |
0.29 |
*** |
0.35 |
*** |
–0.01 |
|
0.39 |
*** |
0.27 |
*** |
0.39 |
*** |
–0.19 |
*** |
0.39 |
*** |
|
High-income |
0.76 |
0.43 |
0.76 |
*** |
0.25 |
*** |
0.51 |
*** |
0.17 |
*** |
0.07 |
|
0.08 |
|
0.36 |
*** |
–0.68 |
*** |
0.61 |
*** |
|
ILO subregion |
||||||||||||||||||||
|
Northern Africa |
0.64 |
0.13 |
0.51 |
*** |
0.38 |
*** |
0.13 |
*** |
0.02 |
** |
0.38 |
*** |
0.12 |
*** |
0.52 |
*** |
0.39 |
*** |
–0.29 |
*** |
|
Sub-Saharan Africa |
0.51 |
0.46 |
1.17 |
*** |
0.76 |
*** |
0.41 |
*** |
0.36 |
*** |
0.56 |
*** |
0.25 |
*** |
1.52 |
*** |
–0.21 |
*** |
–0.09 |
|
|
Latin America and the Caribbean |
0.67 |
0.35 |
0.46 |
*** |
0.09 |
*** |
0.37 |
*** |
0.15 |
*** |
0.06 |
|
0.26 |
*** |
0.06 |
|
–0.10 |
0.46 |
*** |
|
|
Northern America |
0.82 |
0.23 |
0.39 |
*** |
0.32 |
*** |
0.07 |
|
0.12 |
*** |
0.38 |
*** |
0.03 |
|
0.06 |
|
–0.16 |
|
0.62 |
*** |
|
Arab States |
0.67 |
0.01 |
0.09 |
*** |
0.01 |
0.08 |
*** |
0.01 |
* |
0.07 |
*** |
0.01 |
|
0.01 |
|
0.02 |
|
0.07 |
*** |
|
|
Central and Western Asia |
0.66 |
0.17 |
0.24 |
*** |
0.08 |
*** |
0.17 |
*** |
0.14 |
*** |
0.26 |
*** |
–0.18 |
*** |
0.04 |
0.37 |
*** |
–0.20 |
*** |
|
|
Eastern Asia |
0.50 |
0.19 |
–0.55 |
*** |
–0.27 |
*** |
–0.29 |
*** |
0.14 |
*** |
–0.42 |
*** |
–0.24 |
*** |
0.39 |
*** |
–0.80 |
*** |
–0.03 |
|
|
Southern Asia |
0.55 |
0.24 |
0.39 |
*** |
0.20 |
*** |
0.19 |
*** |
0.04 |
** |
0.22 |
*** |
0.14 |
*** |
0.44 |
*** |
–0.02 |
|
–0.04 |
|
|
South-Eastern Asia |
0.51 |
0.44 |
–0.35 |
*** |
–0.14 |
*** |
–0.22 |
*** |
–0.03 |
|
–0.01 |
|
–0.31 |
*** |
–0.40 |
*** |
–0.11 |
** |
0.03 |
|
|
Pacific Islands |
0.69 |
0.10 |
0.36 |
*** |
–0.02 |
0.38 |
*** |
–0.13 |
*** |
0.53 |
*** |
–0.07 |
*** |
0.12 |
0.20 |
* |
0.09 |
|
||
|
Eastern Europe |
0.75 |
0.26 |
0.44 |
*** |
0.10 |
** |
0.34 |
*** |
0.04 |
–0.11 |
*** |
0.17 |
*** |
0.38 |
*** |
–0.53 |
*** |
0.24 |
*** |
|
|
Northern, Southern and Western Europe |
0.76 |
0.37 |
0.45 |
*** |
0.34 |
*** |
0.11 |
** |
0.27 |
*** |
0.24 |
*** |
0.07 |
** |
0.24 |
** |
–0.30 |
** |
0.59 |
*** |
▪ 1.33 to 1.63 ▪ 1.00 to 1.32 ▪ 0.67 to 0.99 ▪ 0.34 to 0.66 ▪ 0.01 to 0.33 ▫ 0.00 to 0.00 ▪ –0.01 to –0.33 ▪ –0.34 to –0.66 ▪ –0.67 to –0.99
Key: E = exposure; SD = standard deviation; * = significant at the 10 per cent level, ** = significant at the 5 per cent level; *** = significant at the 1 per cent level.
Note: The coefficients reflect the impact of exposure to 40 emerging technologies at the subnational level – constructed using a shift–share approach – on changes in the employment-to-population ratio over the period 2014 to 2019. Control variables include country-fixed effects and demographic characteristics from 2010, including the logarithm of the working-age population, share of females, proportion of the population aged over 55, and the shares with medium and high education. The sum of exposure shares is also included as covariate. Regressions are weighted by 2010 population. For the list of countries included in the analysis, see Delaporte, Escudero and Petit (forthcoming).
Source: Delaporte, Escudero and Petit (forthcoming).
4.4.2. Skills as a driver of resilience
Digitalization is not only reshaping labour markets and altering the demand for skills – it is also shaped by the skills available within the workforce. As jobs evolve and new tasks emerge, workers and firms must adapt their competencies accordingly. At the same time, equipping workers with the right mix of skills can influence how they and their regions experience digital change – either by unlocking new opportunities or by reducing the risk of exclusion. Identifying the specific skills that enable workers to navigate these changing conditions is therefore essential. This is especially important for helping displaced workers transition into emerging sectors and roles. Foundational skills, adaptability and a commitment to lifelong learning have proven crucial in recent crises and remain essential to building resilient labour markets (OECD et al. 2024). Moreover, certain skill combinations can substantially improve employment outcomes (see Chapter 3).
To assess how skills mediate the effects of digital exposure, the analysis examines how the impact of digital exposure varies depending on the baseline skills composition of occupations at the first subnational administrative level. Skill composition is calculated by combining the skill intensity of each occupation (that is, the relative importance of each skill within an occupation) with the occupational employment shares in each subnational unit. The skill intensity of occupations is derived from online job vacancy data in Brazil, the Russian Federation, South Africa and Uruguay. These skills measures are constructed using the comprehensive skills approach introduced in Chapter 3.
The analysis sheds new light on how certain skills mitigate the adverse effects, or amplify the positive impacts, of digital exposure on the employment-to-population ratio. The goal is to understand whether certain types of skills make subregions more resilient – or more vulnerable – to technological change.
The analysis, reported in table 4.3, finds that a number of cognitive skills play a key role in mediating the employment effects of digital exposure. Subregions characterized by a higher concentration of jobs requiring financial, computer, sophisticated cognitive, writing and core cognitive skills (such as reasoning, problem solving and digital literacy) tend to experience better employment outcomes when exposed to digital technologies. Importantly, these effects remain even after controlling for the general educational composition of the workforce, suggesting that while education is a necessary foundation, it is the specific mix of skills that ultimately shapes outcomes. Similarly, subregions with greater demand for project and process management skills also tend to be better equipped to adapt to digital exposure, possibly because such skills foster the organizational flexibility and problem solving needed to adjust workflows when technologies are introduced. These results reinforce the notion that advanced communication, organizational and coordination skills are particularly valuable complements to technology.
-
Table 4.3. The mediating role of skills by country income group and education level (percentage point)
|
All |
Low education level |
Middle education level |
High education level |
|||||
|---|---|---|---|---|---|---|---|---|
|
Low- and lower-middle-income |
||||||||
|
Exposure x |
||||||||
|
Core cognitive |
0.28 |
*** |
0.40 |
*** |
0.10 |
*** |
–0.05 |
*** |
|
Sophisticated cognitive |
1.39 |
*** |
1.26 |
*** |
0.91 |
*** |
–0.41 |
*** |
|
General computer |
0.84 |
*** |
1.27 |
*** |
0.38 |
*** |
–0.61 |
*** |
|
Software (specific) and technical support |
0.12 |
–0.47 |
*** |
1.43 |
*** |
–0.71 |
*** |
|
|
Machine learning and AI |
–3.73 |
*** |
–10.37 |
*** |
8.41 |
*** |
–2.25 |
*** |
|
Financial |
1.64 |
*** |
2.40 |
*** |
0.32 |
*** |
–0.60 |
*** |
|
Writing |
2.68 |
*** |
3.03 |
*** |
0.73 |
*** |
–0.80 |
*** |
|
Project and process management |
5.55 |
*** |
6.92 |
*** |
1.93 |
*** |
–1.93 |
*** |
|
Character |
–0.15 |
** |
0.06 |
|
–0.32 |
*** |
0.10 |
*** |
|
Social |
–0.25 |
*** |
–0.22 |
*** |
–0.07 |
*** |
–0.04 |
*** |
|
People management |
1.45 |
*** |
2.08 |
*** |
0.06 |
*** |
–0.42 |
*** |
|
Customer service |
–0.36 |
*** |
–0.31 |
*** |
–0.06 |
*** |
–0.06 |
*** |
|
Finger dexterity |
0.11 |
*** |
–0.06 |
|
–0.12 |
*** |
0.25 |
*** |
|
Hand–foot–eye coordination |
–0.61 |
*** |
–0.89 |
*** |
–0.17 |
*** |
0.33 |
*** |
|
Physical |
–0.65 |
*** |
–0.80 |
*** |
–0.33 |
*** |
0.42 |
*** |
|
Upper-middle-income |
||||||||
|
Exposure x |
||||||||
|
Core cognitive |
0.16 |
*** |
–0.08 |
** |
–0.20 |
*** |
0.28 |
*** |
|
Sophisticated cognitive |
0.39 |
** |
–1.12 |
*** |
0.22 |
*** |
1.06 |
*** |
|
General computer |
0.78 |
*** |
–0.20 |
*** |
–0.53 |
*** |
1.38 |
*** |
|
Software (specific) and technical support |
–2.25 |
*** |
–2.04 |
*** |
2.08 |
*** |
–2.57 |
*** |
|
Machine learning and AI |
–12.79 |
*** |
–15.70 |
*** |
12.66 |
*** |
–11.41 |
*** |
|
Financial |
0.65 |
*** |
–0.63 |
*** |
–0.57 |
*** |
1.57 |
*** |
|
Writing |
1.68 |
*** |
–1.26 |
*** |
–0.79 |
*** |
3.15 |
*** |
|
Project and process management |
0.85 |
–2.26 |
*** |
0.78 |
*** |
2.80 |
*** |
|
|
Character |
–0.02 |
0.42 |
*** |
0.22 |
*** |
–0.68 |
*** |
|
|
Social |
0.05 |
* |
–0.17 |
*** |
0.08 |
*** |
0.15 |
*** |
|
People management |
–0.18 |
* |
–0.66 |
*** |
–0.46 |
*** |
0.75 |
*** |
|
Customer service |
–0.17 |
*** |
–0.16 |
*** |
0.11 |
*** |
–0.12 |
*** |
|
Finger dexterity |
0.21 |
** |
0.27 |
*** |
–0.21 |
*** |
0.11 |
*** |
|
Hand–foot–eye coordination |
0.03 |
0.33 |
*** |
0.08 |
*** |
–0.32 |
*** |
|
|
Physical |
0.11 |
0.83 |
*** |
–0.26 |
*** |
–0.47 |
*** |
|
|
High-income |
||||||||
|
Exposure x |
||||||||
|
Core cognitive |
1.94 |
*** |
–1.76 |
*** |
–3.42 |
*** |
2.58 |
*** |
|
Sophisticated cognitive |
0.59 |
* |
–1.63 |
*** |
3.25 |
*** |
1.69 |
*** |
|
General computer |
1.21 |
*** |
–1.22 |
*** |
2.73 |
*** |
2.64 |
*** |
|
Software (specific) and technical support |
–1.37 |
*** |
–2.67 |
*** |
2.65 |
*** |
1.36 |
*** |
|
Machine learning and AI |
–12.08 |
*** |
–29.45 |
*** |
14.14 |
*** |
26.53 |
*** |
|
Financial |
2.44 |
*** |
–2.91 |
*** |
3.75 |
*** |
3.52 |
*** |
|
Writing |
9.15 |
*** |
0.67 |
|
–12.37 |
*** |
14.67 |
*** |
|
Project and process management |
0.77 |
–9.95 |
*** |
11.74 |
*** |
19.49 |
*** |
|
|
Character |
1.89 |
*** |
2.96 |
*** |
–0.36 |
*** |
–5.13 |
*** |
|
Social |
–0.96 |
*** |
0.94 |
*** |
3.23 |
*** |
–0.98 |
*** |
|
People management |
2.84 |
*** |
–1.27 |
*** |
–2.34 |
*** |
3.98 |
*** |
|
Customer service |
–0.86 |
*** |
–0.31 |
*** |
1.59 |
*** |
0.17 |
*** |
|
Finger dexterity |
0.42 |
*** |
1.16 |
*** |
–0.72 |
*** |
–1.73 |
*** |
|
Hand–foot–eye coordination |
0.02 |
0.76 |
*** |
–1.56 |
*** |
–0.89 |
*** |
|
|
Physical |
0.68 |
** |
3.35 |
*** |
–2.55 |
*** |
–4.90 |
*** |
▪ 1.33 to 1.63 ▪ 1.00 to 1.32 ▪ 0.67 to 0.99 ▪ 0.34 to 0.66 ▪ 0.01 to 0.33 ▫ 0.00 to 0.00 ▪ –0.01 to –0.33 ▪ –0.34 to –0.66 ▪ –0.67 to –0.99
Key: * = significant at the 10 per cent level; ** = significant at the 5 per cent level; *** = significant at the 1 per cent level.
Note: This table presents the estimates for the interaction between digital exposure and measures of the subnational skills composition in 2010. It presents the coefficients measuring the mediating effect of the subnational skills composition on changes in the employment-to-population ratio over the period 2014 to 2019. Each coefficient comes from a separate regression. Control variables include country-fixed effects and demographic characteristics from 2010, including the logarithm of the working-age population, share of females and proportion of the population aged over 55. The sum of exposure shares is also included as covariate. Lastly, measures of the supply side of skilled labour in 2010 are included, namely, the share of low-, middle- and high-educated workers. For the list of countries included in the analysis, see Delaporte, Escudero and Petit (forthcoming).
Source: Delaporte, Escudero and Petit (forthcoming).
Interestingly, while these positive mediating effects are observed across all country income levels, the effects are stronger in high-income countries. This may stem from more supportive institutional environments, including better access to digital infrastructure, training systems and innovation ecosystems.
Importantly, the extent to which skills mediate the employment effects of digital exposure varies significantly depending on the education levels of workers within country income groups. Most cognitive skills are associated with positive employment outcomes – particularly for middle- and high-educated workers in high-income countries, and for high-educated workers in upper-middle-income contexts. This finding is in line with the idea that digital technologies tend to complement middle- and high-educated workers when local jobs require strong cognitive skills, because these workers are better positioned to adapt to task upgrading and to benefit from complementary technologies. In lower-income countries, highly exposed areas which have a high share of jobs requiring cognitive skills tend to experience gains in employment among low- and middle-educated workers, while high-educated workers appear more vulnerable to displacement. This pattern may reflect that digital exposure in these settings is still at an earlier stage, initially creating or transforming jobs that rely on basic or intermediate cognitive skills, rather than generating sufficient high-end roles.
However, not all cognitive skills are equally beneficial. Subregions with a high share of jobs requiring machine learning and AI or software/technical skills appear to fare worse in terms of employment growth following digital exposure. These more specialized digital skills also follow a different pattern with regard to the educational groups affected. In high-income countries, these skills are associated with positive employment effects for middle- and high-educated workers, where these skills are complements to production technologies and organizational processes that are already digitally mature. In contrast, in lower-income settings, where such technologies are still emerging, these skills are associated with job displacement among both low- and high-educated workers, while those with middle education levels experience employment gains, reflecting a polarization mechanism with limited high-skill absorption. These patterns may indicate a misalignment between the increased demand for advanced digital skills and the preparedness of the workforce who may lack the specific competencies required – though the analysis does not directly test for such mismatches. They may also reflect the fact that the data predate the rapid spread of generative AI, which tends to reshape tasks within jobs rather than fully displace employment. In either case, the findings highlight the importance of context-sensitive digital skills strategies that align with local labour market structures and evolving technological realities.
The mediating effects of socio-emotional skills are generally smaller with less clear patterns among country income groups. People management stands out as a positive mediator in both low- and high-income countries, suggesting that roles involving team coordination and supervisory responsibilities complement technological change. In contrast, customer service and social skills are associated with weaker employment outcomes in both low- and high-income countries. However, when differentiating by educational levels of the workforce, most of these skills exhibit a positive mediating effect for middle-educated workers in high-income countries – likely reflecting the complementarity of these interpersonal skills with technology and their potential to be augmented rather than replaced by it in increasingly service-oriented roles.
Finally, the effects of manual skills are not uniform across contexts. In upper-middle- and high-income countries, manual skills are associated with employment gains for low-educated workers, but negative effects for middle- and high-educated workers. This pattern suggests a mismatch between qualification levels and task demands: while demand persists for certain manual, non-automatable tasks typically performed by low-educated workers, middle- and high-educated workers with manual skill profiles may be suffering from displacement. By contrast, in low- and lower-middle-income countries, manual skills are associated with negative employment effects for low- and middle-educated workers, while high-educated workers tend to benefit. This pattern likely reflects structural differences in task content and technological adoption: among less-educated workers, manual skills are often concentrated in routine, physically intensive jobs that are more vulnerable to automation, offshoring or informality. Meanwhile, high-educated workers with manual competencies are more likely employed in specialized, precision-oriented or technology-complementary tasks – for example, in advanced manufacturing, medical technology or maintenance of sophisticated equipment – where manual dexterity and technical knowledge complement digital tools rather than compete with them.
Overall, the analysis underscores that the employment impacts of exposure to digital technologies are not uniform but are strongly mediated by the underlying skill composition of the workforce. Not all skills offer the same protection against digital exposure. While several cognitive and socio-emotional skills – particularly financial literacy, computer use, core reasoning abilities and people management – play a pivotal role in enabling subregions to translate digital exposure into employment gains, the effects vary significantly by country income level, educational attainment and type of skill. However, more specialized digital skills – such as machine learning and AI, and software competencies – present a double-edged sword. In high-income countries, they are associated with positive effects for high-educated workers to the detriment of low-educated workers, while in lower-income countries, these skills are linked to displacement among both low- and high-educated workers. This highlights how uneven digital readiness across contexts and the level of preparedness of the local labour force can shape whether advanced skills lead to opportunity or exclusion.
These results highlight the importance of moving beyond general education policies to develop targeted, context-sensitive skills policies that respond to the pace and nature of digital exposure. Ensuring an inclusive digital transition will depend not only on increasing access to technology, and improving digital skills, but on building the right mix of skills that enable all workers – especially the most vulnerable – to benefit from these transformations.
4.5. Conclusion
This chapter has explored how global transformations – particularly demographic shifts, the green transition and digitalization – are reshaping the world of work in order to examine three critical and interconnected skills challenges they bring to the fore. First, the focus on the increased demand for care work resulting from ageing populations highlights the issue of the undervaluation of skills, particularly in sectors producing social value. This emphasizes the need for a dedicated shift in how societies and markets recognize and reward workers’ full skill sets. Second, the green and the digital transitions demonstrate that while technical skills directly linked to each transformation are necessary, they are not sufficient on their own. Building a workforce that can adapt to rapid labour market changes requires diverse skills profiles that combine both core and technical skills, across cognitive, socio-emotional and manual domains – ensuring that both the green transition and digitalization are inclusive and fair. Third, the analysis of the digital transition underscores how skills mediate the effects of technological change, shaping whether digital exposure leads to job creation or displacement. The analysis also shows which combinations of skills are more effective as summarized below, depending on a country’s income level and the educational and skills background of its workforce.
In more detail, one immediate implication of demographic changes, particularly population ageing, is the rising demand for care work. This typically female-dominated sector could offer decent employment opportunities, but workers’ skills – especially socio-emotional ones – often remain undervalued. Meeting the growing demand for care work requires not only investment in specialized training, but also a broader societal recognition of the skills of care workers and their essential contribution to social value – beyond what is immediately measurable. Needed initiatives include: promoting adequate skills certification; improving working conditions; strengthening social protection; and reaffirming the state’s responsibility in care provision, funding, regulation and quality assurance, as recognized in the 2024 ILO resolution concerning decent work and the care economy (ILO 2024a).
The green transition, meanwhile, is transforming not just the sectors in which jobs are created but also the skills profiles those jobs require. As shown in the chapter, the green transition demands a broad mix of skills – both core and technical, across cognitive, socio-emotional and manual domains, as well as green-specific skills. However, in many countries, both the development and integration of these skills in the workplace remain limited. Furthermore, the benefits associated with green jobs – such as better wages and working conditions – are unevenly distributed. While green vacancies yield notable wage premiums in some countries and occupations, in others, they show little or no advantage over non-green roles. These patterns underscore the need for targeted skills policies that extend beyond the promotion of green skills alone, by also supporting workers in carbon-intensive sectors and addressing the needs of vulnerable populations and disadvantaged regions.
Finally, while digitalization can support employment growth, its impacts depend on the skills available within the workforce. Cognitive and socio-emotional skills – such as financial literacy, basic computer use, core cognitive skills and people management – are essential for turning digital exposure into inclusive employment gains. Meanwhile, advanced digital skills (such as in AI and machine learning) show more mixed effects, as their impact depends on countries’ technological maturity, the type of technology adopted and the readiness of the workforce to integrate these skills. Crucially, focusing solely on AI or other specialized digital skills is not enough, as jobs increasingly require these technical skills in combination with other cognitive and socio-emotional skills (as shown in Chapter 3). These patterns highlight the need for context-sensitive skill strategies that move beyond general education to build diverse, complementary skills – blending digital, cognitive and socio-emotional abilities – that enable workers and firms to adapt to the pace and nature of digital change. As technologies continue to evolve rapidly, continuous monitoring and updated analysis are essential to capture new trends and emerging skill needs.
This chapter has highlighted that skills are a critical lever for navigating and shaping change, supporting workers and enterprises in adapting to global transformations. As it will be discussed in Chapter 5, to fully harness the benefits of these transitions, policymakers must build stronger education and training systems that support continuous upskilling and reskilling – especially for those most at risk of being left behind. Employers need to invest in workforce development not only to stay competitive but also to contribute to fairer, more inclusive transitions. Individuals, in turn, must also be supported with accessible lifelong learning opportunities that empower them to adapt and thrive. Crucially, skills must not only be developed but also adequately recognized and rewarded, through decent wages, high-quality working conditions and adequate societal valuation. Finally, comprehensive lifelong learning systems must connect education and training with employment promotion and social protection to mitigate job displacement, facilitate transitions and ensure no one is left behind.
66 ILO, “ILO Centenary Declaration for the Future of Work”, https://www.ilo.org/resource/ilc/108/ilo-centenary-declaration-future-work.
67 Accordingly, this section operationalizes a broad concept of “care work” based on occupation and/or sector. While there is no international statistical definition of paid and unpaid care work, following the 21st International Conference of Labour Statisticians (ICLS), measurement standards are being developed for deliberation at the 22nd ICLS.
68 The following discussion draws from Liepmann and Hegewisch (2025).
69 These figures are estimates and depend heavily on the global pace of decarbonization and policy adoption.
70 The 40 digital technologies are classified into nine families of emerging digital technologies, namely: (i) 3D printing, (ii) embedded systems, (iii) smart mobility, (iv) food services, (v) e-commerce, (vi) payment systems, (vii) digital services, (viii) computer vision, and (ix) health technology. For details, please refer to Prytkova et al. (2024).
71 As a share of the working-age population aged 15 and above.
72 The analysis extends up to 2019, excluding more recent years to avoid potential confounding factors associated with employment and population changes during the COVID-19 pandemic.
-
References
Acemoglu, Daron. 1998. “Why Do New Technologies Complement Skills? Directed Technical Change and Wage Inequality”. The Quarterly Journal of Economics 113 (4): 1055–1089. https://doi.org/10.1162/003355398555838.
Acemoglu, Daron, and David Autor. 2011. “Skills, Tasks and Technologies: Implications for Employment and Earnings”. In Handbook of Labor Economics, vol. 4B, edited by Orley Ashenfelter and David Card, 1043–1171. Amsterdam, Netherlands: Elsevier. https://doi.org/10.1016/S0169-7218(11)02410-5.
Acemoglu, Daron, David Autor, Jonathon Hazell and Pascual Restrepo. 2022. “Artificial Intelligence and Jobs: Evidence from Online Vacancies”. Journal of Labor Economics 40 (S1): S293–S340. https://doi.org/10.1086/718327.
Acemoglu, Daron, and Pascual Restrepo. 2019. “Automation and New Tasks: How Technology Displaces and Reinstates Labor”. Journal of Economic Perspectives 33 (2): 3–30. https://doi.org/10.1257/jep.33.2.3.
———. 2020. “Robots and Jobs: Evidence from US Labor Markets”. Journal of Political Economy 128 (6): 2188–2244. https://doi.org/10.1086/705716.
Adamczyk, Willian, Simon Boehmer, Isaure Delaporte, Verónica Escudero and Hannah Liepmann. 2025. “Developing a New Method to Uncover Skills Trends in Emerging Economies Using Online Data and NLP Techniques”. ILO Methodological Brief. https://doi.org/10.54394/HQQX3200.
Adamczyk, Willian, Isaure Delaporte and Verónica Escudero. 2025. “Measuring Quality of Employment in Emerging Economies: A Methodology for Assessing Job Amenities Using Big Data”. ILO Methodological Brief. https://doi.org/10.54394/YNLL0477.
Adamczyk, Willian, Isaure Delaporte, Verónica Escudero and Hannah Liepmann. 2026. "Assessing the Size of the Green Economy: Global Evidence from Harmonized Labour Force Surveys". ILO Research Brief. https://doi.org/10.54394/00033297.
Addati, Laura, Umberto Cattaneo, Valeria Esquivel and Isabel ValariNo. 2018. Care Work and Care Jobs for the Future of Decent Work. ILO. https://researchrepository.ilo.org/esploro/outputs/995218954802676.
Akerman, Anders, Ingvil Gaarder and Magne Mogstad. 2015. “The Skill Complementarity of Broadband Internet”. The Quarterly Journal of Economics 130 (4): 1781–1824. https://doi.org/10.1093/qje/qjv028.
Almeida, Rita K., Carlos H.L. Corseuil and Jennifer P. Poole. 2017. “The Impact of Digital Technologies on Routine Tasks: Do Labor Policies Matter?”. World Bank Policy Research Working Paper No. 8187. http://documents.worldbank.org/curated/en/880331504875104459.
Almeida, Rita K., Ana M. Fernandes and Mariana Viollaz. 2020. “Software Adoption, Employment Composition, and the Skill Content of Occupations in Chilean Firms”. The Journal of Development Studies 56 (1): 169–185. https://doi.org/10.1080/00220388.2018.1546847.
Arntz, Melanie, Terry Gregory and Ulrich Zierahn. 2016. “The Risk of Automation for Jobs in OECD Countries: A Comparative Analysis”. OECD Social, Employment and Migration Working Papers, No. 189. https://doi.org/10.1787/5jlz9h56dvq7-en.
Autor, David H., Frank Levy and Richard J. Murnane. 2003. “The Skill Content of Recent Technological Change: An Empirical Exploration”. The Quarterly Journal of Economics 118 (4): 1279–1333. https://doi.org/10.1162/003355303322552801.
Bachmann, Ronald, Markus Janser, Florian Lehmer and Christina Vonnahme. 2024. “Disentangling the Greening of the Labour Market: The Role of Changing Occupations and Worker Flows”. IAB Discussion Paper No. 12/2024. Institute for Employment Research. https://doi.org/10.48720/IAB.DP.2412.
Biasi, Barbara, and Heather Sarsons. 2022. “Flexible Wages, Bargaining, and the Gender Gap”. The Quarterly Journal of Economics 137 (1): 215–266. https://doi.org/10.1093/qje/qjab026.
Black, Sandra E., and Alexandra Spitz-Oener. 2010. “Explaining Women’s Success: Technological Change and the Skill Content of Women’s Work”. The Review of Economics and Statistics 92 (1): 187–194. https://doi.org/10.1162/rest.2009.11761.
Borghans, Lex, Bas Ter Weel and Bruce A. Weinberg. 2014. “People Skills and the Labor-Market Outcomes of Underrepresented Groups”. ILR Review 67 (2): 287–334. https://doi.org/10.1177/001979391406700202.
Borgonovi, Francesca, Elisa Lanzi, Helke Seitz, Ruben Bibas, Jean Fouré, Hubert Plisiecki and Laura Atarody. 2023. “The Effects of the EU Fit for 55 Package on Labour Markets and the Demand for Skills”. OECD Social, Employment and Migration Working Papers, No. 297. https://doi.org/10.1787/6c16baac-en.
Bowen, Alex, and Karlygash Kuralbayeva. 2015. “Looking for Green Jobs: The Impact of Green Growth on Employment”. GRI Policy Brief. Grantham Research Institute on Climate Change and the Environment. https://www.lse.ac.uk/granthaminstitute/publication/looking-for-green-jobs-the-impact-of-green-growth-on-employment/.
Bowen, Alex, Karlygash Kuralbayeva and Eileen L. Tipoe. 2018. “Characterising Green Employment: The Impacts of ‘Greening’ on Workforce Composition”. Energy Economics 72: 263–275. https://doi.org/10.1016/j.eneco.2018.03.015.
Brucal, Arlan, Beata Javorcik and Inessa Love. 2018. “Energy Savings through Foreign Acquisitions? Evidence from Indonesian Manufacturing Plants”. GRI Working Paper No. 289. Grantham Research Institute on Climate Change and the Environment. https://www.lse.ac.uk/granthaminstitute/publication/foreign-acquisitions-energy-intensity-indonesian-manufacturing-plants/.
Budig, Michelle J., and Joya Misra. 2010. “How Care-Work Employment Shapes Earnings in Cross-National Perspective”. International Labour Review 149 (4): 441–460. https://doi.org/10.1111/j.1564-913X.2010.00097.x.
Caldarola, Bernardo, Marco Grazzi, Martina Occelli and Marco Sanfilippo. 2022. “Mobile Internet, Skills and Structural Transformation in Rwanda”. ILO Working Paper No. 60. https://doi.org/10.54394/XSTK4695.
Carbonero, Francesco, Jeremy Davies, Ekkehard Ernst, Frank M. Fossen, Daniel Samaan and Alina Sorgner. 2023. “The Impact of Artificial Intelligence on Labor Markets in Developing Countries: A New Method with an Illustration for Lao PDR and Urban Viet Nam”. Journal of Evolutionary Economics 33 (3): 707–736. https://doi.org/10.1007/s00191-023-00809-7.
Carpenter, Rebekah, Dawn Carr, Brooke Helppie-McFall and Amanda Sonega. 2022. Census 2010 Occupation Code – Occupational Information Network (O*NET) 26.1 Data, Version 2. Florida State University and the University of Michigan. Accessed 8 January 2025. https://claudepeppercenter.fsu.edu/onet-261/.
Cole, Matthew A., and Robert J.R. Elliott. 2007. “Do Environmental Regulations Cost Jobs? An Industry-Level Analysis of the UK”. The B.E. Journal of Economic Analysis & Policy 7 (1). https://doi.org/10.2202/1935-1682.1668.
Cole, Matthew A., Robert J.R. Elliott and Eric Strobl. 2008. “The Environmental Performance of Firms: The Role of Foreign Ownership, Training, and Experience”. Ecological Economics 65 (3): 538–546. https://doi.org/10.1016/j.ecolecon.2007.07.025.
Consoli, Davide, Giovanni Marin, Alberto Marzucchi and Francesco Vona. 2016. “Do Green Jobs Differ from Non-Green Jobs in Terms of Skills and Human Capital?”. Research Policy 45 (5): 1046–1060. https://doi.org/10.1016/j.respol.2016.02.007.
Corley-Coulibaly, Marva, Pelin Sekerler Richiardi and Franz Christian Ebert, eds. 2023. Integrating Trade and Decent Work, Volume 1: Has Trade Led to Better Jobs? – Findings Based on the ILO’s Decent Work Indicators. ILO. https://doi.org/10.54394/NVUM2638.
Cortes, Guido Matias, Nir Jaimovich and Henry E. Siu. 2023. “The Growing Importance of Social Tasks in High-Paying Occupations: Implications for Sorting”. Journal of Human Resources 58 (5): 1429–1451. https://doi.org/10.3368/jhr.58.5.0121-11455R1.
Cortés, Patricia, Ying Feng, Nicolás Guida-Johnson and Jessica Pan. 2024. “Automation and Gender: Implications for Occupational Segregation and the Gender Skill Gap”. NBER Working Paper No. 32030. National Bureau of Economic Research. https://doi.org/10.3386/w32030.
Dauth, Wolfgang, Sebastian Findeisen, Jens Suedekum and Nicole Woessner. 2021. “The Adjustment of Labor Markets to Robots”. Journal of the European Economic Association 19 (6): 3104–3153. https://doi.org/10.1093/jeea/jvab012.
de Henau, Jerome. 2022. “Costs and Benefits of Investing in Transformative Care Policy Packages: A Macrosimulation Study in 82 Countries”. ILO Working Paper No. 55. https://doi.org/10.54394/AKYJ8893.
de Vries, Gaaitzen, Elisabetta Gentile, Sébastien Miroudot and Konstantin M. Wacker. 2020. “The Rise of Robots and the Fall of Routine Jobs”. Labour Economics 66: 101885. https://doi.org/10.1016/j.labeco.2020.101885.
Dechezleprêtre, Antoine, David Hémous, Morten Olsen and Carlo Zanella. 2021. “Induced Automation: Evidence from Firm-Level Patent Data”. University of Zurich, Department of Economics, Working Paper No. 384. https://doi.org/10.2139/ssrn.3835089.
Dechezleprêtre, Antoine, and Misato Sato. 2017. “The Impacts of Environmental Regulations on Competitiveness”. Review of Environmental Economics and Policy 11 (2): 183–206. https://doi.org/10.1093/reep/rex013.
Delaporte, Isaure, Verónica Escudero and Willian Adamczyk. 2025. "Measuring the Greenness of Jobs in Emerging Economies: A Big Data Text Analysis Approach". ILO Research Brief. https://doi.org/10.54394/JKGV7887.
Delaporte, Isaure, Verónica Escudero and Fabien Petit. Forthcoming. “The Role of Skills in Mediating the Effects of Emerging Digital Technologies on Employment”. ILO Working Paper.
Deming, David J. 2017. “The Growing Importance of Social Skills in the Labor Market”. The Quarterly Journal of Economics 132 (4): 1593–1640. https://doi.org/10.1093/qje/qjx022.
Dwyer, Rachel E. 2013. “The Care Economy? Gender, Economic Restructuring, and Job Polarization in the U.S. Labor Market”. American Sociological Review 78 (3): 390–416. https://doi.org/10.1177/0003122413487197.
ECLAC (Economic Commission for Latin America and the Caribbean). 2022. Ageing in Latin America and the Caribbean: Inclusion and Rights of Older Persons. LC/CRE.5/3. https://repositorio.cepal.org/entities/publication/49ebd6cc-abbc-4d04-866b-6ca95bea7bc9.
England, Paula, Michelle Budig and Nancy Folbre. 2002. “Wages of Virtue: The Relative Pay of Care Work”. Social Problems 49 (4): 455–473. https://doi.org/10.1525/sp.2002.49.4.455.
Escudero, Verónica, Hannah Liepmann and Ana Podjanin. 2024. “Using Online Vacancy and Job Applicants’ Data to Study Skills Dynamics”. In Big Data Applications in Labor Economics, Part B, edited by Benjamin Elsner and Solomon W. Polachek, 35–99. Research in Labor Economics, vol. 52B. https://doi.org/10.1108/S0147-91212024000052B023.
Eskeland, Gunnar S., and Ann E. Harrison. 2003. “Moving to Greener Pastures? Multinationals and the Pollution Haven Hypothesis”. Journal of Development Economics 70 (1): 1–23. https://doi.org/10.1016/S0304-3878(02)00084-6.
Esquivel, Valeria. 2019. “Gender Impacts of Structural Transformation”. ILO/Sida Partnership on Employment, Technical Brief No. 2. https://researchrepository.ilo.org/esploro/outputs/995219245302676.
European Commission. 2020. “Press Release on Committing to Climate-Neutrality by 2050”, 4 March 2020. https://ec.europa.eu/commission/presscorner/detail/en/ip_20_335.
FRED (Federal Reserve Bank of St. Louis). n.d. “Fertility Rate”, FRED database. Accessed 1 February 2025. https://fred.stlouisfed.org/categories/33512.
Flood, Sarah, Miriam King, Renae Rodgers, Steven Ruggles, J. Robert Warren, Daniel Backman, Annie Chen, Grace Cooper, Stephanie Richards, Megan Schouweiler and Michael Westberry. 2024. “Integrated Public Use Microdata Series, Current Population Survey: Version 12.0”, IPUMS database. Accessed 1 February 2025. https://doi.org/10.18128/D030.V12.0.
Folbre, Nancy, Leila Gautham and Kristin Smith. 2021. “Essential Workers and Care Penalties in the United States”. Feminist Economics 27 (1–2): 173–187. https://doi.org/10.1080/13545701.2020.1828602.
———. 2023. “Gender Inequality, Bargaining, and Pay in Care Services in the United States”. ILR Review 76 (1): 86–111. https://doi.org/10.1177/00197939221091157.
Gmyrek, Paweł, Janine Berg and David Bescond. 2023. “Generative AI and Jobs: A Global Analysis of Potential Effects on Job Quantity and Quality”. ILO Working Paper No. 96. https://doi.org/10.54394/FHEM8239.
Gmyrek, Paweł, Hernan Winkler and Santiago Garganta. 2024. “Buffer or Bottleneck? Employment Exposure to Generative AI and the Digital Divide in Latin America”. ILO Working Paper No. 121. https://doi.org/10.54394/TFZY7681.
Goos, Maarten, Alan Manning and Anna Salomons. 2009. “Job Polarization in Europe”. American Economic Review 99 (2): 58–63. https://doi.org/10.1257/aer.99.2.58.
Government of Costa Rica. 2019. National Decarbonization Plan – Government of Costa Rica 2018–2050. https://unfccc.int/documents/204474.
Government of India, Ministry of Power. 2018. Four Years of Empowerment. https://powermin.gov.in/en/content/initiatives-and-achievements.
Granata, Julia, and Josefina Posadas. 2024. Why Look at Tasks When Designing Skills Policy for the Green Transition? A Methodological Note on How to Identify Green Occupations and the Skills They Require. World Bank Policy Research Working Paper No. 10753. http://documents.worldbank.org/curated/en/099507304172419760.
Greenstone, Michael. 2002. “The Impacts of Environmental Regulations on Industrial Activity: Evidence from the 1970 and 1977 Clean Air Act Amendments and the Census of Manufactures”. Journal of Political Economy 110 (6): 1175–1219. https://doi.org/10.1086/342808.
Gregg, Con, Olga Strietska-Ilina and Christoph Büdke. 2015. Anticipating Skill Needs for Green Jobs: A Practical Guide. ILO. https://researchrepository.ilo.org/esploro/outputs/995219113102676.
Hamilton, Caitlin, Jiawei Song, Ryna Cui, Colin Olson and Diyang Cui. 2022. “Evaluating Provincial-Level Employment Challenge during the Coal Transition in China”. Advances in Climate Change Research 13 (5): 729–737. https://doi.org/10.1016/j.accre.2022.08.006.
Hjort, Jonas, and Jonas Poulsen. 2019. “The Arrival of Fast Internet and Employment in Africa”. American Economic Review 109 (3): 1032–1079. https://doi.org/10.1257/aer.20161385.
Humlum, Anders. 2019. Robot Adoption and Labor Market Dynamics. https://www.semanticscholar.org/paper/Robot-Adoption-and-Labor-Market-Dynamics-Humlum/9c546d533fcb3f0df9974dc78332b94a53a629cf.
IDB (Inter-American Development Bank). 2019. Getting to Net-Zero Emissions: Lessons from Latin America and the Caribbean (Executive Summary). https://doi.org/10.18235/0002042.
ILO. 2018. World Employment Social Outlook 2018: Greening with Jobs. https://researchrepository.ilo.org/esploro/outputs/995218839002676.
———. 2019a. Skills for a Greener Future: A Global View. https://researchrepository.ilo.org/esploro/outputs/995219302602676.
———. 2019b. Working on a Warmer Planet: The Impact of Heat Stress on Labour Productivity and Decent Work. https://researchrepository.ilo.org/esploro/outputs/995219567102676.
———. 2020. Global Wage Report 2020–21: Wages and Minimum Wages in the Time of COVID-19. https://researchrepository.ilo.org/esploro/outputs/995219349402676.
———. 2021. World Employment and Social Outlook 2021: The Role of Digital Labour Platforms in Transforming the World of Work. https://researchrepository.ilo.org/esploro/outputs/995218610802676.
———. 2022. Care at Work: Investing in Care Leave and Services for a More Gender Equal World of Work. https://doi.org/10.54394/AQOF1491.
———. 2023a. World Employment and Social Outlook 2023: The Value of Essential Work. https://doi.org/10.54394/OQVF7543.
———. 2023b. The ILO Strategy on Skills and Lifelong Learning 2030. https://researchrepository.ilo.org/esploro/outputs/995319472602676.
———. 2023c. Resolution concerning a just transition towards environmentally sustainable economies and societies for all. International Labour Conference. 111th Session. https://www.ilo.org/resource/ilc/111/resolution-concerning-just-transition-towards-environmentally-sustainable.
———. 2024a. Resolution concerning decent work and the care economy. International Labour Conference. 112th Session. https://www.ilo.org/resource/record-decisions/resolution-concerning-decent-work-and-care-economy.
———. 2024b. Asia-Pacific Employment and Social Outlook 2024: Promoting Decent Work and Social Justice to Manage Ageing Societies. https://doi.org/10.54394/EZFF3499.
———. 2024c. “The Impact of Care Responsibilities on Women’s Labour Force Participation”. ILO Statistical Brief. https://doi.org/10.54394/LPTT5569.
———. 2024d. “Navigating the Future: Skills and Jobs in the Green and Digital Transitions – Scenario-Based Insights”. ILO Brief. https://doi.org/10.54394/VGNR3350.
———. 2024e. Gender, Equality and Inclusion for a Just Transition in Climate Action: A Policy Guide. https://researchrepository.ilo.org/esploro/outputs/995378693502676.
———. 2025a. The State of Social Justice: A Work in Progress. https://doi.org/10.54394/ASWD9537.
———. 2025b. World Employment and Social Outlook: Trends 2025. https://doi.org/10.54394/IZLN1673.
———. 2025c. Handbook on Measuring Green Jobs and Skills for Green Jobs: Monitoring, Evaluation and Learning. https://doi.org/10.54394/ZMPJ3373.
———. 2025d. Compendium of Promising Practices for the Promotion of Jobs and Skills for a Green Economy. https://doi.org/10.54394/DLFQ2927.
———. n.d. a. “Worker and Sector Profiles – Paid Care Workers”, ILOSTAT database. Accessed 1 April 2025. https://ilostat.ilo.org/methods/concepts-and-definitions/description-worker-and-sector-profiles/.
———. n.d. b. “What Is a Green Job?”. https://www.ilo.org/resource/article/what-green-job.
IRENA (International Renewable Energy Agency) and ILO. 2024. Renewable Energy and Jobs: Annual Review 2024. https://www.irena.org/Publications/2024/Oct/Renewable-energy-and-jobs-Annual-review-2024.
Juhn, Chinhui, Kevin M. Murphy and Brooks Pierce. 1993. “Wage Inequality and the Rise in Returns to Skill”. Journal of Political Economy 101 (3): 410–442. https://doi.org/10.1086/261881.
Kahn, Matthew E., and Erin T. Mansur. 2013. “Do Local Energy Prices and Regulation Affect the Geographic Concentration of Employment?”. Journal of Public Economics 101: 105–114. https://doi.org/10.1016/j.jpubeco.2013.03.002.
Kuptsch, Christiane, and Fabiola Mieres, eds. 2025. Temporary Labour Migration: Towards Social Justice? ILO. https://doi.org/10.54394/TGOF6029.
Lee, Yong Suk, Toshiaki Iizuka and Karen Eggleston. 2025. “Robots and Labor in Nursing Homes”. Labour Economics 92: 102666. https://doi.org/10.1016/j.labeco.2024.102666.
Li, Zheng, and Bohan Jin. 2024. “The Impact of Environmental Regulations on Employment: Quasi-Experimental Evidence from Regulated and Unregulated Industries in China”. Applied Economics 56 (40): 4827–4848. https://doi.org/10.1080/00036846.2023.2216442.
Liepmann, Hannah, and Ariane Hegewisch. 2025. “Revisiting Occupational Segregation and the Valuation of Women’s Work”. ILO Working Paper No. 158. https://doi.org/10.54394/YGCL5095.
LinkedIn. 2023. Global Green Skills Report 2023. https://economicgraph.linkedin.com/research/global-green-skills-report.
Maestas, Nicole, Kathleen J. Mullen, David Powell, Till von Wachter and Jeffrey B. Wenger. 2023. “The Value of Working Conditions in the United States and Implications for the Structure of Wages”. American Economic Review 113 (7): 2007–2047. https://doi.org/10.1257/aer.20190846.
Mann, Katja, and Lukas Püttmann. 2023. “Benign Effects of Automation: New Evidence from Patent Texts”. The Review of Economics and Statistics 105 (3): 562–579. https://doi.org/10.1162/rest_a_01083.
Marin, Giovanni, and Francesco Vona. 2019. “Climate Policies and Skill-Biased Employment Dynamics: Evidence from EU Countries”. Journal of Environmental Economics and Management 98: 102253. https://doi.org/10.1016/j.jeem.2019.102253.
OECD (Organisation for Economic Co-operation and Development). 2023. Job Creation and Local Economic Development 2023: Bridging the Great Green Divide. https://doi.org/10.1787/21db61c1-en.
OECD, Cedefop, European Commission, European Training Foundation, ILO and UNESCO. 2024. Skills Policies for Resilience. OECD. https://www.ilo.org/publications/skills-policies-resilience.
Perugini, Cristiano, and Fabrizio Pompei. 2009. “Technological Change and Income Distribution in Europe”. International Labour Review 148 (1–2): 123–148. https://doi.org/10.1111/j.1564-913X.2009.00051.x.
Pietrykowski, Bruce. 2017. “The Return to Caring Skills: Gender, Class, and Occupational Wages in the US”. Feminist Economics 23 (4): 32–61. https://doi.org/10.1080/13545701.2016.1257142.
Pinedo Caro, Luis, Niall O’Higgins and Janine Berg. 2021. “Young People and the Gig Economy”. In Is the Future Ready for Youth? Youth Employment Policies for Evolving Labour Markets, edited by Juan Chacaltana and Sukti Dasgupta, 38–52. ILO. https://researchrepository.ilo.org/esploro/outputs/995271450802676.
Prytkova, Ekaterina, Fabien Petit, Deyu Li, Sugat Chaturvedi and Tommaso Ciarli. 2024. “The Employment Impact of Emerging Digital Technologies”. CESifo Working Paper No. 10955. https://doi.org/10.2139/ssrn.4739904.
Razavi, Shahra, and Silke Staab. 2010. “Underpaid and Overworked: A Cross-National Perspective on Care Workers”. International Labour Review 149 (4): 407–422. https://doi.org/10.1111/j.1564-913X.2010.00095.x.
Ruppert Bulmer, Elizabeth, Kevwe Pela, Andreas Eberhard-Ruiz and Jimena Montoya. 2021. Global Perspective on Coal Jobs and Managing Labor Transition out of Coal: Key Issues and Policy Responses. World Bank. https://hdl.handle.net/10986/37118.
Rutovitz, Jay. 2010. South African Energy Sector Jobs to 2030: How the Energy [R]Evolution Will Create Sustainable Green Jobs. Greenpeace Africa. http://hdl.handle.net/10453/16806.
Rutovitz, Jay, and Alison M. Atherton. 2009. Energy Sector Jobs to 2030: A Global Analysis. Institute for Sustainable Futures, University of Technology, Sydney. https://opus.lib.uts.edu.au/handle/10453/20458.
Saka, Orkun, Barry Eichengreen and Cevat Giray Aksoy. 2022. “Epidemic Exposure, Fintech Adoption and the Digital Divide”. CEPR Discussion Paper No. 16323. Centre for Economic Policy Research. https://cepr.org/publications/dp16323.
Saussay, Aurélien, Misato Sato, Francesco Vona and Layla O’Kane. 2022. “Who’s Fit for the Low-Carbon Transition? Emerging Skills and Wage Gaps in Job Ad Data”. Fondazione Eni Enrico Mattei Working Paper No. 031.2022. https://www.jstor.org/stable/resrep44011.
Schwartz, Jordan, Luis Andres and Georgeta Dragoiu. 2009. “Crisis in Latin America: Infrastructure Investment, Employment and the Expectations of Stimulus”. Journal of Infrastructure Development 1 (2): 111–131. https://doi.org/10.1177/097493060900100202.
Sciubba, Jennifer. 2022. 8 Billion and Counting: How Sex, Death, and Migration Shape Our World. New York: W. W. Norton & Company. https://wwnorton.com/books/9781324002703.
Sockin, Jason. 2021. “Show Me the Amenity: Are Higher-Paying Firms Better All Around?”. CESifo Working Paper No. 9842. https://doi.org/10.2139/ssrn.3957002.
Strietska-Ilina, Olga, Christine Hofmann, Mercedes Durán Haro and Shinyoung Jeon. 2011. Skills for Green Jobs: A Global View – Synthesis Report Based on 21 Country Studies. ILO. https://researchrepository.ilo.org/esploro/outputs/995341593402676.
UNDESA (United Nations Department of Economics and Social Affairs). n.d. “World Population Prospects 2024”. Accessed 1 April 2024. https://population.un.org/wpp/.
UNEP (United Nations Environment Programme). 2023a. Adaptation Gap Report 2023: Underfinanced. Underprepared. Inadequate Investment and Planning on Climate Adaptation Leaves World Exposed. https://doi.org/10.59117/20.500.11822/43796.
———. 2023b. Emissions Gap Report 2023: Broken Record – Temperatures Hit New Highs, Yet World Fails to Cut Emissions (Again). https://doi.org/10.59117/20.500.11822/43922.
UNEP, ILO, IOE (International Organisation of Employers) and ITUC (International Trade Union Confederation). 2008. Green Jobs: Towards Decent Work in a Sustainable, Low-Carbon World. https://labordoc.ilo.org/permalink/41ILO_INST/j3q9on/alma994251803402676.
UNI Global Union. 2025. Fixing the Care Crisis: Stopping the Staff Exodus, Building Resilient Care Systems. https://uniglobalunion.org/wp-content/uploads/FINAL-UNI-Care-2025-Report-Fixing-the-care-crisis.pdf.
Vona, Francesco, Giovanni Marin and Davide Consoli. 2019. “Measures, Drivers and Effects of Green Employment: Evidence from US Local Labor Markets, 2006–2014”. Journal of Economic Geography 19 (5): 1021–1048. https://doi.org/10.1093/jeg/lby038.
Vona, Francesco, Giovanni Marin, Davide Consoli and David Popp. 2018. “Environmental Regulation and Green Skills: An Empirical Exploration”. Journal of the Association of Environmental and Resource Economists 5 (4): 713–753. https://doi.org/10.1086/698859.
Walker, W. Reed. 2011. “Environmental Regulation and Labor Reallocation: Evidence from the Clean Air Act”. American Economic Review 101 (3): 442–447. https://doi.org/10.1257/aer.101.3.442.
World Bank. 2021. State and Trends of Carbon Pricing 2021. https://doi.org/10.1596/978-1-4648-1728-1.
Yoo, Seulgi, and Almas Heshmati. 2019. “The Effects of Environmental Regulations on the Manufacturing Industry’s Performance: A Comparison of Green and Non-Green Sectors in Korea”. Energies 12 (12): 2296. https://doi.org/10.3390/en12122296.
Part 3: Making lifelong learning systems deliver
Part 3 turns to how countries can design and sustain systems that make lifelong learning effective in practice within the world of work. Drawing on new ILO surveys and a global meta-analysis of training programmes, it identifies four pillars of success: strong governance and coordination; accessible and flexible learning pathways; integrated programmes that combine skills development with complementary support measures; and sustainable financing. Making lifelong learning a practical reality requires long-term commitment and social dialogue to ensure that learning is recognized and protected as a public good.
5.1. Introduction
Having identified which skills matter most for improving employment outcomes and enhancing adaptability in Chapters 3 and 4, Chapter 5 turns to the lifelong learning systems and programmes needed to support the development of these skills. Despite widespread recognition of the importance of lifelong learning, both its provision and participation remain uneven and constrained across many contexts. Understanding why lifelong learning has not been more widely promoted and accessed – and what can be done to overcome persistent barriers – is essential to improving the breadth, relevance and quality of learning offers and to strengthening labour market resilience.
Promoting lifelong learning is a complex policy challenge, shaped by a combination of institutional and individual-level constraints. Individuals face persistent barriers, such as time constraints, financial costs, low perceived returns on learning and limited access to flexible and relevant learning options. On the institutional side, fragmented governance, weak coordination across sectors and stakeholders, underdeveloped quality assurance mechanisms and persistent implementation gaps hinder the development and delivery of inclusive and effective lifelong learning systems. Without addressing these systemic challenges, even well-designed learning initiatives are unlikely to achieve their full potential.
To better understand these issues, this chapter draws on two new surveys developed specifically for this report. The ILO lifelong learning surveys, introduced in Chapter 2, offer rich insights into individuals’ learning needs, motivations, perceived returns and obstacles to participation for selected countries. Complementing this, a new ILO institutional lifelong learning survey – the first of its kind on a global scale, covering answers from ministries, national skills authorities and social partners in 21 countries around the world73 – explores the institutional architecture behind lifelong learning systems, shedding light on national strategies and governance mechanisms, financing models, stakeholder engagement, standards and recognition processes. Together, these surveys provide a unique perspective into how individual and institutional factors shape lifelong learning outcomes.
The chapter proceeds as follows. Section 5.2 maps the main barriers to lifelong learning participation and delivery, drawing on the two survey databases to identify where and why access remains limited. Section 5.3 explores what makes lifelong learning systems effective in practice. It first examines system-level enablers (such as governance arrangements, coordination mechanisms across ministries and institutions, and social partners involvement) that underpin inclusive and responsive systems. It then turns to skills development programmes, presenting a new meta-analysis of global impact evaluations to identify what types of training interventions and skill sets are most effective, and for which groups. Section 5.4 addresses the question of sustainable and equitable financing, exploring financing models for lifelong learning and drawing from effective global practices to shed light on existing cost-sharing and investment mechanisms that can support a lifelong learning agenda. Section 5.5 concludes with key insights and recommendations for building lifelong learning systems that deliver for individuals, enterprises and society at large.
5.2. Challenges to lifelong learning provision and adoption
Access to lifelong learning remains a critical condition for inclusive economic and social participation – particularly as workers and businesses face accelerating demands for upskilling and reskilling. Yet, despite its recognized importance, many people across all country income groups face persistent barriers that prevent them from engaging in learning opportunities when they need them the most. Lifelong learning takes many forms, from formal education and training to non-formal learning (like structured workplace learning) and informal experiences, such as learning by doing. Participation in these diverse pathways is shaped not only by individual circumstances, but also by the design, accessibility and coordination of the systems that support them. This section explores the barriers – both individual and institutional – that continue to limit the reach and inclusiveness of lifelong learning.
5.2.1. Barriers hindering individuals’ participation
There is a significant unmet demand for lifelong learning in the world of work. As exemplified by ILO lifelong learning survey data presented in Chapter 2,74 many individuals do not participate in any regular training activity. As such, 93.4 per cent of respondents in Bangladesh and 99.3 per cent in Fiji reported that they had not received any work-based training in the past 36 months (that is, outside of the formal education system).75 Of these, 49.8 per cent in Bangladesh and 87.4 per cent in Fiji believed that they would need training to perform their work better. When individuals perceived a need for training, they often lacked adequate access. This is true for women and men, different age groups, unemployed persons as well as formally and informally employed workers (figure 5.1).
-
Figure 5.1. Share of individuals without adequate access to training in Fiji and Bangladesh, by sex, age group and employment status, 2025 (percentage)
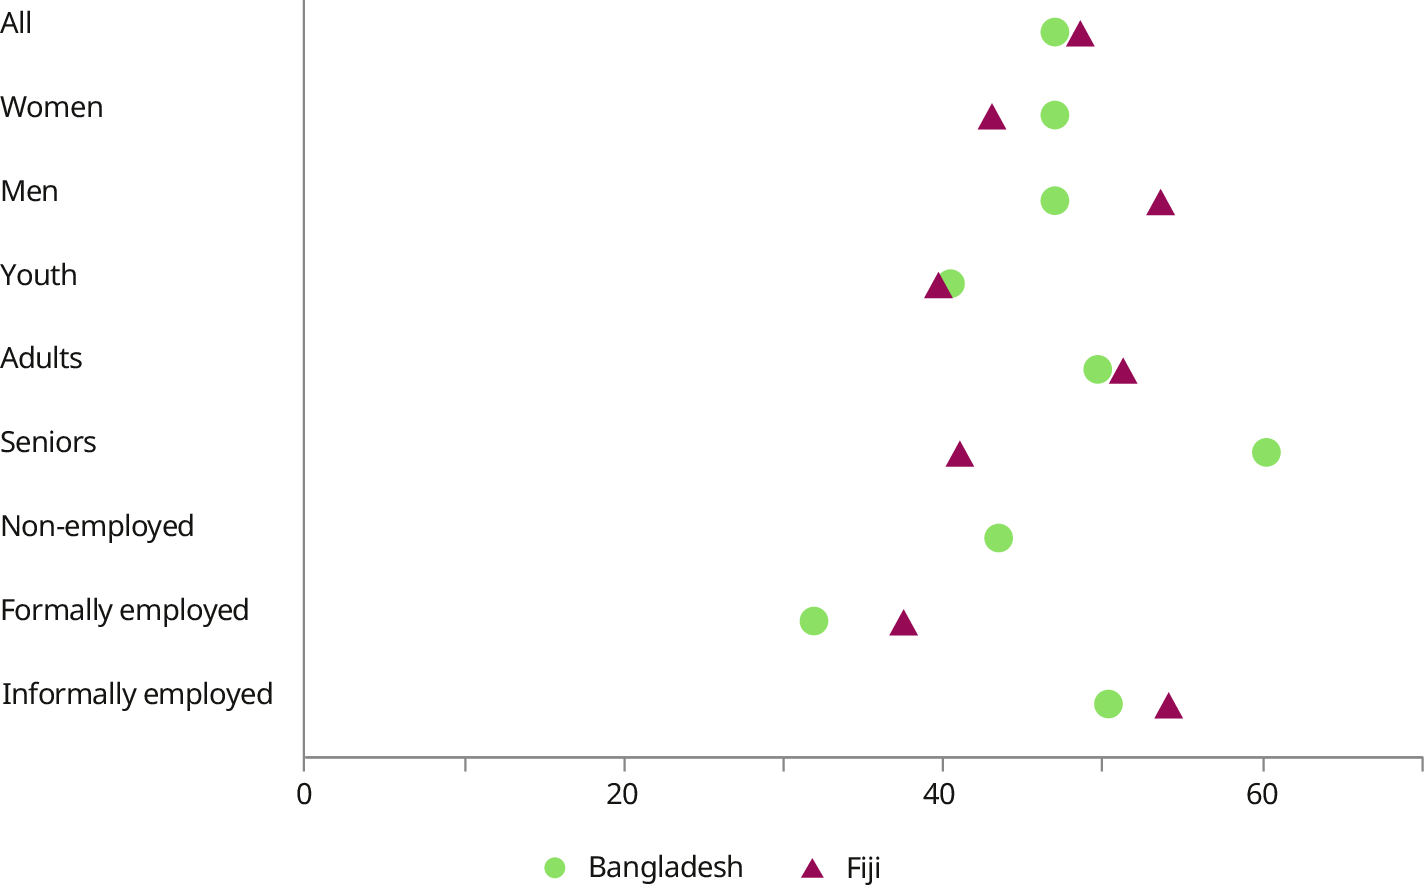
Note: This graph includes individuals who have not participated in any training in the past 36 months but believe that training is necessary to perform their job better. In Fiji, the information was elicited for employed individuals only. Youth include ages 15 to 24; adults, ages 25 to 54; and seniors, ages 55 to 64.
Source: ILO lifelong learning survey data from 2025.
In other countries and regions, there is likewise a clear unmet demand for training. According to the OECD’s Survey of Adult Skills, an average of 23.4 per cent of workers in 31 OECD countries reported facing barriers to participating in job-related learning over the past year. Of these, 10.5 per cent wanted to participate but did not, while 12.8 per cent wished to engage in more job-related training than they did. The extent of unmet demand varied widely across countries – from 4.9 per cent in Poland to 36.1 per cent in Estonia (OECD 2025). Similarly, school-to-work transition surveys from African countries indicate that around 28 per cent of workers aged 15 to 20 felt under-skilled in their current jobs. This share ranged from negligible levels in Egypt to over 40 per cent in Madagascar (ADB 2020).
Figure 5.2 outlines a range of barriers that hinder individuals’ participation in lifelong learning within the world of work, with specific insights from Bangladesh and Fiji. Possible demand-side barriers, which stem from workers’ personal circumstances, include financial constraints, lack of time, unpaid care duties, health issues, limited awareness of learning options and unmet entry requirements. In Bangladesh, financial constraints and lack of time were particularly relevant, whereas in Fiji, each of these barriers was mentioned by a meaningful share of respondents. Evidence from the OECD Survey of Adult Skills (OECD 2025) highlights similar obstacles, with time constraints, family responsibilities and financial limitations ranking as the top three reasons preventing participation in job-related learning.
-
Figure 5.2. Share of selected demand- and supply-side barriers to training, Bangladesh and Fiji, 2025 (percentage)
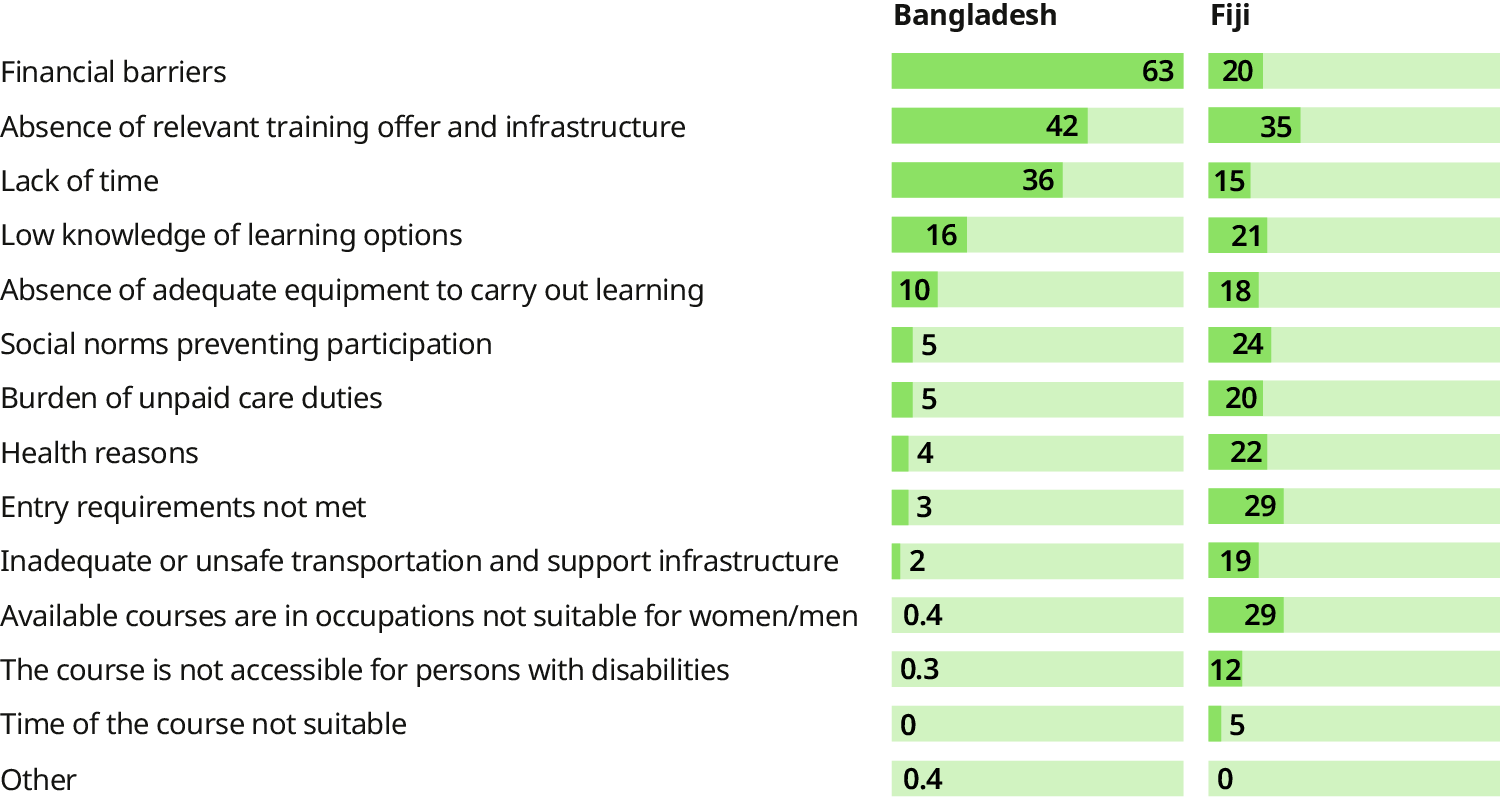
Note: This graph includes individuals who have not participated in any training in the past 36 months but believe that training is necessary to perform their job better. In Fiji, the information was elicited for employed individuals only. Multiple responses were possible.
Source: ILO lifelong learning survey data from 2025.
Lack of motivation can be another demand-side barrier. A study from Sweden, for example, highlights that jobs which do not require learning or offer chances to grow professionally do not encourage workers to invest in training (Korpi and Tåhlin 2021). Low motivation and limited learning opportunities then feed into each other, stressing the importance of encouraging employers to design jobs in ways that promote skills development.
Although they are rooted in individual circumstances, demand-side barriers are generally linked to institutional factors. This implies a decisive role for policy in supporting lifelong learning participation (see also section 5.4). For instance, time constraints and care responsibilities underscore the need for paid education leave, investments in the care economy and an equitable sharing of unpaid care work between women and men – principles reflected in the Paid Educational Leave Convention, 1974 (No. 140), and the 2024 resolution concerning decent work and the care economy (ILO 2024). Since paid educational leave may be accessible only to formally employed workers, contributory and non-contributory social protection also plays a key role and should be complemented with possibilities for lifelong learning, such as “active labour market policies, including training and other measures” as suggested in the Social Protection Floors Recommendation, 2012 (No. 202), Para. 14(d). In addition, career guidance services can bridge information gaps and connect workers to training offers aligned to their needs and qualifications (ILO 2023a). Finally, financial constraints, given their importance, are addressed in section 5.4.
Another set of barriers shown in figure 5.2 stems from the supply-side – that is, from the institutions responsible for providing and facilitating lifelong learning. These include the lack of relevant training offers, inadequate infrastructure and equipment, inaccessible facilities for persons with disabilities, unsuitable course schedules and courses that are not tailored to either women or men. Evidence from Latin America and the Caribbean illustrates a broader global pattern: the importance of aligning training with labour market needs. In many cases, mismatches between offered trainings and skills demanded by enterprises are rooted in information gaps between stakeholders (Fiszbein, Oviedo and Stanton 2018). Additionally, limited internet access and a lack of digital devices – especially among young people in marginalized communities – further restrict access to learning (ILO 2022). The ILO’s Strategy on skills and lifelong learning (ILO 2023b) highlights further areas for policy action, including robust systems for quality assurance, recognition of prior learning (RPL) and coherent delivery across institutions.
Some of these challenges are closely related to a country’s level of economic prosperity and socio-economic inequality (ILO 2025). The same applies to a third category of barriers shown in figure 5.2, which originate from broader institutional factors. These include unsafe or inadequate transport options and restrictive social norms that discourage participation. Addressing these barriers requires a systemic approach to building inclusive lifelong learning provision, along with sustained financial investment – topics explored in the sections that follow.
5.2.2. Institutional barriers to delivery
Institutional barriers can discourage individuals from participating in lifelong learning, frequently reflecting deeper structural and systemic challenges. Expanding access to lifelong learning requires the development of inclusive and flexible learning pathways (see box 5.1) that support diverse and adaptable forms of learning. These pathways should enable individuals to skill, reskill and gain qualifications that enhance their chances of securing decent work and sustainable livelihoods as well as fulfilling personal aspirations. However, institutional barriers – such as systemic rigidities (for example, low permeability between learning tracks or reduced pathways for adults to access training), capacity constraints and weak coordination – often hinder the development of such pathways.
Flexible learning pathways are arrangements within lifelong learning systems that enable individuals to acquire knowledge and skills, develop attitudes and gain qualifications by navigating education, training, work and community-based experiences in non-linear ways. These pathways can combine formal education and training, workplace training, or online or blended learning, and include career guidance as well as systems for validating and recognizing prior learning. They offer flexible and equitable access to learning opportunities for individuals of all ages and backgrounds and are instrumental for achieving lifelong learning outcomes, such as social inclusion, career development, improved livelihoods and enhanced productivity.
Source: Carton and Hofmann (2023); ILO (2023b); Tomlinson et al. (2018); UNESCO (2022a).
Learning opportunities outside traditional, linear education pathways are steadily expanding. Many systems now offer adults the possibility to (re)engage in education through “second chance” programmes to complete compulsory education (OECD 2024). However, this expansion has not fully resolved barriers for adults seeking occupational qualifications – such as unmet admission criteria in TVET courses, unaffordable costs or the need for only specific components of a course. For decades, education and training policies have prioritized formal basic and secondary education, often neglecting flexible options for adults and older youth (UNESCO 2022a). Moreover, as illustrated by the new ILO institutional lifelong learning survey (which covers a sample of 21 countries across all income levels from Africa, the Americas, Asia and Europe), lifelong learning is understood differently by different countries and is still frequently perceived as separate from basic education (figure 5.3), which contributes to underinvestment in vital areas, such as work-based and adult learning (see section 5.4.1 for a discussion on funding gaps).
-
Figure 5.3. Elements of lifelong learning according to the official understanding, 2024–25 (number of countries)
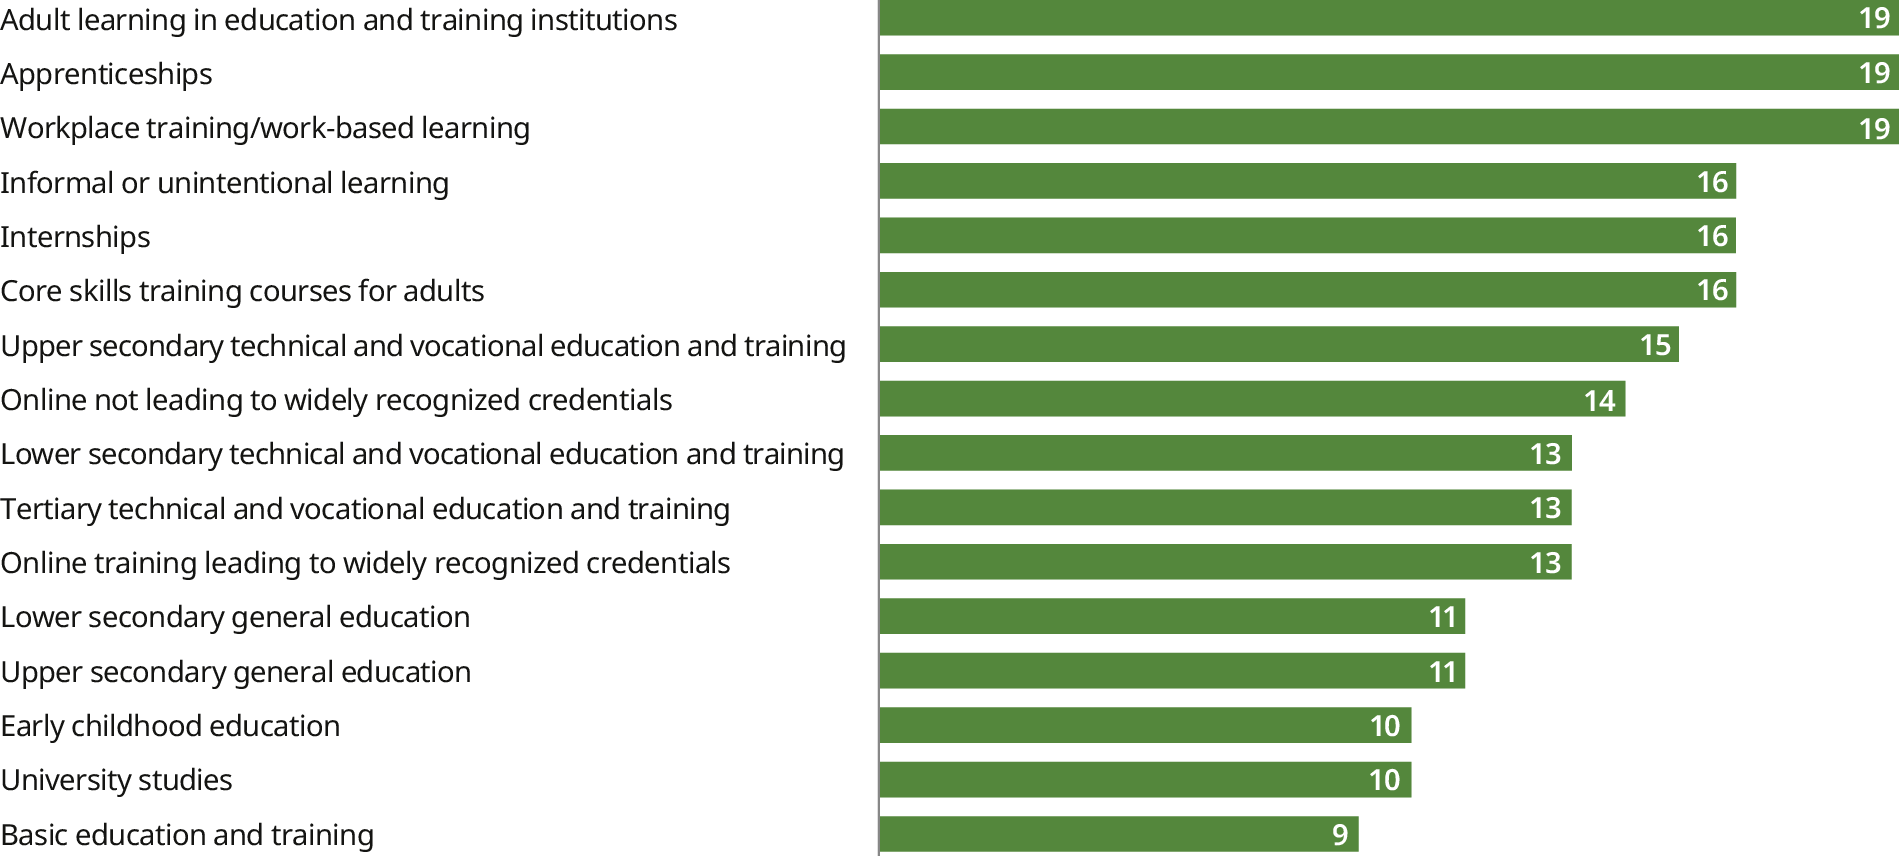
Note: The figure shows responses from ministries, national skills authorities and social partners from 20 countries that answered the multiple-choice question: What does lifelong learning include according to the official understanding?
Source: ILO institutional lifelong learning survey.
Participation in general secondary education and TVET, as well as higher education, often involves significant costs – not only tuition fees, but also time commitments, expensive materials and tools, and indirect expenses, such as transportation, food, childcare or temporary income loss. In this context, limited access to well-designed learning entitlements – such as scholarships or individual learning accounts, which are rarely available – can pose substantial barriers, particularly for adults and vulnerable groups. While more than half of the countries surveyed reported some form of entitlement to educational leave, a significant minority – around 40 per cent – do not (see figure 5.4 and section 5.4). Among countries with such provisions, most report offering paid leave, though it remains unclear whether these schemes effectively cover the costs borne by learners. Notably, only 35 countries had ratified Convention No. 140 at the time of writing, reflecting a limited global commitment to making lifelong learning a guaranteed right for workers.
-
Figure 5.4. Share of countries with entitlements to educational and paid leave, 2024–25 (percentage)
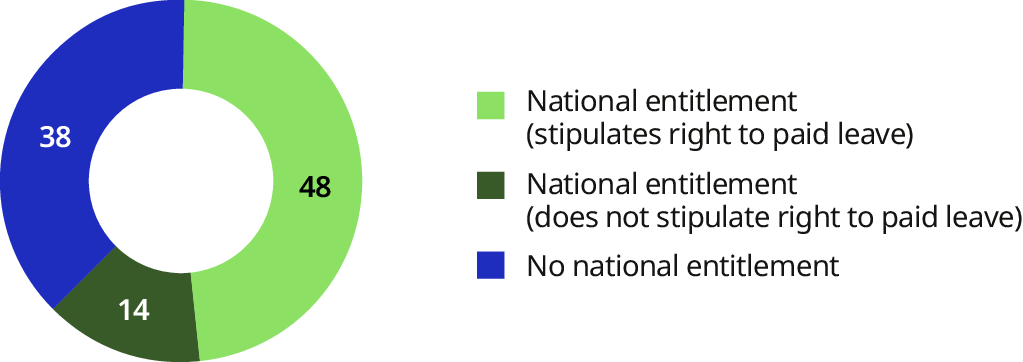
Note: This figure shows responses from ministries, national skills authorities and social partners from 21 countries that answered the questions: Is there a national entitlement to educational leave for all workers? and, if answered “Yes”, does this entitlement also stipulate rights regarding paid educational leave?
Source: ILO institutional lifelong learning survey.
As noted, institutional barriers to lifelong learning are often rooted in rigid entry requirements for formal education and training – such as limited offer and weak permeability between learning tracks – which fail to accommodate the diverse backgrounds of learners, particularly in terms of age, prior experience or employment status. This rigidity restricts access to qualifications, especially in TVET. For adults with relevant work experience – whether in formal or informal settings – but without formal credentials, the ability to assess and validate existing skills becomes critical. RPL can play a transformative role by enabling individuals to gain full or partial qualifications through structured assessment, validation and certification. An example of such progress in India is illustrated in box 5.2.
India’s RPL system, launched in 2015 under the Government’s flagship initiative Skill India Mission, is administered through the Pradhan Mantri Kaushal Vikas Yojana (PMKVY). The programme is overseen by the Ministry of Skill Development and Entrepreneurship and involves federal participation through the State Skill Development Missions.
RPL aims to formally recognize and align the competencies of workers in informal employment with the standardized National Skill Qualification Framework, thereby enhancing their employment opportunities and creating flexible pathways to access qualifications. The main target groups include artisans, carpenters, weavers and construction workers who have acquired skills informally or through traditional apprenticeships.
In addition to skills assessment and certification, the RPL process includes socio-emotional skills training and short bridging courses to close identified skills gaps. Under RPL, between 2015 and March 2022, more than 6.4 million beneficiaries were certified across 37 different sectors. According to a PMKVY 2.0 evaluation, certified individuals experienced a 25 per cent increase in income after certification.
Source: Government of India (2025, n.d.); NSDC (2019).
Encouragingly, 75 per cent of surveyed countries report having developed RPL systems, with 73 per cent of those allowing for both full and partial qualification recognition. However, the maturity, occupational coverage and actual use of these systems remain unclear. Evidence from repeated monitoring in Europe between 2004 and 2023 shows that progress in implementing RPL has been slow and usage limited (Cedefop 2024). Furthermore, only a minority of surveyed countries have digitalized RPL processes despite their potential to expand access for vulnerable groups.
Alongside institutional challenges, individual perceptions and constraints also influence participation in formal education and training throughout life. In many low- and middle-income countries, the economic returns to formal education at all levels are generally higher than in high-income countries. However, this is not always reflected in higher investment in education. Contributing factors include both limited resources among potential participants and prevailing misperceptions about the value of education. Research shows that individuals in lower-middle-income countries – particularly the most vulnerable – often undervalue the benefits of secondary education (Agarwal and Chakravarty 2021; Jensen 2010). Additionally, both private and social returns from secondary education are frequently reported as lower than those in primary education (Psacharopoulos and Patrinos 2018), reinforcing the perception among policymakers that returns, especially in vocational tracks, are limited. Although TVET and work-based learning are associated with higher short-term gains in employment and income returns, research suggests that this advantage diminishes over time (Agarwal and Chakravarty 2021; Jensen 2010). These pathways also often face stigma among youth and their families (UNESCO 2018). Even when vocational and continuing education and training opportunities are viewed favourably, participation remains low, as shown in recent EU surveys (Cedefop 2022a).
An important institutional barrier to lifelong learning is the limited dissemination of information about flexible learning options and RPL opportunities. This problem is particularly acute for vulnerable groups, who are often disconnected from mainstream education, employment or social protection services (Cedefop 2018; ILO 2023c). Career guidance and outreach services are central to addressing these gaps, but they remain underdeveloped in low- and middle-income countries. A total of 84 and 78 per cent of surveyed countries report providing career guidance for students in formal education and training and for unemployed individuals, respectively, reflecting a predominance of established education and labour market services. However, national reviews (ETF 2022; ILO 2021a) highlight persistent shortcomings in coverage, professionalization and linkages with employers and local communities. Furthermore, half of the countries offer professional career guidance through job-matching platforms, while even fewer extend career guidance support to inactive youth and adults, and workers in both formal and informal employment – key target groups for adult learning, work-based learning and RPL. On a more positive note, nearly 60 per cent of countries report offering some form of guidance to informal economy workers, including support for apprenticeships and initiatives. Overcoming individual and institutional barriers to participation is essential not only to expand access, but also to ensure that lifelong learning systems operate effectively and equitably. Unless these challenges are addressed (particularly those affecting individuals most disconnected from education and labour market institutions), efforts to broaden the reach and impact of skills development will remain limited. Section 5.3 explores what makes lifelong learning systems effective, focusing on how institutions and stakeholders can work together to deliver meaningful outcomes for all and how skills programmes can be made more effective.
5.3. Performance and effectiveness of lifelong learning systems
The performance of lifelong learning systems reflects how well they enable individuals to develop skills, knowledge and attitudes needed to access decent work, secure livelihoods, participate in society and achieve personal and professional growth. A functioning system ensures coordinated policies and services; inclusive, diversified and high-quality learning opportunities; and clear links between learning and social and labour market outcomes.
This section explores the functioning and performance of lifelong learning systems, focusing first on the system-level factors – such as governance arrangements and coordination mechanisms among ministries, institutions and social partners – that promote coherence and inclusiveness within national learning ecosystems. Then, it turns to a more empirical assessment of the effectiveness of skills programmes and the design and implementation characteristics that drive success.
5.3.1. Coordination and governance as drivers of performance
As discussed in Chapter 1, lifelong learning rarely operates as a cohesive system. Education, training and support services are typically spread across multiple ministries and sectors, leading to fragmented responsibilities, limited coordination among institutions and enterprises, and ultimately leading to inefficiencies and weak policy implementation (ILO 2020).
While formal assessments remain limited, several coordination and governance features are widely recognized as critical for improving system performance. These include a shared national vision or strategy, inclusive coordination bodies at national and sectoral levels, shared standards and interoperable systems for information exchange, and mechanisms for monitoring and evaluation. Without clear mandates, strong interinstitutional linkages and meaningful stakeholder engagement, systems risk fragmentation and ineffectiveness.
Information on lifelong learning governance remains scarce, particularly in low- and middle-income countries. The ILO institutional lifelong learning survey provides new and valuable insights into how coordination is structured across different national contexts. According to the survey, most participating countries report having some form of interministerial coordination mechanism for skills and lifelong learning. Over half of the countries report tripartite mechanisms, involving representatives from both employers and workers. A most commonly reported arrangement is a coordination body operating under a specific ministry, which acts as a focal point for coordination. This reflects trends identified in earlier research (UNESCO and ILO 2018). A notable share of countries also reports cross-ministerial public agencies playing this role, while informal arrangements or independent agencies supervised by governments are less common.
The effective development of skills systems and the promotion of lifelong learning fundamentally depend on robust social dialogue and the comprehensive involvement of social partners (employers’ and workers’ organizations) in governance and coordination arrangements (see box 5.3 for a national example). This involvement helps to ensure that systems: (i) support inclusive access to learning opportunities; (ii) align with current and future labour market needs; and (iii) are underpinned by robust institutions, participatory quality assurance processes and equitable financing mechanisms. In total, 76 per cent of the countries surveyed report that social partners are jointly involved in the development and implementation of skills and lifelong learning policies, primarily through consultative and policy-design roles. Their participation is strongest in areas such as consultations for defining skills policies and frameworks, as well as standard setting and system design, including competence and qualification standards (around 80 per cent). However, their involvement tends to be weaker in implementation-related activities, particularly in career guidance (less than 30 per cent). Very few countries report social partner participation in managing funding mechanisms (around 26 per cent for national/sectoral funds and 11 per cent for local/regional funds) – a missed opportunity, given their proximity to evolving labour market needs.
Singapore has established a well-coordinated tripartite system for TVET and skills development. The Singapore Business Federation, the National Trades Union Congress and other employers’ organizations are represented on the Future Economy Advisory Panel, which provides strategic guidance and recommendations to SkillsFuture SG. SkillsFuture SG is a statutory board under the Ministry of Education with the mandate to promote lifelong learning and skills development and includes tripartite representation in its governance.
Key initiatives led by SkillsFuture SG include individual learning accounts, digital skills passports, worker upskilling in partnership with employers and trade unions, and the promotion of high-quality training provision. Evidence on the impact of some these initiatives – including participation outcomes and firm-level effects – is discussed in section 5.4.
Source: SkillsFuture SG, “SkillsFuture Singapore”.
Sectoral skills bodies are another critical component of functioning governance, helping to align training with sector-specific realities. Their presence has grown in recent years (ILO 2021b), with around 70 per cent of countries reporting such bodies across sectors. They are especially common in services (for example, tourism, health, finance and education) and in key productive sectors (for example, construction, energy, manufacturing and trade). Typically government-led and often tripartite in nature, these bodies are primarily responsible for generating labour market intelligence and advising on qualifications and standards. Many are also involved in coordinating sectoral training initiatives (including apprenticeships), though fewer contribute to curriculum development. Their engagement in quality assurance and career guidance is moderate, reported in around half of countries. However, these bodies face multiple challenges and their role in managing training funds remains limited even though employers are often best positioned to define funding priorities. Furthermore, few countries regularly and transparently evaluate their performance. The adoption of shared standards (such as those related to certification, qualifications and training) is another fundamental aspect to ensure good governance. As discussed in Chapter 1, lifelong learning has expanded in the world of work, often complementing or substituting formal education and training. Its less institutionalized nature offers greater flexibility but also raises concerns about quality. This fundamental tension shapes the development of lifelong learning systems: while they can respond flexibly and inclusively to labour market and social needs, they require mechanisms to ensure quality and relevance. The effectiveness of lifelong learning systems is expected to depend largely on policy reforms that strike a balance between flexibility and quality.
To build legitimacy and foster trust in lifelong learning, especially among potential employers and learners, many governments have adopted measures modelled on formal education and training systems (see figure 5.5). These typically include: (i) setting qualification, training and competence standards; (ii) establishing quality assurance mechanisms; and (iii) offering certification and recognition processes. According to the ILO institutional lifelong learning survey, most countries report having qualification systems in place – often developed with social partners. Micro-credentials are a building block of certification, most often associated with the completion of short trainings. Despite their rapid growth, particularly through online platforms, only 55 per cent of countries report having frameworks that formally reference these micro-credentials within their national qualification systems. Without clear referencing and regulation, the value of micro-credentials on the labour market remains uncertain and quality assurance cannot be guaranteed.
-
Figure 5.5. Standards and certifications used in education and training, 2024–25 (number of countries)
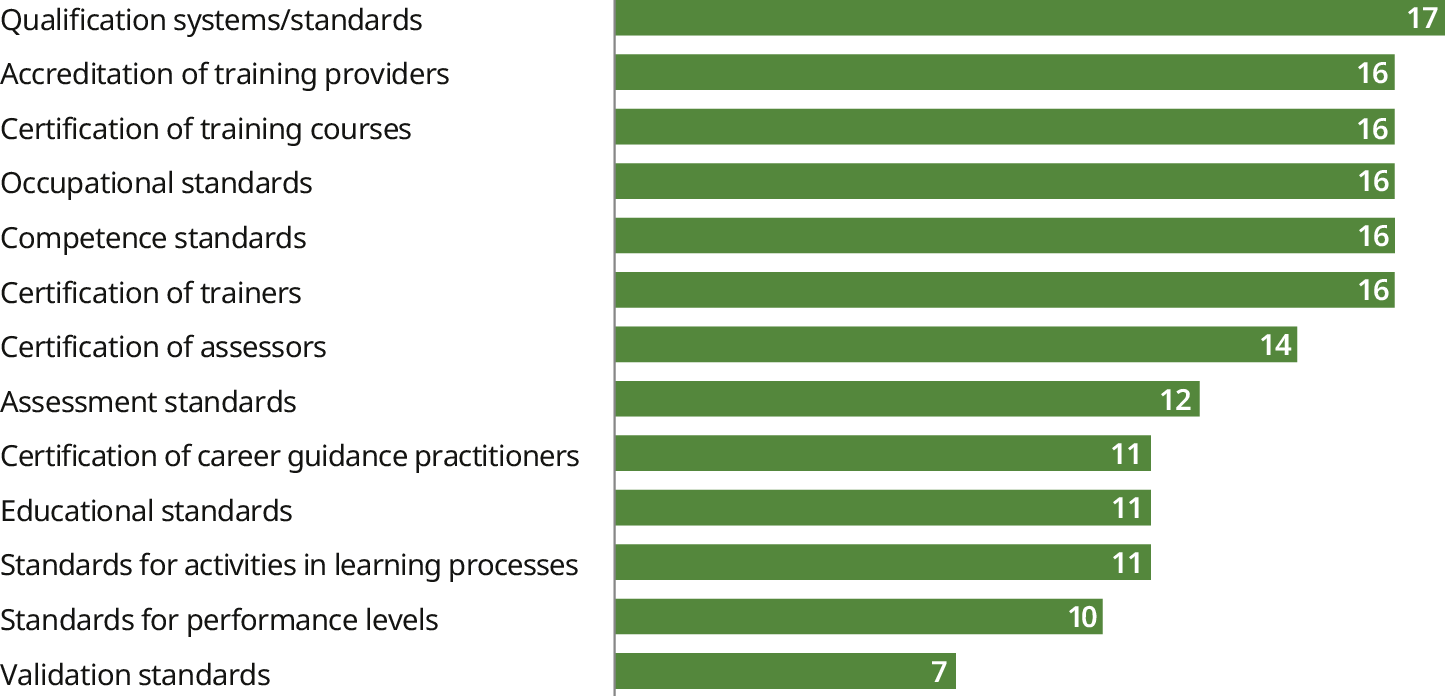
Note: The figure plots combined responses from 20 countries that responded to the questions: Is there a national qualification system or framework? What standards exist for education and training? Is there a national mechanism to (options on certification and accreditation)?
Source: ILO institutional lifelong learning survey.
More broadly, online and hybrid training has expanded considerably, improving access to targeted skills development. While 70 per cent of the countries report having national digital platforms for technical and vocational training, concerns remain about their quality and certification – especially in occupation-specific training, where only 40 per cent report a high level of digitalization of certified content. Across surveyed countries, the most commonly reported quality assurance measures include: (i) standards for the qualification system or qualification itself; (ii) accreditation of training providers; (iii) certification of training courses; and (iv) occupational and competence standards. Professionalization of trainers via certification processes is also a popular measure, although slightly less applied in support activities, such as RPL and career guidance. In contrast, performance levels and validation standards – critical for increasing the accuracy and comprehensiveness of RPL – are less common, reflecting underdeveloped systems in this area. Social partners are mainly involved in updating occupational and competence standards, while mechanisms for certifying training providers and courses are relatively widespread. However, fewer countries report having systems in place to certify career guidance professionals and skills assessors.
As countries continue to expand and refine their lifelong learning systems, understanding what policies work – and why – becomes increasingly important. Section 5.3.2 turns to this question by examining the effectiveness of skills programmes through available evidence, highlighting what works in practice and under what conditions.
5.3.2. Improving skills programmes: What we know from evidence
Within lifelong learning systems, skills programmes have been increasingly implemented worldwide to equip workers with the competencies needed to navigate global transformations and adapt to a changing world of work. Yet, despite these efforts, skills mismatches persist. Earlier assessments have reviewed the effectiveness of broad training interventions as part of the active labour market programme framework (Card, Kluve and Weber 2018; Escudero et al. 2019; Kluve et al. 2019), but evidence focused specifically on different types of skills programmes remains comparatively scarce. This raises fundamental questions: Which types of skills programmes are most effective in developing the competencies demanded by evolving labour markets? and What design and implementation characteristics enhance their success?
In particular, the available evidence of the impacts of development programmes is fragmented. Much more is known about the effects of formal TVET for adults than about informal apprenticeships or other non-standardized forms of work-based learning (Eichhorst et al. 2015). Similarly, most studies focus on technical and cognitive skills, while socio-emotional competencies – such as character and social skills – have only recently attracted systematic attention (Deming 2022).
There are also important gaps in terms of outcomes assessed. While economic impacts – such as the effects of adult learning on earnings and employment – have been extensively analysed, other dimensions (including work quality and well-being) remain underexplored. Some meta-analyses – such as Escudero et al. (2019) – have examined these broader outcomes but they do so in the context of ALMPs that include training among other interventions. In contrast, meta-analyses focusing specifically on various types of training programmes rarely assess these dimensions, leaving important gaps in our understanding of training impacts (Chinen et al. 2017; Haelermans and Borghans 2011; Stöterau, Kemper and Ghisletta 2022).
Finally, the geographical coverage of evidence is highly uneven. Evidence remains scarce for low- and middle-income countries, where skills systems are often undergoing rapid change and face urgent policy needs (Eichhorst et al. 2015; Hofmann et al. 2022). Beyond these gaps, there is limited understanding of why and under what conditions some skills programmes succeed while others do not. While descriptive studies highlight promising programmes, few systematically test which design features, target groups or contextual factors account for their success.
To address these gaps and better inform policy, this section draws on the existing evidence to explore three critical dimensions of effective skills development:
-
the implementation features that shape programme outcomes;
-
the types of skills fostered and their relative effectiveness; and
-
the differential impacts of training across population groups.
This will pave the way to the following section, which presents results from a new meta-analysis conducted for this report, offering fresh and consolidated insights into what works in skills development across diverse contexts.
The importance of design and implementation characteristics
Evidence suggests that the type of skills programme plays an important role in determining its effects. In Italy for instance, Pastore and Pompili (2019) find positive effects for on-the-job training, but no impact for off-the-job training. In France, Crépon et al. (2014) emphasize the value of combining classroom instruction with hands-on work experience to improve individuals’ employment outcomes. Alfonsi et al. (2020) compare the effect of offering workers either vocational training or firm-provided training in Uganda. While firm-provided training gains materialize quickly but fade faster over time, vocational training gains emerge slowly but are long-lasting. Regarding internships, more specifically, De la Rica and Gorjón (2022) find that providing internship contracts to young educated workers has a positive impact on job stability. Still, the extent to which specific training types systematically outperform or complement other forms of training remains an open question that will be tested systematically in the next section.
A large body of evidence on skills programmes also points to the importance of design in shaping employment outcomes. Formal training programmes – those leading to recognized qualifications – are consistently associated with positive labour market impacts in high-income countries. For example, in Denmark (Foged, Hasager and Peri 2024), Germany (Giesecke and Schuss 2019; Grunau and Lang 2020) and Italy (Ghirelli et al. 2019), certified vocational education and training improves employment, earnings and job stability, particularly for women, older adults and low-qualified workers. In lower-income settings, the evidence is more limited. Nevertheless, Alfonsi et al. (2020) also find that vocational training in Uganda generated longer-lasting benefits than firm-provided training, a result attributed in part to certification. This points to the potential value of formal qualifications but raises the question of whether such credentials consistently deliver better outcomes across settings – a key hypothesis tested in the meta-analysis in the following section.
The benefits of policy complementarity extend beyond integrating different types of training. Combining training with broader labour support measures – such as social protection and ALMPs – is key to help workers navigate the many transitions throughout their careers. In Europe and the United States, evidence shows that bundling training with job search assistance or aligning programmes with employer demand enhances and sustains impacts (Blázquez, Herrarte and Sáez 2019; Davis and Heller 2020). In Bangladesh, Das (2021) finds that vocational training raised employment, but it improved job quality only when coupled with broader labour market policies. Similarly, in Argentina and Colombia, training paired with job search assistance improved both employment rates and earnings (Aramburu, Goicoechea and Mobarak 2021) – a pattern echoed in multiple studies highlighting the added value of integrating training with job placement support – especially for women and disadvantaged youth.
Financial support alongside skills development is another determinant of participation and effectiveness. Training entails direct and opportunity costs, and without adequate support, many – particularly low-income workers – cannot benefit. This dynamic is well documented in the context of ALMPs, which tend to be more effective when combined with income support (Asenjo, Escudero and Liepmann 2024; ILO 2019). Financial support is equally critical alongside skills programmes. For instance, in the Democratic Republic of the Congo, Angelucci, Heath and Noble (2023) find that employment and earnings improved significantly only among women who received both training and cash support. In Uganda, Alfonsi et al. (2024) find that offering vocational training or cash grants alone had limited impact, but combining them with job-matching support led to lasting gains. Similar results are found in Afghanistan (Bedoya et al. 2019) and Sri Lanka (de Mel, McKenzie and Woodruff 2014), where bundled interventions improved livelihoods and incomes more than single components. These findings suggest that providing a series of training components in combination is more effective, but more research is needed to identify which combinations work best.
Overall, the evidence suggests that the design of skills programmes plays an important role in shaping their effectiveness. Those that integrate different training modalities – such as classroom and practical components – or that lead to formal certification often yield better employment outcomes, though results vary by context and target group. Complementary measures like job search assistance, financial support and social protection benefits also appear to enhance impact, particularly for disadvantaged groups. While these findings are encouraging, more systematic analysis is needed to understand which design and implementation features consistently drive success. The following section addresses this gap through a meta-analysis of impact evaluations across diverse settings.
Training content matters
Beyond the type and design of training programmes, the specific skills they aim to develop – whether cognitive, socio-emotional or manual76 – also appear to influence their effectiveness. Programmes focused on manual skills – typically targeting trades or technical competencies – often generate significant and lasting improvements in employment, earnings and job quality, especially when they incorporate practical components, such as internships or apprenticeships, that enhance work readiness. For instance, Calderone et al. (2022) find that a Tanzanian programme combining vocational and life skills training for disadvantaged youth led to sustained improvements in employment, earnings, job quality and non-cognitive attributes, such as self-efficacy and aspirations.
Cognitive and technical training programmes – which build business, management or digital skills – also improve employability. In the digital realm, Aramburu, Goicoechea and Mobarak (2021) show that coding bootcamps targeting women in Argentina and Colombia significantly boosted ICT employment and earnings, particularly for those without caregiving responsibilities or with prior digital exposure. Studies in Colombia (Barrera-Osorio, Kugler and Silliman 2023) and Côte d’Ivoire (Crépon and Premand 2025) further underscore the importance of market alignment: vocational training that links to labour market needs – such as ICT or sector-specific technical courses – tends to deliver stronger and more resilient employment outcomes. These examples highlight the potential of short-term, targeted technical training to open pathways into dynamic, high-demand sectors.
Fostering socio-emotional skills has become a vital complement to vocational education, enhancing both employability and empowerment. They appear particularly effective when addressing psychosocial barriers and when they are integrated with technical content or work experience. For instance, initiatives in the Dominican Republic and Liberia significantly improved women’s employment, earnings and self-esteem (Acevedo et al. 2020; Adoho et al. 2014). In Colombia, integrated curricula outperformed training on technical or socio-emotional skills alone, especially for women and disadvantaged youth (Barrera-Osorio, Kugler and Silliman 2023), while training in non-cognitive skills in Senegal improved job retention and wages among low-skilled workers (Allemand et al. 2023). However, the success of socio-emotional training may be highly context-dependent: in Jordan, socio-emotional training improved young women’s confidence but not employment due to restrictive gender norms and weak labour demand (Groh et al. 2016).
Finally, large-scale evidence confirms that integrated training – combining technical, cognitive and socio-emotional skills with work-based learning or job placement – tends to outperform single-focus interventions. Studying young women in Colombia, Attanasio, Kugler and Meghir (2011) report gains in formal employment and earnings from combining classroom training with socio-emotional skills acquisition and internships. In Nepal, Chakravarty et al. (2019) find that vocational and socio-emotional skills training combined led to significant improvements in non-farm employment and earnings, especially for women. Similarly, in Liberia, Adoho et al. (2014) show that combining life skills and either job or business training improved not only earnings and employment opportunities but also empowerment and self-confidence.
These findings underscore both the potential and complexity of multidimensional skills development: integrated programmes that combine cognitive, technical and socio-emotional training tend to deliver stronger results, particularly for disadvantaged groups. However, we still lack a clear understanding of which combinations work best in different contexts. The meta-analysis that follows takes a systematic approach to unpacking these dynamics.
Ensuring inclusive impacts in skills development
Ensuring that skills programmes are effective for all is essential to promote inclusive learning and expand access to qualifications – particularly for vulnerable groups. A growing body of evidence highlights differential impacts by sex, age and vulnerability status. Women often experience greater gains, especially when programmes combine technical and socio-emotional skills or include job placement support. For example, Acevedo et al. (2020) report improved employment outcomes for women in the Dominican Republic, while Aedo and Pizarro (2004) find that Chile Joven, a youth training and employability-enhancing programme, was especially effective for young women.
Youth-targeted programmes tend to show positive results, although these vary by context. Kluve et al. (2019) find that, in low- and middle-income countries, training significantly improves employment and income. In contrast, such programmes in high-income countries tend to yield only modest gains. Programmes targeting more disadvantaged youth – such as those with low education levels or limited labour market access – often deliver stronger results. Kluve et al. (2019) report marginally higher employment and significantly greater earnings gains for this group when compared to less disadvantaged youth. Similarly, Da Mata, Oliveira and Silva (2025) find substantial and persistent gains in formal employment and earnings among disadvantaged men in Brazil.
These findings underscore the importance of tailoring programme design to the needs of specific groups and ensuring equitable access to lifelong learning opportunities. To build on this evidence and better understand which programme features consistently improve outcomes across contexts and populations, the next section presents results from a new comprehensive global meta-analysis of skills development initiatives.
5.3.3. What works in skills programmes: Evidence from a meta-analysis
Building on the insights from the literature review, this section presents a more systematic analysis of the effectiveness of skills programmes through a meta-analysis of 167 individual impact evaluations, encompassing 2,181 disaggregated estimates by time period, target group and programme features. This analysis extends earlier reviews of ALMPs (Card, Kluve and Weber 2018; Escudero et al. 2019; Kluve et al. 2019) by focusing specifically on training-related programmes, examining their design, skill content and inclusiveness – whether or not they are embedded in broader employment policies. While the previous section identified promising practices and persistent knowledge gaps, this meta-analysis uncovers systematic patterns across a wide range of programmes and contexts, offering clearer insights into what works, for whom and under what conditions. Unlike individual evaluations, the meta-analysis aggregates evidence on programme impacts to compare how different types of training, qualification pathways and skill content affect employment and work quality outcomes. An overview of the methodology is provided in box 5.4.
A meta-analysis uses statistical techniques to systematically combine evidence from multiple studies to estimate average effects, identify recurring patterns across studies and explore the sources of variation in programme impacts.
The meta-analysis presented below draws from 167 rigorous impact evaluation studies assessing the effects of skills programmes on individual-level labour market outcomes, including: (i) the probability of employment; (ii) earnings – including regular wages or net income; (iii) hours worked; and (iv) the probability of being employed formally.
The selection of studies followed a structured search and screening process based on predefined inclusion criteria. Studies had to evaluate interventions aimed at skilling, reskilling or upskilling individuals through formal, non-formal or informal learning. Only those using robust impact evaluation techniques – such as randomized controlled trials (RCTs), regression discontinuity designs (RDDs), difference-in-differences (DiD) or propensity score matching (PSM) – were included. All studies reported individual-level employment outcomes and addressed selection bias.
The meta-analysis builds on the assumption that studies addressing conceptually similar questions reveal common patterns that can be statistically synthesized. To do so, following previous meta-analyses (Card, Kluve and Weber 2018; Escudero et al. 2019), a structured dataset was created using key information from each included study – such as programme type, duration, target group, evaluation design and outcome variables – with multiple observations generated per study when separate estimates were reported by subgroup, time period or programme component. Each impact estimate was then classified based on whether it showed a statistically significant positive effect or not (either a non-significant effect or a statistically significant negative effect). This classification allowed for a meta-analytical regression analysis using a linear probability model to estimate the likelihood that a programme yields a significant positive labour market outcome.
Finally, background factors were controlled for including programme type, participant demographics and country macroeconomic indicators, such as GDP growth and education spending, to better isolate true programme effects (Stanley and Doucouliagos 2015; Vooren et al. 2019).
For full details on the methodology, including search strategy, coding procedures and quality criteria, see Escudero, Delaporte and Malo (forthcoming).
The final sample spans a diverse range of regions and time periods, highlighting the global breadth of skills programmes. As shown in figure 5.6, around 42 per cent of evaluations were conducted in Latin America and the Caribbean, followed by Northern, Southern, and Western Europe (22 per cent), sub-Saharan Africa (15 per cent), Southern Asia (8 per cent), South-Eastern Asia and the Pacific (3 per cent) and North America (3 per cent). Most studies were carried out in the 2000s and early 2010s, with a predominance of quasi-experimental designs. Many focused on disadvantaged groups and examined heterogeneity in impacts by socio-economic characteristics, adding depth to the analysis.
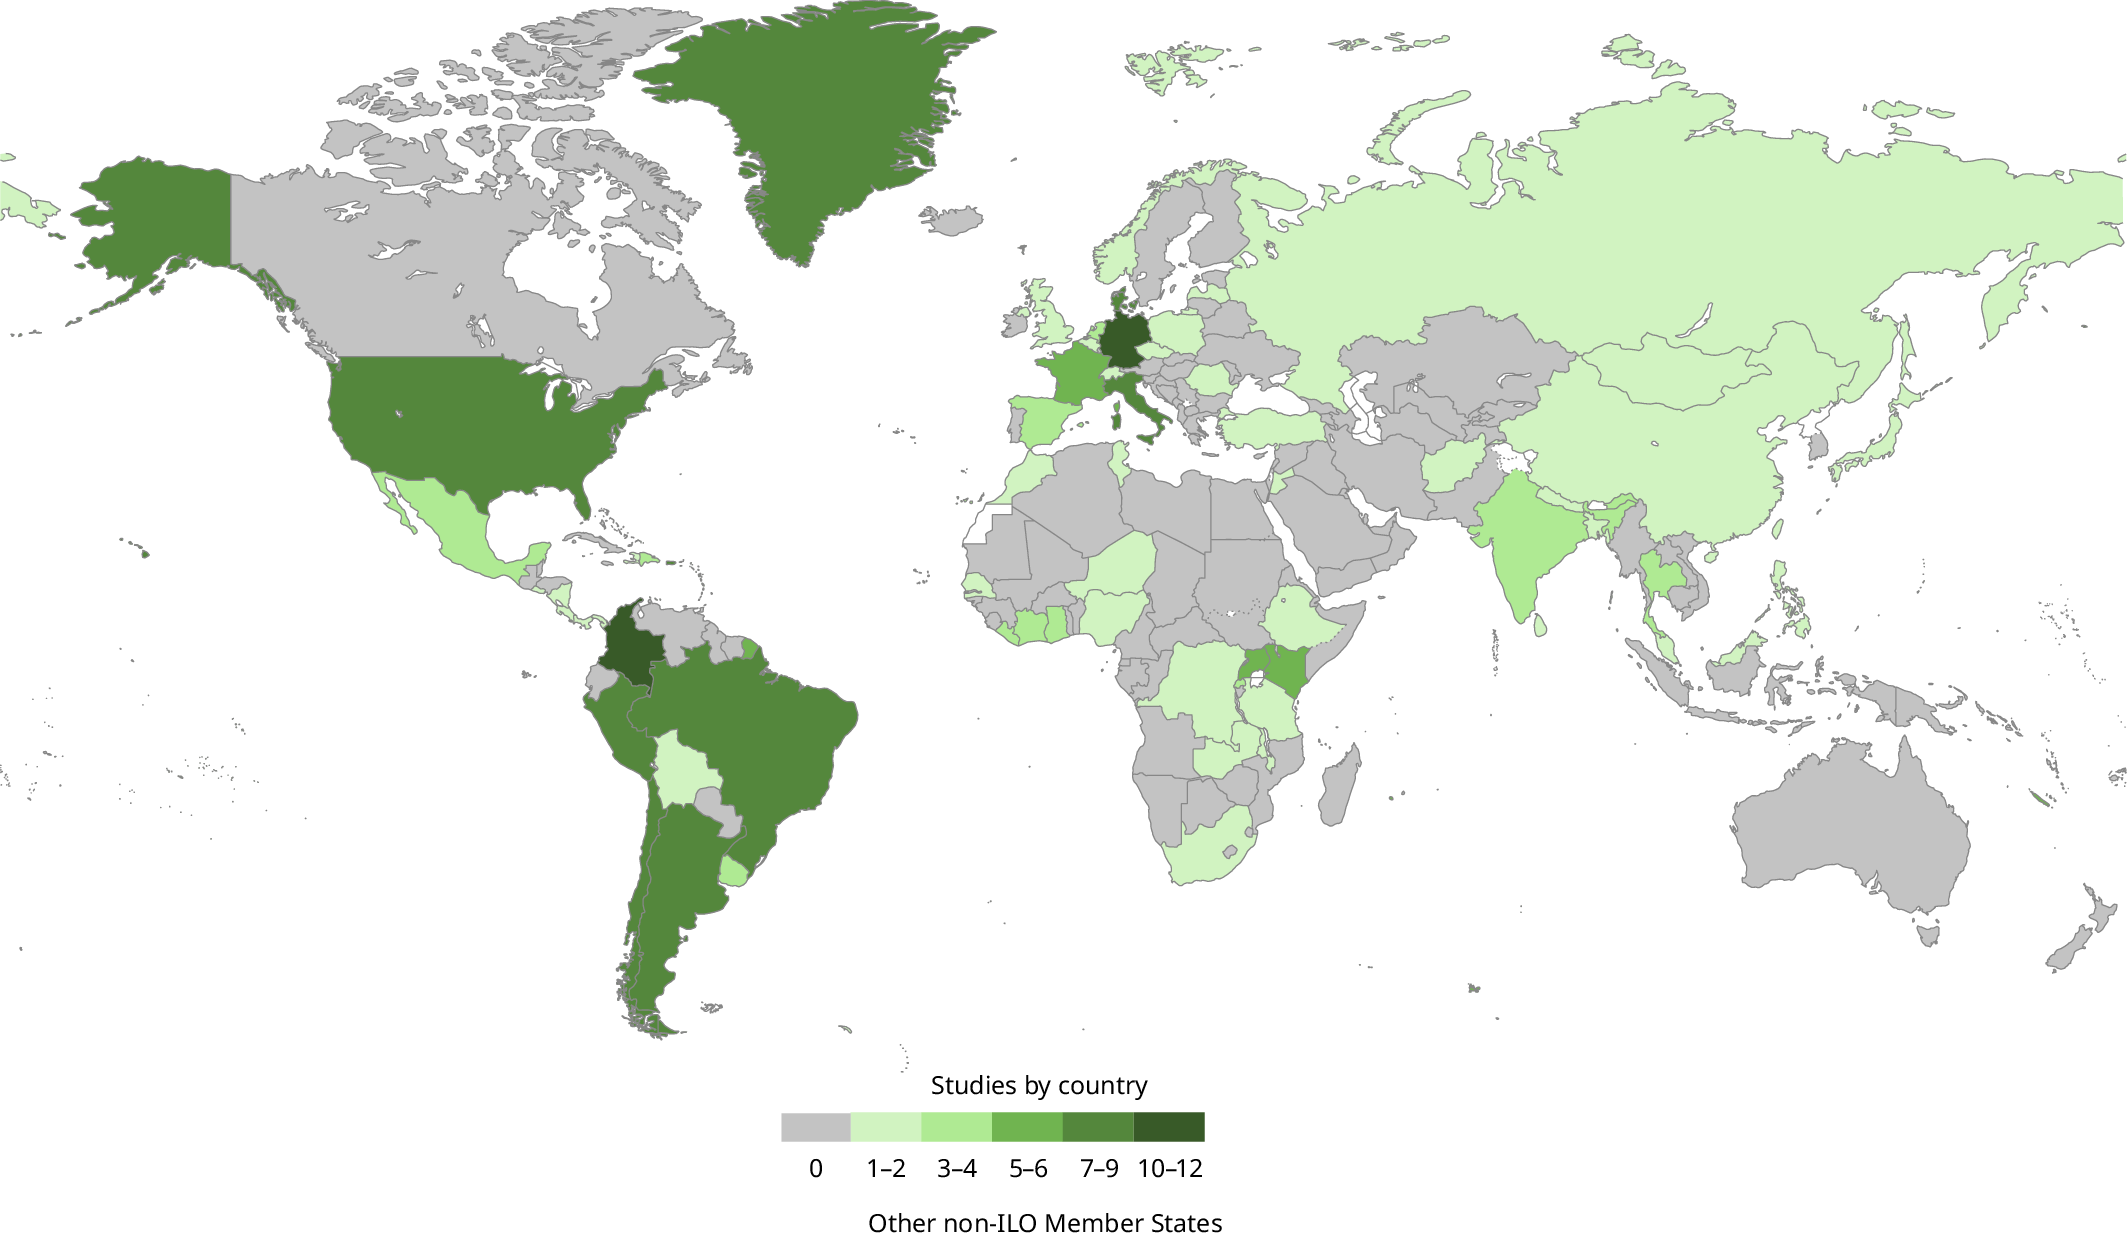
Disclaimer: Boundaries shown do not imply endorsement or acceptance by the ILO. See full ILO disclaimer: ilo.org/disclaimer.
Note: The map shows the diverse set of countries in which the impact evaluations included in the meta-analysis sample were conducted.
Source: Escudero, Delaporte and Malo (forthcoming).
From classroom to on-the-job: Not all training formats are equally effective
Several key insights can be gained from the analysis (see figure 5.7, panel a).77 First, all training types appear to be associated with better employment outcomes. Yet, some are more effective than others. Classroom instruction as well as programmes that combine classroom instruction with practical learning components – particularly internships – are more likely to lead to improved employment probabilities. This suggests that structured learning environments are especially effective in supporting positive employment effects.
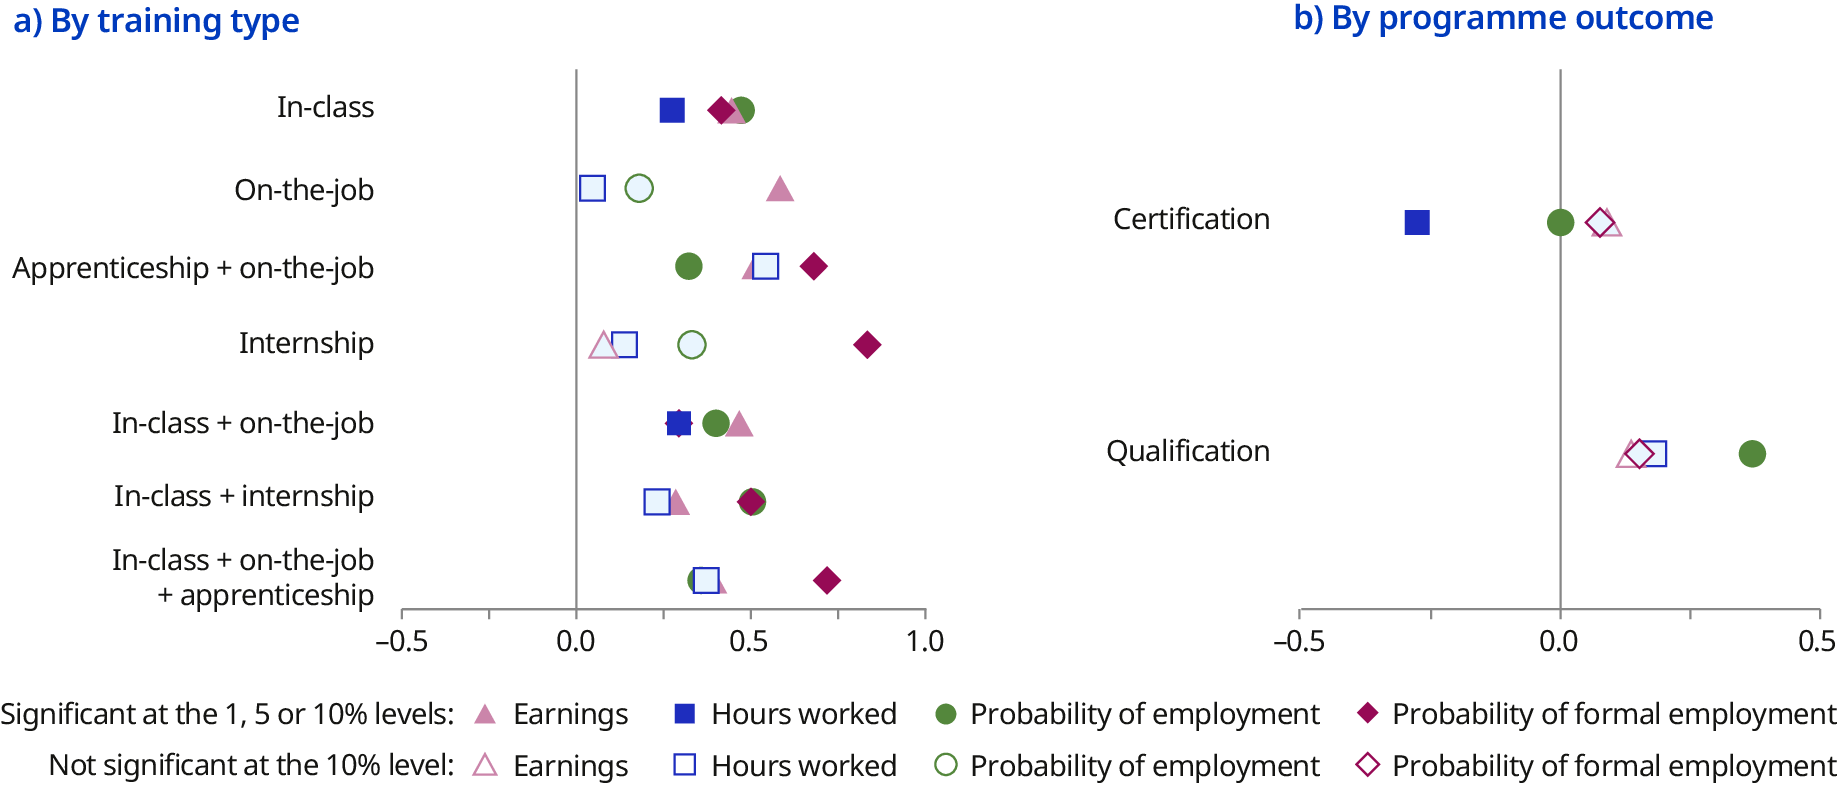
Note: Results are correlational, not causal, since study and programme characteristics were not randomly assigned and may be correlated with contextual factors. Panel a) shows predicted probabilities by training type, controlling for sex, age, disadvantage status, evaluation method and country-fixed effects. Predicted probabilities are averaged over the observed distribution of covariates. Panel b) reports the marginal effect of certification or qualifications on achieving significant results, estimated with the same controls. Standard errors are clustered at the study level, and estimates affected by multicollinearity are omitted.
Source: Escudero, Delaporte and Malo (forthcoming).
Beyond employment status, not all training types are equally effective in improving job quality. Notably, internships78,79 are associated with the highest increase in the probability of gaining formal employment. Apprenticeships are also associated with substantial gains in terms of access to formal employment. Meanwhile, programmes featuring on-the-job training – either on their own or combined with classroom instruction – tend to generate the largest income gains.
These findings reinforce the importance of combining different types of training, including in-classroom instruction with practical learning within the work environment. Indeed, purely classroom-based programmes show more modest effects when compared to programmes combining in-classroom with on-the-job training (including, internships and apprenticeships), suggesting that practical exposure may help translate training into tangible employment opportunities.
Qualifications boost employment prospects
Another important finding concerns the role of certification and qualifications in shaping programme outcomes (see figure 5.7, panel b). A qualification is defined by the ILO as the official confirmation of acquired knowledge, skills and competencies, obtained through the successful completion of an education programme or through the validation of non-formal or informal learning (ILO 2018). In this analysis, qualifications are proxied by training programmes that include classroom-based instruction and/or apprenticeships, which typically lead to formal certification. The analysis shows that programmes leading to certification tend to have smaller and statistically non-significant effects on most labour market outcomes, likely due to the heterogeneity in type, quality and recognition of the certification provided. By contrast, programmes that lead to qualifications – as opposed to micro or partial credentials – are consistently associated with statistically significant improvements in the probability of employment. This suggests that qualifications carry strong labour market signalling power.
However, these positive effects of programmes leading to qualifications on employment do not extend to all labour market outcomes. Impacts on earnings, formal employment and hours worked are generally limited and non-statistically significant. This suggests that while qualifications may improve access to jobs, they do not automatically translate into better job quality or higher income on their own. Achieving these outcomes requires targeted efforts to ensure that employment gains lead to decent work.
The analysis thus supports the conclusion that well-structured qualification pathways have the potential to enhance programme effectiveness. Still, their design and relevance to employer needs remain critical.
What you learn matters: Skill content shapes employment gains
The meta-analysis also sheds light on the types of skills that are most closely linked to employment gains (see figure 5.8), looking at two types of programmes – those delivered in classroom only and those combining in-classroom with on-the-job components (including internship).
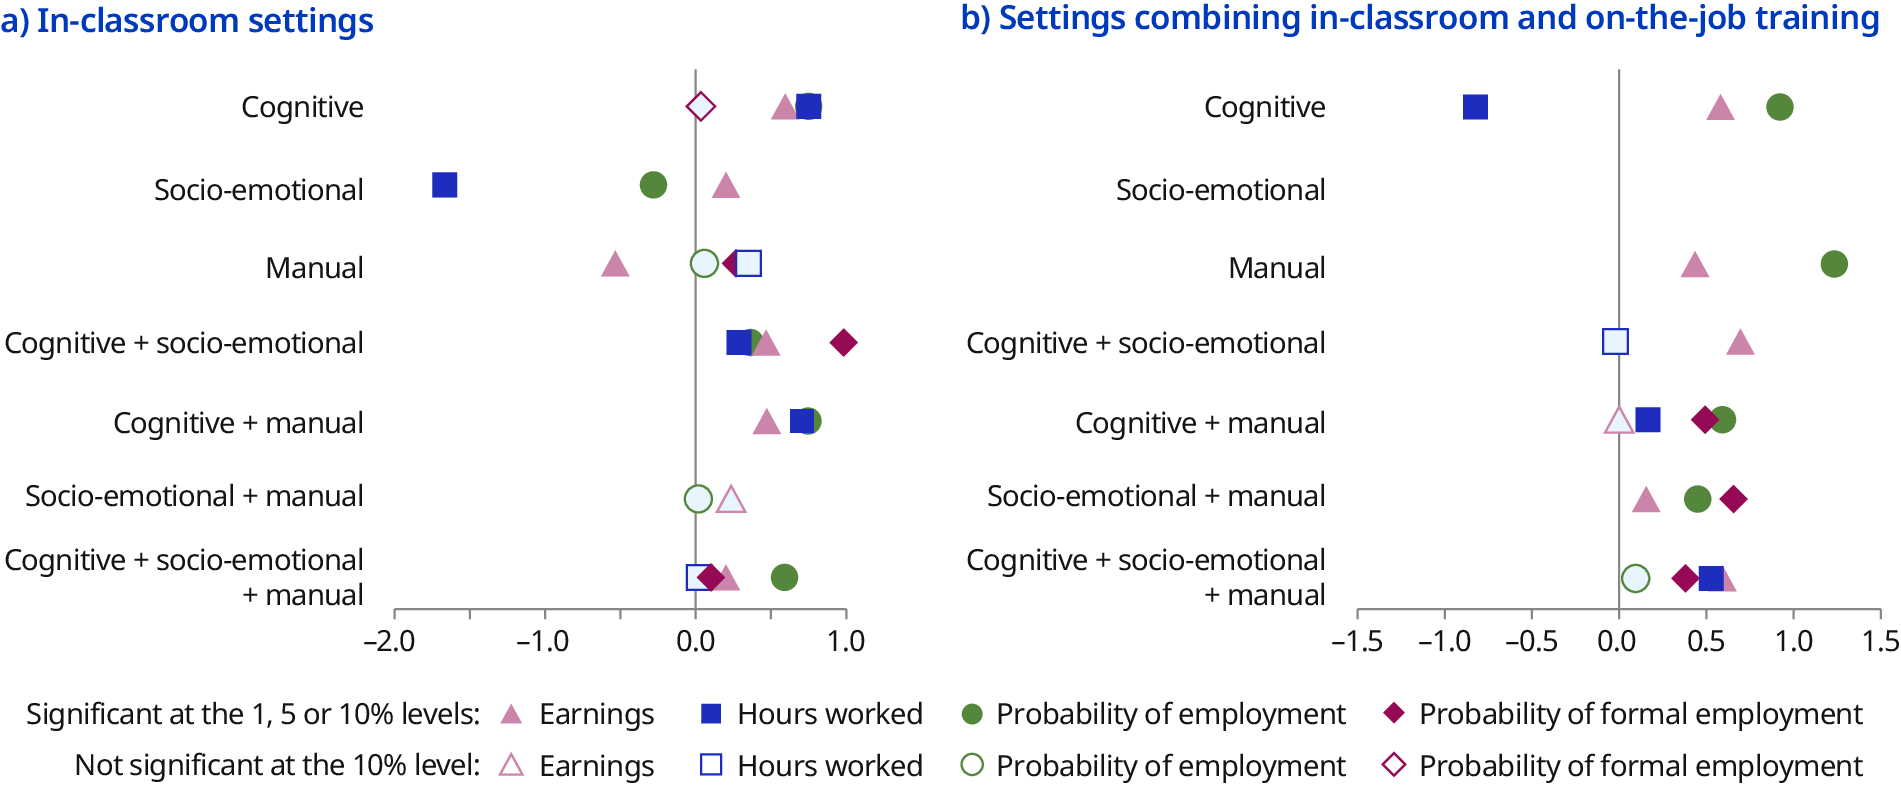
Note: Results are correlational, not causal, since study and programme characteristics were not randomly assigned and may be correlated with contextual factors. Both panels show predicted probabilities by skill content, controlling for sex, age, disadvantage status, evaluation method and country-fixed effects. These predicted probabilities are averaged over the observed distribution of covariates.
Source: Escudero, Delaporte and Malo (forthcoming).
Among classroom-based programmes (figure 5.8, panel a), those focused on cognitive skills – alone or in combination with manual and socio-emotional skills – tend to yield the strongest effects on the probability of employment. Programmes focused on cognitive skills alone are nevertheless more likely to be associated with statistically significant gains in terms of earnings and hours worked. While programmes focusing on socio-emotional skills alone show significant positive effects on earnings, they tend to have a negative effect on hours worked and the probability of employment. Yet, when socio-emotional skills are combined with cognitive skills, the positive effects are observed across all employment outcomes, including a stronger probability of being in formal employment. These findings suggest that while cognitive and manual skills – whether on their own or combined – are critical for securing employment, socio-emotional skills may play a stronger role in enhancing job quality and wage growth.
Regarding programmes that combine classroom instruction with practical experience (figure 5.8, panel b), those focusing on manual skills alone are associated with a higher probability of gaining employment. These are followed by programmes focusing on cognitive skills alone. These two types of programmes are also associated with better earnings. With respect to other employment outcomes, programmes focusing on developing combined skills sets (for example, cognitive and manual skills or socio-emotional and manual skills) tend to increase the chances of gaining formal employment. This reinforces the idea that when programmes are delivered in more applied formats, specific skills are the most needed to improve access to employment, while multidimensional skill sets tend to yield more consistent gains in terms of job quality.
Tailoring to context: Participant profiles and delivery conditions influence effectiveness
The analysis confirms that the effectiveness of training programmes varies across population groups, though the patterns are nuanced (see figure 5.9 for differences by sex and age). Women tend to benefit more consistently from training interventions, particularly in terms of employment prospects and earnings. Integrated training formats – such as those combining classroom instruction with on-the-job training – appear especially effective in improving women’s transitions to both employment and formal employment. Furthermore, qualifications are more strongly associated with better employment outcomes for women than men. These findings suggest that well-designed training interventions can help address structural barriers faced by women in labour markets.
-
Figure 5.9. Effectiveness of skills programmes, by employment outcome and participant characteristics
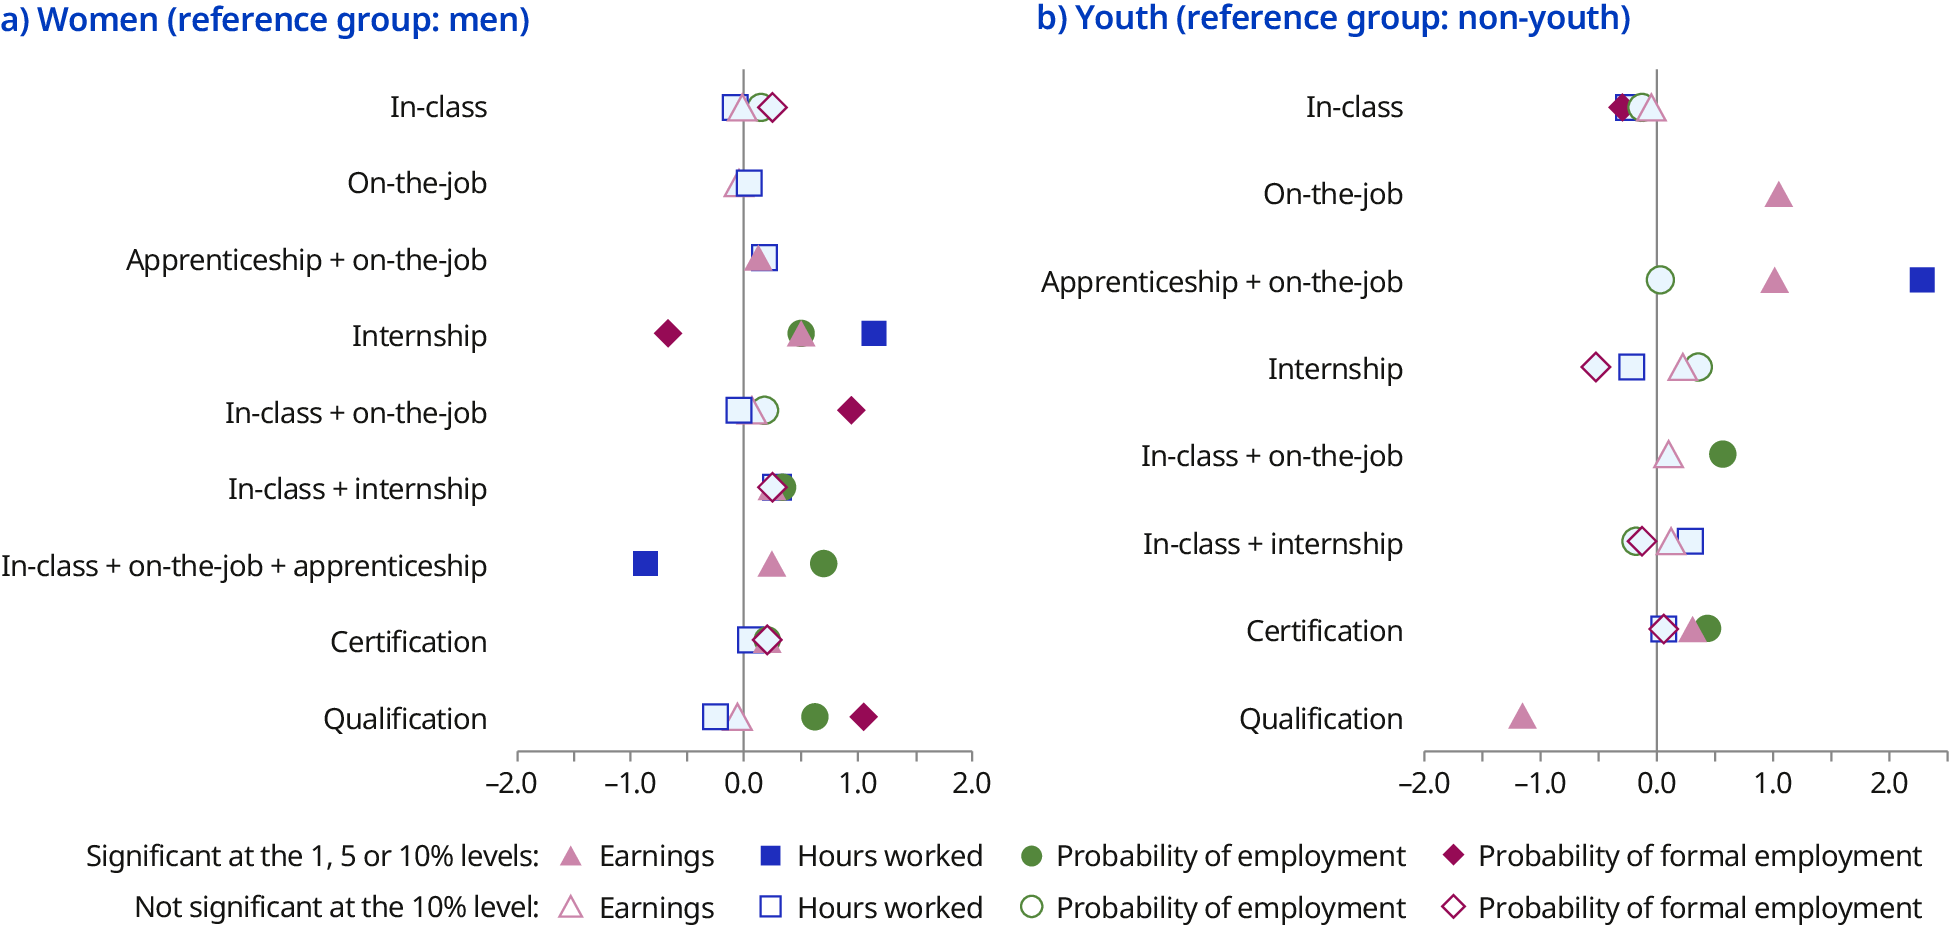
Note: Both panels show marginal effects which indicate the average change in probability (compared to a reference group) associated with a programme feature. Youth is defined as individuals aged under 25.
Source: Escudero, Delaporte and Malo (forthcoming).
There are also differences in programme effectiveness between youth and adult participants. Apprenticeships consistently improve earnings and hours worked among young individuals. Similarly, on-the-job training is associated with higher earnings for youth. Programmes that combine classroom instruction with on-the-job training also yield better employment probabilities for youth compared to non-youth. Finally, certifications tend to support youth employment – suggesting that certification may serve to compensate for young people’s limited work experience.
Individuals facing structural disadvantages in the labour market80 do not systematically benefit more from training programmes. However, they tend to gain from specific types of interventions – particularly those delivered in classroom settings. For this group, skills programmes are associated with positive and significant effects on employment probabilities and hours worked. Programmes that lead to qualifications are also associated with higher earnings, especially for this group of individuals.
Finally, the timing of outcome measurement further influences observed effects and should thus be viewed as an important programme design feature. Some training modalities show stronger effects in the short term (for example, within six months of programme completion), while others yield more durable benefits. For instance, on-the-job training appears to have a sustained positive effect on earnings beyond 18 months. Similarly, programmes leading to qualifications are especially effective in improving long-run employment probability and hours worked.
Beyond programme and participant characteristics, contextual factors also play a crucial role in shaping effectiveness. Macroeconomic conditions, labour market structures, levels of informality, sectoral composition and the institutional capacity of training systems vary across settings and influence outcomes. However, the results presented above remain unchanged when controlling for GDP and government expenditure in education. As expected, programme effectiveness tends to be higher during economic upswings. Nevertheless, evidence from ALMPs (including training) shows that such policies are most effective when implemented consistently over time, including during downturns (Card, Kluve and Weber 2018; Escudero 2018; Escudero and Liepmann 2020). This highlights the importance of designing programmes that are not only tailored to individual needs but also responsive to changing economic and institutional environments.
In sum, the meta-analysis underscores that the effectiveness of skills programmes hinges not only on what is taught, but also how, to whom and under what conditions training is delivered. Programmes that combine classroom and practical components lead to qualifications and foster a mix of cognitive or manual skills, alongside socio-emotional skills, tend to yield stronger employment outcomes. These findings offer clear guidance for improving the design and targeting of lifelong learning initiatives. However, skills programmes should be seen as one part of a broader lifelong learning system, where foundational skills and informal learning provide a basis for engaging in more advanced, credentialled training; and where benefits extend beyond employment outcomes, including social inclusion and personal development. Realizing the full potential of these programmes at scale also requires confronting a central challenge: how to secure adequate and equitable financing of lifelong learning across stakeholders.
5.4. Financing lifelong learning
Lifelong learning in the world of work entails costs across multiple levels. Training providers face expenses related to staffing, infrastructure, equipment and materials. Workers face direct costs to participate in trainings, including registration fees and indirect costs, such as for transportation, accommodation and foregone earnings. For employers, supporting lifelong learning entails costs too, whether through sharing or fully subsidizing employee participation, granting paid time off during working hours or running in-house training programmes. Intermediaries and institutions offering complementary services – like skills diagnosis, quality assurance and counselling – also contribute to the overall lifelong learning costs.
As highlighted in section 5.4.2, these costs are a major barrier to inclusive and effective learning systems where cost-related constraints – both for employers and workers – notably include those associated with participation and the required funding for creating relevant, high-quality offers. These findings illustrate that inclusive and effective lifelong learning is only possible conditional on adequate financial mechanisms.
This section explores mechanisms to finance lifelong learning. First, it characterizes the state of financing for lifelong learning in the world of work, revealing a persistent funding gap for adult learning across countries, particularly for less affluent ones. Despite this urgency, a lack of reliable data hampers a comprehensive analysis. Existing insights are fragmented and based on disparate statistical measures. This section consolidates and extends existing knowledge, while also demonstrating the need for better data.
Second, the section explores financial mechanisms in greater detail, focusing on their capacity to support more flexible forms of learning beyond formal training – a critical lever to expanding access. Existing overviews have focused on specific financial mechanisms,81 social inclusion as a policy goal (for example, ILO (2023d)) or regions82 without addressing flexibilization as a central concern. Thus, this section synthesizes assessments of financial mechanisms from countries of different income levels and regions that help make lifelong learning more flexible.
5.4.1. The state of financing lifelong learning
The costs of lifelong learning can be substantial. Private provision on its own would exacerbate the inequitable access to lifelong learning and lead to underinvestment in skills. Governments thus play a crucial role in financing the infrastructure needed for lifelong learning systems and in providing financial mechanisms to support employers and/or workers in training and other learning, thereby shaping skills development in line with development priorities. Donors, including multilateral development banks and non-governmental organizations, can have a complementary function to such governmental efforts, particularly in less developed economies (Schuetze 2008). The crucial role of governments in financing lifelong learning is reflected in the Human Resources Development Recommendation, 2004 (No. 195). It calls on the explicit commitment of Member States to invest in and create the conditions to enhance education and training at all levels (Para. 4(b)). Furthermore, it states that international and technical cooperation concerning lifelong learning and related areas should “increase technical and financial assistance for developing countries” (Para. 21(g)).
In addition, financial contributions by enterprises are essential to mobilize resources, foster commitment by all stakeholders and achieve inclusive and effective learning systems. Recommendation No. 195 consequently advises Member States “to encourage enterprises to invest in education and training, individuals to develop their competencies and careers, and to enable and motivate all to participate in education and training programmes” (Para. 5(b)). The Vocational Rehabilitation and Employment (Disabled Persons) Recommendation, 1983 (No. 168), mentions that there should also be measures specifically for persons with disabilities, “including financial incentives to employers to encourage them to provide training […] for disabled persons” (Para. 11(a)).
Figure 5.10 shows that there is a wide array of financing mechanisms for lifelong learning, the majority of which can be co-financed by two or more financing agents (ILO 2021b, 2023d; Schuetze 2008; World Bank 2003). These mechanisms each target specific groups and, depending on the target group, the mechanisms encourage different types of engagement in learning activities, which are referred to as “first-order objectives”. Several “second-order objectives” are the intended results of this engagement, including improved skills and working conditions for workers, and improved innovation and productivity for employers (for more details, see section 5.4.2).83
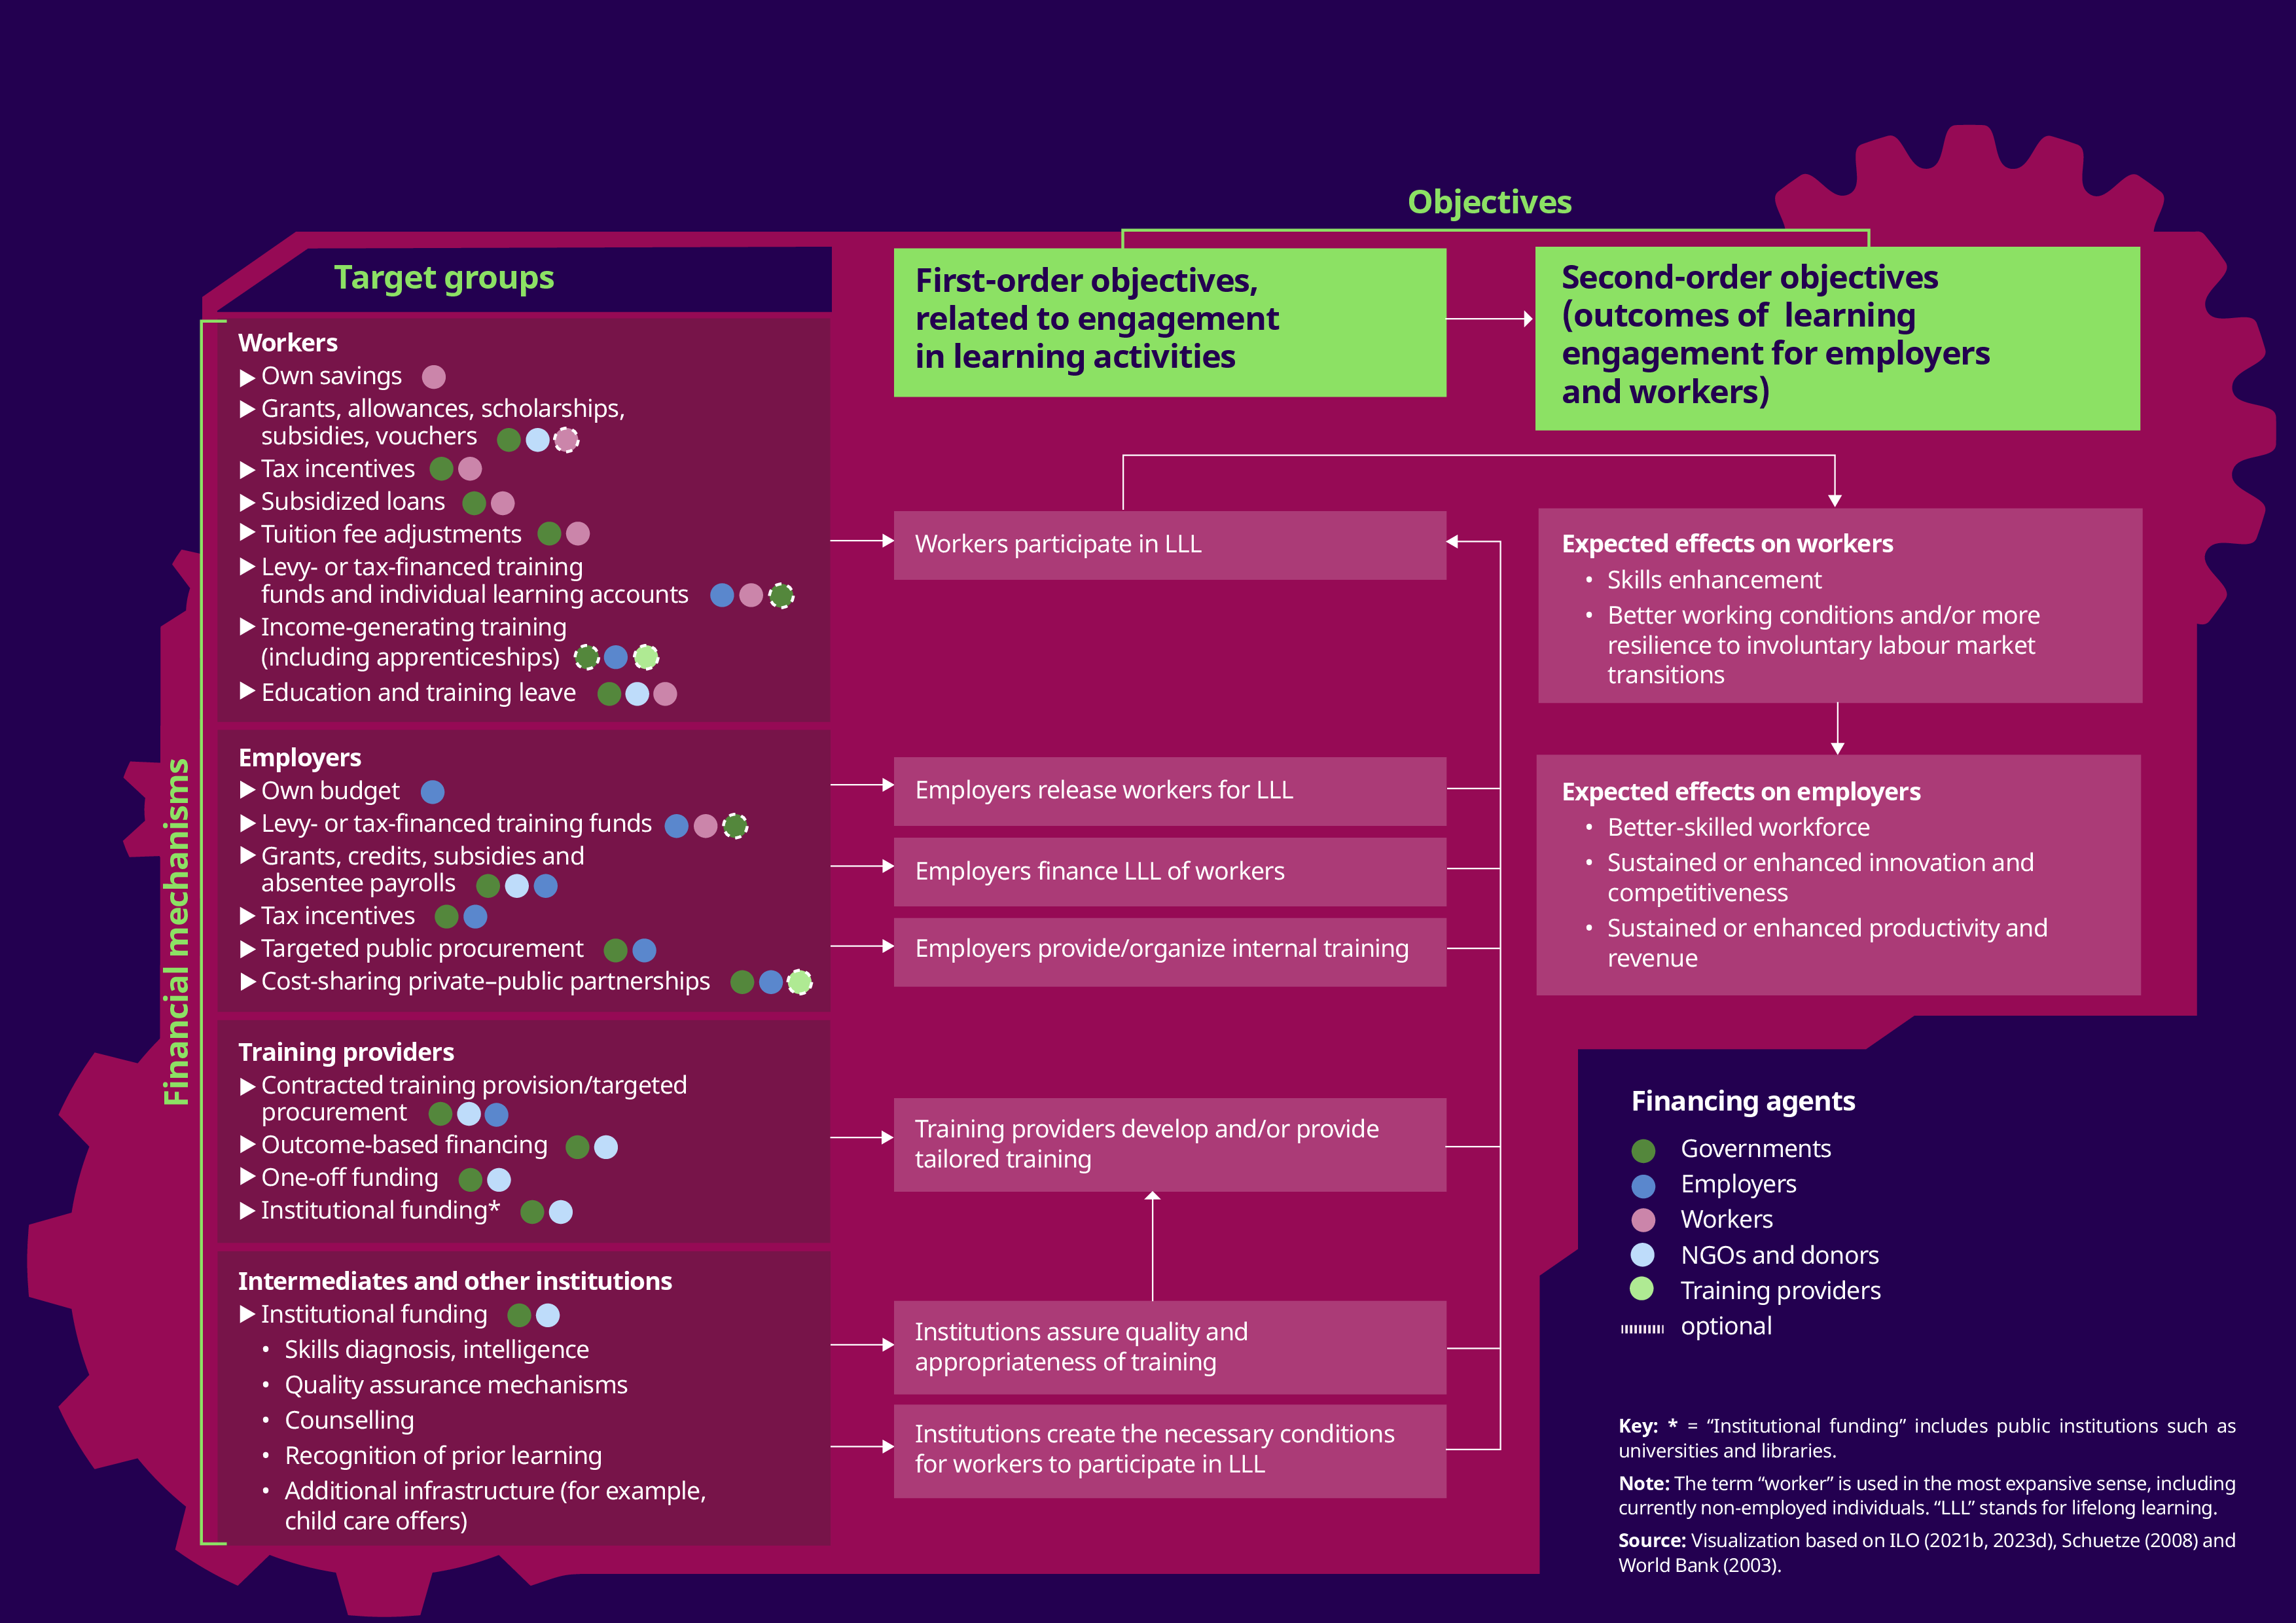
Different mechanisms serve different roles. Mechanisms targeted at workers aim to contribute to workers’ costs associated with lifelong learning and thus facilitate their participation in training and other learning activities. For example, training funds – financed by employer levies, public subsidies, donor financing, workers’ contributions or a mixture of these – directly cover training costs, while workers may be granted paid training leave from work for a mutually agreed period of time (ILO 2023d).
Other mechanisms target employers, including tax incentives or direct transfers (for example, grants and subsidies). Through public investments and possibly donor funding, these mechanisms fully or partially cover employers’ direct and indirect costs of training for their workers and/or of organizing training themselves. In addition, training funds provide means to incentivize employers to offer learning opportunities to workers.
Financial mechanisms can also be targeted at institutions. Training providers may receive one-off public funding to develop specific, inclusive training programmes or may conclude contracts with public entities or enterprises to provide training. In this context, outcome-based financing is becoming increasingly common (ILO, forthcoming). Governments may also fund specific organizations to provide complementary services – like skills diagnosis, quality assurance and counselling. These services are aimed to assure the quality and appropriateness of lifelong learning provision and to create the institutional conditions for participation.
This overview illustrates the challenges of collecting comprehensive and harmonized data on financing lifelong learning across countries (see also UNESCO, n.d.). Ideally, such data would capture the wide range of financing mechanisms, target groups and financing agents involved. Additional challenges include the frequent absence of a dedicated governmental budget for lifelong learning activities and/or dedicated budgets covering only certain aspects of them. Financing lifelong learning also takes place at the national, state and local levels. Finally, costs are particularly difficult to monetize for non-formal and informal opportunities (see box 1.1). The understanding of what constitutes lifelong learning, particularly non-formal and informal learning, differs within and across countries, making it challenging to aggregate data at the country level and to draw comparisons across countries. Consequently, to date, there is no comprehensive cross-country dataset on lifelong learning costs that covers all financial mechanisms and stakeholders. Even at the national level, only few studies have synthesized relevant data (examples are Williams, McNair and Aldridge (2010) for the United Kingdom and du Plessis et al. (forthcoming) for South Africa).
Nevertheless, some proxy variables help capture central aspects of lifelong learning financing. UNESCO (n.d.) provides survey data on governmental expenditure for adult education and learning, collected from national governments. This survey shows that adult education and learning accounts for a comparatively small share of public spending on education across countries: in 80 per cent of countries, this share is lower than 4 per cent (figure 5.11).
-
Figure 5.11. Distribution of national public expenditure on adult education and learning, by country income group (percentage)
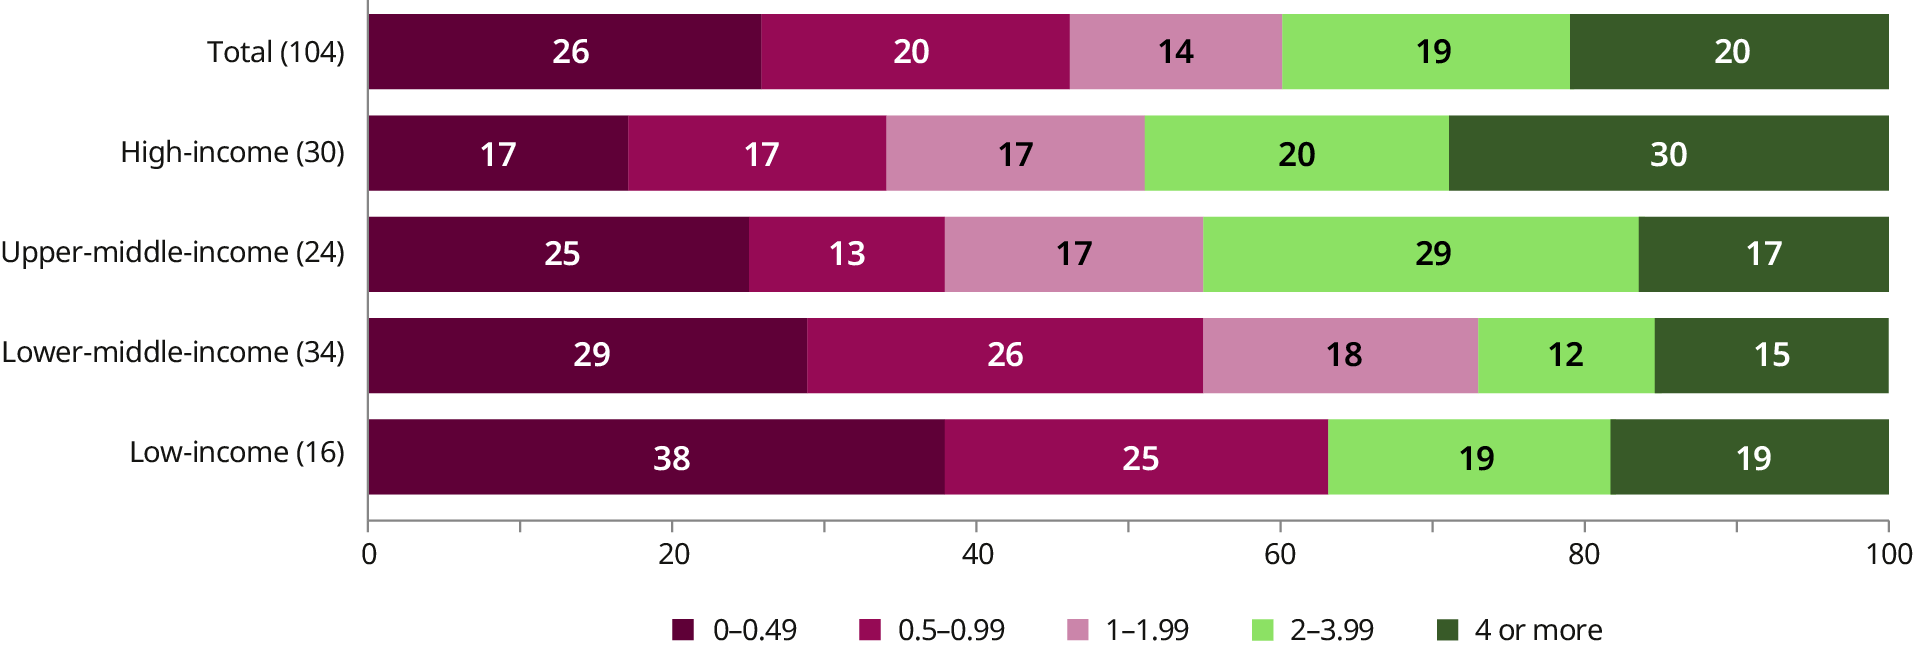
Note: The reporting period was January 2018 to December 2019. The numbers between parentheses refer to the number of countries in each income group in the sample of 104 countries.
Source: ILO compilation based on UNESCO GRALE 5 Open Data.
There is also considerable variation across countries. Of 104 countries with available data, 21 allocate 4 per cent or more of their overall public education expenditure on adult education and learning, while 27 spend less than 0.5 per cent. Higher relative spending tends to be found in high-income countries, while middle-income and especially low-income countries tend to have smaller relative expenditures. Among low-income countries, 38 per cent spend less than 0.5 per cent, and nearly two thirds devote less than 1 per cent of their public education expenditure to adult education and learning.
The ILO institutional survey conducted for this report provides valuable information on the types of public expenditure for lifelong learning in the world of work (figure 5.12). Some countries (including China, India and Viet Nam) report using a broad mix of financial instruments, while others (including Madagascar, Mexico, Senegal and the United Republic of Tanzania) rely on just one type. Common instruments include national training funds as well as different grants, subsidies and scholarships directed to individuals or enterprises. Tax incentives for enterprises and individuals also exist in various countries, though fewer. National and sectoral training levies are less common and only a few countries report individual learning accounts. Bangladesh and Viet Nam are exceptions, as they have taken steps toward institutionalizing such accounts (Singapore is an example of a high degree of formalization that will be discussed later; see also ILO and UNESCO (2020)).
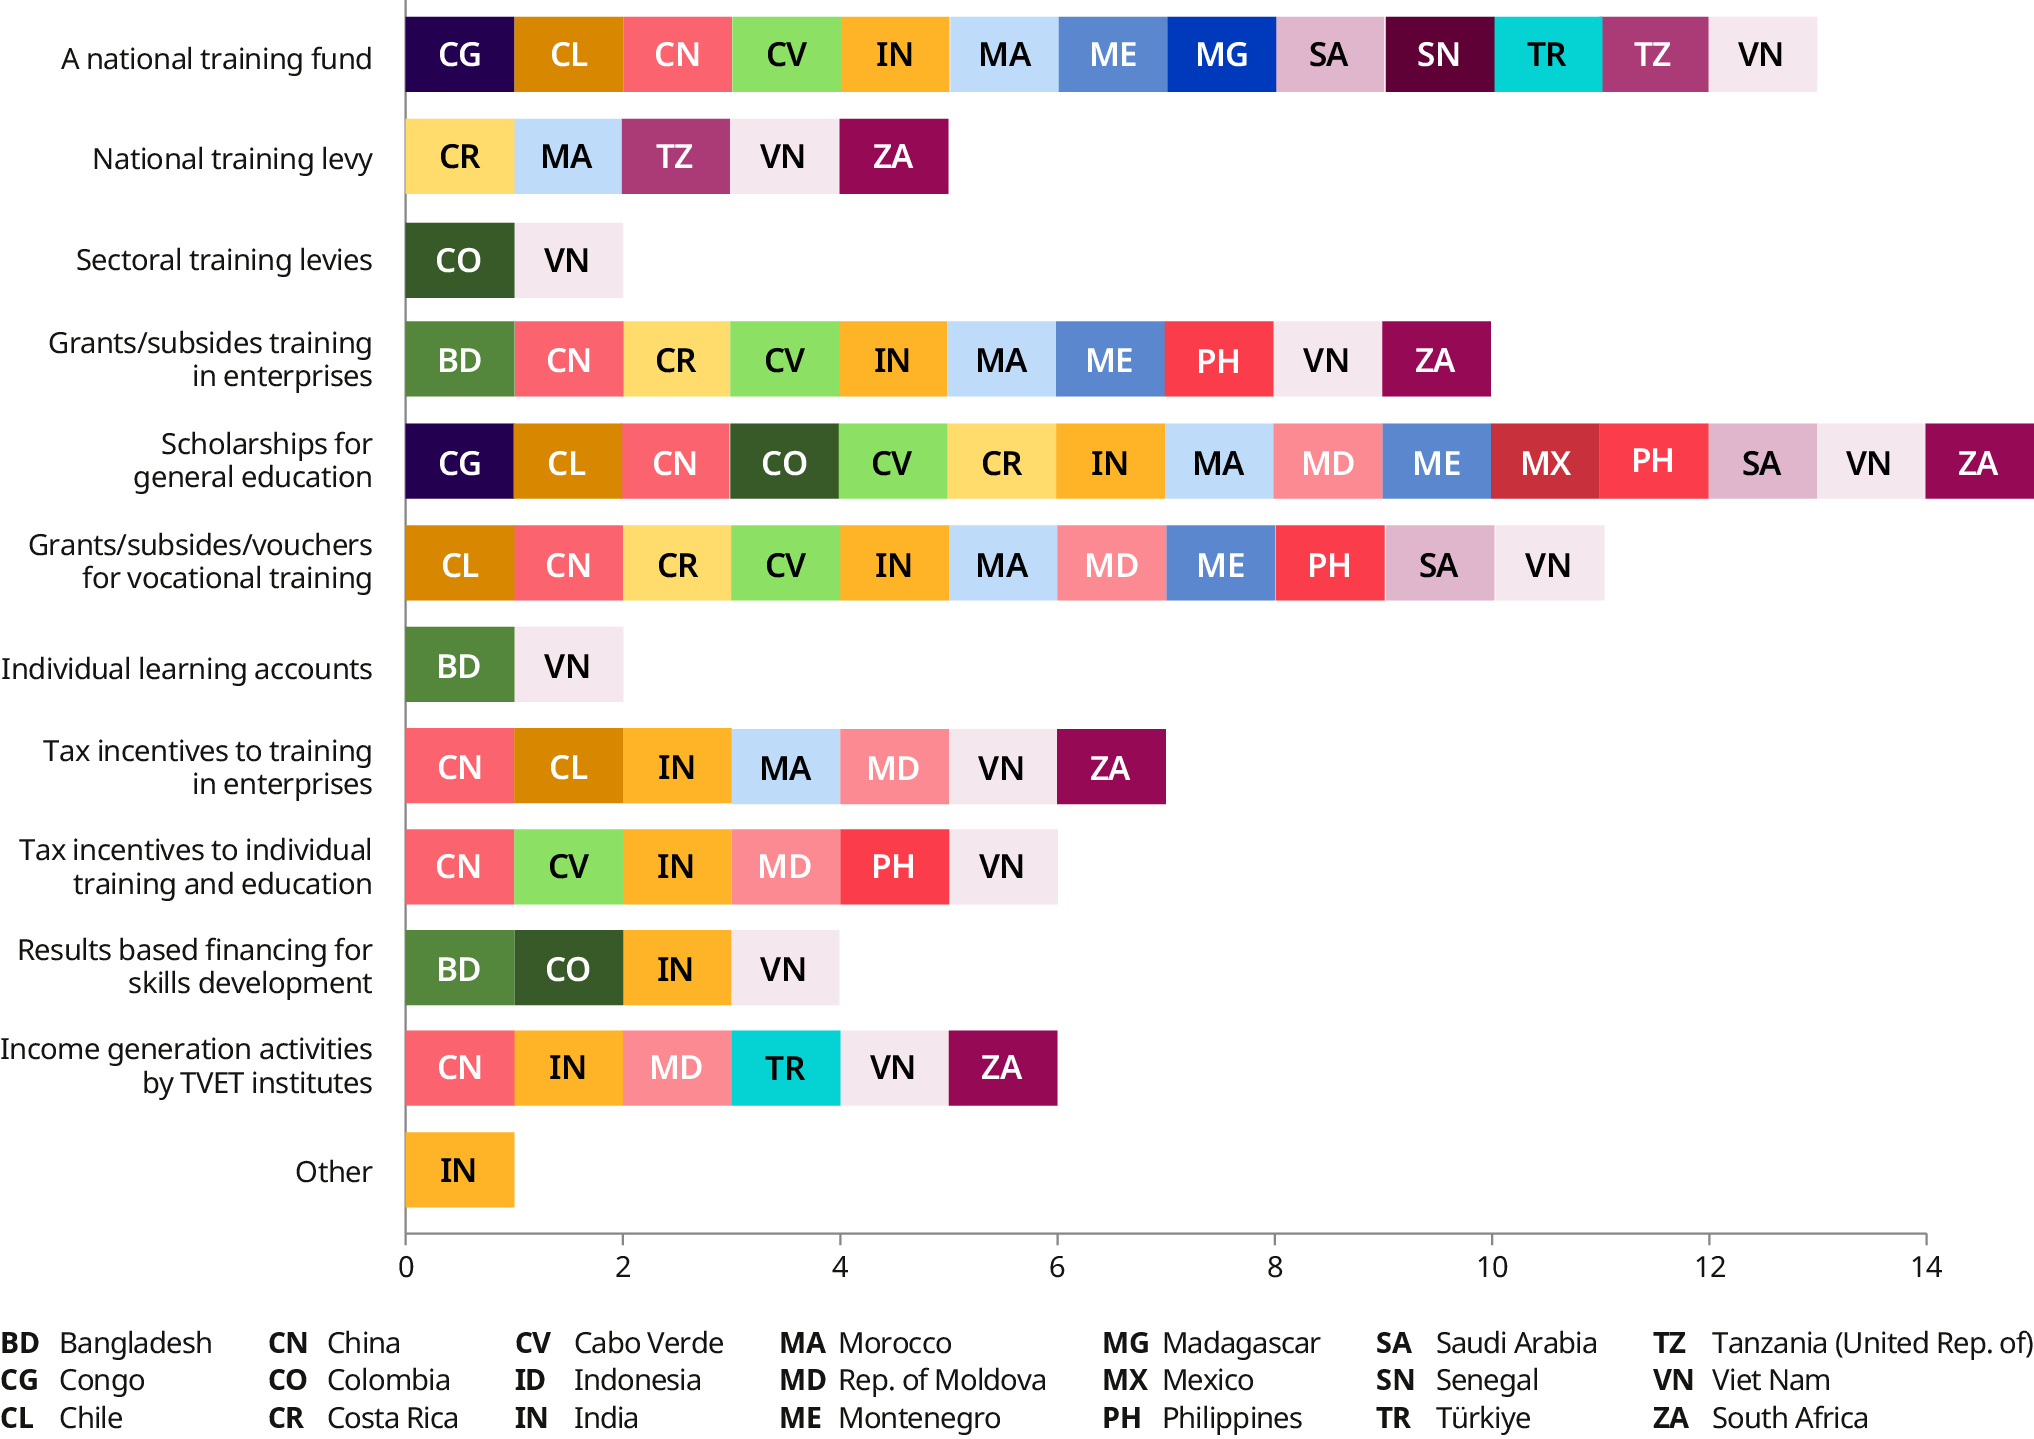
Note: Based on available data for 21 countries, which were chosen to represent different regions, national income levels, languages and lifelong learning systems. Note that “individual learning accounts” systems may not be fully institutionalized; and that Costa Rica and the United Republic of Tanzania were manually added under the “national training levy”.
Source: ILO institutional survey.
Concerning workplace costs, survey data at national and regional levels provide insights into co-financing practices – particularly for non-formal learning, such as short courses, workshops and seminars (see box 1.1). These data show that cost-sharing among governments employers, workers and other stakeholders is widespread.
In high-income countries, employers tend to play a major role in co-financing non-formal training for their workers. According to the European Skills and Job Survey from 2021, 77 per cent of education and training undertaken by workers in EU Member States, Iceland and Norway is fully or partly paid for by the employer or takes place during paid working time (Cedefop 2022b). Employer contributions are highest in Norway (89 per cent) and Estonia (88 per cent), and lowest in Greece and Spain (both at 59 per cent). Representative surveys among workers in Chile (Bogliaccini et al. 2022) and the Republic of Korea (OSHRI 2020) show similar results regarding the important role of employers in partly covering the costs of non-formal education and training.
In contrast, the ILO lifelong learning survey, which elicits information on non-formal training conducted in the past 36 months, conveys a different picture for two lower-middle-income countries: Bangladesh and the United Republic of Tanzania (figure 5.13). In Bangladesh, even among employees, only 16 per cent of those receiving training were financially supported by their employers. For these workers, governmental financing was most important (33 per cent), followed by personal financing (23 per cent). Among own-account and non-employed workers, most training was self-financed through personal investments (39 and 46 per cent, respectively). These groups received public support for training only in 28 and 23 per cent of the cases, respectively, and in very few cases from former employers. In the United Republic of Tanzania, a higher share of employees received training support from employers (56 per cent). Similarly to Bangladesh, self-financed training remained common – 22 per cent among employees and 56 per cent among own-account workers. In contrast to Bangladesh, governmental contributions played a smaller role in the United Republic of Tanzania.
-
Figure 5.13. Share of financing sources for the training of workers in Bangladesh and the United Republic of Tanzania, by working status (percentage)
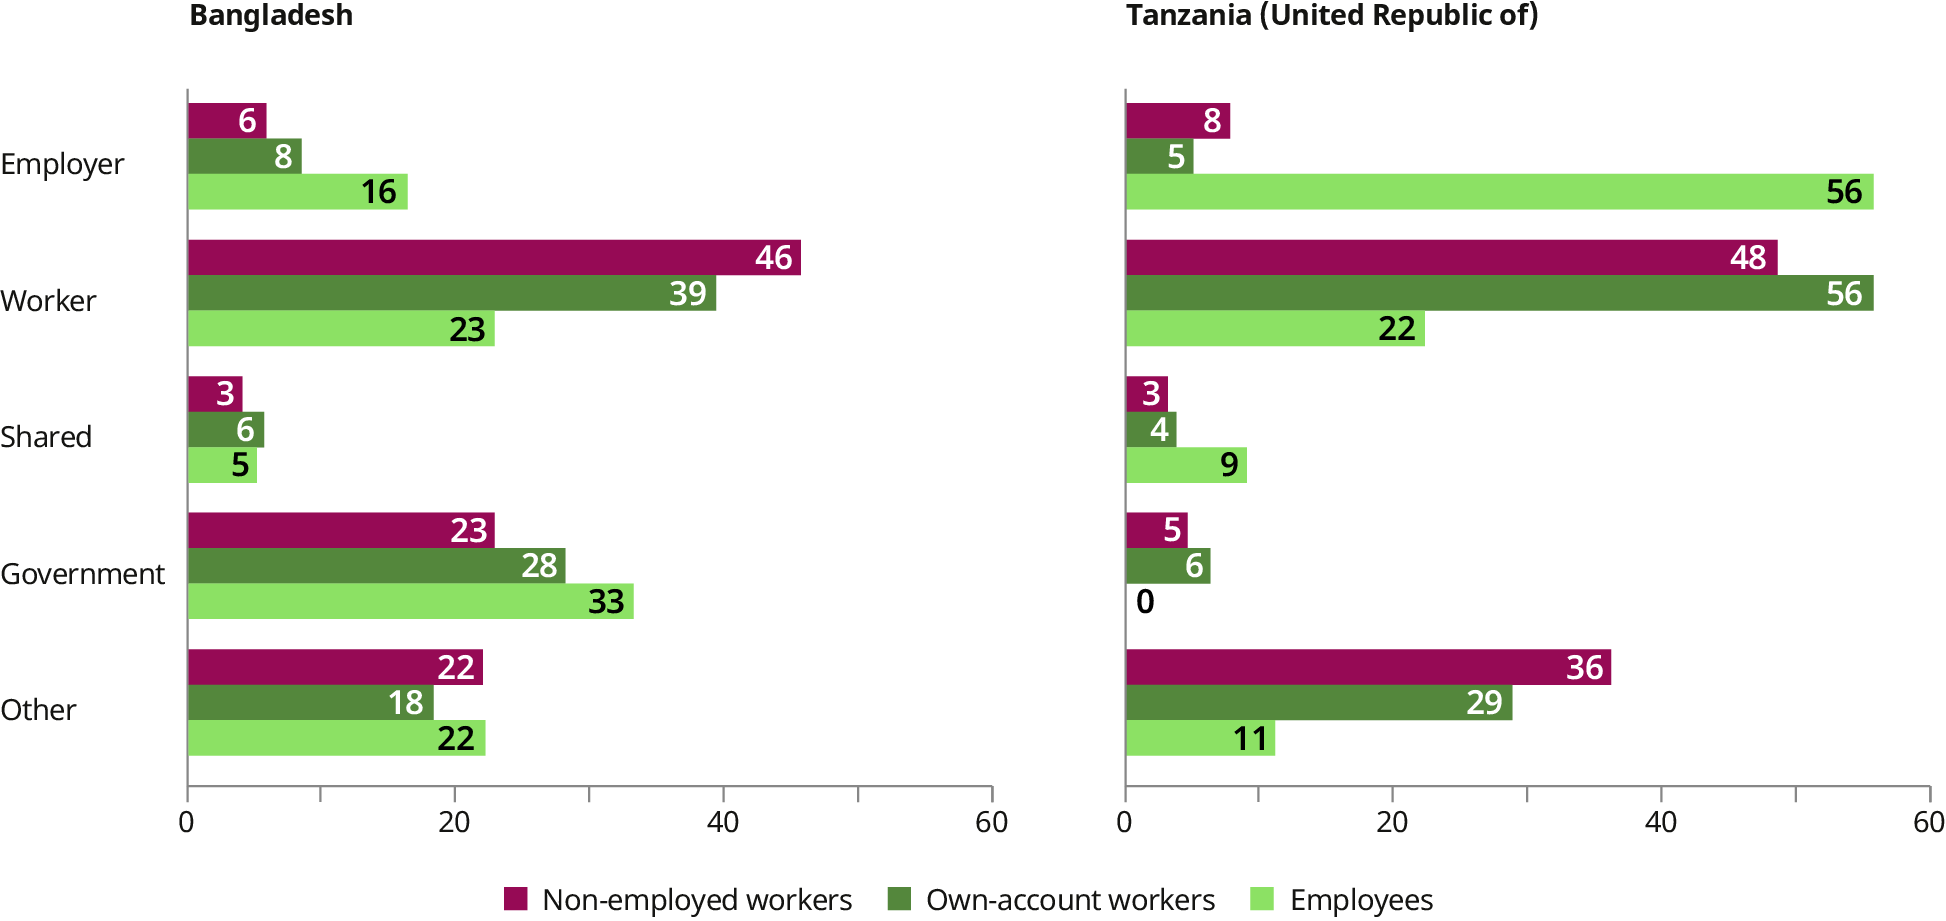
Note: Training is defined as “training course or other learning activities, such as work-related training or private skills training (not part of the formal educational system)”. The question refers to workers who had conducted training in the past 36 months. Own-account workers and non-employed individuals may refer to financing from a previous employer.
Source: Analysis based on ILO lifelong learning survey from Bangladesh and the United Republic of Tanzania.
In conclusion, co-financing practices for non-formal education and training are evident across countries, but the extent and modalities vary considerably. In high-income countries, employers play a stronger role in financing non-formal training. In low- and middle-income countries, this involvement is weaker, which undermines the efficiency of financing mechanisms. The high shares of own-account workers in less affluent countries play a role, which makes government support even more important. However, government spending on lifelong learning in the world of work tends to be lower in low- and middle-income countries, leaving many unemployed and own-account workers to cover training costs through personal expenses. This likely contributes to their low participation rates in lifelong learning (see Chapter 2).
These findings show that equal access to lifelong learning within and between countries remains difficult to achieve. In general, public spending for lifelong learning in the world of work continues to be limited across all country income groups, falling short of the goals set by the Belém Framework for Action. This 2009 UNESCO agreement committed Member States to investing at least 6 per cent of their gross national product in education and to increase investment in adult learning and education (UNESCO 2010, para. 14(a)).
Despite the costs involved, investing in lifelong learning can yield long-term returns.84 For employers, early econometric studies in the United States estimated returns on investment for firms in formalized training ranging from 7 to 50 per cent (Bartel 2000). Similarly, Belgian firm-level data show that a 10 percentage point increase in the share of trained workers is associated with a 1.7 to 3.2 per cent rise in productivity, and a 1.0 to 1.7 per cent increase in average wages (Konings and Vanormelingen 2015).
5.4.2. Effectiveness of financial mechanisms beyond formal training
Flexibilization of learning opportunities is key for ensuring broad and inclusive access to lifelong learning and for responding dynamically to evolving skills needs. However, as discussed earlier, more investment is needed to promote and facilitate this flexibility.
This section explores the effectiveness of selected national examples of financial mechanisms in enabling flexible lifelong learning provision. As discussed before, “flexible” learning includes non-formal learning (for example, courses, workshops and seminars) and informal learning (for example, initiatives self-directed by individual workers and learning by doing at work – see box 1.1). Since informal learning is less structured, it is harder to capture and support through financial mechanisms. Therefore, this section primarily focuses on non-formal learning, including some certified initiatives, which may fall outside strictly defined non-formal learning. The focus is on mechanisms targeting employers and workers, with one example targeting training providers.
Country examples were selected to cover different regions and to highlight informative cases that shed light into the factors influencing programme success or failure. Because studies on the effectiveness of such mechanisms remain limited, the choice of countries was also based on the availability of evaluations. This scarcity of evaluations made it impossible to conduct a systematic comparative analysis across countries to identify common success factors. Investing in more rigorous evaluations – and then comparing them across countries – would be a desirable avenue for obtaining a stronger evidence base.
“Effectiveness” is understood in terms of achieving the first-order and second-order objectives illustrated in figure 5.10 (see Käpplinger, Klein and Haberzeth 2013). First-order objectives – akin to outputs in a “theory of change” framework – include mobilizing workers to participate in lifelong learning; encouraging employers to release, finance or deliver lifelong learning; and supporting training providers to offer lifelong learning activities. Second-order objectives resemble longer-term outcomes or impacts in a theory of change. For workers, these impacts of training can entail improved skills, better labour market outcomes and enhanced resilience during labour market transitions. For employers, benefits may include a more skilled workforce and positive effects on innovation, productivity, competitiveness and profits. Ultimately, achieving first-order and second-order objectives should be benchmarked against the costs of a given financial mechanism, which is done whenever such information was available.
Financial mechanisms targeting employers
Example of a levy-based fund
Levy-based funds, sustained through employer levies, are a common mechanism to finance lifelong learning outside of the regular national budget (ILO 2023d). The Botswana Human Resource Development Fund (HRDF) is one example that reimburses employers for their expenses on employee training through accredited training providers. Levies are paid by formal-sector enterprises, depending on their annual turnover (Palmer 2020). In 2022–23, 48 per cent of course participation pertained to the acquisition of core skills, including customer service, communication, emotional intelligence and performance management. Technical training, including in health and social services, was also provided (HRDC 2023).
In terms of first-order objectives, in 2022–23 around 37,000 workers took courses financed through the HRDF, with around 2,800 reimbursement claims submitted (HRDC 2023). Anecdotal evidence suggests that companies may perceive the levy as a tax, which does not induce them to create additional learning possibilities. Moreover, the scheme primarily covers formal enterprises, posing challenges for incentivizing flexible learning in the informal economy. However, smaller non–levy-paying formal enterprises may be entitled to reimbursements and there is a declared interest to include “special groups, emergent industries and small, micro and medium enterprises” (Palmer 2020).
Compared regionally, the HRDF performs well in terms of quality – rated highly according to trust, its ability to prevent conflicts of interest, data availability and clear objectives. This performance is partly attributed to strong involvement of employers’ representatives (Palmer 2025). Survey data and qualitative information from enterprises who used the HRDF reimbursement mechanism indicate that many perceive the fund as contributing positively to training, skills development and cost-sharing mechanisms. This suggests that second-order objectives of the financial incentive mechanism are met. Some employers, in contrast, raised concerns that training contents did not align well with industry needs, and that administrative requirements, such as course accreditation, were burdensome (HRDC 2019).
From 2008 to 2018, only one third of levy income was spent directly on training reimbursements, with the rest allocated to administrative and operational costs, other skills programmes or carried forward to the next year. Nonetheless, compared to other skills levy systems in Southern Africa, the HRDF remains cost-effective (Palmer 2020).
Example of subsidies for employers
Grants and subsidies are another common mechanism to incentivize employers to offer training and learning opportunities to their employees. These direct transfers to employers can be funded through general taxation, employer levies or social protection transfers (ILO 2023d). Subsidies for employers in the German Federal State of Saxony-Anhalt are a well-documented example. These subsidies cover between 40 and 90 per cent of eligible expenses, with higher rates typically offered to smaller enterprises and for training measures targeting specific groups, such as older workers, workers with low qualifications, single parents and persons with disabilities. The subsidies are capped at €100,000 per project and may be used to finance internal and external training (such as seminars, courses and study programmes), individual and group coaching, formal training and self-directed learning measures (including e-learning, blended learning and related online offers). The subsidies are funded jointly by the European Social Fund Plus from the EU and the State of Saxony-Anhalt (Government of Saxony-Anhalt 2024).
According to the evaluation by Böhmer et al. (2019), the subsidies significantly mobilized employers: 88 per cent of surveyed companies reported that the subsidies either motivated them to provide training they otherwise would not have offered or enabled them to offer trainings earlier and more extensively. Micro- and small enterprises are particularly active in using this financial mechanism to offer short seminars and courses to employees.
Employers also reported positive results aligned with second-order objectives. Enterprises reported that the subsidized courses contributed to expanding employees’ professional skills (95 per cent of survey responses confirmed this), increasing innovation capacities (82 per cent) and enhancing enterprise competitiveness (84 per cent) (see Böhmer et al. 2019). It should be noted that such survey responses are indicative only. To establish causal effectiveness, the comparison to a control group, which does not receive the subsidy, would be required.
The scheme’s administrative costs may seem high: €0.37 is spent on administration for every euro disbursed. However, these costs mainly stem from the rigorous application procedure required to reduce the risk of fraud and misuse. In addition, this calculation does not account for the significant leverage effect of the subsidy: for every euro of funding approved, recipient companies contribute an average of €0.50 (Böhmer et al. 2019).
Example combining training and income support for enterprise creation
In some cases, employers themselves are the direct beneficiaries of financial support aimed at promoting business creation, covering living costs and facilitating access to training (ILO 2023d). The Chilean micro-entrepreneurship programme “Emprendamos Semilla” (“Planting Seeds”), for example, combines business funding with training on effective business practices and personalized mentoring for individuals starting their own business (FOSIS, n.d.; Government of Chile 2023).
In 2023, the programme reached 46,000 participants, primarily comparatively poor individuals, including unemployed or underemployed workers and social security beneficiaries. Women are specifically targeted (FOSIS, n.d.).
Martínez, Puentes and Ruiz-Tagle (2018) evaluated and earlier version of the programme, examining its second-order impacts for participants’ self-employment, wage employment and labour income. The authors compare three randomly assigned groups. The control group comprised social security beneficiaries, who applied but did not receive the financial and training/mentoring support for micro-entrepreneurship creation. The first treatment group received this support. The same was true for the second treatment group, which additionally received a higher financial support. Nine months after participation, the likelihood of being self-employed increased by 14.8 and 25.2 percentage points for the first and second treatment groups, respectively. It also increased the labour income of both groups. Three years later, the positive income effects were still visible for the first treatment group, through transitions into wage employment.
The described effectiveness is conditional on appropriate design and implementation of an intervention. For example, an earlier entrepreneurship programme in Argentina was less effective in improving participants’ outcomes, possibly due to a less structured training component (Almeida and Galasso 2007; see also Asenjo, Escudero and Liepmann 2024). While ALMPs (such as the entrepreneurship initiative described) can be costly, their benefits must be weighed against the often-higher costs of inaction – including increased social protection expenditures and the far-reaching consequences of persistent poverty (Asenjo, Escudero and Liepmann 2024).
Financial mechanisms targeting workers
Example of individual learning accounts
Individual learning accounts are a common means to establish entitlements to lifelong learning for eligible individuals, often through vouchers or credits that enable the participation in learning activities (ILO and UNESCO 2020). Singapore offers one of the most comprehensive entitlement systems for lifelong learning (ILO 2021b; ILO and UNESCO 2020), financed through the Skills Development Fund, which is funded by a payroll levy (UNESCO 2022b). Among other channels, Singaporeans can attend courses through the SkillsFuture Credit. In 2025, citizens aged 25 and above received a non-expiring credit of 500 Singapore dollars (approximately US$390) to freely choose from a wide range of accredited courses. This amount could be increased by 500 Singapore dollars if used by the end of 2025. Moreover, citizens aged 40 and above were entitled to an additional, non-expiring 4,000 Singapore dollars (SkillsFuture SG, n.d. a). Courses range in duration and skills covered; for example, technical skills for the digital and green economy and core skills, including socio-emotional and cognitive ones (SkillsFuture SG, n.d. b).
Regarding first-order effectiveness, many Singaporeans participate in subsidized courses. In 2023, around 520,000 individuals took part, including 200,000 aged 40 and above (SkillsFuture SG 2024). Although a smaller proportion accessed courses through the specific channel of the SkillsFuture Credit, this scheme still encouraged participation of around 25,000 individuals aged 40 and above between May and November 2024 alone (Government of Singapore 2025).
A 2019 survey of training participants revealed a positive perception of second-order effectiveness, with 86 per cent of them that felt the training allowed them to perform their jobs better. Other reported benefits included increased productivity (49 per cent), development of job-related skills (45 per cent), improved service performance (40 per cent), higher self-esteem (32 per cent) and better employment prospects (30 per cent) (UNESCO 2022b).
Jie et al. (2021) provide a quantitative assessment of the effect of course participation on firm outcomes. The evaluated courses are part of the SkillsFuture Singapore system that the SkillsFuture Credit pertains to. However, the study focuses on courses that are organized through employers. Controlling for firm characteristics and sector-specific trends, they find that a 10 percentage point increase in the share of employees receiving sponsored training led to a 0.7 per cent increase in firm revenues and a 0.5 per cent increase in employment over four years. Labour productivity and employee retention improved by 2.2 and 0.6 per cent, respectively, over a two-year period.
Example of subsidized course offerings for workers
Another type of grant to individuals, supporting lifelong learning participation, are training subsidies. One example is the German Volkshochschulen (VHS) or “Adult Education Centres”, which are the main provider of publicly funded voluntary adult education in the country, open to anybody who wants to participate (Bertelsmann Stiftung 2018). They exist in almost every county, as the constitutions of most federal states mandate the provision of local-level lifelong learning (Ruhose, Thomsen and Weilage 2024; Süssmuth and Eisfeld 2018). VHS offer a wide range of courses, typically non-formal and held once a week over a semester, covering areas, such as health, languages, culture and design, vocational skills, ICT, management, politics, society and the environment. In 2019, the VHS budget amounted to €1.4 billion – 68 per cent of which was publicly funded, with the remaining 32 per cent financed through course fees (Huntemann et al. 2021).
In 2019, more than 6 million individuals took VHS courses, 74 per cent of whom were women. Approximately 170,000 participants belonged to specific target groups, such as migrants, older individuals, individuals with low literacy and persons with disabilities. Low-income and unemployed individuals regularly requested the fee exemptions they were eligible to (Huntemann et al. 2021).
Evaluating second-order outcomes of VHS participation, Rupieper and Thomsen (2025a) use the strong VHS expansion after the German reunification as a natural experiment. They find that work-related VHS courses reduced unemployment rates in East German regions neighbouring West Germany, where workers could commute to areas with greater labour demand. The finding is noteworthy, as one would not necessarily expect informal adult education to affect aggregate unemployment. The VHS expansion also increased civic engagement – such as political interest and volunteering – though at the expense of more formal political participation in political parties, municipal politics and citizens’ initiatives (Rupieper and Thomsen 2025b).
Financial mechanism targeting training providers
Example of outcome-based financing
Some financial mechanisms target training providers, including outcome-based financing, whereby a training provider receives a part of the reimbursement conditional on achieving predefined results. Such mechanisms are gaining traction as an innovative way to improve effectiveness of learning provision (Angel-Urdinola and Guedira 2025; ILO 2023d).
For example, the 2009 Liberian Economic Empowerment of Adolescent Girls Programme, which targeted 2,500 young women with training and support for wage employment or business creation. Administered by the World Bank and donor-financed, the programme required training providers to offer services including developing curricula, recruiting participants, offering childcare and delivering training. The programme had an output-based component because bonuses were paid to training providers conditional on participants finding wage employment or starting businesses (Adoho et al. 2014).
While it is not possible to identify the specific contribution of the outcome-based component, the programme as a whole achieved its second-order objectives, at least for women receiving the business creation support. These participants saw significant improvements in employment and earnings, along with greater access to money and self-confidence. Regarding cost-effectiveness, the cost of providing business creation support equalled the estimated increase in participants’ earnings over three years (Adoho et al. 2014).
Whereas outcome-based financing shows promise, it needs to be designed in a way that avoids unintended consequences (Angel-Urdinola and Guedira 2025; ILO 2023d). For example, a mere focus on placing participants in employment may lead training providers to neglect vulnerable groups or compromise job quality. This can be mitigated by defining outcomes in a more comprehensive manner.
5.5. Conclusion
This chapter has underscored the urgent need to transform lifelong learning systems to meet the demands of a rapidly evolving world of work. Overcoming the barriers to lifelong learning participation requires coordinated multifaceted solutions. At the individual level, targeted financial support, flexible and modular training formats, accessible learning environments and stronger information and career guidance can ease financial, time-related and informational constraints – particularly for disadvantaged groups. Yet, individual-level measures alone are not enough.
Systemic challenges – such as fragmented governance, weak coordination and limited institutional capacity – must also be addressed. This calls for stronger coordination and collaboration across ministries and other levels of government, clarifying stakeholder roles, establishing robust quality assurance systems and investing in data infrastructure for skills anticipation and evaluation. Only with coherent and integrated systems in place can lifelong learning become truly inclusive and adaptive.
Equally important is ensuring that the learning opportunities made available are effective, well-targeted and focused on developing the skill sets needed for improving employment outcomes and enhancing adaptability – identified in Chapters 3 and 4. The success of skills policies hinges not only on what is delivered, but also on how, to whom and in what context. As the meta-analysis shows, programmes that combine classroom and practical training lead to recognized qualifications and develop integrated skill sets are associated with stronger employment outcomes. In particular, cognitive and manual skills are especially important for securing employment, while socio-emotional skills contribute more significantly to job quality and wage growth. Women tend to benefit more consistently from training interventions, particularly in employment and earnings, highlighting its potential to address structural barriers faced by women in labour markets. However, outcomes vary widely depending on participant characteristics, programme design and local context. Tailoring interventions to these factors is therefore essential to advancing both equity and impact.
Financing remains a cornerstone of reform and an enabler of the above. Given the broad scope of lifelong learning – spanning formal and informal learning, as well as initial and continuing education and training – sustainable funding models must reflect this complexity. Public investment should prioritize foundational and remedial learning and targeted support for vulnerable groups. At the same time, incentives for employer engagement, co-financing mechanisms and frameworks to support lifelong access to learning are critical to building resilient systems. Effective financing is not just about how much is spent, but also how strategically resources are allocated, targeted and governed.
These transformations require shared responsibility. Governments must lead in setting national visions and regulatory frameworks, while enabling systems to be flexible and adaptable. Employers are critical partners in shaping demand-driven training and co-financing workforce development, in consultation with employers’ and workers’ organizations. Workers’ organizations play a vital role in promoting equity and representation. At the same time, workers themselves must be empowered and supported to take an active role in their own learning. Training providers and intermediaries must innovate in delivery and collaborate across sectors. Development partners can help build capacity, particularly in low- and middle-income countries.
Looking ahead, the twin pressures of digitalization and the green transition – alongside demographic shifts and rising global uncertainty – will continue to reshape skills needs and learning modalities. Lifelong learning systems must evolve to meet these challenges. This requires moving beyond fragmented, ad hoc training initiatives, toward integrated, inclusive and future-oriented skills systems that support skills development at every stage of life. Only then can lifelong learning truly underpin inclusive growth, resilience and decent work in an era of change.
73 Including Bangladesh, Cabo Verde, Chile, China, Colombia, Congo, Costa Rica, India, Indonesia, Madagascar, Mexico, Montenegro, Morocco, Philippines, Republic of Moldova, Saudi Arabia, Senegal, South Africa, Türkiye, United Republic of Tanzania and Viet Nam.
74 For more details on the survey, see box 2.2 and the methodological note available on the report’s website (https://www.ilo.org/lifelong-learning-and-skills-future). The surveys do not produce findings that are generalizable across countries, but rather shed light on pertinent lifelong learning–related questions, which have been difficult to answer with previously existing survey instruments.
75 The figures refer to all respondents, including currently employed and non-employed individuals. The same survey responses are not available for the United Republic of Tanzania.
76 In policy frameworks, skills are often categorized as: (i) job- or occupation-specific technical skills; (ii) transferable or core employability (soft) skills; and (iii) foundational skills, such as literacy and numeracy. In this chapter, skills are categorized as manual, socio-emotional and cognitive to align with the categorization used in Chapters 3 and 4. It is possible nevertheless to cross-walk skills between the two frameworks as explained in footnote 45 in Chapter 3.
77 For more details about the interpretation of the size of effects, see Escudero, Delaporte and Malo (forthcoming).
78 While internships constitute a form of on-the-job experience, the meta-analysis distinguishes them from the broader category of workplace-based training provided to workers (that is, referred to as “on-the-job”) to capture the effects of this structured, time-bound placements often targeting youth. These categories are mutually exclusive in the analysis.
79 Importantly, the meta-analysis does not distinguish between paid and unpaid internships, which may lead to different employment outcomes. In that respect, the ILO recommends that internships should be adequately remunerated to ensure fair access and quality learning experiences (ILO 2014).
80 In this meta-analysis, individuals with structural disadvantages in the labour market are defined as those facing economic or social vulnerability, including the poor, unemployed, low-skilled, informally employed, displaced persons or members of marginalized groups, such as refugees, ex-combatants and victims of conflict or violence.
81 ILO (2020) and UNESCO (2022b) focused on training funds; OECD (2004) on co-financing instruments; ILO and UNESCO (2020) on entitlement systems.
82 Galhardi (2002) focused on Latin America and Cedefop (2020) on the European Union.
83 The structure of first- and second-order objectives originates from monitoring and evaluation research (Käpplinger, Klein and Haberzeth 2013) with a possible mapping into a “theory of change” approach, where first-order objectives correspond to outputs and second-order objectives to outcomes and possibly impacts.
84 The effectiveness of such investments – and, hence, the cost–benefit considerations – are conditional on effective design and implementation characteristics of the respective interventions (see Asenjo, Escudero and Liepmann (2024); Carranza and McKenzie (2024); and section 5.3).
-
References
Acevedo, Paloma, Guillermo Cruces, Paul Gertler and Sebastian Martinez. 2020. “How Vocational Education Made Women Better Off but Left Men Behind”. Labour Economics 65: 101824. https://doi.org/10.1016/j.labeco.2020.101824.
ADB (African Development Bank). 2020. African Economic Outlook 2020: Developing Africa’s Workforce for the Future. https://www.afdb.org/en/documents/african-economic-outlook-2020.
Adoho, Franck M., Shubha Chakravarty, Dala T. Korkoyah, Mattias Lundberg and Afia Tasneem. 2014. “The Impact of an Adolescent Girls Employment Program: The EPAG Project in Liberia”. World Bank Policy Research Working Paper No. 6832. https://hdl.handle.net/10986/17718.
Aedo, Cristián, and Marcelo Pizarro. 2004. “Rentabilidad económica del programa de capacitación laboral de jóvenes Chile Joven”. Scribd. https://es.scribd.com/document/371082354/Rentabilidad-Economica-de-Los-Programas-de-Capacitacion.
Agarwal, Anvi, and Shagnik Chakravarty. 2021. “Perceived Returns to Education and Its Impact on Schooling Decisions”. Paper presented at N.C. Ray Memorial Paper, Delhi, India. https://www.researchgate.net/publication/355584148_Perceived_Returns_To_Education_And_Its_Impact_On_Schooling_Decisions.
Alfonsi, Livia, Oriana Bandiera, Vittorio Bassi, Robin Burgess, Imran Rasul, Munshi Sulaiman and Anna Vitali. 2020. “Tackling Youth Unemployment: Evidence from a Labor Market Experiment in Uganda”. Econometrica 88 (6): 2369–2414. https://doi.org/10.3982/ECTA15959.
Alfonsi, Livia, Vittorio Bassi, Imran Rasul and Elena Spadini. 2024. “Firm Responses to Uncertainty and Implications for Workers: Experimental Evidence from Uganda during the Pandemic”. NBER Working Paper No. 32785. National Bureau of Economic Research. https://doi.org/10.3386/w32785.
Allemand, Mathias, Martina Kirchberger, Sveta Milusheva, Carol Newman, Brent Roberts and Vincent Thorne. 2023. “Conscientiousness and Labor Market Returns: Evidence from a Field Experiment in West Africa”. World Bank Policy Research Working Paper No. 10378. https://doi.org/10.1596/1813-9450-10378.
Almeida, Rita, and Emanuela Galasso. 2007. “Jump-Starting Self-Employment? Evidence among Welfare Participants in Argentina”. World Bank Policy Research Working Paper No. 4270. https://doi.org/10.1596/1813-9450-4270.
Angelucci, Manuela, Rachel Heath and Eva Noble. 2023. “Multifaceted Programs Targeting Women in Fragile Settings: Evidence from the Democratic Republic of Congo”. Journal of Development Economics 164: 103146. https://doi.org/10.1016/j.jdeveco.2023.103146.
Angel-Urdinola, Diego, and Fatine Guedira. 2025. Paying for Performance: Unlocking the Potential of Results-Based Financing in TVET. Skills4Dev Issue 4. World Bank Group. http://documents.worldbank.org/curated/en/099751305052525457.
Aramburu, Julian, Ana Goicoechea and Ahmed Mushfiq Mobarak. 2021. “Coding Bootcamps for Female Digital Employment: Evidence from an RCT in Argentina and Colombia”. World Bank Policy Research Working Paper No. 9721. http://documents.worldbank.org/curated/en/670761624977598623.
Asenjo, Antonia, Verónica Escudero and Hannah Liepmann. 2024. “Why Should We Integrate Income and Employment Support? A Conceptual and Empirical Investigation”. The Journal of Development Studies 60 (1): 1–29. https://doi.org/10.1080/00220388.2023.2246621.
Attanasio, Orazio, Adriana Kugler and Costas Meghir. 2011. “Subsidizing Vocational Training for Disadvantaged Youth in Colombia: Evidence from a Randomized Trial”. American Economic Journal: Applied Economics 3 (3): 188–220. https://doi.org/10.1257/app.3.3.188.
Barrera-Osorio, Felipe, Adriana Kugler and Mikko Silliman. 2023. “Hard and Soft Skills in Vocational Training: Experimental Evidence from Colombia”. The World Bank Economic Review 37 (3): 409–436. https://doi.org/10.1093/wber/lhad007.
Bartel, Ann. 2000. “Measuring the Employer’s Return on Investments in Training: Evidence from the Literature”. Industrial Relations 39 (3): 502–524. https://doi.org/10.1111/0019-8676.00178.
Bedoya, Guadalupe, Aidan Coville, Johannes Haushofer, Mohammad Isaqzadeh and Jeremy P. Shapiro. 2019. “No Household Left Behind: Afghanistan Targeting the Ultra Poor Impact Evaluation”. NBER Working Paper No. 25981. National Bureau of Economic Research. https://doi.org/10.3386/w25981.
Bertelsmann Stiftung. 2018. Deutscher Weiterbildungsatlas: Teilnahme und Angebot in Kreisen und kreisfreien Städten. https://doi.org/10.11586/2018057.
Blázquez, Maite, Ainhoa Herrarte and Felipe Sáez. 2019. “Training and Job Search Assistance Programmes in Spain: The Case of Long-Term Unemployed”. Journal of Policy Modeling 41 (2): 316–335. https://doi.org/10.1016/j.jpolmod.2019.03.004.
Bogliaccini, Juan, Aldo Madariaga, Miski Peralta and Soledad Marzoa. 2022. “(Un)Employment and Skills Formation in Chile: An Exploration of the Effects of Training in Labour Market Transitions”. ILO Working Paper No. 57. https://doi.org/10.54394/VEIN3474.
Böhmer, Simon, Maren Gollan, Marcus Neureiter and Henriette Reichwald. 2019. Beitrag des ESF zur betrieblichen und wissenschaftlichen Weiterbildung in Sachsen-Anhalt: Evaluation der Förderprogramme Weiterbildung Direkt und Weiterbildung Betrieb. https://europa.sachsen-anhalt.de/fileadmin/Bibliothek/Politik_und_Verwaltung/StK/Europa/Z-Aussonderungsakte/ESI-Fonds-Neu_2017/Dokumente/Bewertungsberichte_2014-2020/19_09_25_Weiterbildung_Betrieb_und_Direkt_Finaler_Bericht.pdf.
Calderone, Margherita, Nathan Fiala, Lemayon Lemilia Melyoki, Annekathrin Schoofs and Rachel Steinacher. 2022. “Making Intense Skills Training Work at Scale: Evidence on Business and Labor Market Outcomes in Tanzania”. Ruhr Economic Papers, No. 950. https://doi.org/10.4419/96973113.
Card, David, Jochen Kluve and Andrea Weber. 2018. “What Works? A Meta Analysis of Recent Active Labor Market Program Evaluations”. Journal of the European Economic Association 16 (3): 894–931. https://doi.org/10.1093/jeea/jvx028.
Carranza, Eliana, and David McKenzie. 2024. “Job Training and Job Search Assistance Policies in Developing Countries”. Journal of Economic Perspectives 38 (1): 221–244. https://doi.org/10.1257/jep.38.1.221.
Carton, Michel, and Christine Hofmann. 2023. The Education–Training–Work Continuums: Pathways to Socio-Professional Inclusion for Youth and Adults. NORRAG Special Issue 08. https://resources.norrageducation.org/resource/779/the-education-training-work-continuums-pathways-to-socio-professional-inclusion-for-youth-and-adults.
Cedefop. 2018. Reaching out to “Invisible” Young People and Adults. https://data.europa.eu/doi/10.2801/63030.
———. 2020. Financing Apprenticeships in the EU. https://www.cedefop.europa.eu/en/publications/4192.
———. 2022a. High Esteem but Low Participation: Strong Belief in the Value of Learning and the Pressing Need for Skills Are Not Enough to Motivate Adults to Participate in Lifelong Learning. https://data.europa.eu/doi/10.2801/407410.
———. 2022b. Setting Europe on Course for a Human Digital Transition: New Evidence from Cedefop’s Second European Skills and Jobs Survey. https://www.cedefop.europa.eu/en/publications/3092.
———. 2024. European Inventory of Validation of Informal and Non-Formal Learning 2023: Overview Report. https://data.europa.eu/doi/10.2801/64271.
Chakravarty, Shubha, Mattias Lundberg, Plamen Nikolov and Juliane Zenker. 2019. “Vocational Training Programs and Youth Labor Market Outcomes: Evidence from Nepal”. Journal of Development Economics 136: 71–110. https://doi.org/10.1016/j.jdeveco.2018.09.002.
Chinen, Marjorie, Thomas de Hoop, Lorena Alcázar, María Balarin and Josh Sennett. 2017. “Vocational and Business Training to Improve Women’s Labour Market Outcomes in Low- and Middle-Income Countries: A Systematic Review”. Campbell Systematic Reviews 13 (1): 1–195. https://doi.org/10.4073/csr.2017.16.
Crépon, Bruno, Elise Huillery, Esther Duflo, William Parienté and Juliette Seban. 2014. Effets du dispositif d’accompagnement à la création d’entreprise CréaJeunes: Résultats d’une expérience contrôlée. Fonds d’Expérimentation pour la Jeunesse. https://sciencespo.hal.science/hal-03613288.
Crépon, Bruno, and Patrick Premand. 2025. “Direct and Indirect Effects of Subsidized Dual Apprenticeships”. The Review of Economic Studies 92 (5): 2979–3028. https://doi.org/10.1093/restud/rdae094.
Da Mata, Daniel, Rodrigo Oliveira and Diana Silva. 2025. “Who Benefits from Job Training Programs? Evidence from a High-Dosage Program in Brazil”. Journal of Development Economics 175: 103476. https://doi.org/10.1016/j.jdeveco.2025.103476.
Das, Narayan. 2021. “Training the Disadvantaged Youth and Labor Market Outcomes: Evidence from Bangladesh”. Journal of Development Economics 149: 102585. https://doi.org/10.1016/j.jdeveco.2020.102585.
Davis, Jonathan M.V., and Sara B. Heller. 2020. “Rethinking the Benefits of Youth Employment Programs: The Heterogeneous Effects of Summer Jobs”. The Review of Economics and Statistics 102 (4): 664–677. https://doi.org/10.1162/rest_a_00850.
De la Rica, Sara, and Lucía Gorjón. 2022. “Internship Contracts in Spain: A Stepping Stone or a Hurdle towards Job Stability?”. SERIEs 13 (1–2): 51–100. https://doi.org/10.1007/s13209-022-00261-z.
de Mel, Suresh, David McKenzie and Christopher Woodruff. 2014. “Business Training and Female Enterprise Start-Up, Growth, and Dynamics: Experimental Evidence from Sri Lanka”. Journal of Development Economics 106: 199–210. https://doi.org/10.1016/j.jdeveco.2013.09.005.
Deming, David J. 2022. “Four Facts about Human Capital”. Journal of Economic Perspectives 36 (3): 75–102. https://doi.org/10.1257/jep.36.3.75.
du Plessis, Michael, Wouter Bam, Carla Serfontein and Philani Zincume. Forthcoming. Costing Lifelong Learning in South Africa. ILO.
Eichhorst, Werner, Núria Rodríguez-Planas, Ricarda Schmidl and Klaus F. Zimmermann. 2015. “A Road Map to Vocational Education and Training in Industrialized Countries”. ILR Review 68 (2): 314–337. https://doi.org/10.1177/0019793914564963.
Escudero, Verónica. 2018. “Are Active Labour Market Policies Effective in Activating and Integrating Low-Skilled Individuals? An International Comparison”. IZA Journal of Labor Policy 7 (1): 4. https://doi.org/10.1186/s40173-018-0097-5.
Escudero, Verónica, Isaure Delaporte and Miguel Á. Malo. Forthcoming. “The Effectiveness of Skills Development Policies: Evidence from a Meta-Analysis”. ILO Working Paper.
Escudero, Verónica, Jochen Kluve, Elva López Mourelo and Clemente Pignatti. 2019. “Active Labour Market Programmes in Latin America and the Caribbean: Evidence from a Meta-Analysis”. The Journal of Development Studies 55 (12): 2644–2661. https://doi.org/10.1080/00220388.2018.1546843.
Escudero, Verónica, and Hannah Liepmann. 2020. “Delivering Income and Employment Support in Times of COVID-19: Integrating Cash Transfers with Active Labour Market Policies”. ILO Policy Brief. https://researchrepository.ilo.org/esploro/outputs/995219450102676.
ETF (European Training Foundation). 2022. A Review of National Career Development Support Systems: Armenia, Azerbaijan, Georgia and Ukraine. https://www.etf.europa.eu/en/publications-and-resources/publications/review-national-career-development-support-systems-armenia.
Fiszbein, Ariel, María Oviedo and Sarah Stanton. 2018. Educación técnica y formación profesional en América Latina y el Caribe: desafíos y oportunidades. CAF – Banco de desarrollo de América Latina y El Caribe. https://scioteca.caf.com/handle/123456789/1345.
Foged, Mette, Linea Hasager and Giovanni Peri. 2024. “Comparing the Effects of Policies for the Labor Market Integration of Refugees”. Journal of Labor Economics 42 (S1): S335–S377. https://doi.org/10.1086/728806.
FOSIS (Fondo de Solidaridad e Inversión Social). n.d. “Programa Emprendamos Semilla”. https://www.fosis.gob.cl/es/programas/autonomia-economica/emprendamos-semilla/.
Galhardi, Regina. 2002. “Financing Training: Innovative Approaches in Latin America”. ILO Skills Working Paper No. 12. https://researchrepository.ilo.org/esploro/outputs/995328539602676.
Ghirelli, Corinna, Enkelejda Havari, Giulia Santangelo and Marta Scettri. 2019. “Does On-the-Job Training Help Graduates Find a Job? Evidence from an Italian Region”. International Journal of Manpower 40 (3): 500–524. https://doi.org/10.1108/IJM-02-2018-0062.
Giesecke, Matthias, and Eric Schuss. 2019. “Heterogeneity in Marginal Returns to Language Training of Immigrants”. IAB Discussion Paper No. 19/2019. Institute for Employment Research. https://hdl.handle.net/10419/204866.
Government of Chile, Ministerio de Hacienda. 2023. Yo emprendo semilla. Fondo de solidaridad e inversión social. Monitoreo y seguimiento oferta pública. http://bibliotecadigital.dipres.gob.cl/handle/11626/23049?show=full.
Government of India. 2025. “A Decade of Building Skills & Empowering Dreams: 10 Years of Pradhan Mantri Kaushal Vikas Yojana”. 14 July 2025. https://www.pib.gov.in/PressNoteDetails.aspx?NoteId=154880&ModuleId=3.
Government of India, Ministry of Skill Development and Entrepreneurship. n.d. Skill India Transforming India. https://static.pib.gov.in/WriteReadData/specificdocs/documents/2022/apr/doc202242548301.pdf.
Government of Saxony-Anhalt, MASGG (Ministerium für Arbeit, Soziales, Gesundheit und Gleichstellung). 2024. Richtlinie über die Gewährung von Zuwendungen zur Förderung der beruflichen Weiterbildung von Beschäftigten in Unternehmen sowie zur Förderung von individuellen beruflichen Weiterbildungen und Zusatzqualifikationen aus Mitteln des Europäischen Sozialfonds Plus und des Landes Sachsen-Anhalt (Richtlinie Sachsen-Anhalt WEITERBILDUNG). https://www.landesrecht.sachsen-anhalt.de/bsst/document/VVST-VVST000013410.
Government of Singapore, Ministry of Education. 2025. “SkillsFuture Credit (Mid-Career) Utilisation”. https://www.moe.gov.sg/news/parliamentary-replies/20250108-skillsfuture-credit-mid-career-utilisation.
Groh, Matthew, Nandini Krishnan, David McKenzie and Tara Vishwanath. 2016. “The Impact of Soft Skills Training on Female Youth Employment: Evidence from a Randomized Experiment in Jordan”. IZA Journal of Labor & Development 5 (1): 9. https://doi.org/10.1186/s40175-016-0055-9.
Grunau, Philipp, and Julia Lang. 2020. “Retraining for the Unemployed and the Quality of the Job Match”. Applied Economics 52 (47): 5098–5114. https://doi.org/10.1080/00036846.2020.1753879.
Haelermans, Carla, and Lex Borghans. 2011. Wage Effects of On-the-Job Training: A Meta-Analysis. IZA Discussion Paper No. 6077. Institute of Labor Economics. https://ssrn.com/abstract=1958732.
Hofmann, Christine, Markéta Zelenka, Boubakar Savadogo and Wendy Lynn Akinyi Okolo. 2022. “How to Strengthen Informal Apprenticeship Systems for a Better Future of Work?: Lessons Learned from Comparative Analysis of Country Cases”. ILO Working Paper No. 49. https://doi.org/10.54394/WJEK5468.
HRDC (Human Resource Development Council). 2019. Human Resource Development Fund Impact Study. https://www.hrdc.org.bw/web/publication-type/hrdc-annual-reports.
———. 2023. Annual Report 2022/2023. https://www.hrdc.org.bw/web/publication-type/hrdc-annual-reports.
Huntemann, Hella, Nicolas Echarti, Thomas Lux and Elisabeth Reichart. 2021. Volkshochschul-Statistik. DIE Survey. Deutsches Institut für Erwachsenenbildung. https://doi.org/10.3278/85/0025w.
ILO. 2014. General Survey of the Reports on the Minimum Wage Fixing Convention, 1970 (No. 131), and the Minimum Wage Fixing Recommendation, 1970 (No. 135). ILC.103/III/1.B. https://libguides.ilo.org/conference/101-105#s-lg-box-16354284.
———. 2018. Guidelines Concerning Measurement of Qualifications and Skills Mismatches of Persons in Employment. ICLS/20/2018/Guidelines. https://ilostat.ilo.org/about/standards/icls/icls-documents/.
———. 2019. “What Works: Promoting Pathways to Decent Work”. ILO Research Brief No. 12. https://researchrepository.ilo.org/esploro/outputs/995219485102676.
———. 2020. “Effective Governance and Coordination in Skills Systems: Towards a Lifelong Learning Ecosystem”. ILO Policy Brief. https://researchrepository.ilo.org/esploro/outputs/995218924202676.
———. 2021a. A Review of National Career Development Support Systems: Armenia, Moldova, Panama and Viet Nam. https://labordoc.ilo.org/permalink/41ILO_INST/j3q9on/alma995164092802676.
———. 2021b. “Financing and Incentives for Skills Development: Making Lifelong Learning a Reality?”. ILO Policy Brief. https://researchrepository.ilo.org/esploro/outputs/995218597002676.
———. 2022. Juventudes vulnerables, competencias digitales y formación profesional en América Latina. https://researchrepository.ilo.org/esploro/outputs/995319475702676.
———. 2023a. Public Employment Services and Active Labour Market Policies for Transitions: Global Report Part I, Response to Mega Trends and Crises. https://doi.org/10.54394/TYMB4838.
———. 2023b. The ILO Strategy on Skills and Lifelong Learning 2030. https://researchrepository.ilo.org/esploro/outputs/995319472602676.
———. 2023c. “Aligning Skills Development and National Social Protection Systems”. Discussion Paper. https://researchrepository.ilo.org/esploro/outputs/995340190902676.
———. 2023d. Financing Mechanisms for Promoting Social Inclusion in Skills and Lifelong Learning Systems: Global Overview of Current Practices and Policy Options. https://researchrepository.ilo.org/esploro/outputs/995326518302676.
———. 2024. Resolution concerning decent work and the care economy. International Labour Conference. 112th Session. https://labordoc.ilo.org/permalink/41ILO_INST/so1tlh/alma995376393002676.
———. 2025. The State of Social Justice: A Work in Progress. https://doi.org/10.54394/ASWD9537.
———. Forthcoming. A Review of Outcome-Based Financing Practices in Lifelong-Learning.
ILO and UNESCO. 2020. A Review of Entitlement Systems for LLL. https://researchrepository.ilo.org/esploro/outputs/995219002202676.
Jensen, Robert. 2010. “The (Perceived) Returns to Education and the Demand for Schooling”. The Quarterly Journal of Economics 125 (2): 515–548. https://doi.org/10.1162/qjec.2010.125.2.515.
Jie, Ang Kang, Jonathan Khoo, Marsha Teo and Wen Jia Ying. 2021. “Firm-Level Returns to Employer-Sponsored Training”. Economic Survey of Singapore Second Quarter 2021, 36–43. https://www.mti.gov.sg/resources/economic-survey-of-singapore/economic-survey-of-singapore-and-feature-articles/firm-level-returns-to-employer-sponsored-training/#.
Käpplinger, Bernd, Rosemarie Klein and Erik Haberzeth. 2013. “Wirkungsforschung in der Weiterbildung: ‘... es kommt aber darauf an, sie zu verändern’“. In Weiterbildungsgutscheine: Wirkungen eines Finanzierungsmodells in vier europäischen Ländern, edited by Bernd Käpplinger, Rosemarie Klein and Erik Haberzeth, 15–35. Bielefeld: Bertelsmann. https://doi.org/10.25656/01:8578.
Kluve, Jochen, Susana Puerto, David Robalino, Jose M. Romero, Friederike Rother, Jonathan Stöterau, Felix Weidenkaff and Marc Witte. 2019. “Do Youth Employment Programs Improve Labor Market Outcomes? A Quantitative Review”. World Development 114: 237–253. https://doi.org/10.1016/j.worlddev.2018.10.004.
Konings, Jozef, and Stijn Vanormelingen. 2015. “The Impact of Training on Productivity and Wages: Firm-Level Evidence”. The Review of Economics and Statistics 97 (2): 485–497. https://doi.org/10.1162/REST_a_00460.
Korpi, Tomas, and Michael Tåhlin. 2021. “On-the-Job Training: A Skill Match Approach to the Determinants of Lifelong Learning”. Industrial Relations Journal 52 (1): 64–81. https://doi.org/10.1111/irj.12317.
Martínez A., Claudia, Esteban Puentes and Jaime Ruiz-Tagle. 2018. “The Effects of Micro-Entrepreneurship Programs on Labor Market Performance: Experimental Evidence from Chile”. American Economic Journal: Applied Economics 10 (2): 101–124. https://doi.org/10.1257/app.20150245.
NSDC (National Skill Development Corporation). 2019. Impact Evaluation of Pradhan Mantri Kaushal Vikas Yojana (PMKVY) 2.0. https://www.scribd.com/document/698596498/PMKVY-2-0-Impact-Evaluation-Report-Executive-Summary.
OECD (Organisation for Economic Co-operation and Development). 2004. Co-Financing Lifelong Learning: Towards a Systemic Approach. https://doi.org/10.1787/9789264018129-en.
———. 2024. Education at a Glance 2024: OECD Indicators. https://doi.org/10.1787/c00cad36-en.
———. 2025. Trends in Adult Learning: New Data from the 2023 Survey of Adult Skills. https://doi.org/10.1787/ec0624a6-en.
OSHRI (Occupational Safety and Health Research Institute). 2020. “Korean Working Conditions Survey Microdata 6th Edition”. https://oshri.kosha.or.kr/eoshri/resources/KWCSDownload.do.
Palmer, Robert. 2020. A Review of Skills Levy Systems in Countries of the Southern African Development Community. https://researchrepository.ilo.org/esploro/outputs/995218889602676.
———. 2025. Meaningful Employers’ Engagement: Key to Boost Training Funds’ Quality in Sub-Saharan Africa? ILO. https://labordoc.ilo.org/permalink/41ILO_INST/j3q9on/alma995665655802676.
Pastore, Francesco, and Marco Pompili. 2019. “Assessing the Impact of Off- and On-the-Job Training on Employment Outcomes: A Counterfactual Evaluation of the PIPOL Program”. GLO Discussion Paper No. 333. Global Labor Organization. https://ideas.repec.org//p/zbw/glodps/333.html.
Psacharopoulos, George, and Harry Anthony Patrinos. 2018. “Returns to Investment in Education: A Decennial Review of the Global Literature”. Education Economics 26 (5): 445–458. https://doi.org/10.1080/09645292.2018.1484426.
Ruhose, Jens, Stephan L. Thomsen and Insa Weilage. 2024. “No Mental Retirement: Estimating Voluntary Adult Education Activities of Older Workers”. Education Economics 32 (4): 440–473. https://doi.org/10.1080/09645292.2023.2229078.
Rupieper, Li Kathrin Kaja, and Stephan L. Thomsen. 2025a. “Can Voluntary Adult Education Reduce Unemployment? Causal Evidence from East Germany after Reunification”. Journal for Labour Market Research 59: 2. https://doi.org/10.1186/s12651-024-00379-6.
Rupieper, Li Kathrin Kaja, and Stephan L. Thomsen. 2025b. “Does Adult Education Foster Democracy? Causal Evidence from German Volkshochschulen”.
Schuetze, Hans G. 2008. “Financing Lifelong Learning”. In The Routledge International Handbook of Lifelong Learning, edited by Peter Jarvis, 370–385. London: Routledge.
SkillsFuture SG. 2024. “Press Release: More Employers and Mid-Career Workers Taking Up SSG-Supported Training”, 22 March 2024. https://www.skillsfuture.gov.sg/newsroom/more-employers-and-mid-career-workers-taking-up-ssg-supported-training.
———. n.d. a. “SkillsFuture Credit”. https://www.myskillsfuture.gov.sg/content/portal/en/career-resources/career-resources/education-career-personal-development/SkillsFuture_Credit.html.
———. n.d. b. “Singapore Workforce Skills Qualifications (WSQ)”. https://www.skillsfuture.gov.sg/wsq.
Stanley, T. D., and Hristos Doucouliagos. 2015. “Neither Fixed nor Random: Weighted Least Squares Meta-Analysis”. Statistics in Medicine 34 (13): 2116–2127. https://doi.org/10.1002/sim.6481.
Stöterau, Jonathan, Johanna Kemper and Andrea Ghisletta. 2022. “The Impact of Vocational Training Interventions on Youth Labor Market Outcomes: A Meta-Analysis”. Preprint Research Paper. http://dx.doi.org/10.2139/ssrn.4217580.
Süssmuth, Rita, and Karl Heinz Eisfeld. 2018. “Volkshochschule”. In Handbuch Erwachsenenbildung/Weiterbildung, edited by Rudolf Tippelt and Aiga von Hippel, 763–784. Wiesbaden, Germany: Springer Reference Sozialwissenschaften. https://doi.org/10.1007/978-3-531-19979-5_37.
Tomlinson, Jennifer, Marian Baird, Peter Berg and Rae Cooper. 2018. “Flexible Careers across the Life Course: Advancing Theory, Research and Practice”. Human Relations 71 (1): 4–22. https://doi.org/10.1177/0018726717733313.
UNESCO (United Nations Educational, Scientific and Cultural Organization). 2010. CONFINTEA VI, Belém Framework for Action: Harnessing the Power and Potential of Adult Learning and Education for a Viable Future. https://unesdoc.unesco.org/ark:/48223/pf0000187789.
———. 2018. Virtual Conference Report on Improving the Image of TVET. https://unevoc.unesco.org/up/vc_synthesis_21.pdf.
———. 2022a. 5th Global Report on Adult Learning and Education: Citizenship Education – Empowering Adults for Change. https://doi.org/10.54675/KPEX8783.
———. 2022b. Global Review of Training Funds: Spotlight on Levy-Schemes in 75 Countries. https://doi.org/10.54675/MPMZ1114.
———. n.d. “Fifth Global Report on Adult Learning and Education”. https://www.uil.unesco.org/en/grale5.
UNESCO and ILO. 2018. Taking a Whole of Government Approach to Skills Development. https://doi.org/10.54675/SGOS3486.
Vooren, Melvin, Carla Haelermans, Wim Groot and Henriëtte Maassen van den Brink. 2019. “The Effectiveness of Active Labor Market Policies: A Meta-Analysis”. Journal of Economic Surveys 33 (1): 125–149. https://doi.org/10.1111/joes.12269.
Williams, Jenny, Stephen McNair and Fiona Aldridge. 2010. Expenditure and Funding Models in Lifelong Learning: A Context Paper. National Institute of Adult Continuing Education.
World Bank. 2003. Lifelong Learning in the Global Knowledge Economy: Challenges for Developing Countries. http://documents.worldbank.org/curated/en/528131468749957131.
Lifelong learning systems enable workers, both young and old, to access decent employment, while setting the foundation for enterprises to innovate and societies to thrive. Creating such systems requires an ambitious vision that advances social, civic and environmental goals in addition to economic ones.
This report discusses the conceptual foundations of lifelong learning, provides novel analyses based on institutional data, big-data analytics and a meta-analysis of 167 impact evaluations, and pilots an original survey tool that assesses learning at work. It finds that too many adults lack access to quality training. It further underlines that rounded skills profiles are associated with good employment outcomes and stresses that all skills need to be adequately recognised and remunerated, especially those creating social value
The report defines the building blocks of successful lifelong learning systems, including strong governance, institutional coordination, sustainable financing and social dialogue. Building such learning environments helps ensure that everyone, everywhere, can learn, work and live with dignity in a changing world.