


POPULATION AGEING: Alternative measures of dependency and implications for the future of work
Abstract
The world’s population is getting older, a phenomenon that has important implications for the future of work. Persons aged 55 years and over are expected to outnumber all children aged 0 to 14 years by 2035 and the entire child and youth population aged 0 to 24 years by 2080. As a direct consequence of population ageing, the number of older workers aged 55 to 64 years is increasing and is set to equal one quarter of the global labour force by 2030.
This paper examines the projected labour force participation trends of older workers to 2030 and discusses the future of economic dependency for developing, emerging and developed countries. It introduces five alternative measures of economic dependency to account for the fact that persons of working age may not be working or may be facing employment conditions that compromise their capacity to support themselves and others. Such conditions include scenarios where workers are unable to work as many hours as they would like, or where they are in situations of vulnerable employment or working poverty. These alternative measures therefore not only take into account demographic and quantitative labour market characteristics, such as age structure, activity status and unemployment, but also consider qualitative dimensions such as underemployment, labour income and vulnerability.
Using a very rich ILO data set that provides a consistent series of labour market data for all countries with forecasts to 2024 and beyond, the paper provides estimates for these new dependency measures and makes a number of policy recommendations to address the impact of ageing on decent work.
Introduction
The world’s population is getting older, a phenomenon that has important implications for the future of work. In 2014, persons aged 55 years and over outnumbered young persons aged 15 to 24 years, and they are expected to outnumber all children aged 0 to 14 years by 2035 and the entire child and youth population aged 0 to 24 years by 2080
This paper is structured as follows: the first chapter takes a closer look at global population ageing and the labour force participation trends of older workers,1 based on the projections of the International Labour Organization (ILO) and the United Nations Department of Economic and Social Affairs (UNDESA). In the second chapter, alternative measurements of dependency are proposed that take into account the fact that many working-age persons either do not participate in the labour market or face employment conditions that compromise their economic independence. Such conditions include situations where workers are unable to support any dependants or do not contribute through taxes and wealth creation to the financing of education, healthcare and social protection. These alternative measures are disaggregated by sex and based on age-specific indicators of labour market activity and unemployment, as well as on qualitative components of employment, such as income, working hours and vulnerability. In a demographic context of an ageing labour force, these new measures indicate possible policy directions for avoiding unsustainable dependency rates, which would undermine economic and social development. The report concludes with a summary of our findings and specific policy options.
Population ageing and labour force trends among older age cohorts
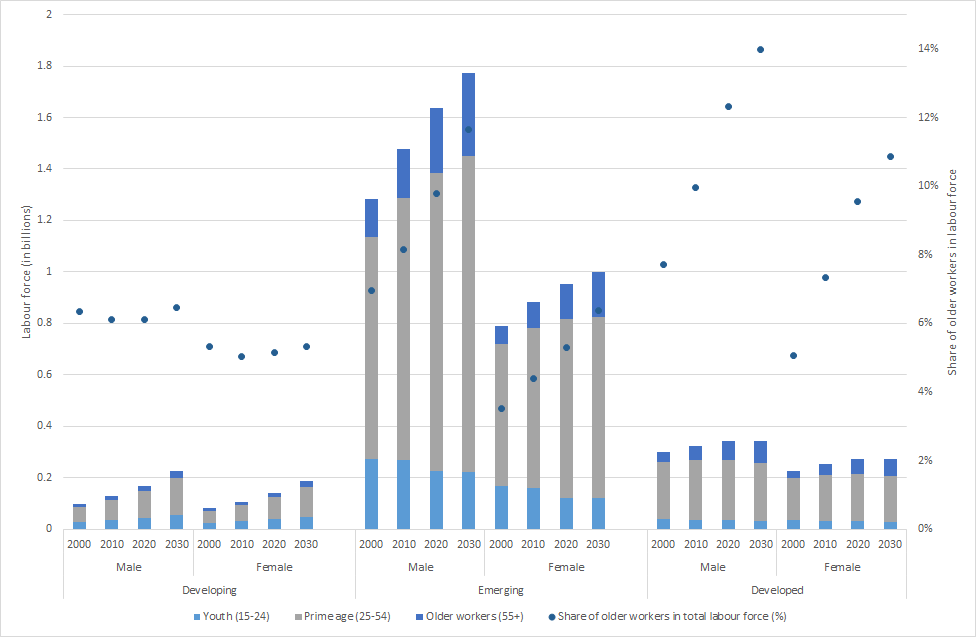
As a population ages, so does the workforce. Globally, the share of older workers aged 55 to 64 years in the total labour force has been increasing since 2000 and will continue to rise significantly until 2030. This trend will be particularly marked in emerging and developed countries, where it will reach 13.2 per cent and 17.7 per cent of the workforce respectively, compared to 7.9 per cent in developing countries
We use the ILO 2019 Labour Force Estimates and Projections (LFEP) database to analyse ageing trends globally and by broad income groups2 and to assess their impact on labour force participation rates for women and men.
The world is getting older: more than three quarters of countries will either be ageing or already aged by 2050
The following figures show the projected proportion of the population aged 65 years and over in the total population at country level for the years 2020 (figure 1 (a)), 2030 (figure 1 (b)) and 2050 (figure 1 (c)). Drawing from Oizumi et al.
Figure
(a) Global ageing status in 2020 (share of population aged 65 and over in total population)
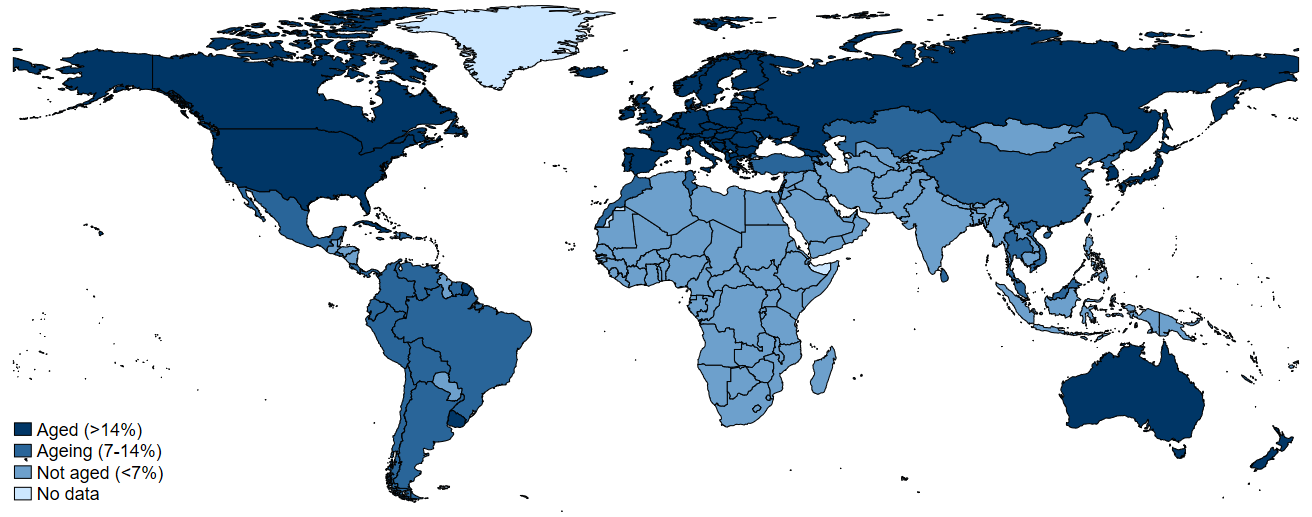
(b) Global ageing status in 2030 (share of population aged 65 and over in total population)
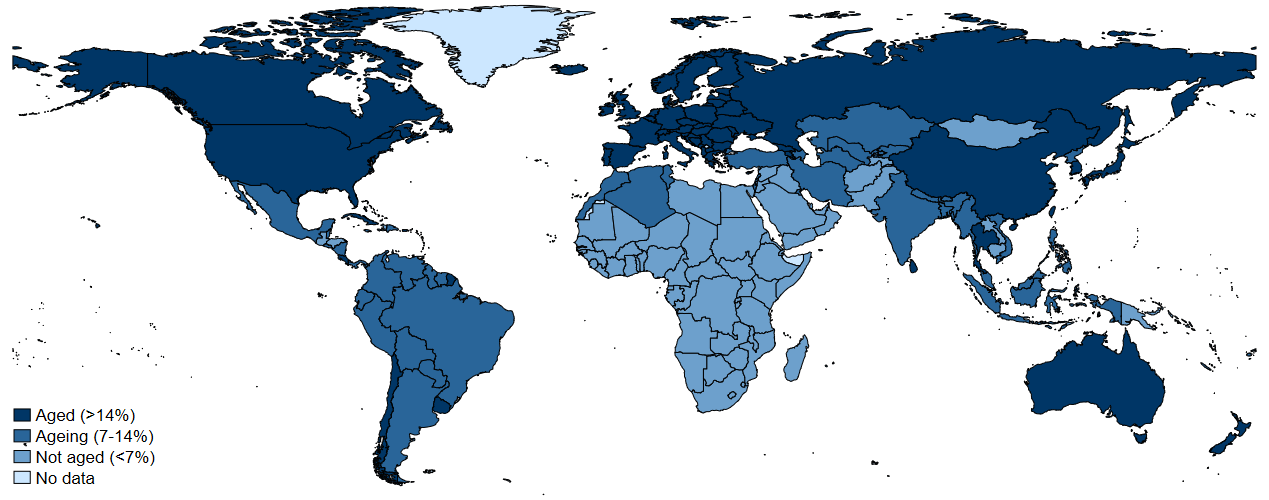
(c) Global ageing status in 2050 (share of population aged 65 and over in total population)
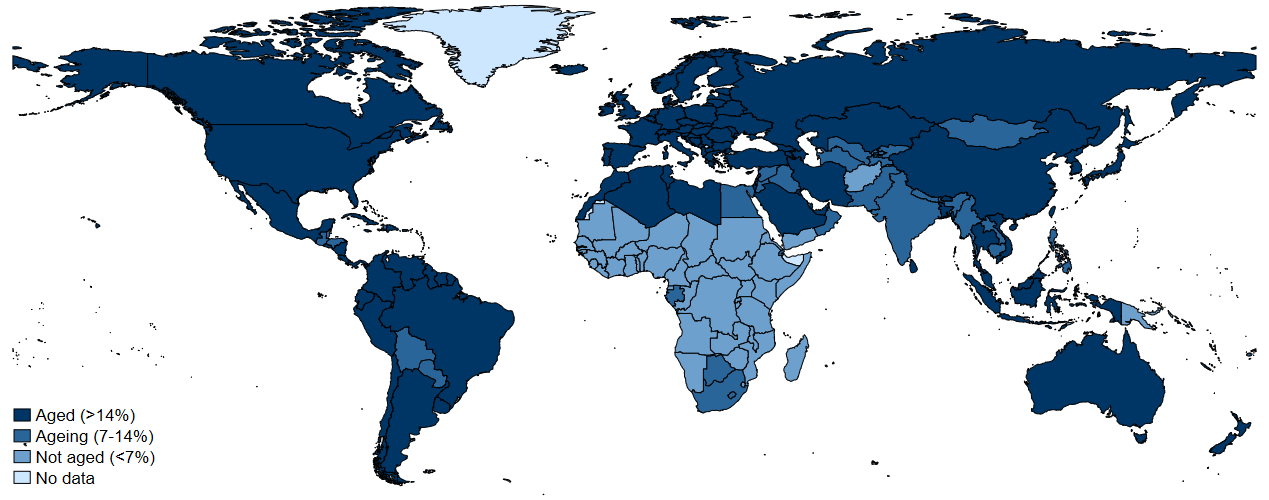
Source: calculations based on UNDESA World Population Prospects 2019.
In 2020, 54 countries are classified as aged societies, most of them developed countries (72 per cent), while another 42 predominantly emerging countries (79 per cent) are deemed to be ageing. By 2030, 51 countries will be ageing and 67 will be aged; in 2050, the ageing phenomenon will have progressed further, with 36 ageing and 111 aged societies. As a result, the number of countries immediately concerned by population ageing will increase significantly from 96 in 2020 to 147 in 2050 – that is, more than three quarters of all countries and around 87 per cent of the global population. The 16 most aged countries will have very high shares of older persons, who will account for more than 30 per cent of the total population. Sub-Saharan Africa will be home to the world’s most youthful populations, since more than 85 per cent of the region’s countries will not have begun this demographic transition, while Europe and Central Asia will have the oldest populations, as almost 92 per cent of countries in the region will have aged (see Annex, table A1 for a detailed overview by region).
The latest UNDESA
Figure
Source: calculations based on UNDESA World Population Prospects 2019.
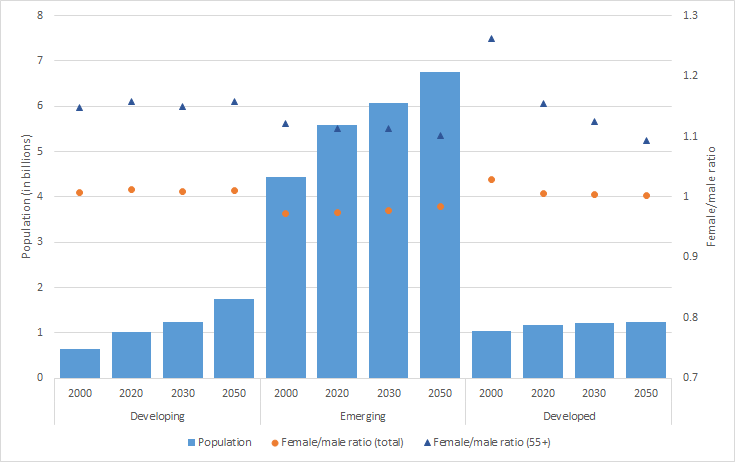
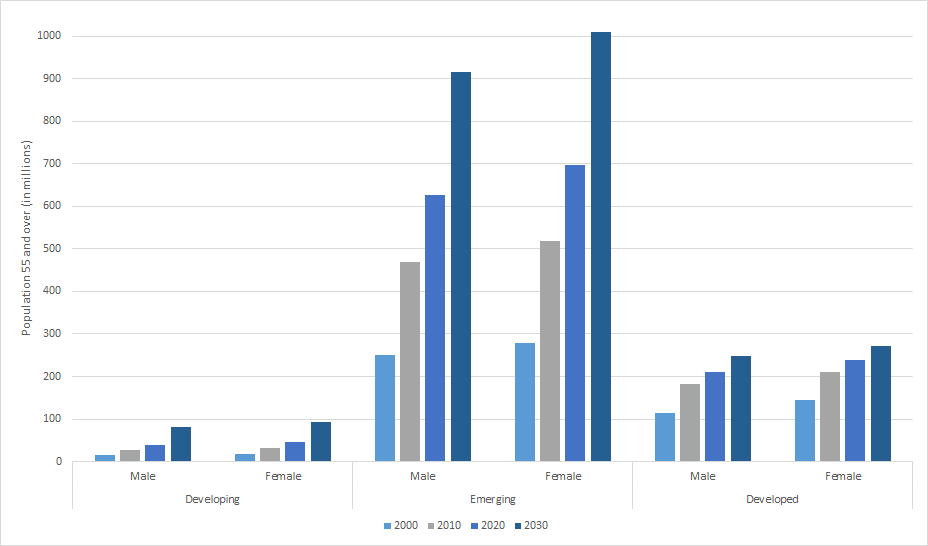
The vast majority of persons aged 55 years and over will be located in emerging countries, where almost 1.9 billion persons will be over 55 years of age in 2050 (see figure 3). However, the strongest increase in the over-55 population is expected to be seen in developing countries, where it will almost triple between 2020 and 2050 from a small base in absolute numbers. Over the same period, the over-55 age group will double in emerging countries and grow by a factor of 1.3 in developed countries. Compared to the total population, the share of the older cohort will be highest in developed economies (40 per cent), followed by emerging (28 per cent) and developing countries (14 per cent).
Figure
Source: calculations based on UNDESA World Population Prospects 2019.
The proportion of older workers in the labour force is increasing worldwide
As a direct consequence of the population ageing process, there will be a growing number of older workers in the future labour force. It is common practice to define older workers as the share of the labour force aged 55 years and above
Figure
Source: calculations based on ILO LFEP database, July 2019 update.
Indeed, the labour force aged 55 years and over will grow consistently, with the highest growth rate occurring between 2020 and 2030 in developing countries (40 per cent), followed by emerging (28 per cent) and developed countries (14 per cent).
Emerging countries account for the highest absolute number of older workers: by 2030, some half a billion workers will be over the age of 55 years, accounting for around 18 per cent of the total labour force.
Around one quarter of all workers in developed countries will be over 55 years of age in 2030, making this the group with the largest share of older workers in the total labour force globally.
The picture is slightly different for developing countries, where both the absolute numbers and the shares of older workers remain modest but are projected to rise steadily over the coming years to reach 48.5 million, or 12 per cent of the labour force, by 2030.
Although there are no major gender differences in the expected increase in the proportion of older workers in the total labour force, there is a considerable levelling effect between women and men. Despite women making up the majority of the total over-55 age group (see figure 2), women’s participation in the labour force will continue to be lower than men’s. This trend holds true for developed and emerging countries alike.
Trend reversal in older workers’ labour force participation rates across development level
Breaking down the labour force participation rates (LFPRs) of older persons by age group reveals some interesting patterns. An early study of the LFPRs of older workers in 151 countries concluded that “countries with high national income per capita tend to have lower participation rates for older men and women”
Figure
Source: calculations based on the ILO LFEP database, July 2019 update.
The decrease in LFPRs in developing countries can be attributed to the advances made in terms of pension system coverage and other social transfer systems
The increase in LFPRs in developed countries can be explained by two main factors. First, several countries have raised the statutory retirement age in recent decades, a trend that is likely to continue
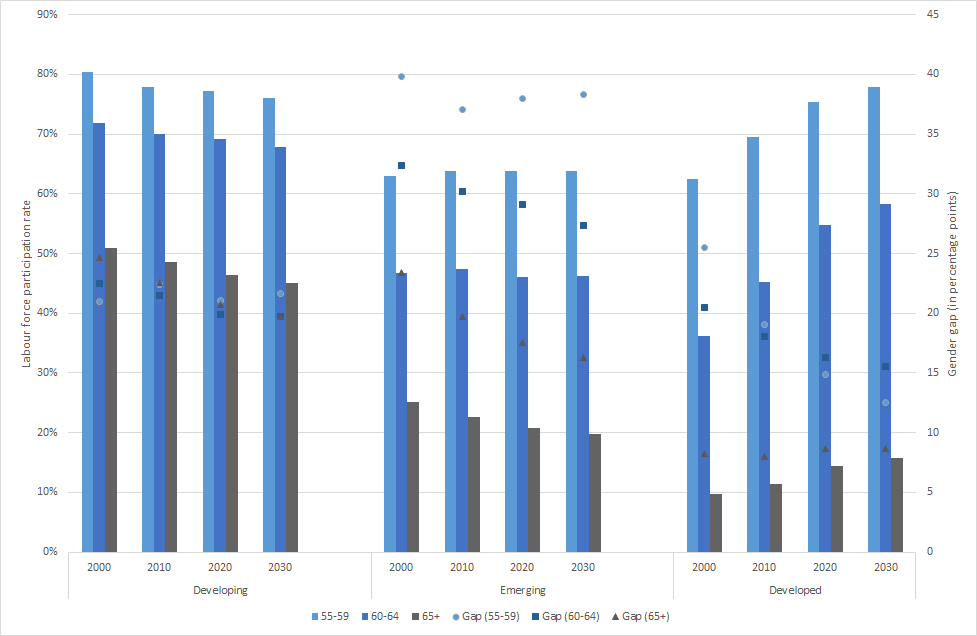
Gender gaps in labour force participation rates are high across all levels of development, reflecting the persistence of occupational and sectoral gender segregation and the uneven distribution of unpaid household and care work, even at older ages
In developing countries, the gender gap in labour force participation lingers at around 20 percentage points across all age categories. Emerging economies reveal the highest gaps in LFPRs for workers aged 55 to 59 years (around 38 percentage points) and 60 to 64 years (around 30 percentage points). The gap is expected to decrease for workers aged 60 years and over but will remain high for those aged 55 to 59 years.
In developed countries, equal access to education, anti-discrimination laws and activation policies, such as the provision of childcare and maternity benefits, have enabled and encouraged women to participate in the labour market. The consequent narrowing of the gap in LFPRs is most significant for the 55 to 59 years age group, where it is expected to drop by 12 percentage points by 2030, compared to a projected decrease of five percentage points for the 60 to 64 years cohort. However, the gap is expected to increase slightly for workers aged 65 years and over.
Alternative economic dependency measures based on employment and decent work
Age dependency ratios provide information about how the demographic structure of a country impacts the proportion of non-working and working persons. In this definition of dependency, dependents are all persons under the age of 15 years or over the age of 64 years, while the working-age population comprises persons aged 15 to 64 years
The problem is that these standard age dependency ratios disregard the fact that not all persons aged 15 to 64 years actually work. Some may still be in education; others may already have retired; and still others may be unemployed or may have chosen not to work for various reasons, such as those who may have become discouraged after unsuccessfully looking for work over a long period of time. Moreover, some children below the age of 15 years and some older persons over the age of 64 years may be part of the labour force, while many persons of working age may not. To address these limitations, alternative measurements have been developed, such as the economic dependency ratio
While these alternative measurements of dependency provide a more accurate picture of the relationship between the economically active and inactive populations in quantitative terms, they still ignore important factors related to job quality – productivity and income levels, for instance – that determine whether a person can actually support dependants. In other words, economic dependency not only depends on the effective employment of the working-age population, but also on the quality of this employment and its contributive capacity. Informal employment that does not contribute to social security, and working poverty or subsistence self-employment that provide very low incomes and do not generate tax revenues, should not be considered as work that reduces the dependency burden.
In this paper, we present five new measures of employment-related dependency that not only take into account the demographic structure of the population, but also consider differences in the age and gender-specific characteristics of the labour market. Our measures include quantitative (activity status and unemployment) and qualitative (labour income, working hours and vulnerability) labour market dimensions. In combination with the standard age-based dependency ratio, these alternative dependency ratios allow us to analyse the causes of dependency in greater detail. A critical evaluation of each measure demonstrates that there is no single indicator which can fully capture all dimensions of economic dependency. Each proposed indicator has advantages over the others but also some limitations. They are therefore meant to provide researchers and policy makers with a set of measures, which allow for deeper analyses that provide insights into the most relevant policy areas for offsetting the effect of ageing on economic dependency in different contexts.
We use the ILO Labour Force Estimates and Projections (LFEP) database (July 2019 version), which provides a consistent series of labour market indicators for all United Nations’ Member States, with forecasts to 2030.3 These indicators can be disaggregated by age and sex to provide additional information on the characteristics of dependents and non-dependents. It also allows us to present results based on the broad income groups of developing, emerging and developed economies.
In line with the work of Loichinger et al.
The demographic dependency ratio
The demographic dependency ratio is the most commonly used measure of dependency. The young-age dependency ratio reveals the number of persons below the age of 15 years compared to those aged 15 to 64 years, while the old-age dependency ratio shows the proportion of persons aged over 64 years relative to those aged 15 to 64 years. The sum of both ratios is the total demographic dependency ratio (DDR).
|
|
(i) |
where:
-
working-age population is the number of persons aged 15 to 64 years; -
non-working-age population is the number of persons aged 0 to 14 years and those aged 65 years and over.
This ratio assumes that children and the elderly are economically dependent upon persons aged 15 to 64 years. As the ratio increases, there may be an increased burden on the population in the labour force in order to maintain the upbringing and pensions of economically dependent persons.
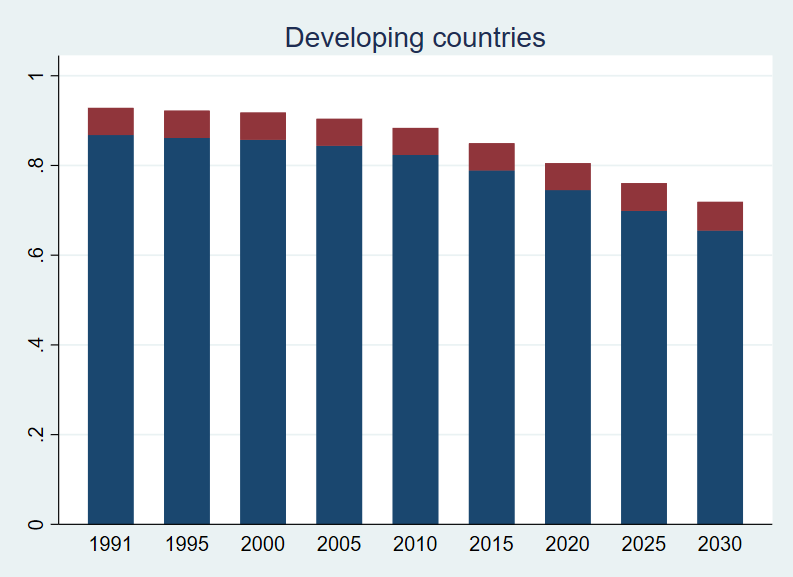
In developing countries, the total demographic dependency ratio decreased from 0.93 in 1991 to 0.81 in 2020 and is expected to further decrease to 0.72 by 2030 (see
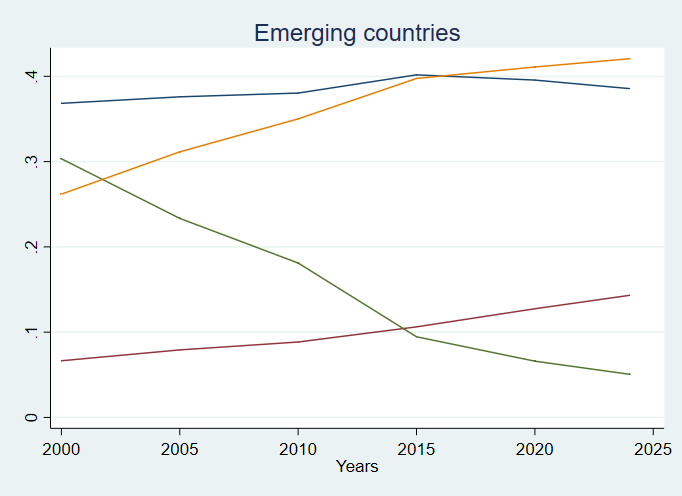
In emerging countries, the total demographic dependency ratio decreased by one quarter from 0.66 in 1991 to 0.50 in 2015 owing to a decline in the share of children in the total population. Since 2015, the ratio has remained stable and is expected to stay that way to 2030 due to a growing older population, which will offset the decrease in child dependency.
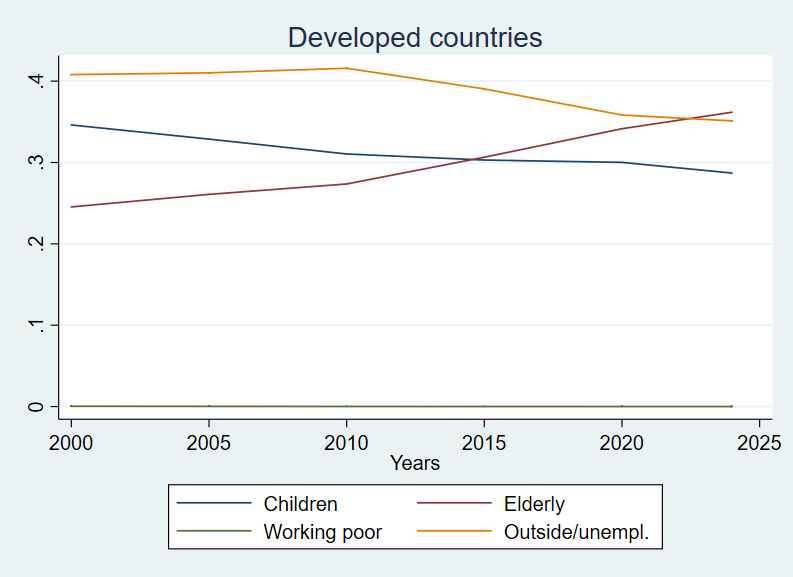
Developed countries experienced a slight decrease in the total dependency ratio – from 0.50 in 1990 to 0.49 in 2010 – largely driven by a shrinking younger population. Since 2010, the total ratio has started to rise again and is poised to grow by one quarter to the year 2030. This increase can be almost entirely explained by a rapidly ageing society, with the further shrinking of the child dependency ratio playing a minor role.
Figure
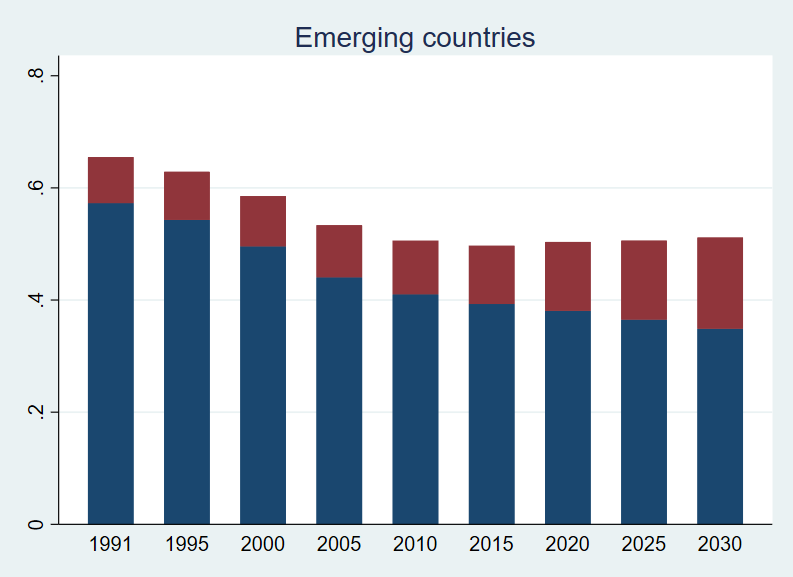
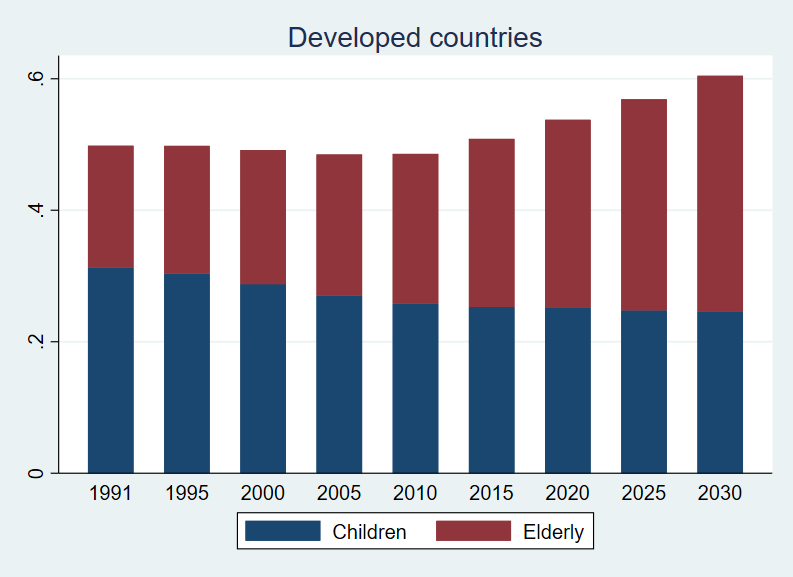
Source: calculations based on the ILO LFEP database, July 2019 update.
The DDR provides a good starting point for forecasting and discussing dependency burdens, especially in the context of shrinking youth and growing older populations worldwide. Its calculation is straightforward and requires only basic demographic information (i.e. age and sex) to be available for almost all countries. Moreover, the composition of the population changes slowly. This indicator therefore allows for accurate short- and medium-term projections of the data, especially with regard to the population aged 15 years and over.
However, there is no universal definition of the working-age population. The age thresholds usually correspond to societal standards for education and work eligibility and are anchored in national legislation. In order to enable international comparability, the ILO usually defines the working-age population as all persons aged 15 years and older. Furthermore, the demographic dependency ratio ignores the actual economic behaviour of persons aged between 15 and 64 years, such as age of entry to and exit from the labour market, employment status, and level of labour income. Instead, this ratio simply assumes fixed age limits in the labour markets and does not allow for a more sophisticated economic interpretation.
Dependency measures based on employment
Activity-based dependency ratio
The first alternative measure of dependency is based on the economic activity status of the working-age population. Not everyone of working age is part of the labour force (i.e. working or available and seeking work) for a variety of reasons: young people may still be in school; adults may have taken early retirement or have chosen to stay at home due to care responsibilities, such as childcare or elderly care; while others may not work for reasons of disability or long-term illness, or because they simply do not wish to work.4
This alternative dependency measure, called the activity-based dependency ratio (ABDR), restricts the “universe” of persons that support dependents to those that are in the labour force, namely all employed and unemployed persons, thus excluding those persons of working age who are not covered by these two statuses. As a result, the dependent population for the ABDR consists of: (a) children below the age of 15 years, (b) persons aged 15 to 64 years who are outside the labour force, and (c) older persons aged 65 years and over.
|
|
(ii) |
where:
-
non-working-age is the number of persons aged under 15 years or over 64 years; -
outside the labour force is the population aged 15 to 64 years that is not engaged in the labour force, i.e. neither employed (in paid employment or in self-employment) nor unemployed; -
labour force is the population aged 15 to 64 years that is engaged in the labour force, i.e. either employed or unemployed.
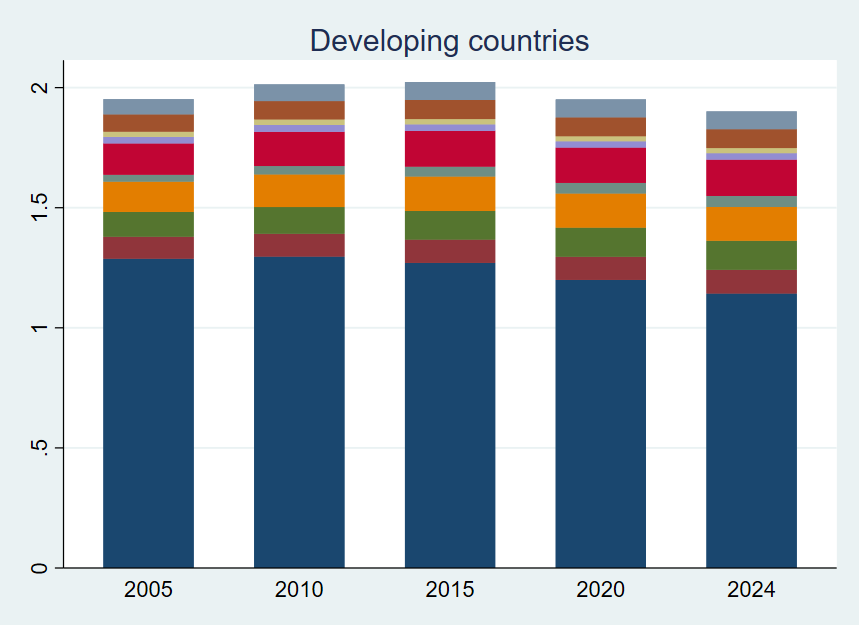
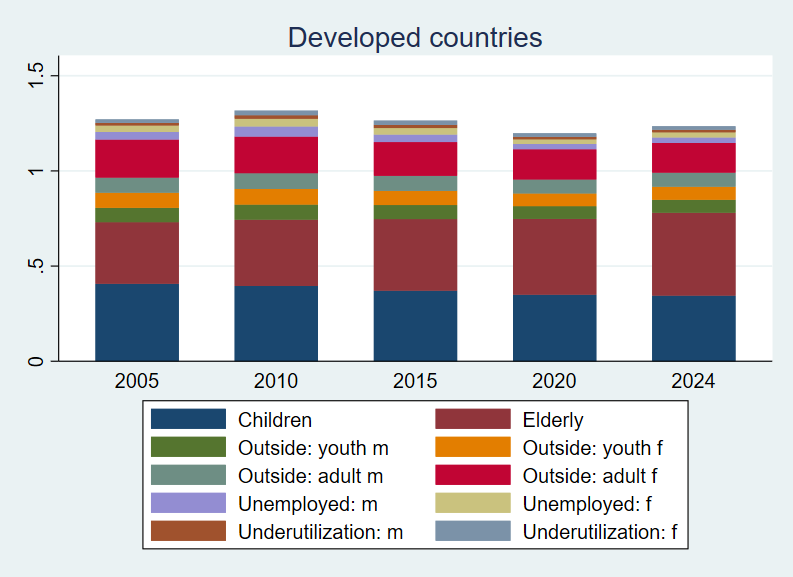
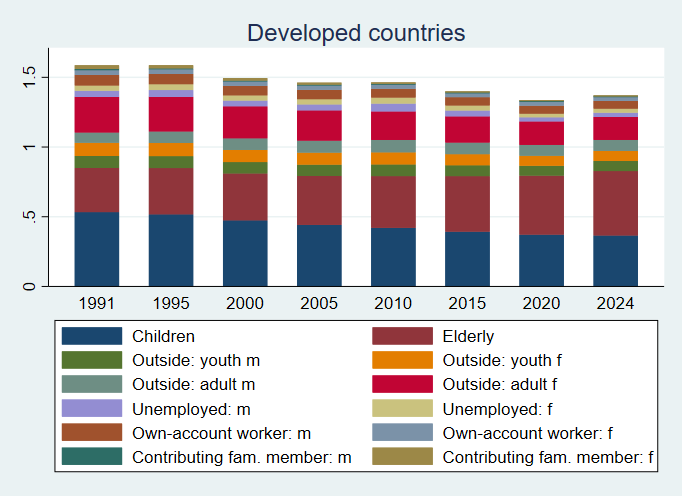
We divide the ratio into six sub-ratios based on the characteristics of the inactive population: a child dependency ratio (under 15 years of age); a sex-disaggregated dependency ratio for the youth population (aged 15 to 24 years) outside the labour force; a dependency ratio for the adult population (aged 25 to 64 years) outside the labour force, for both women and men; and an elderly dependency ratio (aged 65 years and over). This breakdown allows us to gain a more detailed picture of those working-age persons who are outside the labour market and are therefore likely to be dependent upon the support provided by those who are in the labour force.
As shown in
The ABDR is highest in developing countries (see figure 7). It remained stable between 1991 (1.56) and the early 2000s (1.55), at which point it started to fall, with the exception of a slight peak in 2010, probably in the aftermath of the 2007–08 global financial crisis. The ABDR for developing countries is expected to reach 1.41 in 2030. The main determinant of the ABDR in these countries remains the very high child dependency rate, which has been decreasing since 1991. The elderly dependency ratio is small: many of the countries in this group have not yet entered the ageing phase and will only do so in around 2030 (see Chapter 1). The other sub-ratios – youth and adults outside the labour force, disaggregated by sex – are also relatively small, illustrating the fact that, in the absence of any form of social protection, all those who are capable of working can and do undertake some form of economic activity. When it comes to gender, it is interesting to note that the share of adult women outside the labour force is on average three times higher than that of men. This could reflect the uneven distribution of household and care responsibilities between women and men, including at younger ages.
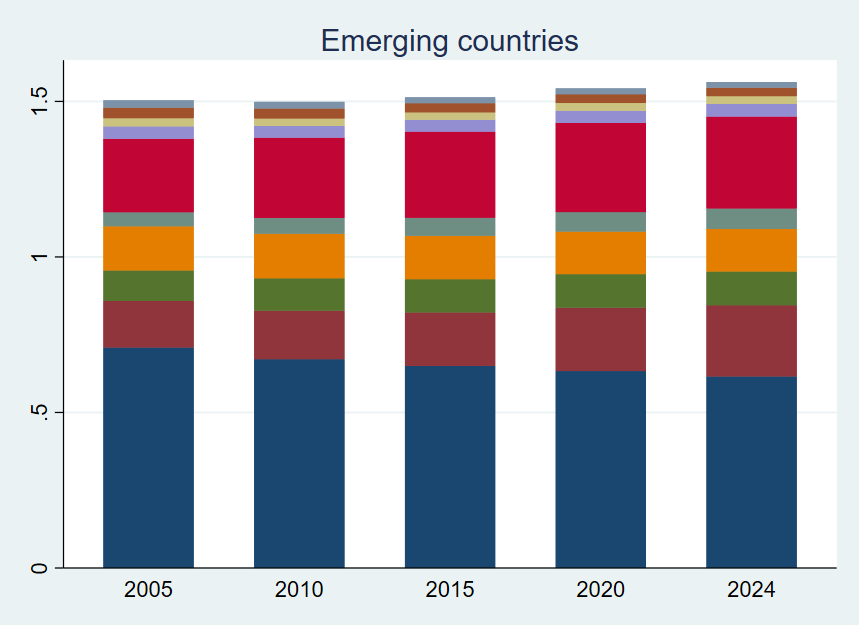
The ABDR in emerging countries fell from 1.36 in 1991 to 1.27 in 2005, mainly because of the sharp decrease in the child dependency ratio. However, it has been increasing ever since and is projected to reach 1.40 in 2030, just above the 1991 rate. While the increasing elderly dependency ratio is certainly the strongest driver of this change, the share of persons outside the labour market is also on a clear upward trend. This trend is most pronounced for adult women who are more likely than adult men to be outside the labour force.
Although the ABDRs in emerging and developing countries are expected to converge by 2030, the ABDR in emerging countries tends to be slightly lower than in developing countries because of a considerably lower child dependency ratio. At the same time, this effect is partly offset by higher income levels and better social protection systems, which enable people to remain outside the labour market if they so wish.
In developed economies, the ABDR decreased from 1.14 in 1991 to 1.08 in 2010 and started rising again as of 2015 to reach 1.18 in 2030 – slightly higher than the level in 1991. While child dependency is declining, the elderly dependency rate has increased sharply since the 1990s, overtaking the child dependency ratio around the year 2015. The proportion of women outside the labour force has been decreasing significantly since 1991, a trend that is expected to continue, albeit at a slower pace. While this increase in the women’s activity rate partly explains the fall in the ABDR, it is not sufficient to counterbalance the sharp rise in the elderly dependency ratio.
Figure
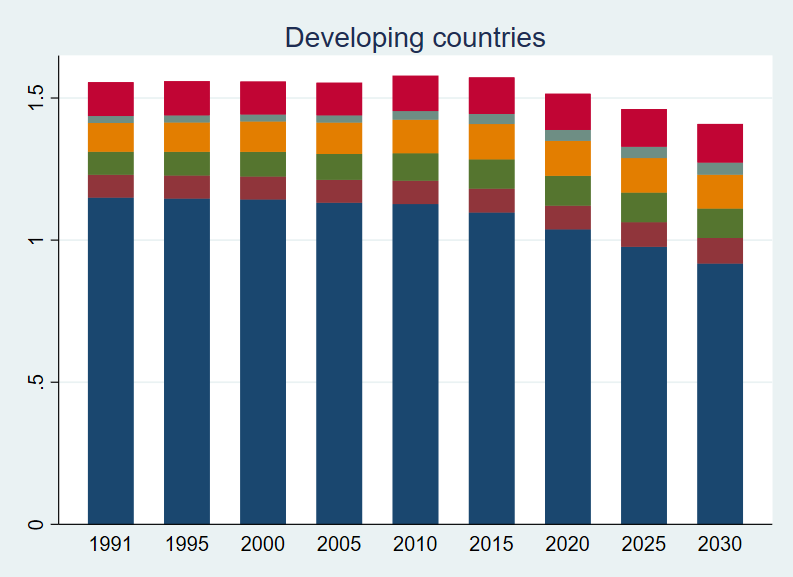
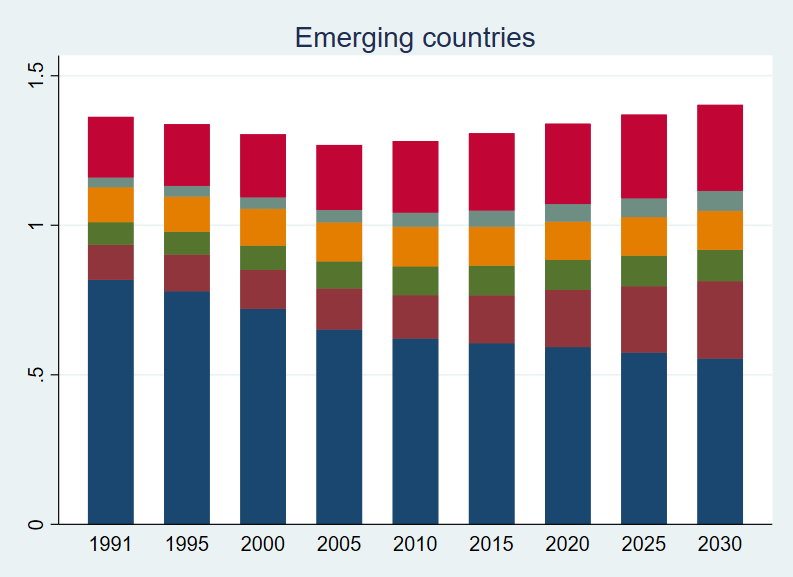
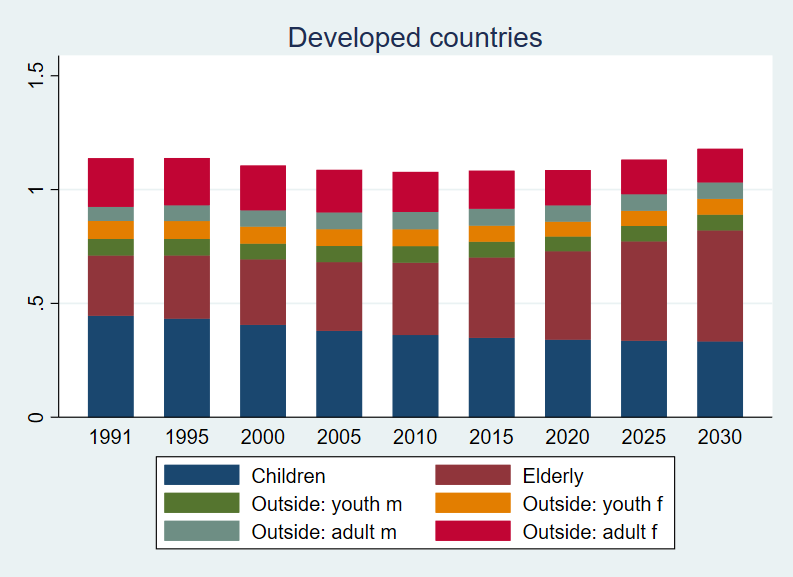
Source: calculations based on the ILO LFEP database, July 2019 update.
The ABDR provides a finer measure of economic dependency than the demographic dependency ratio. By factoring in the effective labour market participation of working-age persons, disaggregated by sex and age group, it provides analysts and policymakers with more detailed information about how labour market participation levels influence dependency rates.
Since it is based on basic demographic and labour market information, data is available for a large number of countries and enables cross-country comparisons to be made. However, the simplicity of the data requirements, and in particular the binary nature of either being inside or outside the labour force, comes at a price: the ABDR does not provide any indication of the quality of employment for those persons who are in the labour force or any rationale as to why other persons are outside the labour force. Furthermore, it counts unemployed persons as non-dependents, which is misleading. Even assuming the existence of effective social security systems, such as unemployment benefits, unemployed persons are receiving transfers from other groups in society. And where such systems do not exist, even when unemployed persons draw on personal savings, they usually still depend on family members for their basic needs.
Employment-based dependency ratio
Our second employment-based alternative measure of dependency includes unemployed persons as dependents, in addition to persons outside the labour force. It thus assumes that those who are unemployed benefit from transfers from those who are employed. Such transfers can either be direct – through intrahousehold reallocations, for example – or indirect, such as through social security or public redistribution schemes. The denominator of the employment-based dependency ratio (EBDR) is limited to the employed population, while the numerator, or the dependent population, consists of: (a) children below the age of 15 years, (b) persons aged 15 to 64 years who are outside the labour force, (c) all unemployed persons aged 15 years and over, and (d) older persons aged 65 years and over.
|
|
(iii) |
where:
-
non-working-age is the number of persons aged under 15 years or over 64 years; -
outside the labour force is the population aged 15 to 64 years that is not engaged in the labour force; -
unemployed is all persons aged 15 years and over5 who are seeking and are available to start working for pay or profit in specified reference periods; -
total employed is all persons aged 15 to 64 years who are in work, either in paid employment or in self-employment.
We divide this ratio into eight sub-ratios based on the characteristics of the inactive population and the unemployed: a child dependency ratio; a sex-disaggregated dependency ratio for the youth population (aged 15 to 24 years) outside the labour force; a dependency ratio for the adult population (aged 25 to 64 years) outside the labour force, for both women and men; an unemployed ratio, also for women and men; and an elderly dependency ratio. This enables us to see the proportion of employed persons that is providing support to the other cohorts.
As
In developing countries, the EBDR remained stable at around 1.6 until 2015, when it started to decrease and is expected to fall to 1.52 in 2024 (see
In emerging countries, the EBDR decreased from 1.43 in 1991 to 1.37 in 2010. It has been increasing ever since and is expected to reach 1.45 in 2024. The demographic component is behind this trend: there has been a strong decline in the child dependency ratio throughout the entire period and a marked increase in the elderly dependency ratio since 2005. Hence, ageing is and will continue to be an important determinant of dependency in these countries. Unemployment also plays a more pronounced role in this group of countries.
In developed countries, the EBDR has been fluctuating at around 1.22, reaching a low of 1.13 in around 2020. The latest projections suggest a slight tendency upward between now and 2024. The demographic component accounts for some three quarters of the dependency ratio, with the elderly component increasingly gaining in significance. Unemployment constitutes the smallest contributing factor.
Figure
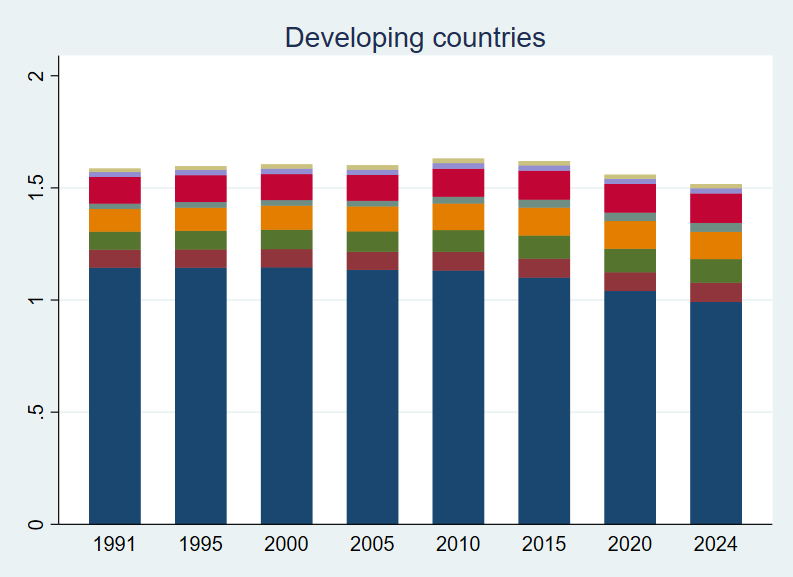
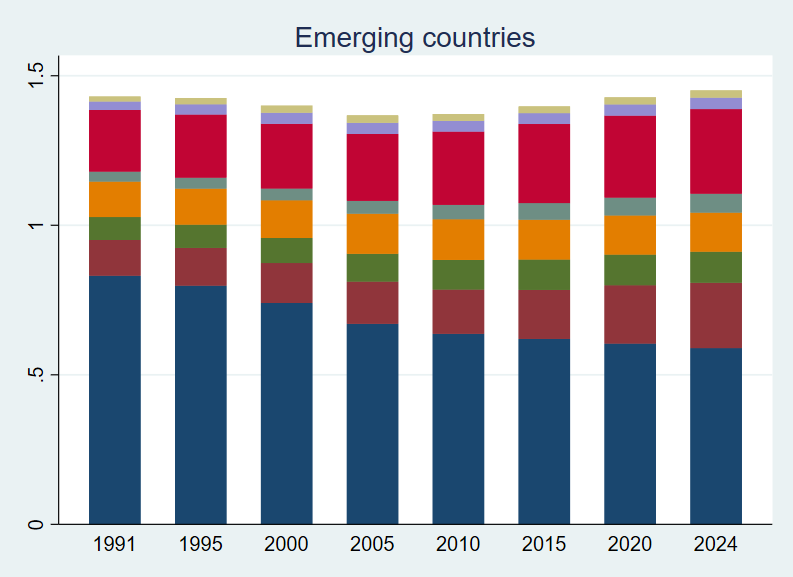
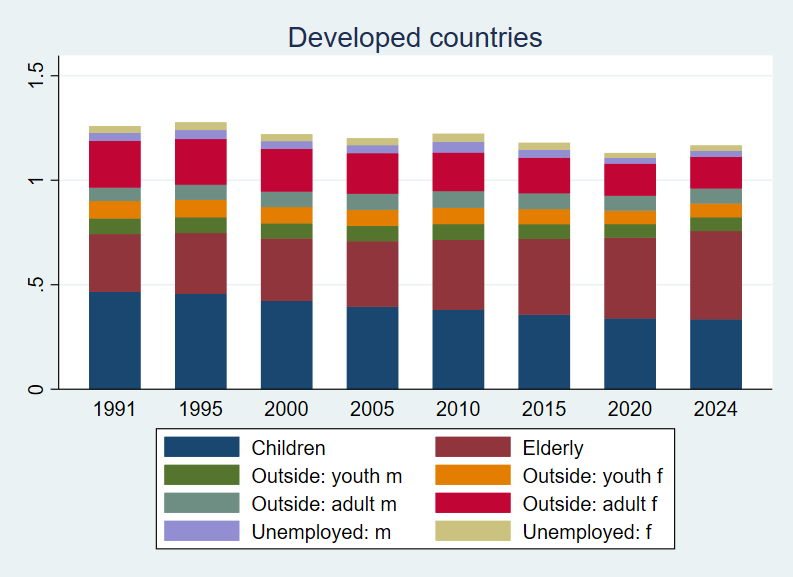
Source: calculations based on the ILO LFEP database, July 2019 update.
The EBDR offers valuable insights into the composition and distribution of potential dependents. From a conceptual point of view, it makes sense to include unemployed persons in the group of dependents. In addition to the problems discussed in relation to the ABDR in the previous section, however, the EBDR suffers from a major shortcoming in the data: both the employment and unemployment rates are influenced by a large variety of factors that make it difficult to predict trends accurately, especially for the more distant future.6 While the explanatory power of the EBDR decreases for distant future predictions, it may still be an adequate indicator for policymakers to assess labour market needs in the nearer future. Nevertheless, the EBDR does not give any indication of the job quality of those in employment and assumes them to be non-dependents.
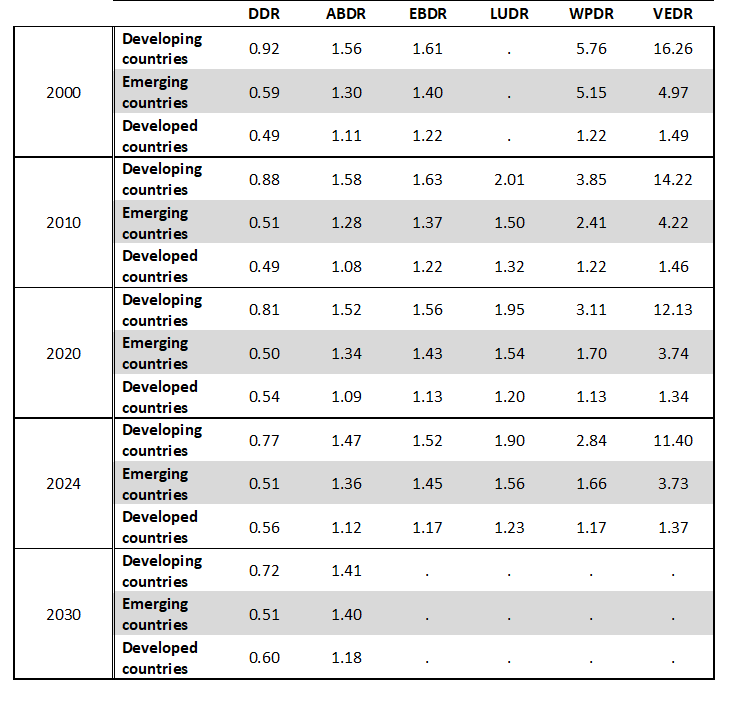
Table 1: Comparison of demographic-, activity-, and employment-based dependency ratios, by income groups, 2000-2030
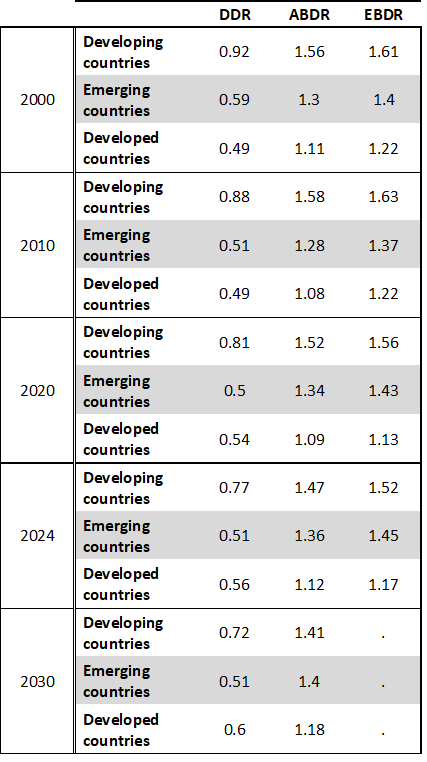
Notes: DDR: demographic dependency ratio; ABDR: Activity-based dependency ratio; EBDR: Employment-based dependency ratio.
Projections of employment and unemployment figures based on econometric models are only available to the year 2024. As a result, estimates for the EBDR are not included for all years.
Interpretation: A ratio of 1.5 of the EBDR, for instance, can be interpreted as meaning that 15 persons not in employment (i.e. children below the age of 15 years, persons aged 15 to 64 years outside the labour force, unemployed persons aged 15 years and over, and older people aged 65 years and over) are thought to be economically dependent upon 10 persons in employment.
Source: calculations based on the ILO LFEP database, July 2019 update.
Dependency measures based on productive employment
In the following section, we are introducing three indicators based on the notions of
Labour underutilization as a proxy for non-productive employment
Even when workers are in employment, they may find themselves in a situation where they wish to work more paid hours; that is, they are time-related underemployed. The income generated by such involuntary part-time employment may not be sufficient to cover basic needs and may be a cause of in-work poverty
This alternative dependency measure can therefore be defined as the labour underutilization dependency ratio (LUDR), where the denominator is those persons who are fully employed – all employed persons who are not in time-related underemployment – and the numerator comprises the following dependents: (a) children below the age of 15 years, (b) persons aged 15 to 64 years who are outside the labour force, (c) all unemployed persons aged 15 years and over, (d) older persons aged 65 years and over, and (e) time-related underemployed persons aged 15 years and over.
|
|
(iv) |
where:
-
non-working-age is the number of persons aged under 15 years or over 64 years; -
outside the labour force is the population aged 15 to 64 years that is not engaged in the labour force; -
unemployed is all persons aged 15 years and over who are seeking and are available to start working for pay or profit in specified reference periods; -
underemployed is all persons in employment who want to work additional hours, whose working time in all their jobs is below a specified threshold of hours and who are available to work additional hours if they are given the opportunity to do so; -
full-potential employment is the total number of employed persons minus the underemployed.
The breakdown of the LUDR follows the same metrics as the EBDR but includes involuntarily underemployed women and men. As expected, this increases the dependency ratio across all income levels (see table 2), most notably in developing countries, where it is on average 25 per cent higher than the EBDR. This reflects the reality of many workers in developing countries who cannot afford to be without employment and hence accept any kind of work, often with piece-rate or daily contracts.
The LUDR in developing countries is projected to decrease from 2.0 in 2015 to 1.9 in 2024 (see figure 9). The contribution of the time-related underemployed to the overall dependency ratio remains stable at levels that are much higher than for unemployment. Thus, underemployment is a more relevant indicator of dependency than unemployment in developing countries.
The LUDR in emerging countries is increasing and is expected to reach 1.56 in 2024. This increase is largely being driven by population ageing, while the underemployment share is shrinking. Men seem to be more affected by time-related underemployment than women.
The LUDR is lowest in developed countries, where it is trending upward and is projected to reach 1.23 in 2024. Women are on average a third more likely to be in involuntary part-time employment than men.
Figure
Source: calculations based on the ILO LFEP database, July 2019 update.
While unemployment and inactivity indicate a lack of available jobs, time-related underemployment suggests a lack of available paid hours. The LUDR therefore sheds more light on the supply side of the labour market and demonstrates the untapped opportunities of the potential labour force, especially regarding women and youth not in employment, education or training (NEET). In terms of data, this measure shares the same limitations as the EBDR but is further constrained when it comes to historical data points.
The assumption that involuntary part-time workers are essentially dependents may not hold true in all cases. Nevertheless, time-related underemployment is a common feature of in-work poverty. The LUDR unites three key dimensions of labour force underutilization, and the breakdown and disaggregation by age and sex provides valuable information to enable policymakers to formulate targeted responses. Yet, labour underutilization is an imperfect proxy for unproductive employment. It doesn’t capture the fact that workers can be employed full-time, but earn too little to keep themselves and their families above the poverty line. The working poverty rate as well as the rate of vulnerable employment therefore provide additional insights that may be useful to inform policy-making.
Working poverty as a proxy for non-productive employment
Not all of those who work are productively employed. Some workers in paid employment or self-employment may not earn enough to lift themselves and their families above the poverty line. In this case, they can be considered as being economically dependent, meaning that they rely on social or family transfers to live a decent life and cannot support others through their earned income. We define this type of dependency as the working poverty-based dependency ratio (WPDR), with the dependent population consisting of: (a) children below the age of 15 years, (b) persons aged 15 to 64 years who are outside the labour force, (c) all unemployed persons aged 15 years and over, (d) older persons aged 65 years and over, and (e) the working poor aged 15 years and over.
|
|
(v) |
where:
-
non-working-age is the number of persons aged under 15 years or over 64 years; -
outside the labour force is the population aged 15 to 64 years that is not engaged in the labour force; -
unemployed is all persons aged 15 years and over who are seeking and are available to start working for pay or profit in specified reference periods; -
working poor is the number of employed persons aged 15 years and over living in households with incomes below the international poverty line of US$1.90 per day in purchasing power parity (PPP); -
productively employed is the total number of employed persons minus the working poor.
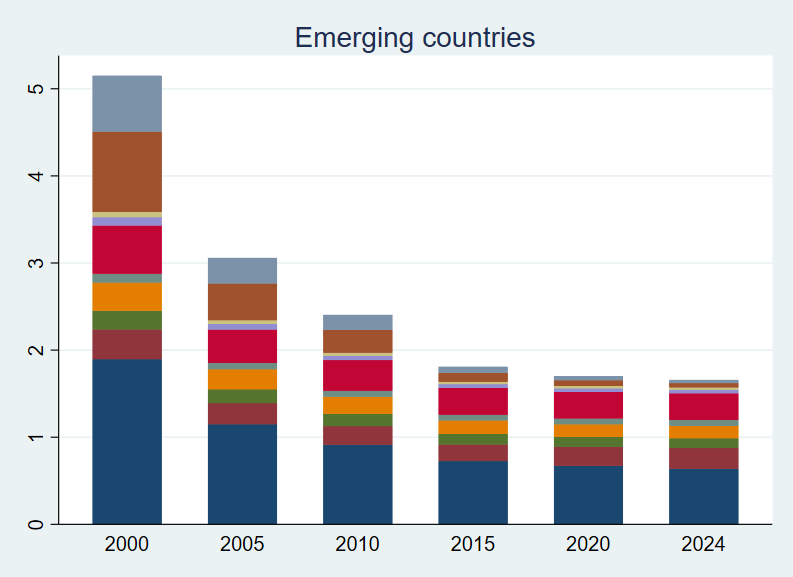
When adding the working poor to the dependency measure, the dependency ratio increases substantially in developing and emerging economies compared to previous measures (see table 2 and
In emerging countries, the convergence of the EBDR and the WPDR is much more pronounced, although the WPDR is still some 15 per cent higher. This means that the number of working poor has decreased in this group of countries7 – mostly in China and India – and, consequently, so has its weight on the dependency measure. In emerging countries, the contribution of the child dependency ratio and the share of young and adult women outside the labour market are currently much higher than those of poverty and unemployment.
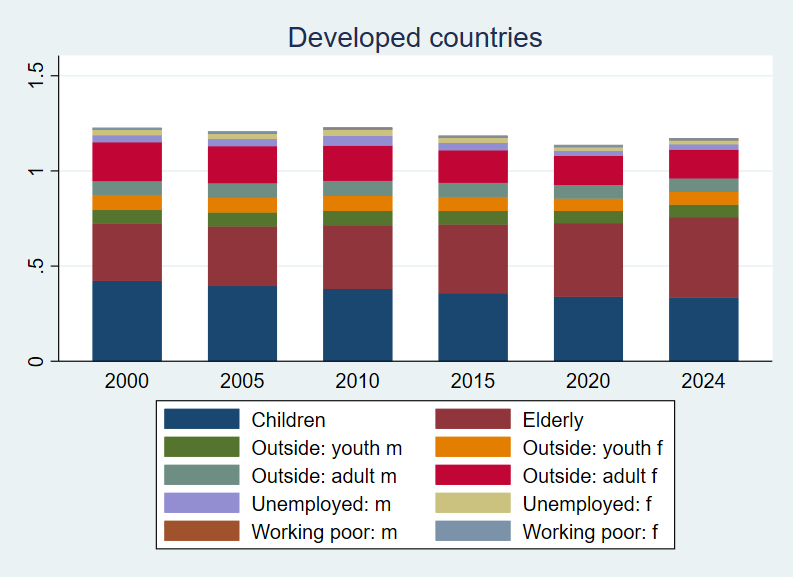
Since the working poverty rate, which is based on the international poverty line of US$1.90 per day in purchasing power parity (PPP), tends to be zero in developed countries, the estimates for WPDR are practically identical to those for the EBDR.
Figure
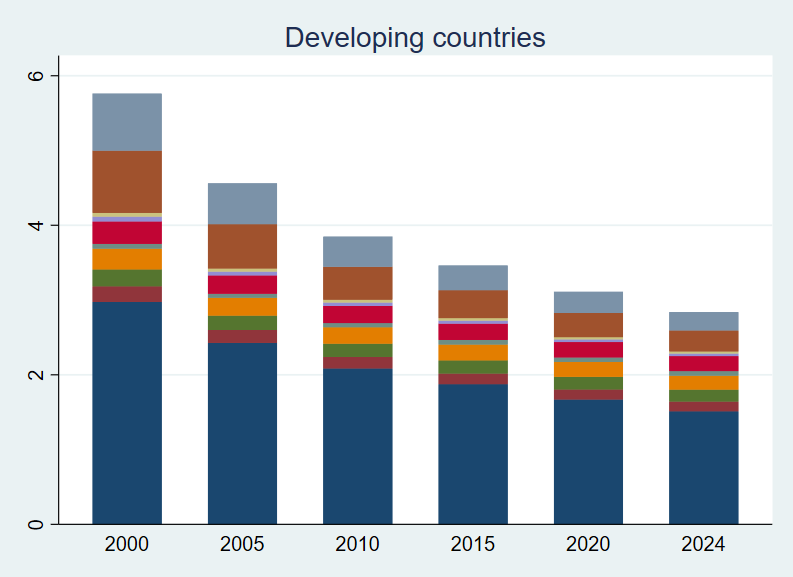
Source: calculations based on the ILO LFEP database, July 2019 update.
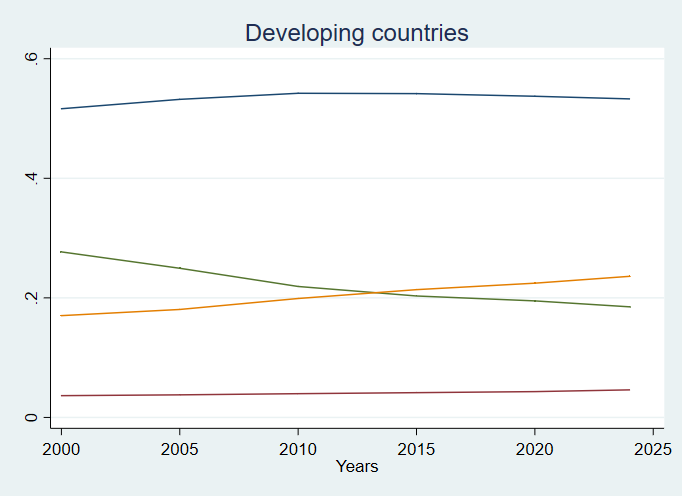
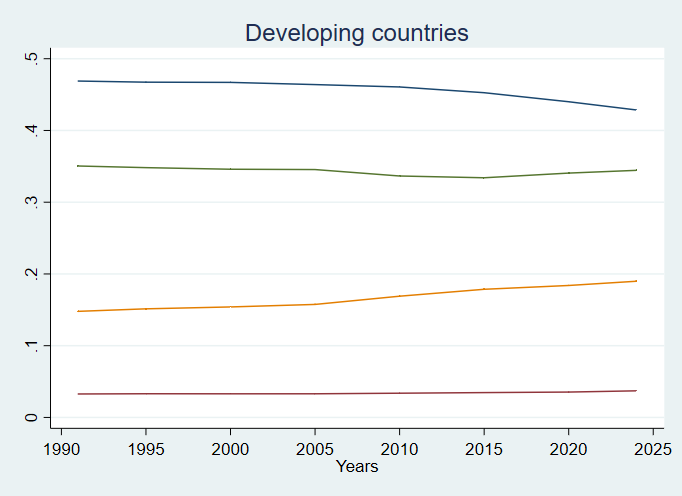
In developing countries, children will continue to contribute more than 50 per cent to the overall dependency rates, while the contribution of older persons remains relatively low at around 4.1 per cent (see
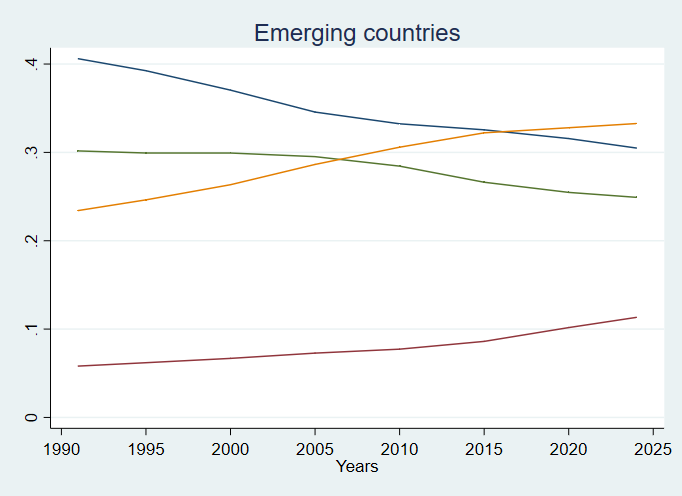
The picture is very different in emerging economies, where the contribution of older persons is strongly increasing, while the share of children is slowly declining. The weight of working poverty in total dependency rates has sharply decreased and, although its pace of reduction has slowed since 2015, it is the least important contributor to the overall dependency ratio since that year. At the same time, the contribution of persons outside the labour market and the unemployed, which had been equal to that of working poverty in the early 2000s, has risen sharply, to the extent that it overtook the child dependency ratio in 2016.
Figure
Source: calculations based on the ILO LFEP database, July 2019 update.
The working poverty-based dependency ratio adds an important element to the discussion on economic dependency by including a group that is very likely in need of support: workers who cannot lift themselves and their dependants above the poverty line.
Although internationally comparable data is only available from the year 2000 onwards and predictions are limited to the near future, an intertemporal and cross-country analysis can be carried out for around 73 per cent of countries. However, the WPDR suffers from additional limitations similar to those discussed for the EBDR, especially with respect to the working poverty rate, which is a product of the poverty and employment rate. The working poverty rate is based on the headcount index, which does not take intrahousehold inequality or depth of poverty into account. Moreover, different approaches (microeconomic versus macroeconomic) are applied for the calculation, reflecting different data availability and risking compromise of cross-country comparisons
The analysis shows that having a job is no guarantee of decent living conditions. Too many workers – especially women and youth – do not earn enough to lift themselves and their family members above the poverty threshold. Targeted policies are needed to further accelerate the progress made over recent decades. This includes ensuring adequate earnings, sufficient working hours, a certain level of job security and access to social protection.
Vulnerable employment as a proxy for non-productive employment
Another way to capture work that may not be sufficiently productive to enable those performing it to support their dependents is to take account of vulnerable employment. According to the ILO definition, vulnerable employment includes contributing family workers and own-account workers. In the context of developing countries, own-account workers are for the most part engaged in petty trading or farming for own-consumption, mostly in the informal economy. This is very different from self-employed workers in high value-added services, such as doctors and freelance IT specialists. In developed countries, own-account workers would ideally capture all self-employed persons who are performing task-based work (including on digital labour platforms), subcontracting to larger firms without an established employment relationship, or engaging in casual work; in other words, workers who are in non-standard and precarious forms of employment
The vulnerable employment dependency ratio (VEDR) integrates vulnerable workers as dependents and comprises: (a) children below the age of 15 years, (b) persons aged 15 to 64 years who are outside the labour force, (c) all unemployed persons aged 15 years and over, (d) older persons aged 65 years and over, and (e) vulnerable workers.
|
|
(vi) |
where:
-
non-working-age is the number of persons aged under 15 years or over 64 years; -
outside the labour force is the population aged 15 to 64 years that is not engaged in the labour force; -
unemployed is all persons aged 15 years or older who are seeking and are available to start working for pay or profit in specified reference periods; -
vulnerable employment is the sum of own-account workers (also known as self-employed workers without employees) and contributing family workers (also known as unpaid family workers); -
non-vulnerable employment is the total number of persons in employment minus those in vulnerable employment.
As shown in table 2, dependency increases significantly across all income groups when vulnerable employment is taken into account. In developing countries, the VEDR rises sharply by a factor of 8.5 compared to the EBDR and is predicted to reach 11.40 in 2024. This means that each non-vulnerable worker needs to provide support for more than 11 dependents. The total ratio has been decreasing constantly since 1991 (when it was 16.94, see
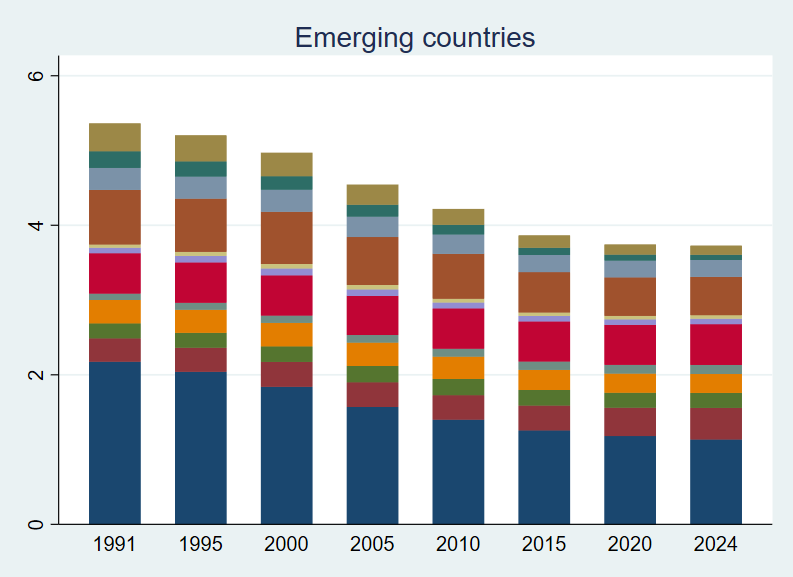
In emerging countries, the overall dependency ratio is considerably smaller than in developing countries. It will decrease from 5.36 in 1991 to 3.73 in 2024, mainly due to a shrinking child dependency ratio, although the share of vulnerable employment also fell by around three quarters. Nevertheless, the VEDR is on average three times higher than the EBDR. As with developing countries, men are disproportionally represented among own-account workers and women among contributing family members. The shares of both activities were shrinking for women and men until 2015 and have been stagnating ever since.
In developed countries, the increase compared to the EBDR is much smaller, since comparatively fewer workers are engaged as own-account workers or contributing family members. The VEDR is on average 1.2 times higher than the EBDR. While the total VEDR has been decreasing over time, it is projected to rise again and reach 1.37 in 2024 as a result of population ageing. The distribution of vulnerable employment follows the same gender pattern as for developing and emerging countries, although the discrepancy between women and men is the highest for contributing family members.
Figure
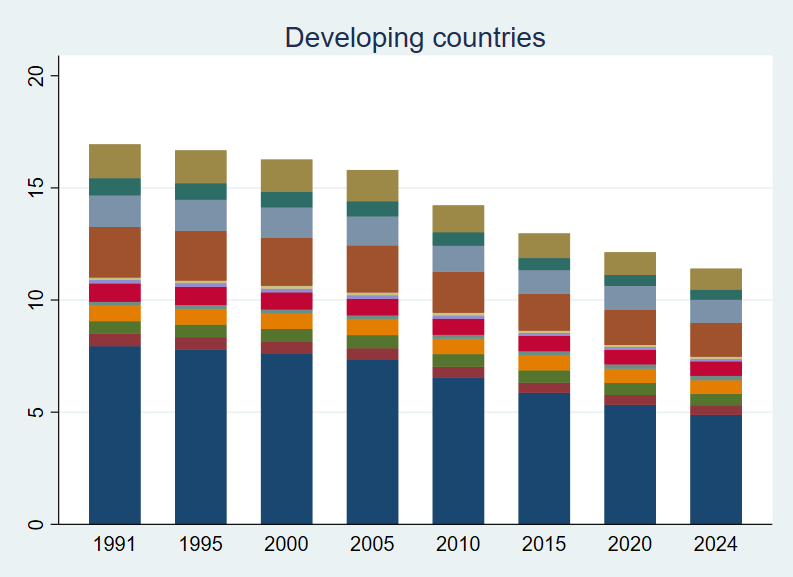
Source: calculations based on the ILO LFEP database, July 2019 update.
In developing countries, the vulnerable workers component of the total dependency ratio (34.4 per cent in 2024) is greater than that of persons outside the labour force and the unemployed (19 per cent in 2024) (see
In emerging countries, persons outside the labour force and the unemployed account for one third, and those in vulnerable employment for one quarter, of the VEDR in 2024. The trend indicates a decreasing share of vulnerable employment and a strongly increasing share of persons outside the labour force and the unemployed between 1991 and 2024. The turning point came in 2010, when the latter cohort became the most important component of the VEDR.
In developed countries, the contribution of older persons increased significantly, surpassing that of children in 2015. The contribution of persons outside the labour force and the unemployed to the overall dependency rate remained at a fairly constant and high level (around 37 per cent) until 2010, when it began falling. Nevertheless, it is still the most important factor of the VEDR, although the elderly dependency ratio is expected to draw level by 2024. The share of vulnerable employment has always been relatively low and has been slowly decreasing from 0.14 in 1991 to 0.09 in 2024.
Figure
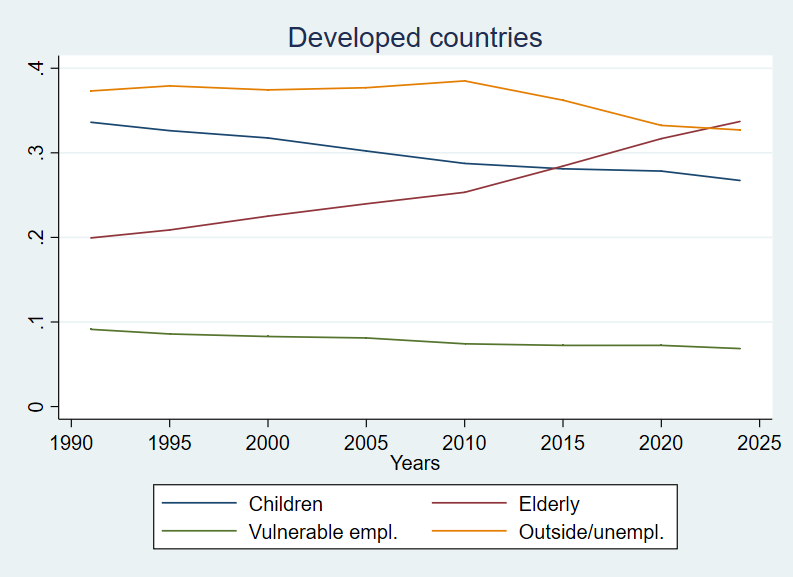
Source: calculations based on the ILO LFEP database, July 2019 update.
The VEDR benefits from excellent data availability both in terms of country coverage and time dimension, although projections are limited to the near future. However, the concept of vulnerability is based on strong assumptions which call into question the specificity and relevance of the indicator. First, own-account workers and contributing family members form a very diverse group, ranging from subsistence farmers to productive and profitable enterprises. At the same time, many wage workers are in precarious employment – characterized by low levels of pay and employment protection, and by limitations on their freedom of association and collective bargaining – but are not captured by this indicator. The assumption that own-account workers and contributing family members are intrinsically more vulnerable than other persons is as questionable as the assumption that wage workers would by definition be less vulnerable. Thus, vulnerable employment could be more accurately defined on the basis of employment conditions rather than employment status
Nevertheless, own-account workers and contributing family members represent a large part of the workforce – especially in developing and emerging economies – with the vast majority of these workers (85 per cent) engaged in the informal economy, which is often characterized by a lack of income security, access to labour rights and social protection
Table 2. Comparison of different dependency ratios, by income group, 2000–30
Notes: DDR: demographic dependency ratio; ABDR: Activity-based dependency ratio; EBDR: Employment-based dependency ratio; LUDR: Labour underutilization dependency ratio; WPDR: Working poverty-based dependency ratio; VEDR: Vulnerable employment dependency ratio.
Projections of employment and unemployment figures based on econometric models are only available to the year 2024. Similarly, projections of time-related underemployment are only available from 2005. As a result, estimates for the EBDR, LUDR, WPDR and VEDR are not included for all years.
Source: calculations based on the ILO LFEP database, July 2019 update.
Conclusion
The proportion of persons aged 55 years and over in the total population is set to increase significantly in all regions of the world over the coming decades. By 2050, more than three quarters of countries will either be ageing or already aged societies. As a direct consequence, the workforce will be ageing too. The number of workers aged 55 to 64 years will increase to represent between 12 per cent and 25 per cent of the total labour force by 2030. What are the implications for the labour market? Will all these persons work, whether by choice or necessity? If they do, what conditions will they face?
This paper shows that, according to the latest forecasts, labour force participation rates (LFPRs) for persons aged 55 years and over differ across income levels. In developing countries, the progress made in terms of pension system coverage and other social transfers is giving older workers greater choice in deciding whether to remain in the labour market. Consequently, LFPRs in developing countries are decreasing significantly. In emerging countries, LFPRs are generally lower than in developing countries and are decreasing for persons aged 65 years or over. The situation is different in developed countries, where social protection systems are well developed, but where an ageing population is driving pension system reforms and active ageing policies that increase the labour force participation rates of older workers.
The gender gap in labour market participation is highest in emerging countries. As a result of targeted policies, it is slowly diminishing with age across all income levels, with the exception of workers aged 65 years or over in developed economies. Despite the progress that has been made, gaps remain that require decisive action in order to ensure equal opportunities in the labour market.
Clearly, ageing is impacting the labour market the world over. In countries that have already aged or are ageing rapidly – mostly developed economies – the contributions of workers to pension schemes are needed in order to cater for a growing group of retirees. In the light of a shrinking workforce at the lower age band, more women and men will have to work until, and most likely beyond, the age of 64 years. In countries that are still to enter their full demographic transition, providing decent employment to the young and adult labour force is a precondition for ensuring access to social protection by older workers and to education by large cohorts of children. These are issues that are commonly referred to in the literature as economic dependencies. Although these are useful indicators, their explanatory powers in terms of the functioning of the labour market are seriously limited. This paper therefore introduces an additional concept related to decent employment. If those who work are not productively employed – that is, engaged in an activity that provides them and their household with an income sufficient to be free from poverty – then they cannot contribute effectively to the education and retirement of others.
This paper therefore proposes a set of employment-based dependency ratios that realistically reflect the capacity of persons who work to support those who do not, based on different proxies for non-productive employment. Three main proxies are used: (i) the labour underutilization rate, (ii) the working poverty rate, and (iii) the vulnerable employment rate. These new employment-based dependency ratios are useful measures for probing into the causes of dependency and informing employment policy choices. They have different strengths and can therefore be used selectively for different country contexts, allowing policy makers to formulate better targeted and country specific policies. It has been possible to calculate them thanks to a very rich data set produced by the ILO that provides a consistent series of labour market data for all countries with forecasts to 2024 and beyond. The analysis shows the importance of age- and gender-specific employment levels and employment quality when discussing the challenges associated with population ageing. Including the employment quality dimension reveals important challenges for the future. As ageing becomes a worldwide reality, improving the quality of employment will become a necessity in order to avoid a steep increase in employment-based dependency ratios.
Further research is needed with regard to the design of the indicators’ components. First, the poverty threshold of US$1.90/day (PPP) does not account for the fact that achieving the same set of capabilities may require a different set of goods and services in different countries. In addition, it may become unsuited to tracking the evolution of poverty across and within countries as they continue to develop. Second, the upper age limit of 64 years for the working-age population requires further examination since the reality of “retiring” differs significantly across the world. Third, the concept of vulnerability is based on strong assumptions and its definition would benefit from new empirical evidence.
The consequences for dependency rates represented by high youth unemployment, low female labour force participation, high rates of labour underutilization, significant levels of vulnerable employment and the high incidence of working poverty lead to some key policy messages. Overall,
References
Annex
Table A1 . Ranking of countries and territories by ageing status (population aged 65 and over as % of total population) in 2020, 2030 and 2050
|
|
|
|
|
|
|
|
|
|
|
|
|
|---|---|---|---|---|---|---|---|---|---|---|---|
|
|
|||||||||||
|
1 |
1 |
Japan |
28.40 |
1 |
1 |
Japan |
30.87 |
1 |
1 |
Republic of Korea |
38.07 |
|
2 |
29 |
Hong Kong, China |
18.20 |
2 |
8 |
Hong Kong, China |
25.84 |
2 |
2 |
Japan |
37.69 |
|
3 |
38 |
New Zealand |
16.37 |
3 |
15 |
Republic of Korea |
24.75 |
3 |
6 |
Taiwan, China |
34.99 |
|
4 |
39 |
Australia |
16.21 |
4 |
23 |
Taiwan, China |
23.37 |
4 |
8 |
Hong Kong, China |
34.68 |
|
5 |
41 |
Taiwan, China |
15.85 |
5 |
29 |
Singapore |
22.49 |
5 |
9 |
Singapore |
33.27 |
|
6 |
42 |
Republic of Korea |
15.79 |
6 |
41 |
New Zealand |
20.54 |
6 |
18 |
Thailand |
29.64 |
|
7 |
55 |
Singapore |
13.35 |
7 |
45 |
Macao, China |
20.25 |
7 |
21 |
Macao, China |
28.91 |
|
8 |
56 |
Thailand |
12.96 |
8 |
48 |
Thailand |
19.61 |
8 |
37 |
China |
26.07 |
|
9 |
61 |
Macao, China |
11.97 |
9 |
50 |
Australia |
19.32 |
9 |
54 |
New Zealand |
23.85 |
|
10 |
62 |
China |
11.97 |
10 |
62 |
China |
16.87 |
10 |
60 |
Australia |
22.78 |
|
11 |
67 |
Guam |
10.54 |
11 |
66 |
Guam |
14.64 |
11 |
65 |
French Polynesia |
21.92 |
|
12 |
72 |
New Caledonia |
9.70 |
12 |
71 |
French Polynesia |
13.44 |
12 |
67 |
Brunei Darussalam |
21.75 |
|
13 |
74 |
DPR Korea |
9.35 |
13 |
73 |
New Caledonia |
13.38 |
13 |
75 |
New Caledonia |
20.49 |
|
14 |
77 |
French Polynesia |
9.07 |
14 |
76 |
DPR Korea |
12.70 |
14 |
76 |
Viet Nam |
20.45 |
|
15 |
87 |
Viet Nam |
7.87 |
15 |
83 |
Viet Nam |
11.95 |
15 |
81 |
DPR Korea |
19.70 |
|
16 |
95 |
Malaysia |
7.18 |
16 |
93 |
Brunei Darussalam |
10.20 |
16 |
82 |
Guam |
19.19 |
|
17 |
98 |
Fed. States Micronesia |
6.94 |
17 |
97 |
Fed. States Micronesia |
10.07 |
17 |
93 |
Malaysia |
17.00 |
|
18 |
104 |
Indonesia |
6.26 |
18 |
98 |
Malaysia |
10.03 |
18 |
102 |
Indonesia |
15.86 |
|
19 |
105 |
Myanmar |
6.24 |
19 |
101 |
Indonesia |
9.17 |
19 |
114 |
Myanmar |
13.18 |
|
20 |
107 |
Tonga |
5.92 |
20 |
106 |
Myanmar |
8.52 |
20 |
115 |
Fed. States Micronesia |
13.13 |
|
21 |
109 |
Fiji |
5.82 |
21 |
107 |
Fiji |
8.13 |
21 |
125 |
Mongolia |
12.00 |
|
22 |
111 |
Brunei Darussalam |
5.57 |
22 |
110 |
Philippines |
7.60 |
22 |
127 |
Philippines |
11.80 |
|
23 |
112 |
Philippines |
5.51 |
23 |
119 |
Mongolia |
6.86 |
23 |
128 |
Cambodia |
11.68 |
|
24 |
117 |
Samoa |
5.08 |
24 |
120 |
Samoa |
6.84 |
24 |
129 |
Fiji |
11.16 |
|
25 |
123 |
Cambodia |
4.85 |
25 |
122 |
Cambodia |
6.69 |
25 |
133 |
Lao People’s DR |
10.41 |
|
26 |
133 |
Mongolia |
4.31 |
26 |
123 |
Tonga |
6.68 |
26 |
138 |
Samoa |
9.14 |
|
27 |
134 |
Timor-Leste |
4.28 |
27 |
130 |
Kiribati |
6.17 |
27 |
139 |
Tonga |
8.93 |
|
28 |
135 |
Lao People’s DR |
4.26 |
28 |
135 |
Lao People’s DR |
5.64 |
28 |
140 |
Kiribati |
8.72 |
|
29 |
136 |
Kiribati |
4.21 |
29 |
142 |
Timor-Leste |
4.97 |
29 |
147 |
Solomon Islands |
7.02 |
|
30 |
140 |
Solomon Islands |
3.67 |
30 |
145 |
Solomon Islands |
4.41 |
30 |
150 |
Papua New Guinea |
6.57 |
|
31 |
141 |
Vanuatu |
3.61 |
31 |
146 |
Papua New Guinea |
4.37 |
31 |
152 |
Timor-Leste |
6.48 |
|
32 |
144 |
Papua New Guinea |
3.57 |
32 |
148 |
Vanuatu |
4.25 |
32 |
153 |
Vanuatu |
6.45 |
|
|
|||||||||||
|
1 |
66 |
Sri Lanka |
11.23 |
1 |
64 |
Sri Lanka |
15.43 |
1 |
62 |
Sri Lanka |
22.58 |
|
2 |
102 |
India |
6.57 |
2 |
104 |
India |
8.57 |
2 |
72 |
Maldives |
20.88 |
|
3 |
106 |
Bhutan |
6.20 |
3 |
109 |
Bhutan |
7.82 |
3 |
103 |
Bhutan |
15.84 |
|
4 |
108 |
Nepal |
5.83 |
4 |
113 |
Bangladesh |
7.45 |
4 |
104 |
Bangladesh |
15.81 |
|
5 |
115 |
Bangladesh |
5.23 |
5 |
116 |
Nepal |
7.07 |
5 |
112 |
India |
13.75 |
|
6 |
132 |
Pakistan |
4.35 |
6 |
121 |
Maldives |
6.72 |
6 |
118 |
Nepal |
12.85 |
|
7 |
142 |
Maldives |
3.59 |
7 |
139 |
Pakistan |
5.21 |
7 |
142 |
Pakistan |
7.87 |
|
8 |
177 |
Afghanistan |
2.65 |
8 |
172 |
Afghanistan |
3.14 |
8 |
164 |
Afghanistan |
5.42 |
|
|
|||||||||||
|
1 |
2 |
Italy |
23.30 |
1 |
2 |
Italy |
27.89 |
1 |
3 |
Spain |
36.81 |
|
2 |
3 |
Portugal |
22.77 |
2 |
3 |
Portugal |
27.05 |
2 |
4 |
Greece |
36.23 |
|
3 |
4 |
Finland |
22.55 |
3 |
4 |
Greece |
26.51 |
3 |
5 |
Italy |
36.01 |
|
4 |
5 |
Greece |
22.28 |
4 |
5 |
Lithuania |
26.38 |
4 |
7 |
Portugal |
34.81 |
|
5 |
6 |
Germany |
21.69 |
5 |
6 |
Germany |
26.18 |
5 |
11 |
Slovenia |
32.14 |
|
6 |
7 |
Bulgaria |
21.47 |
6 |
7 |
Finland |
25.99 |
6 |
12 |
Poland |
31.13 |
|
7 |
9 |
Croatia |
21.25 |
7 |
9 |
Slovenia |
25.46 |
7 |
13 |
Croatia |
30.87 |
|
8 |
11 |
France |
20.75 |
8 |
12 |
Croatia |
25.08 |
8 |
14 |
Bosnia & Herzegovina |
30.39 |
|
9 |
12 |
Slovenia |
20.74 |
9 |
13 |
Spain |
25.04 |
9 |
16 |
Germany |
30.01 |
|
10 |
13 |
Latvia |
20.69 |
10 |
14 |
Latvia |
24.97 |
10 |
19 |
Austria |
29.39 |
|
11 |
14 |
Lithuania |
20.62 |
11 |
16 |
Netherlands |
24.61 |
11 |
20 |
Lithuania |
28.98 |
|
12 |
15 |
Estonia |
20.37 |
12 |
17 |
France |
24.13 |
12 |
22 |
Czechia |
28.86 |
|
13 |
16 |
Sweden |
20.33 |
13 |
18 |
Bosnia & Herzegovina |
24.09 |
13 |
23 |
Slovakia |
28.86 |
|
14 |
17 |
Denmark |
20.16 |
14 |
19 |
Austria |
23.69 |
14 |
24 |
Estonia |
28.73 |
|
15 |
18 |
Hungary |
20.16 |
15 |
20 |
Estonia |
23.55 |
15 |
25 |
Switzerland |
28.65 |
|
16 |
19 |
Czechia |
20.14 |
16 |
21 |
Bulgaria |
23.43 |
16 |
26 |
Bulgaria |
28.63 |
|
17 |
20 |
Netherlands |
20.03 |
17 |
22 |
Switzerland |
23.39 |
17 |
27 |
Netherlands |
28.00 |
|
18 |
21 |
Spain |
19.98 |
18 |
24 |
Poland |
23.22 |
18 |
28 |
Hungary |
28.00 |
|
19 |
22 |
Belgium |
19.25 |
19 |
25 |
Belgium |
22.97 |
19 |
29 |
France |
27.83 |
|
20 |
23 |
Romania |
19.23 |
20 |
28 |
Denmark |
22.60 |
20 |
30 |
Latvia |
27.81 |
|
21 |
24 |
Austria |
19.20 |
21 |
30 |
Czechia |
22.22 |
21 |
32 |
Romania |
27.67 |
|
22 |
25 |
Switzerland |
19.10 |
22 |
31 |
Sweden |
22.15 |
22 |
33 |
Finland |
27.57 |
|
23 |
26 |
Serbia |
19.06 |
23 |
33 |
Hungary |
21.98 |
23 |
34 |
Belgium |
26.92 |
|
24 |
27 |
Poland |
18.74 |
24 |
35 |
United Kingdom |
21.52 |
24 |
35 |
Serbia |
26.64 |
|
25 |
28 |
United Kingdom |
18.65 |
25 |
36 |
Serbia |
21.18 |
25 |
36 |
Ireland |
26.62 |
|
26 |
31 |
Bosnia & Herzegovina |
17.92 |
26 |
37 |
Romania |
21.04 |
26 |
38 |
Cyprus |
26.00 |
|
27 |
33 |
Norway |
17.53 |
27 |
38 |
Slovakia |
20.99 |
27 |
39 |
North Macedonia |
25.65 |
|
28 |
34 |
Ukraine |
16.95 |
28 |
40 |
Albania |
20.73 |
28 |
40 |
Ukraine |
25.52 |
|
29 |
36 |
Slovakia |
16.70 |
29 |
42 |
Belarus |
20.50 |
29 |
41 |
Albania |
25.44 |
|
30 |
43 |
Montenegro |
15.77 |
30 |
43 |
Norway |
20.27 |
30 |
42 |
United Kingdom |
25.34 |
|
31 |
44 |
Iceland |
15.62 |
31 |
46 |
Iceland |
20.11 |
31 |
43 |
Iceland |
25.17 |
|
32 |
45 |
Belarus |
15.58 |
32 |
47 |
Ukraine |
20.01 |
32 |
47 |
Sweden |
24.58 |
|
33 |
46 |
Russian Federation |
15.51 |
33 |
49 |
Russian Federation |
19.60 |
33 |
48 |
Luxembourg |
24.50 |
|
34 |
47 |
Georgia |
15.25 |
34 |
51 |
Montenegro |
19.22 |
34 |
50 |
Denmark |
24.23 |
|
35 |
49 |
Albania |
14.70 |
35 |
52 |
Georgia |
18.54 |
35 |
52 |
Belarus |
24.00 |
|
36 |
51 |
Ireland |
14.58 |
36 |
53 |
North Macedonia |
18.24 |
36 |
53 |
Norway |
23.95 |
|
37 |
52 |
North Macedonia |
14.48 |
37 |
54 |
Cyprus |
18.21 |
37 |
55 |
Montenegro |
23.78 |
|
38 |
53 |
Cyprus |
14.41 |
38 |
55 |
Ireland |
18.14 |
38 |
58 |
Republic of Moldova |
23.03 |
|
39 |
54 |
Luxembourg |
14.39 |
39 |
56 |
Luxembourg |
18.04 |
39 |
59 |
Russian Federation |
22.86 |
|
40 |
58 |
Republic of Moldova |
12.49 |
40 |
60 |
Republic of Moldova |
16.96 |
40 |
66 |
Georgia |
21.78 |
|
41 |
63 |
Armenia |
11.80 |
41 |
61 |
Armenia |
16.90 |
41 |
69 |
Armenia |
21.39 |
|
42 |
79 |
Turkey |
8.98 |
42 |
80 |
Turkey |
12.34 |
42 |
73 |
Turkey |
20.86 |
|
43 |
86 |
Kazakhstan |
7.90 |
43 |
85 |
Azerbaijan |
11.78 |
43 |
88 |
Azerbaijan |
17.50 |
|
44 |
101 |
Azerbaijan |
6.74 |
44 |
89 |
Kazakhstan |
11.07 |
44 |
111 |
Kazakhstan |
14.15 |
|
45 |
124 |
Uzbekistan |
4.79 |
45 |
112 |
Uzbekistan |
7.56 |
45 |
123 |
Uzbekistan |
12.18 |
|
46 |
126 |
Turkmenistan |
4.77 |
46 |
114 |
Kyrgyzstan |
7.23 |
46 |
131 |
Turkmenistan |
10.60 |
|
47 |
127 |
Kyrgyzstan |
4.73 |
47 |
117 |
Turkmenistan |
7.07 |
47 |
134 |
Kyrgyzstan |
10.08 |
|
48 |
153 |
Tajikistan |
3.18 |
48 |
141 |
Tajikistan |
5.06 |
48 |
144 |
Tajikistan |
7.50 |
|
|
|||||||||||
|
1 |
8 |
Malta |
21.32 |
1 |
10 |
Malta |
25.32 |
1 |
15 |
Malta |
30.37 |
|
2 |
59 |
Israel |
12.41 |
2 |
69 |
Israel |
13.64 |
2 |
71 |
Lebanon |
20.94 |
|
3 |
80 |
Tunisia |
8.87 |
3 |
78 |
Tunisia |
12.50 |
3 |
77 |
Tunisia |
20.20 |
|
4 |
90 |
Morocco |
7.61 |
4 |
81 |
Lebanon |
11.99 |
4 |
78 |
Iran (Islamic Rep of.) |
20.16 |
|
5 |
92 |
Lebanon |
7.55 |
5 |
88 |
Morocco |
11.16 |
5 |
80 |
Kuwait |
19.73 |
|
6 |
100 |
Algeria |
6.74 |
6 |
100 |
Iran (Islamic Rep. of) |
9.55 |
6 |
89 |
Morocco |
17.46 |
|
7 |
103 |
Iran (Islamic Rep. of) |
6.56 |
7 |
102 |
Algeria |
8.94 |
7 |
91 |
Saudi Arabia |
17.24 |
|
8 |
114 |
Egypt |
5.33 |
8 |
111 |
Kuwait |
7.58 |
8 |
95 |
Israel |
16.58 |
|
9 |
122 |
Syrian Arab Republic |
4.87 |
9 |
126 |
Djibouti |
6.40 |
9 |
96 |
Libya |
16.35 |
|
10 |
128 |
Djibouti |
4.71 |
10 |
127 |
Egypt |
6.38 |
10 |
99 |
United Arab Emirates |
16.11 |
|
11 |
129 |
Libya |
4.53 |
11 |
128 |
Libya |
6.33 |
11 |
101 |
Algeria |
15.89 |
|
12 |
138 |
Jordan |
3.95 |
12 |
132 |
Saudi Arabia |
6.05 |
12 |
110 |
Qatar |
14.17 |
|
13 |
147 |
Saudi Arabia |
3.50 |
13 |
133 |
Syrian Arab Republic |
6.05 |
13 |
113 |
Syrian Arab Republic |
13.50 |
|
14 |
148 |
Iraq |
3.44 |
14 |
136 |
Bahrain |
5.56 |
14 |
116 |
Bahrain |
12.95 |
|
15 |
152 |
Occ. Palestinian Terr. |
3.22 |
15 |
138 |
Jordan |
5.55 |
15 |
117 |
Oman |
12.86 |
|
16 |
160 |
Kuwait |
3.04 |
16 |
140 |
United Arab Emirates |
5.14 |
16 |
124 |
Djibouti |
12.13 |
|
17 |
165 |
Yemen |
2.93 |
17 |
143 |
Qatar |
4.71 |
17 |
126 |
Jordan |
11.84 |
|
18 |
176 |
Bahrain |
2.65 |
18 |
144 |
Oman |
4.44 |
18 |
137 |
Egypt |
9.42 |
|
19 |
182 |
Oman |
2.51 |
19 |
152 |
Occ. Palestinian Terr. |
4.14 |
19 |
143 |
Occ. Palestinian Terr. |
7.56 |
|
20 |
192 |
Qatar |
1.69 |
20 |
159 |
Iraq |
3.78 |
20 |
146 |
Iraq |
7.08 |
|
21 |
193 |
United Arab Emirates |
1.26 |
21 |
168 |
Yemen |
3.38 |
21 |
158 |
Yemen |
5.91 |
|
|
|||||||||||
|
1 |
10 |
Puerto Rico |
32.65 |
1 |
10 |
Puerto Rico |
20.83 |
1 |
11 |
Puerto Rico |
25.16 |
|
2 |
17 |
Cuba |
29.83 |
2 |
32 |
Curaçao |
17.67 |
2 |
26 |
Curaçao |
22.88 |
|
3 |
31 |
Barbados |
27.74 |
3 |
35 |
Barbados |
16.70 |
3 |
32 |
Barbados |
22.06 |
|
4 |
45 |
Chile |
24.90 |
4 |
40 |
Cuba |
15.89 |
4 |
34 |
Cuba |
21.66 |
|
5 |
46 |
Curaçao |
24.73 |
5 |
48 |
Uruguay |
15.09 |
5 |
39 |
Aruba |
20.74 |
|
6 |
51 |
Saint Lucia |
24.06 |
6 |
50 |
Aruba |
14.60 |
6 |
58 |
Chile |
17.15 |
|
7 |
56 |
Costa Rica |
23.66 |
7 |
60 |
Chile |
12.24 |
7 |
59 |
Uruguay |
17.15 |
|
8 |
57 |
Trinidad and Tobago |
23.05 |
8 |
64 |
Trinidad and Tobago |
11.51 |
8 |
63 |
Trinidad and Tobago |
16.14 |
|
9 |
61 |
Brazil |
22.72 |
9 |
65 |
Argentina |
11.37 |
9 |
65 |
Costa Rica |
15.11 |
|
10 |
64 |
Aruba |
22.32 |
10 |
68 |
Saint Lucia |
10.30 |
10 |
67 |
Saint Lucia |
14.64 |
|
11 |
68 |
Uruguay |
21.67 |
11 |
69 |
Costa Rica |
10.25 |
11 |
68 |
Antigua and Barbuda |
13.67 |
|
12 |
70 |
Colombia |
21.01 |
12 |
70 |
St. Vincent and Gren. |
9.91 |
12 |
70 |
Brazil |
13.59 |
|
13 |
74 |
Antigua and Barbuda |
20.79 |
13 |
71 |
Grenada |
9.79 |
13 |
72 |
St. Vincent and Gren. |
13.39 |
|
14 |
83 |
St. Vincent and Gren. |
18.94 |
14 |
73 |
Brazil |
9.59 |
14 |
74 |
Colombia |
13.03 |
|
15 |
84 |
Peru |
18.93 |
15 |
75 |
Antigua and Barbuda |
9.33 |
15 |
75 |
Argentina |
12.74 |
|
16 |
85 |
Jamaica |
18.47 |
16 |
76 |
Jamaica |
9.08 |
16 |
79 |
Grenada |
12.45 |
|
17 |
86 |
Panama |
17.82 |
17 |
78 |
Colombia |
9.06 |
17 |
82 |
Jamaica |
11.96 |
|
18 |
87 |
Bahamas |
17.64 |
18 |
81 |
Peru |
8.73 |
18 |
84 |
Bahamas |
11.79 |
|
19 |
90 |
Argentina |
17.28 |
19 |
82 |
El Salvador |
8.65 |
19 |
86 |
Peru |
11.44 |
|
20 |
92 |
Mexico |
17.03 |
20 |
83 |
Panama |
8.54 |
20 |
87 |
Panama |
11.30 |
|
21 |
94 |
Grenada |
16.69 |
21 |
85 |
Venezuela (Bol. Rep.) |
7.97 |
21 |
90 |
El Salvador |
10.65 |
|
22 |
97 |
El Salvador |
16.27 |
22 |
88 |
Bahamas |
7.75 |
22 |
91 |
Guyana |
10.31 |
|
23 |
98 |
Ecuador |
16.19 |
23 |
89 |
Mexico |
7.62 |
23 |
92 |
Dominican Rep. |
10.24 |
|
24 |
100 |
Dominican Rep. |
16.02 |
24 |
91 |
Ecuador |
7.59 |
24 |
94 |
Mexico |
10.20 |
|
25 |
105 |
Venezuela (Bol. Rep.) |
15.33 |
25 |
93 |
Dominican Rep. |
7.53 |
25 |
95 |
Venezuela (Bol. Rep.) |
10.13 |
|
26 |
106 |
Nicaragua |
14.93 |
26 |
94 |
Bolivia (Plurin. State) |
7.49 |
26 |
96 |
Ecuador |
10.10 |
|
27 |
108 |
Guyana |
14.82 |
27 |
96 |
Suriname |
7.14 |
27 |
99 |
Suriname |
9.97 |
|
28 |
109 |
Suriname |
14.37 |
28 |
97 |
Guyana |
7.00 |
28 |
103 |
Bolivia (Plurin. State) |
8.78 |
|
29 |
119 |
Honduras |
12.84 |
29 |
99 |
Paraguay |
6.81 |
29 |
105 |
Paraguay |
8.52 |
|
30 |
120 |
Paraguay |
12.77 |
30 |
110 |
Nicaragua |
5.68 |
30 |
108 |
Nicaragua |
7.99 |
|
31 |
121 |
Belize |
12.76 |
31 |
116 |
Haiti |
5.17 |
31 |
118 |
Belize |
7.06 |
|
32 |
122 |
Bolivia (Plurin. State) |
12.72 |
32 |
118 |
Guatemala |
5.04 |
32 |
125 |
Honduras |
6.66 |
|
33 |
130 |
Guatemala |
10.95 |
33 |
119 |
Belize |
5.01 |
33 |
129 |
Haiti |
6.31 |
|
34 |
135 |
Haiti |
10.08 |
34 |
120 |
Honduras |
4.97 |
34 |
131 |
Guatemala |
6.12 |
|
|
|||||||||||
|
1 |
30 |
Canada |
18.10 |
1 |
27 |
Canada |
22.82 |
1 |
44 |
Canada |
25.04 |
|
2 |
37 |
United States |
16.63 |
2 |
44 |
United States |
20.26 |
2 |
63 |
United States |
22.35 |
|
|
|||||||||||
|
1 |
57 |
Mauritius |
12.52 |
1 |
57 |
Mauritius |
17.99 |
1 |
49 |
Mauritius |
24.46 |
|
2 |
84 |
Seychelles |
8.07 |
2 |
77 |
Seychelles |
12.60 |
2 |
79 |
Seychelles |
20.02 |
|
3 |
113 |
South Africa |
5.51 |
3 |
115 |
Cabo Verde |
7.16 |
3 |
107 |
Cabo Verde |
14.83 |
|
4 |
121 |
Lesotho |
4.95 |
4 |
124 |
South Africa |
6.68 |
4 |
132 |
South Africa |
10.49 |
|
5 |
125 |
Cabo Verde |
4.79 |
5 |
134 |
Botswana |
5.65 |
5 |
136 |
Botswana |
9.98 |
|
6 |
130 |
Botswana |
4.51 |
6 |
137 |
Lesotho |
5.55 |
6 |
141 |
Lesotho |
8.06 |
|
7 |
131 |
Eritrea |
4.51 |
7 |
147 |
Rwanda |
4.37 |
7 |
145 |
Gabon |
7.43 |
|
8 |
137 |
Eswatini |
4.01 |
8 |
149 |
Eritrea |
4.23 |
8 |
148 |
Rwanda |
6.91 |
|
9 |
139 |
Sudan |
3.67 |
9 |
150 |
Sudan |
4.20 |
9 |
149 |
Kenya |
6.72 |
|
10 |
143 |
Namibia |
3.59 |
10 |
151 |
Ghana |
4.19 |
10 |
151 |
Namibia |
6.50 |
|
11 |
145 |
Ethiopia |
3.54 |
11 |
153 |
Namibia |
4.13 |
11 |
154 |
Ghana |
6.44 |
|
12 |
146 |
Gabon |
3.53 |
12 |
154 |
Gabon |
3.91 |
12 |
155 |
Eswatini |
6.25 |
|
13 |
149 |
South Sudan |
3.35 |
13 |
155 |
Sao Tome and Principe |
3.90 |
13 |
156 |
Sao Tome and Principe |
6.18 |
|
14 |
150 |
Liberia |
3.32 |
14 |
156 |
Eswatini |
3.83 |
14 |
157 |
Ethiopia |
6.05 |
|
15 |
151 |
Benin |
3.28 |
15 |
157 |
Ethiopia |
3.83 |
15 |
159 |
Comoros |
5.74 |
|
16 |
154 |
Mauritania |
3.18 |
16 |
158 |
Comoros |
3.82 |
16 |
160 |
Sudan |
5.68 |
|
17 |
155 |
Ghana |
3.14 |
17 |
160 |
Liberia |
3.78 |
17 |
161 |
Madagascar |
5.63 |
|
18 |
156 |
Rwanda |
3.12 |
18 |
161 |
Madagascar |
3.73 |
18 |
162 |
Mauritania |
5.56 |
|
19 |
157 |
Senegal |
3.11 |
19 |
162 |
Mauritania |
3.68 |
19 |
163 |
Liberia |
5.53 |
|
20 |
158 |
Comoros |
3.11 |
20 |
163 |
Benin |
3.60 |
20 |
165 |
Zimbabwe |
5.42 |
|
21 |
159 |
Madagascar |
3.10 |
21 |
164 |
South Sudan |
3.57 |
21 |
166 |
Eritrea |
5.39 |
|
22 |
161 |
DR Congo |
3.02 |
22 |
165 |
Congo |
3.45 |
22 |
167 |
Congo |
5.35 |
|
23 |
162 |
Zimbabwe |
3.01 |
23 |
166 |
Kenya |
3.43 |
23 |
168 |
Senegal |
5.22 |
|
24 |
163 |
Sao Tome and Principe |
3.01 |
24 |
167 |
Senegal |
3.38 |
24 |
169 |
Togo |
5.12 |
|
25 |
164 |
Guinea |
2.95 |
25 |
169 |
Zimbabwe |
3.33 |
25 |
170 |
Sierra Leone |
4.92 |
|
26 |
166 |
Sierra Leone |
2.93 |
26 |
170 |
Togo |
3.27 |
26 |
171 |
Benin |
4.84 |
|
27 |
167 |
Togo |
2.91 |
27 |
171 |
DR Congo |
3.18 |
27 |
172 |
South Sudan |
4.69 |
|
28 |
168 |
Somalia |
2.90 |
28 |
173 |
Sierra Leone |
3.13 |
28 |
173 |
Malawi |
4.59 |
|
29 |
169 |
Guinea-Bissau |
2.89 |
29 |
174 |
Guinea |
3.08 |
29 |
174 |
United Rep. Tanzania |
4.51 |
|
30 |
170 |
Côte d'Ivoire |
2.88 |
30 |
175 |
Côte d'Ivoire |
3.05 |
30 |
175 |
Cameroon |
4.51 |
|
31 |
171 |
Mozambique |
2.86 |
31 |
176 |
United Rep. Tanzania |
3.00 |
31 |
176 |
Guinea-Bissau |
4.45 |
|
32 |
172 |
Central African Rep. |
2.80 |
32 |
177 |
Guinea-Bissau |
2.98 |
32 |
177 |
Zambia |
4.17 |
|
33 |
173 |
Congo |
2.76 |
33 |
178 |
Somalia |
2.94 |
33 |
178 |
Burkina Faso |
4.10 |
|
34 |
174 |
Nigeria |
2.74 |
34 |
179 |
Nigeria |
2.90 |
34 |
179 |
DR Congo |
4.10 |
|
35 |
175 |
Cameroon |
2.72 |
35 |
180 |
Central African Rep. |
2.90 |
35 |
180 |
Uganda |
4.03 |
|
36 |
178 |
United Rep. Tanzania |
2.64 |
36 |
181 |
Cameroon |
2.89 |
36 |
181 |
Côte d'Ivoire |
3.98 |
|
37 |
179 |
Malawi |
2.64 |
37 |
182 |
Burundi |
2.88 |
37 |
182 |
Nigeria |
3.96 |
|
38 |
180 |
Niger |
2.60 |
38 |
183 |
Mozambique |
2.84 |
38 |
183 |
Burundi |
3.94 |
|
39 |
181 |
Gambia |
2.53 |
39 |
184 |
Malawi |
2.83 |
39 |
184 |
Guinea |
3.93 |
|
40 |
183 |
Kenya |
2.51 |
40 |
185 |
Burkina Faso |
2.69 |
40 |
185 |
Gambia |
3.91 |
|
41 |
184 |
Chad |
2.50 |
41 |
186 |
Gambia |
2.68 |
41 |
186 |
Mozambique |
3.88 |
|
42 |
185 |
Mali |
2.48 |
42 |
187 |
Niger |
2.60 |
42 |
187 |
Mali |
3.55 |
|
43 |
186 |
Burkina Faso |
2.41 |
43 |
188 |
Chad |
2.55 |
43 |
188 |
Central African Rep. |
3.50 |
|
44 |
187 |
Equatorial Guinea |
2.38 |
44 |
189 |
Angola |
2.49 |
44 |
189 |
Chad |
3.38 |
|
45 |
188 |
Burundi |
2.38 |
45 |
190 |
Zambia |
2.46 |
45 |
190 |
Angola |
3.35 |
|
46 |
189 |
Angola |
2.19 |
46 |
191 |
Mali |
2.42 |
46 |
191 |
Equatorial Guinea |
3.27 |
|
47 |
190 |
Zambia |
2.13 |
47 |
192 |
Uganda |
2.34 |
47 |
192 |
Somalia |
3.08 |
|
48 |
191 |
Uganda |
1.99 |
48 |
193 |
Equatorial Guinea |
2.21 |
48 |
193 |
Niger |
2.71 |
Table A2 . Income groupings
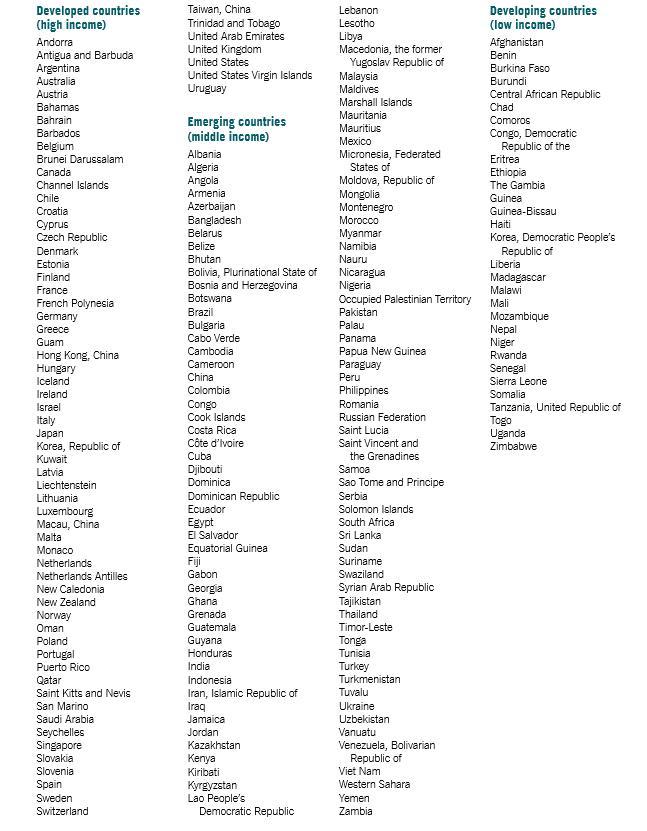
Acknowledgements
We would like to thank our colleagues Eléonore D'Achon, Sara Elder and Aurelio Parisotto for their careful review of this working paper and Dorothea Schmidt-Klau for her insightful input at various stages of its development. We are grateful to the participants of the Sixth Regulating for Decent Work Conference who provided valuable feedback and additional insights. We are most grateful to Deborah Greenfield for her final comments and for her full support in finalizing this paper. The final product would not have seen the light of day without the excellent technical assistance provided by Carole Turcato and the thorough editing provided by Laurie Munslow.

