


Estimating labour market transitions from labour force surveys
The case of Viet Nam
Abstract
Labour market transitions that workers experience throughout their working life play an important role in current policy discussions surrounding the future of work. Transitions occur between employment, unemployment and inactivity, but also between formality and informality, as well as between different occupations or industries. This paper discusses methodologies that are available from the literature to estimate the incidence and frequency of transitions using data from labour force surveys, which are run as a rotating panel. The paper then applies these methodologies to Viet Nam in 2011-19, producing estimates of different types of labour market transitions. Without aiming to be comprehensive, this paper provides some examples of what type of data can be produced, demonstrating the feasibility and value of transitions data for labour market analysis.
Introduction
Labour market transitions play an important role in current policy discussions surrounding the future of work. The Centenary Declaration for the Future of Work, adopted at the International Labour Conference (ILC) in June 2019, calls for “effective measures to support people through the transitions they will face throughout their working lives”.1 The Declaration also refers to the promotion of the transition from the informal to the formal economy, in line with the Transition from the Informal to the Formal Economy Recommendation (R204) adopted by the ILC in 2015. The Global Commission on the Future of Work, which was set in place by the International Labour Organization (ILO) as part of its Future of Work Initiative, mentioned in its 2019 report the “increasing number of labour market transitions” that workers will go through “over the course of their lives” (ILO, 2019). Even though labour market transitions have gained such a prominent role in current discussions, data on transitions is rather scarce, in particular in the context of developing countries, and often not produced on the basis of standard labour force surveys. In some instances, the design of labour force surveys inhibits the direct estimation of such data from the micro dataset. In other instances, however, the design would actually allow for the production of labour market transitions data, but the information needed to produce these data is simply not being used.
The purpose of this paper is to demonstrate how labour force surveys can be used to measure labour market transitions, highlighting the particular example of Viet Nam. Labour force survey data in Viet Nam are collected on a quarterly basis, using a rotating panel data approach, where each respondent in principle takes part in the labour force survey twice, over two consecutive quarters. In other words, households respond to the labour force survey questionnaire twice, which allows to track quarterly changes in an individual’s job or labour market status. In such a setting, estimates on the prevalence of job-to-job transitions or any other types of labour market transitions can then be directly derived from the labour force survey, for Viet Nam as well as for any other country with a similar labour force survey design.
This paper relies on well-established methodologies that have been developed in the literature and applies these methodologies to Vietnamese labour force survey data for 2011-19 in order to produce data on labour market transitions for this time period. More specifically, the paper produces estimates of transitions into and out of employment, as well as within and across a broad set of job types – including transitions between formality and informality, between industries, and between occupations. The paper considers both 2- and 4-digit categories for industries and occupations.
Labour market transitions are useful to analyze labour markets. Cross-sectional surveys provide snapshots of the distribution of workers across various labour force statuses, formality statuses, industries, and occupations. However, changes in the stock of workers in any given category are driven by labour market transitions. Variations in job finding and job separation rates underlie fluctuations in the stock of employed and unemployed workers. Similarly, as the probability of finding a formal job rises, or the probability of separating from one declines, the number of formally employed workers increases. There are also transitions between industries and occupations, and workers that have a job in a particular industry or occupation might be more likely to move to another industry or occupation than other workers. Surveys with a panel structure allow measurements of these worker flows. Estimates of labour market transitions are thus informative of labour market dynamics and provide insight into current and future changes in the distribution of workers across the economy, which in turn can help policy making.
Worker flows across narrowly defined industries or occupations can provide important information about the evolution of the labour market that is unobserved when only considering transitions into and out of employment. Examples of insights that can be drawn from cross-industry or cross-occupation flows are abound. For instance, high transition rates can be indicative of the transferability of skills across occupations. The dynamics of cross-occupation or industry transitions across workers’ lifecycles is informative for examining career progressions as well as for assessing whether labour market trajectories stabilize towards a particular occupation with workers’ age. Transitions across occupations provide insights into each occupation's exposure to shocks.
Another use of labour market transitions data can be found in labour market forecasting. For example, instead of forecasting unemployment directly, it is possible to forecast separately the transitions into unemployment and the transitions out of unemployment. Forecasts of entries and exits into and out of the pool of unemployed workers then produce an implied forecast of overall unemployment. By separately estimating both components and understanding their individuals drivers, forecasting precision can increase (Barnichon and Nekarda, 2012; Barnichon and Garda, 2016). A similar argument can be made for predictions of the stock of workers in any given labour market category.
Moreover, variations in the employment rate within any job type, industry or occupation over time can be decomposed into changes in the inflow or outflow rate, or changes in the composition of the workforce. The inflow and outflow rates measure how many workers join or exit the pool of workers with a given job type, industry or occupation within a certain period of time. The composition of the workforce accounts for changes that are driven by a change in the prevalence of certain groups of workers in the total workforce, where these workers might be more or less likely to choose a particular job type, industry or occupation and therefore drive overall changes in the employment rate. This paper undertakes as an example a decomposition of the rise in formalization observed over time in Viet Nam. The change in the formality rate is decomposed into two channels: changes in the formality rate while holding the workforce composition in terms of gender, age, and educational attainment constant, and changes in the composition of the workforce while holding formality rates constant.
Section 1 of this paper provides a literature survey on the construction of measures of labour market transitions. Section 2 discusses the methodology used to construct data on labour market transitions for Viet Nam. Section 3 highlights some examples of the type of analyses that can be conducted with data on labour market transitions for Viet Nam. Section 4 introduces the results of a decomposition analysis for changes in formal employment in Viet Nam over time. The final section concludes.
Literature review
Measurement of labour market transitions
The large amount of research undertaken in recent decades on the dynamics of job loss and hiring underscores the importance of the measurement of labour market transitions, often in the literature referred to as flows. Early work on the topic focused on gross flows of workers between unemployment and employment. Hall (1972) and Feldstein (1973) highlighted the crucial role of turnover and transitions in understanding unemployment. In their work, the unemployed are not seen as a constant pool of individuals who want to work but are not doing so, even though they would be available for employment and are actively seeking work.2 Instead, unemployment is seen as the result of changing rates of entry and exit of workers from and into jobs. Most individuals are unemployed for a short period of time, and only a few experience longer unemployment spells.
A vast literature seeks to understand the underlying determinants of the cyclical fluctuations in unemployment. Darby et al. (1986) find that increases in unemployment during recessions are attributable to a rise in the rate at which workers separate from their jobs. In contrast, Hall (2005) argues that adverse shocks increase unemployment through a decline in job finding rates rather than an increase in separations. Consistent with this latter argument, Shimer (2012) finds that most of the variation in the unemployment rate is due to changes in the job finding probability, as opposed to changes in the employment exit probability.
The literature then evolved to allow for multi-state transitions including, for example, inactivity or direct job-to-job transitions. Adding non-employment, Elsby et al. (2015) find that the labour force participation margin is important for understanding fluctuations in the unemployment rate. They conclude that analyses that focus on trends in stocks only, such as the share of the population that is inactive and hence out of the labour force, ignores the cyclicality of the underlying flows, such as the flows between unemployment and inactivity. Fallick and Fleischman (2001, 2004) focus on workers’ movements across employers that occur without a non-employment spell. They similarly argue that overlooking these flows understates the dynamism in the labour market.
A related literature then analyzed the contribution of worker heterogeneity to job finding and separation probabilities. The “heterogeneity hypothesis” posed by Darby et al. (1985) is that during a downturn, the unemployed pool shifts towards a larger share of non-temporary layoffs. These workers have lower job finding probabilities. Thus, it is not that recessions are periods of particularly low outflows from unemployment, but rather that they are periods of high separation rates for a set of workers who are more likely to be unemployed for longer. The composition of the unemployment pool, and not changes in the overall job finding probability is what drives the changes in unemployment rates. Instead, Nakamura et al. (2020) argue that recessions lead to a composition effect that shifts the pool of unemployed workers towards higher skilled individuals, for whom it might be easier to move out of unemployment. This is because job separation rates increase even for this group of workers during downturns.
In the context of developing economies, the analysis of labour market transitions often focuses on transitions between formality and informality, and vice-versa. Given the vast prevalence of informal employment in many developing countries (ILO, 2018), which to a large extent determines workers’ access to social protection, formal worker representation and other aspects of job quality and decent work, this margin of transition is particularly relevant for these countries. Bosch and Maloney (2007) consider five mutually exclusive states across which workers transit in Mexico between 1987 and 2002: inactive, unemployed, informal self-employed, informal salaried and formal salaried. They find that while the cyclical properties in job finding and job separation probabilities are similar in Mexico and the US for formal salaried workers, the pattern is reverse for self-employment. Herrera et al. (2005) explore labour market transitions across different formality statuses in Peru. Tanzel and Ozdemir (2019) analyze the case of Egypt, while Gutierrez et al. (2019) focus on Bangladesh. These analyses underscore the usefulness of a flow approach, that considers transitions between formal and informal jobs, as opposed to a stock approach, which focuses on formality and informality rates at given points in time to study the evolution of the labour market.
Biases caused by attrition and misclassification error
Abowd and Zellner (1985) highlighted two issues that arise when estimating gross labour flows using rotating panel surveys. First, by construction, labour market transitions cannot be observed for individuals who are not matched on consecutive survey waves. Regardless of whether the inability to match observations across time arises as a result of temporary sample drop-outs, incomplete survey responses, or incorrect identifiers, these individuals’ transitions are excluded from measures of labour market transitions. This gives rise to attrition or rotation group bias if the probability of its occurrence is not random. Second, measurement or classification error can arise when workers misreport their labour market situation, or when interviewers introduce errors when recording the survey response. Misclassification error usually cancels out or has a minimal effect on stocks but can substantially affect flow estimation. For example, if one worker who was unemployed in one survey wave is incorrectly classified as employed in the next survey wave, even though she has actually not changed her status, and if the reverse is true for another worker, the overall error that occurs when measuring stocks might cancel out. These two classification errors, however, do contribute to an over-estimation of transitions between employment and unemployment and vice-versa.
The existing literature developed various approaches to address attrition bias. The simplest approach is to rely on a “missing-at-random”
There are different approaches to deal with non-random attrition bias. Donovan et al. (2020) use post-stratification of the sampling weights so that the distribution of the longitudinally matched sample resembles the distribution in the cross section. Fujita and Ramey (2009) propose an approach that minimizes the differences in the stocks derived from official cross-sectional data and stocks imputed from worker flows. Bleakley et al. (1999) and Fallick and Fleischman (2001), among others, use an approach similar to that employed by the Bureau of Labor Statistics (BLS) to reweight observation in the United States’ Current Population Survey. The approach relies on estimating the attrition probability for different groups in the sample, and then using the inverse estimated match rate to reweight the observation in the sample.
Also classification error can be an important source of bias in labour market flows. Clark and Summers (1979) and Poterba and Summers (1986) discuss the potential concerns of spurious transitions arising from inconsistent reporting in survey data. They estimate the bias due to classification error and correct the bias using data from re-interviews.4 Assaad et al. (2018) find important inconsistencies in cross-time reporting across different panel waves, even for time-invariant information, suggesting that classification error can be an important source of bias in some instances.
Biases caused by time aggregation
Shimer (2012) highlights the importance of time-aggregation bias when analyzing labour market flows measured in discrete time intervals. Time aggregation bias occurs because data on a worker’s situation in the labour market are not observed continuously, but only at discrete time intervals such as quarters in the case of a quarterly survey. Transitions that occur within this time interval are not observed. In the context of transitions into and out of employment, “Ignoring time aggregation will bias a researcher towards finding a countercyclical employment exit probability, because when the job finding probability falls, a worker who loses her job is more likely to experience a measured spell of unemployment”
Methodology
Data
This paper next estimates gross worker transitions and transition probabilities for Viet Nam in 2011-19.5 The paper uses micro-level data on individuals’ employment status and job type in consecutive quarters, available from Viet Nam’s quarterly labour force survey, to construct time series for the gross transitions of workers into and out of a given labour market status.
Viet Nam’s labour force survey is run as a rotating panel, in which each quarter includes data from newly surveyed households for about half of the observations, while the remaining half of the observations correspond to households that were first surveyed in the previous quarter. However, individuals can only be tracked between different quarters within a year, not across years. Transitions can hence be calculated between Q1 and Q2, between Q2 and Q3, and between Q3 and Q4 for every year; they cannot be calculated between Q4 of one year and Q1 of the next year. In line with ILO definitions, individuals who during the first of the two survey waves are under 15 years old are excluded. Furthermore, individuals which for any reason cannot be unambigously tracked over two different quarters are excluded6, as well as those who are followed in non-consecutive waves, or who appear to be followed for more than two waves in the survey.
The number of individuals that can be tracked across different quarters varies slightly over time. On average across all quarterly pairs of surveys, the number of individuals that can be tracked is about 65,000. The number varies between 56,000 and 85,000 in 2011-19.7
Gross transitions
The paper examines gross labour market transitions across four different labour market categories. These categories, and the corresponding, mutually exclusive labour market statuses that encompass them, are:
-
Labour force status (LFS): employed, unemployed, out of the labour force. -
Formal job (FNJ): employed with a formal job, employed with an informal job, not employed.8 -
Industry (IND): 86 2-digit or 524 4-digit industry classification categories, plus a not employed group. -
Occupation (OCCU): 11 2-digit or 568 4-digit industry classification categories, plus a not employed group.
Let {LFS, FNJ, IND, OCCU} be the set of these 4 categories, labelled as
|
|
(1) |
The quarterly transition probabilities out of state
Weights
In all cases, the analysis in this paper considers two possible weight: sampling weights and attrition revised weights. The former uses the sampling weights provided by Viet Nam’s General Statistics Office as frequency weights, without any further adjustment. These weights are meant to reflect the occurrence of each observation in the general population of Viet Nam. Tables and figures presented in this paper show the sampling weights estimates.
For the attrition revised weights, the paper follows Fallick and Fleischman (2001) and uses attrition weighted inverse probability weights. The approach relies on estimating the attrition probability for different groups in the sample, and then using the inverse estimated match rate to reweight the observation in the sample. To do so, in a first step, probit models of attrition are estimated for each quarter in the data using equation (2) where is an indicator variable equal to 1 if individual
|
|
(2) |
Then, the predicted attrition probability for each group
|
|
(3) |
where is individual
Given that the Viet Nam labour force survey only tracks households for two consecutive quarters, plus the lack of data on re-interviews, this paper does not attempt to assess the extent of classification errors or make any corrections to account for their existence. In this regard, it is just worth to point out that estimates of labour market transitions that involve more disaggregated labour market categories (such as 4-digit industry or occupation classifications) are likely to suffer more from this type of bias. However, there is no unusual increase in gross flows between categories across different levels of disaggregation, which to some extent assuages concerns of misclassification.
Time aggregation
This paper follows Gomes (2015) and uses the quarterly labour force survey data to extrapolate monthly transition rates across labour market states. Continuous transitions are calculated by taking the limit of the extrapolated transition matrix, as time elapsed between observations tends to zero.
Following Gomes (2015), let be the square, quarterly transition matrix obtained from quarterly data for labour market status category C. Then, the monthly transition matrix, , is estimated as follows:
|
|
(4) |
where is the diagonal matrix of eigenvalues for matrix and is a matrix of its eigenvectors. We then obtain the continuous time transition rates from the off-diagonal elements of the matrix where is the identify matrix.
Ideally, in order to assess the accuracy of this approach, one would like to compare these extrapolated monthly transition rates to those estimated from data collected on a monthly basis. As Viet Nam’s labour force survey data have quarterly frequency, there is no possibility to make such a comparison with data from a monthly-level database.
Results
Without aiming to be comprehensive, this section presents a selected set of labour market transitions data for Viet Nam, which aim to serve as examples of the types of analyses that can be done with these data. As results that correct for the attrition bias and results that do not are in general very similar, results in this section are only shown for transitions that were estimated on the basis of unadjusted sampling weights.
Labour force status
The first and second rows of Figure 1 show, respectively, inflow and outflow probabilities from employment in Viet Nam from 2011 to 2019. Each panel shows quarterly transition probabilities into and out of employment, from and into unemployment and inactivity, respectively. Figure 1 also shows the extrapolated monthly probability calculated using equation (4) above, as well as the continuous transition rate.
Individuals flow into employment from either unemployment or inactivity. Not surprisingly, comparing panels (a) and (b) in the first row of Figure 1, indicates that the job finding probability is approximately four times larger for unemployed individuals than for those who are inactive. But for a short-lived decline in 2016, the quarterly job finding probability from unemployment was relatively stable throughout the period at a mean value of 40 per cent and a standard deviation of 5 percentage points without taking into account seasonal variation. In other words, workers that are unemployed in one quarter have a probability of 40 per cent of being in employment in the next quarter.
Job separations to inactivity are more likely than separations to unemployment, although it is important to note that outflows to unemployment may be underestimated if unemployment spells are shorter than three months and hence unobserved at a quarterly frequency. In other words, there could be some individuals that upon losing their job become unemployed, but find a new job in less than three months time, which makes them appear in the labour force survey as continuously being in employment. After 2015, quarterly job separations into unemployment declined from a peak of 0.6 per cent to under 0.2 per cent by the end of 2018.
Figure 2 depicts transitions probabilities between unemployment and inactivity. The quarterly transition probability from unemployment to inactivity declined from 27 to around 10 per cent between 2011 and 2015, before rising again more recently to above 20 per cent. The probability for an inactive worker to become unemployed has been on a declining trend.
Figure 1. Job finding and job separation probabilities
|
|
|
|

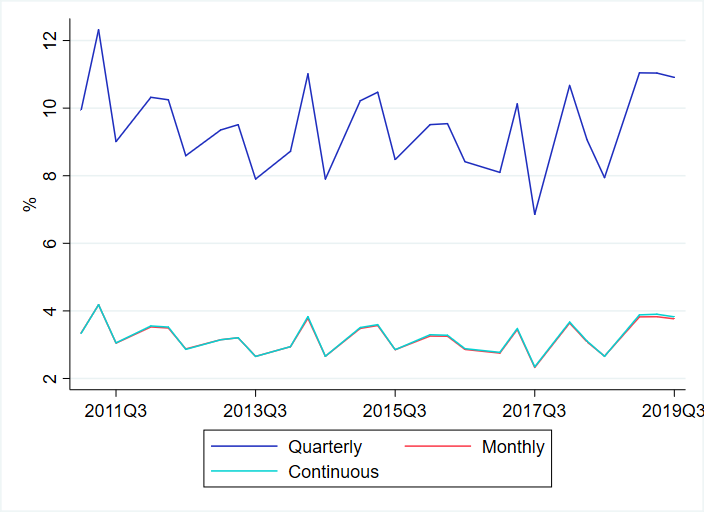
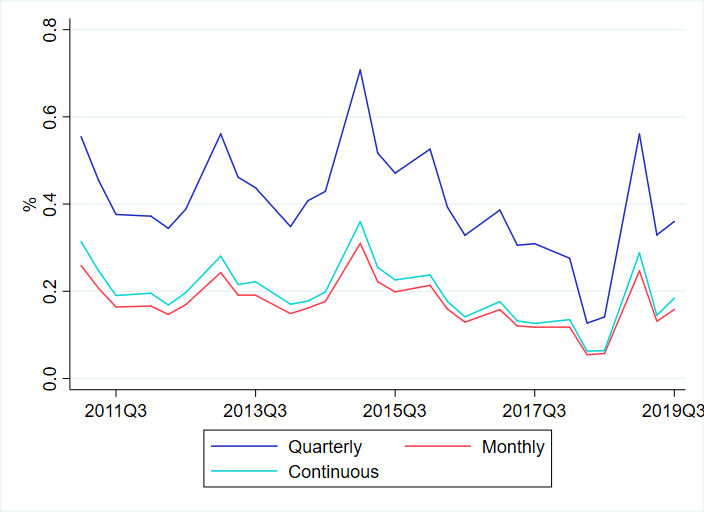
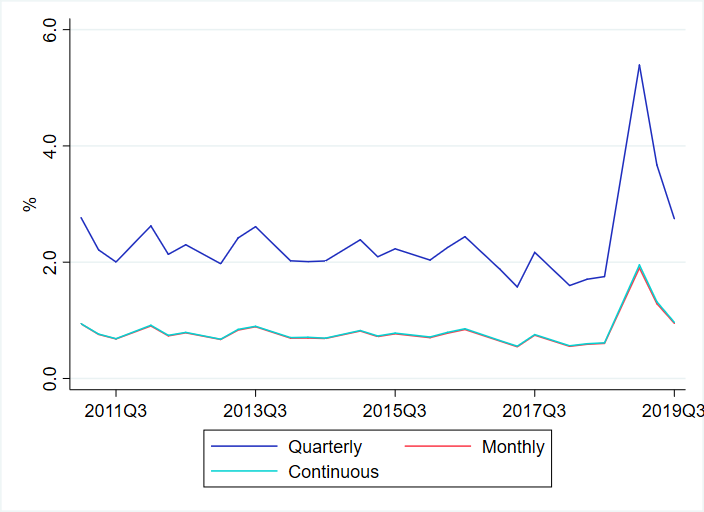
Notes: The data series that are shown use (unadjusted) sampling weights. See section 2 for more details. Breaks observed for some data series between 2018 and 2019 might be driven by a major revision of sampling weights.
Figure 2. Transition probabilities between unemployment and inactivity
|
|
|
|
|
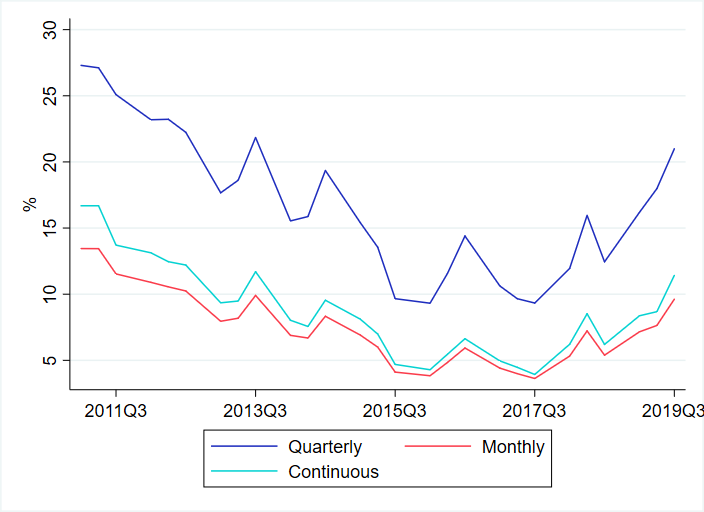
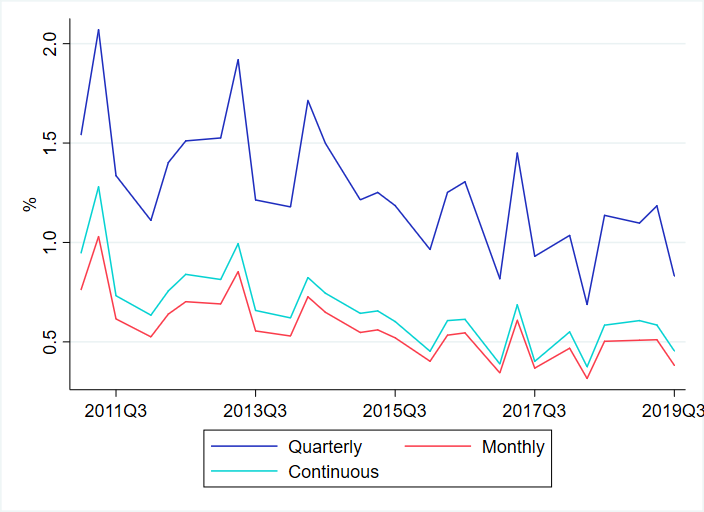
Notes: See figure 1 notes.
Table 1 shows the average quarterly transition probabilities, the mean continuous transition rates and their standard deviations. Note that because they are calculated by taking the limit as time intervals shrink to zero from extrapolated monthly rates (see equation (4)), the estimated continuous transition rates are closer to the transitions that occur per month, rather than per quarter. Multiplying the continuous rate by 3 makes both rates more directly comparable.
Table 1. Transition probabilities (per cent) and volatility in labour market status, 2011-19 (average)
|
From employment |
From unemployment |
From inactivity |
|||||
|
To: |
Unemployment |
Inactivity |
Employment |
Inactivity |
Employment |
Unemployment |
|
|
Mean |
Quarterly |
0.4 |
2.3 |
39.9 |
16.9 |
9.5 |
1.3 |
|
Continuous |
0.2 |
0.8 |
19.8 |
8.9 |
3.3 |
0.7 |
|
|
Std. Dev. |
Quarterly |
0.1 |
0.7 |
5.1 |
5.5 |
1.3 |
0.3 |
|
Continuous |
0.1 |
0.3 |
3.6 |
3.6 |
0.5 |
0.2 |
Notes: The data points that are shown were calculated on the basis of (unadjusted) sampling weights. See section 2 for more details. They correspond to the simple average of quarterly transition probabilities and continuous transition rates in 2011-19.
Formality
This section focuses on formality as defined by the nature of the job, which is for example determined by whether the worker has access to social security schemes. Figure 3 shows a relative stable overall employment rate between 2011 and 2018. However, the share of employed workers in formal jobs increased steadily from 20 to close to 30 per cent between 2013 and 2018.
The increase in formalization was not equally experienced by all groups in the workforce. Figure 4 separately calculates the share of formal employment by education levels for men (panel (a)) and women (panel (b)). Women with basic and intermediate education observed the largest increase in formalization (of 9 and 8 percentage points, respectively). The same education groups also had the largest increase for men (6 and 7 percentage points).
Figure 3. Employment and formality rates
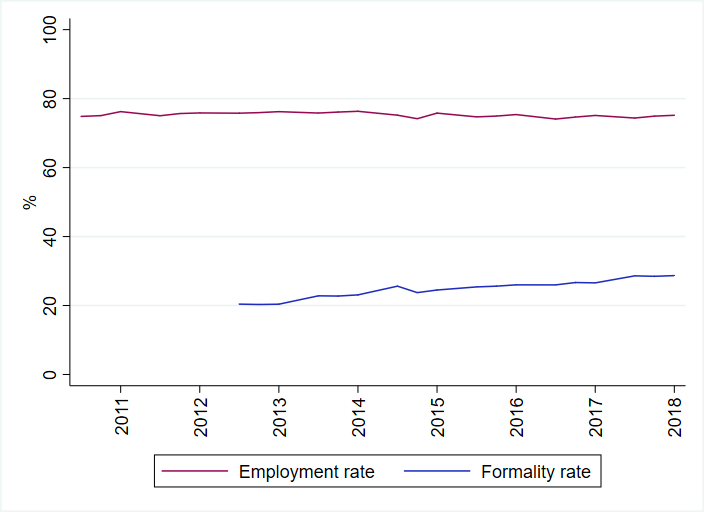
Notes: The employment rate was calculated as the share of employment in the working-age population. The formality rate was calculated as the share of formal employment in total employment.
Figure 4. Formality rates by sex and level of educational attainment
|
|
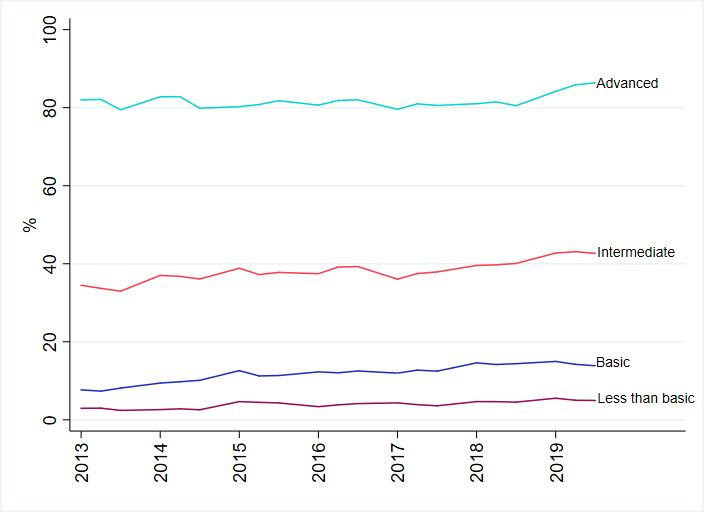
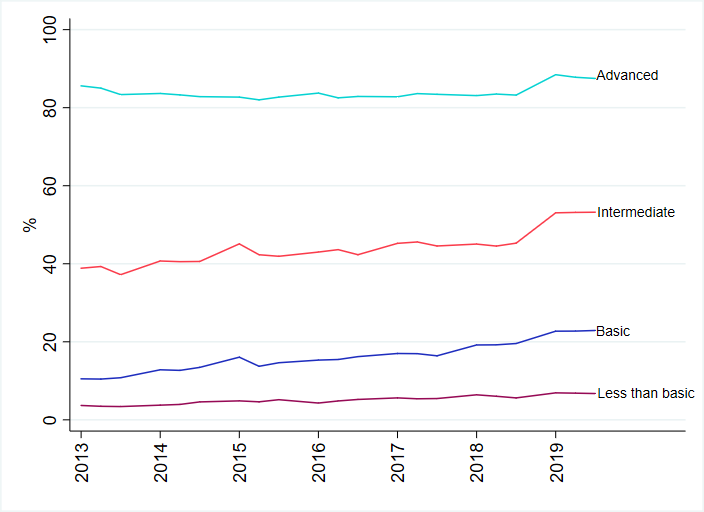
Notes: The formality rates shown in this figure were calculated as the share of formal employment in total employment by sex and level of educational attainment.
Figure 5 shows the quarterly transition probabilities (using sampling weights) from and to formal employment. Panel (a) presents transitions between formal and informal jobs without an observed non-employment spell, while panel (b) shows transitions between formal jobs and non-employment. These time series indicate that the increase in the share of workers in formal employment shown in Figure 3 can be attributed to a decrease in the separation rate of formal workers to informal jobs (from 9 to 7 per cent between 2013 and 2018) and an increase in inflows to formal jobs from informal employment (from 3 to 4 per cent within the same period). Formal jobs became more stable, and more likely to find for informally employed individuals.
Panel (b) shows that the same is not true for unemployed and inactive workers. The probability of transitioning to a formal job from non-employment remained stable around 1 per cent, as did separations from formal jobs to non-employment. It is important to note that these findings may be affected by time aggregation bias. It may be the case that transitions between informal and formal jobs shown in panel (a) are mediated by unobserved periods of non-employment. However, the quarterly frequency in the survey data plus the lack of granular information on unemployment spell durations does not allow us to correct for this further. Regardless of whether the transitions are mediated through unemployment spells or not, it is interesting to see that individuals with an informal employment spell a quarter prior are more likely to transition to a formal job than those without it.
Figure 5. Formal job finding and job separation probabilities
|
|
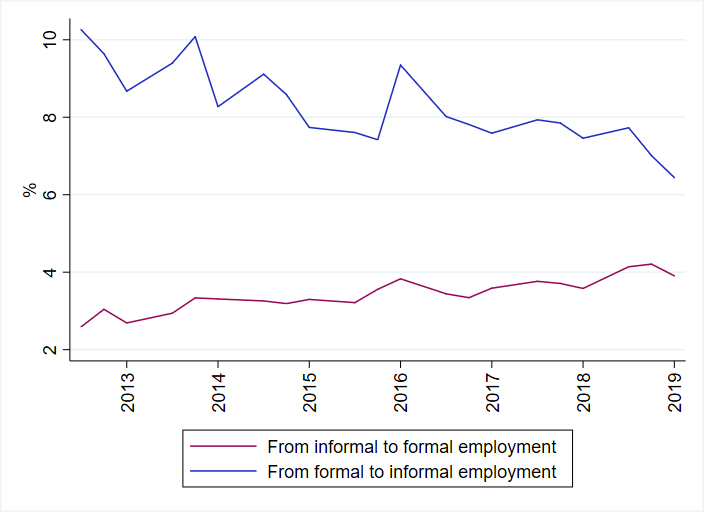
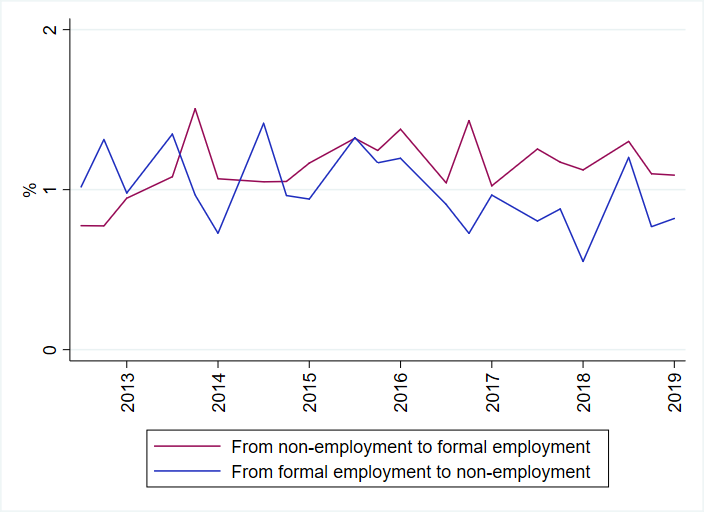
Notes: The data series that are shown were calculated on the basis of (unadjusted) sampling weights. They show quarterly transition probabilities.
Industry
Workers’ industry or sector of employment is grouped into categories using the 2 and 4-digit level of the International Standard Industrial Classification of All Economic Activities (ISIC). At the 2-digit level, there are 86 industries of which 10 categories consistently encompass three-quarters of the employed population in Viet Nam between 2011 and 2019.
This section provides an overview of labour market transitions between economic sectors at the 2-digit level. The section considers outflows to a different economic sector that occur without an observed non-employment spell (cross-sector job-to-job transitions), and outflows to non-employment. Table 2 presents the average quarterly outflow probabilities from each sector
where refers to the set of individuals that we can match in the labour force survey in the consecutive quarters
On average, 13.3 per cent of workers transition to a different sector in consecutive quarters without an observed unemployment or inactivity spell. “Financial service activities, except insurance and pension funding”, “Education”, and “Human health activities” are the sectors with the lowest probabilities of transition to another economic sector. At the other end of the spectrum, 68 per cent of all workers in “Information service activities” on average transition to a different sector in the following quarter. Various factors are likely to account for differences in the probablities to transit to another sector, including skills requirements, sectoral differences in wages, informality rates or other job quality indicators. For the vast majority of 2-digit economic sector categories (82 out of 86) the most likely average outcome for a worker is to remain in his or her current economic sector.
Table 2. Quarterly job-to-job transitions to a different sector and quarterly transitions to non-employment (per cent), 2011-19 (average)
|
ISIC 2-digit code and description |
Outflow probabilities (%) |
|
|---|---|---|
|
To new sector |
To non-employment |
|
|
Total Transitions |
|
|
|
63 - Information service activities |
68.8 |
3.9 |
|
70 - Activities of head offices; management consultancy activities |
61.7 |
0.0 |
|
02 - Forestry and logging |
50.8 |
3.2 |
|
33 - Repair and installation of machinery and equipment |
49.9 |
1.9 |
|
94 - Activities of membership organizations |
47.7 |
5.5 |
|
66 - Activities auxiliary to financial service and insurance activities |
45.6 |
0.0 |
|
81 - Services to buildings and landscape activities |
44.2 |
2.1 |
|
59 - Motion picture, video and television programme production, sound recording and music publishing activities |
43.3 |
0.6 |
|
19 - Manufacture of coke and refined petroleum products |
42.5 |
2.1 |
|
90 - Creative, arts and entertainment activities |
41.7 |
1.7 |
|
42 - Civil engineering |
41.3 |
1.7 |
|
75 - Veterinary activities |
40.5 |
1.0 |
|
37 - Sewerage |
40.4 |
0.9 |
|
28 - Manufacture of machinery and equipment n.e.c. |
40.2 |
1.6 |
|
82 - Office administrative, office support and other business support activities |
40.2 |
2.6 |
|
77 - Rental and leasing activities |
37.0 |
3.0 |
|
43 - Specialized construction activities |
35.0 |
1.8 |
|
87 - Residential care activities |
34.4 |
3.5 |
|
52 - Warehousing and support activities for transportation |
34.0 |
1.8 |
|
32 - Other manufacturing |
33.9 |
2.9 |
|
74 - Other professional, scientific and technical activities |
32.7 |
1.6 |
|
29 - Manufacture of motor vehicles, trailers and semi-trailers |
32.6 |
1.0 |
|
46 - Wholesale trade, except of motor vehicles and motorcycles |
32.5 |
1.9 |
|
71 - Architectural and engineering activities; technical testing and analysis |
31.9 |
1.1 |
|
08 - Other mining and quarrying |
31.8 |
3.2 |
|
62 - Computer programming, consultancy and related activities |
31.3 |
1.1 |
|
07 - Mining of metal ores |
31.1 |
1.4 |
|
38 - Waste collection, treatment and disposal activities; materials recovery |
30.7 |
1.9 |
|
78 - Employment activities |
30.1 |
1.6 |
|
16 - Manufacture of wood and of products of wood and cork, except furniture; manufacture of articles of straw and plaiting materials |
30.1 |
2.7 |
|
91 - Libraries, archives, museums and other cultural activities |
29.2 |
0.1 |
|
95 - Repair of computers and personal and household goods |
28.9 |
1.7 |
|
20 - Manufacture of chemicals and chemical products |
28.9 |
1.6 |
|
93 - Sports activities and amusement and recreation activities |
28.8 |
3.1 |
|
72 - Scientific research and development |
28.8 |
0.6 |
|
99 - Activities of extraterritorial organizations and bodies |
28.3 |
0.4 |
|
27 - Manufacture of electrical equipment |
28.3 |
1.2 |
|
53 - Postal and courier activities |
27.5 |
0.7 |
|
06 - Extraction of crude petroleum and natural gas |
27.2 |
4.5 |
|
13 - Manufacture of textiles |
27.1 |
2.0 |
|
24 - Manufacture of basic metals |
26.6 |
1.4 |
|
22 - Manufacture of rubber and plastics products |
26.5 |
1.8 |
|
58 - Publishing activities |
25.4 |
1.9 |
|
69 - Legal and accounting activities |
24.6 |
1.4 |
|
11 - Manufacture of beverages |
24.2 |
2.1 |
|
97 - Activities of households as employers of domestic personnel |
24.1 |
6.1 |
|
80 - Security and investigation activities |
23.9 |
2.9 |
|
17 - Manufacture of paper and paper products |
22.9 |
2.9 |
|
36 - Water collection, treatment and supply |
22.6 |
1.0 |
|
79 - Travel agency, tour operator, reservation service and related activities |
22.2 |
2.2 |
|
18 - Printing and reproduction of recorded media |
22.0 |
2.0 |
|
21 - Manufacture of basic pharmaceutical products and pharmaceutical preparations |
22.0 |
0.5 |
|
60 - Programming and broadcasting activities |
22.0 |
0.8 |
|
50 - Water transport |
21.2 |
1.5 |
|
30 - Manufacture of other transport equipment |
20.0 |
1.9 |
|
96 - Other personal service activities |
19.9 |
2.5 |
|
73 - Advertising and market research |
19.8 |
1.3 |
|
51 - Air transport |
19.4 |
0.7 |
|
61 - Telecommunications |
19.3 |
2.0 |
|
25 - Manufacture of fabricated metal products, except machinery and equipment |
17.3 |
1.7 |
|
26 - Manufacture of computer, electronic and optical products |
17.0 |
1.7 |
|
10 - Manufacture of food products |
16.8 |
3.0 |
|
12 - Manufacture of tobacco products |
15.3 |
2.5 |
|
47 - Retail trade, except of motor vehicles and motorcycles |
14.9 |
2.3 |
|
31 - Manufacture of furniture |
14.9 |
1.2 |
|
03 - Fishing and aquaculture |
14.8 |
3.4 |
|
68 - Real estate activities |
14.8 |
4.4 |
|
35 - Electricity, gas, steam and air conditioning supply |
14.7 |
1.1 |
|
41 - Construction of buildings |
14.6 |
1.6 |
|
55 - Accommodation |
14.0 |
3.0 |
|
23 - Manufacture of other non-metallic mineral products |
13.5 |
1.3 |
|
65 - Insurance, reinsurance and pension funding, except compulsory social security |
11.7 |
1.9 |
|
45 - Wholesale and retail trade and repair of motor vehicles and motorcycles |
11.7 |
1.7 |
|
49 - Land transport and transport via pipelines |
11.7 |
1.5 |
|
56 - Food and beverage service activities |
10.5 |
3.0 |
|
15 - Manufacture of leather and related products |
8.7 |
1.5 |
|
14 - Manufacture of wearing apparel |
8.7 |
2.2 |
|
92 - Gambling and betting activities |
8.5 |
3.4 |
|
84 - Public administration and defense; compulsory social security |
8.5 |
1.0 |
|
01 - Crop and animal production, hunting and related service activities |
8.3 |
4.1 |
|
64 - Financial service activities, except insurance and pension funding |
6.1 |
1.1 |
|
86 - Human health activities |
5.7 |
0.9 |
|
85 - Education |
3.4 |
1.1 |
Notes: The data points that are shown use (unadjusted) sampling weights. See section 2 for more details. They correspond to the simple average of quarterly transition probabilities in 2011-19.
To provide an example of the type of analysis that can be done with transitions, this section looks at whether transitions out of an economic sector covary with wage growth in the sector. This analysis can provide some preliminary evidence on whether transitions across sectors accompany wage growth, with workers leaving sectors in decline for sectors experiencing wage growth. To do so, the median and average monthly wage for salaried employees is calculated in each 2-digit sector per quarter. To prevent outliers from having too much weight on the average wage, wages are winsorized at 1 per cent.
Figure 6 panel (a) indicates that there is a negative correlation between the 2011-18 growth of the average wage of a sector and the average cross-sector outflow probability. Consistent with workers seeking opportunities in sectors with better wage growth prospects, the sectors that experienced smaller wage growth in the period are those that on average have higher outflow probabilities to other sectors. The average probability of transitions to non-employment does not appear to be correlated with wage growth (panel (b)).
Figure 6. Sectoral outflow probabilities and sectoral wage growth
|
Panel (a) Job-to-job transitions to another sector
|
Panel (b) Transitions to non-employment
|
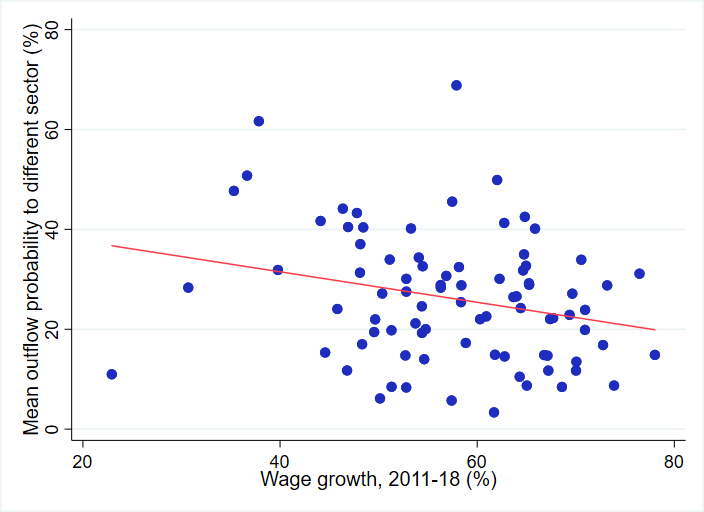
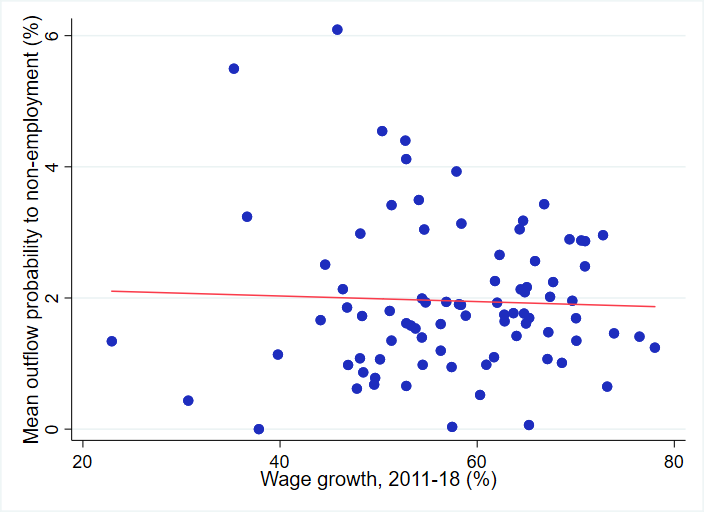
Notes: Mean outflow probability corresponds to the average quarterly outflow probability in 2011-18, calculated on the basis of (unadjusted) sampling weights. See section 2 for more details. Wage growth in 2011-18 was calculated as the change in the natural logarithm of the average sectoral wage between 2011 Q3 and 2018 Q3. Each dot corresponds to one sector at the ISIC 2-digit level.
Occupation
Workers’ occupation is grouped into categories using the 2 and 4-digit level of the International Standard Classification of Occupations (ISCO-08). At the 2-digit level, there are 10 occupational categories plus a “Not Elsewhere Classified” group. In the following, this section provides an overview of labour market transitions out of different occupations at the 2-digit level.
Table 3. Quarterly job-to-job transitions to a different occupation and quarterly transitions to non-employment (per cent), 2011-19 (average)
|
ISCO 2-digit code and description |
Outflow probabilities |
|
|---|---|---|
|
To new occupation |
To non-employment |
|
|
Total Transitions |
|
|
|
4 - Clerical support workers |
37.0 |
2.0 |
|
3 - Technicians and associate professionals |
30.4 |
1.4 |
|
6 - Skilled agricultural, forestry and fishery workers |
23.1 |
3.5 |
|
0 - Armed forces occupations |
21.8 |
0.8 |
|
7 - Craft and related trades workers |
17.8 |
1.9 |
|
1 - Managers |
17.3 |
0.8 |
|
8 - Plant and machine operators, and assemblers |
15.2 |
1.4 |
|
9 - Elementary occupations |
12.7 |
3.9 |
|
2 - Professionals |
11.8 |
0.8 |
|
5 - Service and sales workers |
10.4 |
2.5 |
Notes: The data points that are shown use (unadjusted) sampling weights. See section 2 for more details. They correspond to the simple average of quarterly transition probabilities in 2011-19.
As shown in Table 3, on average 15.3 per cent of workers transition to a job in a different occupation without an observed unemployment spell. Cross-occupation transition probabilities range from 37 per cent for clerical support workers, to 10.4 per cent for service and sales workers. Table 4 presents the average quarterly transition matrix across all occupation categories. The shaded diagonal shows the average percentage of workers who remain in the same occupation in the following quarter. The most common outcome for an employee is to remain in the same occupation. Conditional on switching occupations (without a non-employment spell), there is some indication that workers seek occupations that are to some extent similar to their previous one. For example, the most like cross-occupation outflow for managers is to the professionals category. The most likely transition from agricultural, forestry, and fishing occupations, conditional on switching, is towards elementary occupations, and vice versa.
Table 4. Quarterly occupational transition matrix, 2011-2019 (average)
|
Current quarter’s occupation (code – description) |
Next quarter’s occupation (code) |
|||||||||||
|
|
|
|
|
|
|
|
|
|
|
|
|
|
|
1 - Managers |
82 |
7 |
2 |
3 |
2 |
0 |
1 |
0 |
1 |
0 |
0 |
1 |
|
2 - Professionals |
1 |
87 |
5 |
2 |
2 |
0 |
1 |
0 |
0 |
0 |
0 |
1 |
|
3 - Technicians and associate professionals |
1 |
11 |
68 |
5 |
6 |
0 |
4 |
2 |
2 |
0 |
0 |
1 |
|
4 - Clerical support workers |
2 |
8 |
10 |
61 |
8 |
1 |
2 |
2 |
4 |
0 |
0 |
2 |
|
5 - Service and sales workers |
0 |
1 |
1 |
1 |
87 |
1 |
1 |
1 |
5 |
0 |
0 |
2 |
|
6 - Skilled agricultural, forestry and fishery |
0 |
0 |
0 |
0 |
2 |
73 |
2 |
0 |
19 |
0 |
0 |
4 |
|
7 - Craft and related trades workers |
0 |
0 |
1 |
0 |
2 |
1 |
80 |
5 |
8 |
0 |
0 |
2 |
|
8 - Plant and machine operators assemblers |
0 |
0 |
1 |
1 |
1 |
1 |
7 |
83 |
5 |
0 |
0 |
1 |
|
9 - Elementary occupations |
0 |
0 |
0 |
0 |
2 |
5 |
3 |
1 |
83 |
0 |
0 |
4 |
|
0 - Armed forces occupations |
1 |
8 |
3 |
3 |
5 |
0 |
1 |
1 |
1 |
77 |
0 |
1 |
|
X - Not elsewhere classified |
4 |
12 |
15 |
8 |
1 |
6 |
15 |
6 |
14 |
0 |
0 |
17 |
|
Not Employed |
0 |
0 |
0 |
0 |
2 |
1 |
1 |
1 |
5 |
0 |
0 |
89 |
Notes: The data points that are shown use (unadjusted) sampling weights. See section 2 for more details. They correspond to the simple average of quarterly transition probabilities in 2011-19. Each cell shows the transitions from one occupation in one quarter to the same or another occupation in the next quarter. All rows and columns add up to 100 per cent; any difference is due to rounding.
Decompositions
The labour flow approach is based on the intuition that labour markets are not static but dynamic. Changes in the share of individuals in any given labour market state (such as unemployed, employed in a certain sector
This section implements a decomposition for the change in the rate of formal employment between 2013 and 2018 as an example.10 The decomposition could be instead performed on the change of any other employment category share. However, a decomposition of changes in the rate of formal employment might be a particular interesting example, as the formality rate has seen a continous upward trend, with an increase from 20.4 to 28.7 per cent, that is, an 8.3 percentage point increase, from the third quarter of 2013 to the third quarter of 2018.
Let
Then, the total formality rate in period t, , can be obtained by using the weighted average of each group’s formality rate:
|
|
(5) |
The change in the formality rate between time 0 and 1 can be written as:
|
|
(6) |
One can re-write this equation as a function of changes in and :
|
|
(7) |
The first component of equation (7), part A, is what is typically referred to as the “coefficient effect” in the decomposition analysis. It isolates the change in the overall formality rate due to changes in the formality rate of each group assuming that there is no change in the participation rate for each group.
The second component of equation (7), part B, is the “composition effect” in the decomposition analysis. This component isolates the change in formality rate that would have occurred due to changes in participation rates across groups only, with no changes in within-group formality rates.
The approach follows closely Maurizio and Vásquez (2019) who decompose the change in formality rates in five countries (Argentina, Brazil, Ecuador, Paraguay, and Peru), except for two important differences. First, the “composition effect” is measured through in equation (7), as opposed to which is used in Maurizio and Vásquez (2019). While there is conceptually no difference between the two approaches, given the assumption that within-group formality rates are assumed unchanged () when isolating the “composition effect”, the advantage of this section’s approach is that it ensures that the “coefficient effect” and the “composition effect” add up exactly to the overall change in the formality rate. Second, the decomposition presented in this section allows for flexible interaction across gender, age and educational attainment categories insted of using a unidimensional decomposition.
Using equation (7), the increase in the formality rate by 8.3 percentage points between the third quarter of 2013 and the third quarter of 2018, is decomposed into the “coefficient effect” and the “composition effect” – overall and for different gender-age-education-specific groups. The first row in Table 5 shows the main result of the decomposition analysis: approximately three-fourths of the increase (6.3 out of the 8.3 percentage point increase) can be attributed to the “coefficient effect,” that is, to the increase in formalization rates within gender-age-education-specific groups. The remainder is due to a change in the composition of the workforce. This result is not too surprising given the short time-interval considered in the analysis: compositional shifts are expected to take longer to occur in the absence of major shocks or policy reforms. However, it is important to note that most of the “composition effect” is driven by increases in the share of educated women in the workforce.11 This group of workers has a relatively high formality rate, and at the same time increased in size between 2013 and 2018. Consistent with Figure 3, changes in the formalization rate for men and women with basic and intermediate education drive most of the “coefficient effect.”
Table 5. Decomposition analysis: Share of employment in formal jobs, 2013 Q3 - 2018 Q3
|
Formality rate |
Participation rate |
Change in formality rate (percentage points) |
Change in participation rate (percentage points) |
Coefficient effect |
Composition effect |
|||
|---|---|---|---|---|---|---|---|---|
|
2013Q3 |
2018Q3 |
2013Q3 |
2018Q3 |
|||||
|
|
20.4 |
28.7 |
100.0 |
100.0 |
8.3 |
0.0 |
6.33 |
1.96 |
|
|
||||||||
|
|
||||||||
|
Less than basic |
2.1 |
6.1 |
0.5 |
0.3 |
3.9 |
-0.2 |
0.02 |
-0.01 |
|
Basic |
5.8 |
13.1 |
4.9 |
3.9 |
7.3 |
-1.0 |
0.36 |
-1.30 |
|
Intermediate |
20.9 |
31.7 |
2.1 |
1.7 |
10.8 |
-0.4 |
0.23 |
-1.30 |
|
Advanced |
51.9 |
60.9 |
0.4 |
0.4 |
9.0 |
0.0 |
0.04 |
0.00 |
|
|
||||||||
|
Less than basic |
3.5 |
5.5 |
1.3 |
0.8 |
1.9 |
-0.4 |
0.02 |
-0.02 |
|
Basic |
10.1 |
18.8 |
5.5 |
5.5 |
8.6 |
-0.1 |
0.48 |
-0.01 |
|
Intermediate |
37.2 |
44.7 |
3.6 |
3.6 |
7.5 |
0.0 |
0.27 |
-0.01 |
|
Advanced |
80.1 |
79.7 |
1.8 |
2.4 |
-0.4 |
0.6 |
-0.01 |
0.48 |
|
|
||||||||
|
Less than basic |
3.1 |
5.7 |
1.8 |
1.7 |
2.7 |
-0.1 |
0.05 |
-0.01 |
|
Basic |
10.6 |
17.6 |
6.9 |
6.8 |
7.1 |
-0.1 |
0.48 |
-0.02 |
|
Intermediate |
39.6 |
49.9 |
2.5 |
2.3 |
10.3 |
-0.2 |
0.26 |
-1.20 |
|
Advanced |
90.7 |
88.4 |
1.2 |
1.9 |
-2.3 |
0.7 |
-0.03 |
0.63 |
|
|
||||||||
|
Less than basic |
2.3 |
4.8 |
1.5 |
1.7 |
2.5 |
0.2 |
0.04 |
0.01 |
|
Basic |
7.7 |
13.3 |
6.3 |
7.1 |
5.6 |
0.8 |
0.35 |
0.10 |
|
Intermediate |
37.3 |
38.1 |
2.5 |
2.2 |
0.8 |
-0.3 |
0.02 |
-0.11 |
|
Advanced |
89.4 |
87.9 |
0.9 |
1.0 |
-1.6 |
0.1 |
-0.01 |
0.07 |
|
|
||||||||
|
Less than basic |
1.6 |
2.6 |
1.0 |
1.0 |
1.0 |
0.1 |
0.01 |
0.00 |
|
Basic |
5.5 |
9.1 |
3.3 |
4.2 |
3.6 |
0.9 |
0.12 |
0.08 |
|
Intermediate |
23.2 |
29.5 |
1.1 |
1.2 |
6.3 |
0.1 |
0.07 |
0.02 |
|
Advanced |
67.3 |
70.2 |
0.4 |
0.5 |
2.9 |
0.1 |
0.01 |
0.05 |
|
|
||||||||
|
Less than basic |
1.6 |
1.0 |
0.6 |
0.5 |
-0.6 |
-0.1 |
0.00 |
0.00 |
|
Basic |
3.2 |
4.9 |
0.9 |
1.2 |
1.8 |
0.3 |
0.02 |
0.01 |
|
Intermediate |
9.3 |
10.8 |
0.3 |
0.3 |
1.5 |
0.0 |
0.00 |
0.00 |
|
Advanced |
11.1 |
20.4 |
0.1 |
0.1 |
9.3 |
0.0 |
0.01 |
0.00 |
|
|
||||||||
|
Less than basic |
3.9 |
3.4 |
0.4 |
0.3 |
-0.5 |
-0.1 |
0.00 |
0.00 |
|
Basic |
14.4 |
23.2 |
3.5 |
2.7 |
8.9 |
-0.8 |
0.31 |
-0.18 |
|
Intermediate |
31.6 |
45.6 |
1.9 |
1.8 |
14.1 |
-0.1 |
0.26 |
-0.03 |
|
Advanced |
59.0 |
61.1 |
0.7 |
0.8 |
2.2 |
0.2 |
0.01 |
0.10 |
|
|
||||||||
|
Less than basic |
5.2 |
8.0 |
1.4 |
0.8 |
2.8 |
-0.7 |
0.04 |
-0.05 |
|
Basic |
18.8 |
33.5 |
5.7 |
4.5 |
14.7 |
-1.2 |
0.84 |
-0.40 |
|
Intermediate |
47.1 |
52.3 |
2.6 |
2.9 |
5.2 |
0.3 |
0.14 |
0.17 |
|
Advanced |
88.0 |
84.4 |
2.0 |
2.8 |
-3.7 |
0.8 |
-0.07 |
0.64 |
|
|
||||||||
|
Less than basic |
4.0 |
9.3 |
2.0 |
1.9 |
5.3 |
-0.2 |
0.11 |
-0.01 |
|
Basic |
10.7 |
24.5 |
7.3 |
7.0 |
13.9 |
-0.3 |
1.01 |
-0.07 |
|
Intermediate |
38.8 |
51.4 |
1.7 |
1.6 |
12.6 |
0.0 |
0.21 |
-0.02 |
|
Advanced |
92.5 |
92.7 |
1.1 |
1.8 |
0.2 |
0.8 |
0.00 |
0.70 |
|
|
||||||||
|
Less than basic |
3.7 |
4.4 |
2.1 |
1.9 |
0.8 |
-0.3 |
0.02 |
-0.01 |
|
Basic |
6.9 |
13.2 |
6.5 |
6.6 |
6.4 |
0.2 |
0.41 |
0.02 |
|
Intermediate |
35.3 |
38.1 |
1.5 |
1.6 |
2.8 |
0.0 |
0.04 |
0.01 |
|
Advanced |
90.4 |
92.5 |
0.7 |
0.8 |
2.2 |
0.1 |
0.01 |
0.14 |
|
|
||||||||
|
Less than basic |
2.5 |
3.7 |
1.7 |
1.4 |
1.2 |
-0.2 |
0.02 |
-0.01 |
|
Basic |
3.2 |
6.3 |
3.1 |
3.7 |
3.1 |
0.6 |
0.10 |
0.04 |
|
Intermediate |
14.8 |
21.5 |
0.5 |
0.6 |
6.7 |
0.1 |
0.04 |
0.01 |
|
Advanced |
35.9 |
33.7 |
0.1 |
0.2 |
-2.2 |
0.0 |
0.00 |
0.01 |
|
|
||||||||
|
Less than basic |
1.5 |
1.9 |
1.1 |
0.8 |
0.3 |
-0.3 |
0.00 |
-0.01 |
|
Basic |
1.3 |
3.4 |
0.8 |
1.0 |
2.0 |
0.2 |
0.02 |
0.01 |
|
Intermediate |
8.2 |
9.7 |
0.1 |
0.2 |
1.5 |
0.1 |
0.00 |
0.01 |
|
Advanced |
26.3 |
25.8 |
0.0 |
0.0 |
-0.5 |
0.0 |
0.00 |
0.00 |
Note: The formality rate refers to the share of formal employment in total employment. The participation rate refers to the share of workers with a certain sex, age and educational attainment in total employment.
Conclusion
This paper shows how labour force surveys, which follow a rotating panel design, can be used to extract information on labour market transitions. By highlighting the particular case of Viet Nam as an example, the paper shows that the tracking of households and their members over time can provide information on transitions along several dimensions. This includes transitions between employment, unemployment and inactivity, between formality and informality, between economic sectors, as well as between occupations. The paper relies on well-established methodologies from the literature and applies them to the particular case of Viet Nam. The applied methodologies provide the option to correct for attrition bias.
Measuring labour market transitions, or flows of workers, provides complementary information on labour market dynamics. For a comprehensive labour market analysis, aimed to provide inputs and information for evidence-based policy making, it is key to include such information. For example, an increase of formal employment could largely be driven by low exit rates from formal employment. It could, however, be also driven by high entry rates into formal employment, from informal employment or inactivity. For policy makers that wish to boost formal employment further, respective policy implications are very different.
Efforts to measure labour market transitions, or worker flows, are not new. The initial literature very much focused on developed economies and on flows into and out of unemployment. Only more recently, the literature expanded to cover also developing countries and different types of transitions, such as transitions into and out of formality. However, there are countries in which information on labour market transitions could be generated, but is not.
The number of labour market transitions that workers go through during their working lives, is expected to increase (ILO, 2019). Policy discussions around the future of work are centred around the question how to support people through these transitions. In order to build a human-centred future and “build back better” from the COVID-19 pandemic, it is key for policy makers and social partners to find good policy solutions.
As a first step, however, it is important to look at the data and learn more about these transitions. What is driving overall changes in labour market patterns? Which type of transitions are increasing over time? Which transitions play a less important role? Which workers manage to transit to more decent jobs? Which workers are stuck in less decent jobs? Which workers are stuck in informality? Which workers manage to get out of unemployment? Answers to these questions and other information derived from an analysis of labour market transitions can help inform the design of policies in support of transitions. While not aiming to be comprehensive, this paper provided a snapshot of what type of data on labour market transitions can be produced on the basis of labour force surveys that have a panel dimension. Some National Statistical Offices might wish to extend their labour market information and analysis in this direction.
References
Abowd, John M., and Arnold Zellner. 1985. “Estimating Gross Labor-Force Flows.”
Assaad, Ragui, Carline Krafft, and Shaimaa Yassin. 2018. “Comparing Retrospective and Panel Data Collection Methods to Assess Labor Market Dynamics.”
Barnichon, Regis, and Paula Garda. 2016. “Forecasting Unemployment Across Countries: The Ins and Outs.”
Barnichon, Regis, and Christopher J. Nekarda. 2012. “The Ins and Outs of Forecasting Unemployment: Using Labour Force Flows to Forecast the Labour Market.”
Bleakley, Hoyt, Anne E. Ferris, and Jeffrey C. Fuhrer. 1999. "New Data on Worker Flows During Business Cycles."
Bosch, Mariano, and William Maloney. 2007. “Gross Worker Flows in the Presence of Informal Labor Markets: The Mexican Experience 1987-2002
Clark, Kim B., and Lawrence H. Summers. 1979. “Labor Market Dynamics and Unemployment: A Reconsideration.”
Darby, Michael R., John Haltiwanger, and Mark Plant. 1985. “Unemployment Rate Dynamics and Persistent Unemployment Under Rational Expectations.”
___. 1986. “The Ins and Outs of Unemployment: The Ins Win
Donovan, Kevin, Will Jianyu Lu, and Todd Schoellman. 2020. “Labor Market Dynamics and Development“, Staff Report 596, Federal Reserve Bank of Minneapolis.
Elsby, Michael W. L., Bart Hobijn, and Ayşegül Şahin. 2015. “On the Importance of the Participation Margin for Labor Market Fluctuations.”
Fallick, Bruce, and Charles A. Fleischman. 2001. “The Importance of Employer-to-Employer Flows in the U.S. Labor Market
___. 2004. “Employer-to-Employer Flows in the U.S. Labor Market: The Complete Picture of Gross Worker Flows
Feldstein, Martin. 1973. “Lowering the Permanent Rate of Unemployment
Fujita, Shigeru, and Garey Ramey. 2009. “The Cyclicality of Separation and Job Finding Rates.”
Gomes, Pedro. 2015. “The Importance of Frequency in Estimating Labour Market Transition Rates.”
Gutierrez, Italo A., Krishna B. Kumar, Minhaj Mahmud, Farzana Munshi, and Shanthi Nataraj. 2019. “Transitions Between Informal and Formal Employment: Results from a Worker Survey in Bangladesh.”
Hall, Robert E. 1972. “Turnover in the Labor Force.”
___. 2005. “Employment Efficiency and Sticky Wages: Evidence from Flows in the Labor Market.”
Herrera, Javier, and Gerardo David Rosas Shady. 2005. “Labor Market Transitions in Peru”, Ibero America Institute for Economic Research (IAI) Discussion Papers No. 109.
International Labour Organization (ILO). 2013.
___. 2018.
___. 2019.
Maurizio, Roxana, and Gustavo Vásquez. 2019. “Formal Salaried Employment Generation and Transition to Formality in Developing Countries the Case of Latin America
Nakamura, Alice, Emi Nakamura, Kyle Phong, and Jón Steinsson. 2019. “New Evidence on the Cyclicality of Employer-to-Employer Flows from Canada.”
___. 2020. “Worker Reallocation Over the Business Cycle: Evidence from Canada”, Working Paper, University of California, Berkeley.
Poterba, James M., and Lawrence H. Summers. 1986. “Reporting Errors and Labor Market Dynamics.”
Shimer, Robert 2012. “Reassessing the Ins and Outs of Unemployment.”
Tansel, Aysit, and Zeynel Abidin Ozdemir. 2019. “Transitions Across Labor Market States Including Formal/Informal Division in Egypt.”
Ziliak, James P., and Thomas J. Kniesner. 1998. “The Importance of Sample Attrition in Life Cycle Labor Supply Estimation.”
Acknowledgements
The authors would like to express their gratitude to the General Statistics Office of Viet Nam for their support of this research and for sharing the labour force survey data with the ILO on regular basis. The authors would also like to thank Hana Braitsch and Whitney Wong for excellent research assistance. Moreover, the paper benefitted from comments from Sara Elder and Phu Huynh. The authors are also grateful for the comments from participants of an expert meeting on informality in Viet Nam, held virtually in February 2021, and from participants of a labour market analysis training, held virtually in April 2021, where this working paper or elements thereof were presented.
The production of this paper was coordinated by the Regional Economic and Social Analysis Unit of the ILO Regional Office for Asia and the Pacific in Bangkok, in collaboration with the Macroeconomic Policy Unit of the ILO Research Department in Geneva, and the authors are grateful to the respective Heads of Units, Sara Elder and Ekkehard Ernst, for their support. The authors are also grateful for support provided by Valentina Barcucci, Nguyen Thi Le Van and Nguyen Van Giang from the ILO Office in Hanoi, by Yves Perardel and Quentin Mathys from the ILO Statistics Department, and by Tite Habiyakare from the ILO Regional Office for Asia and the Pacific.

