


Trade agreements and decent work in Mexico: the case of the automotive and textile industries
Abstract
The study examines the effects of trade liberalization on employment and the labour market in Mexico’s manufacturing industry. The analysis places special emphasis on assessing the extent to which the industry’s distinct trade performance is accompanied by an improvement in labour conditions with the objective of ensuring decent work. For this purpose, the study applies the framework of decent work indicators developed by the International Labour Organization (ILO), in combination with input–output analysis, to explore selected links between international trade and certain indicators of decent work in two industries of Mexico’s manufacturing sector: automotive and textile. We chose these two industries because of the key differences in their organizational structures, their roles in global value chains (GVC) and their dynamism in recent decades. With the policy shift towards trade liberalization in recent decades, the automotive industry has come to be regarded as the jewel of Mexico’s export market. The textile industry, in contrast, suffered a severe shock as trade liberalization brought about increased competition in Mexico’s domestic market, despite the industry increasing its participation in GVCs.
A key contribution of the study was to construct a set of relevant time series indicators of decent work for these two industrial activities in Mexico, based on ILO guidelines and official data. Taking into account this set of indicators, as well as Mexico’s labour market regulatory reforms and their links to trade agreements, including the Agreement between the United States of America, the United Mexican States and Canada (USMCA), the study finds important differences in these two industries’ advance towards decent work, which can be partly explained by their distinct performances in international trade. Based on these results, the study offers some policy recommendations to help achieve a more robust pace of progress towards decent work.
Introduction
For decades, Mexico has been the poster child for market-friendly structural reforms. These reforms implied, in particular, persistent commitment to trade liberalization and involvement in subregional free trade agreements. Much has been written about the mixed effects that this package of reforms has had on the country’s economic stabilization and growth trajectories. On the one hand, there is consensus that its impact on inflation management and fiscal performance – which is strictly measured in terms of the budget balance as a proportion of gross domestic product (GDP) – has been stellar. On the other hand, despite the dynamism of manufacturing exports, the economy remains stuck on a path of slow growth and insufficient job creation.
Although a few industries – most notably the automotive industry – have achieved spectacular penetration into world markets, they have been unable to pull the rest of the economy onto a trajectory of high and sustained expansion. Indeed, the manufacturing sector’s overall performance in terms of internal (backward and forward) linkages has been disappointing. Between 1960 and 1982, Mexico’s real GDP expanded at an average annual rate of 5.4 per cent and was the engine of growth for the national economy. Thereafter, however, it began to lose such capacity and momentum; between 1985 and 2012, real GDP grew by an average of less than 3 per cent per year. Since 2012, GDP growth has slowed to an annual average of 2 per cent (see Cordera 2012; Sánchez Juárez, Loría and Moreno-Brid 2018). Such poor performance, culminating in an absolute contraction in 2019–20, translated into insufficient job creation in the manufacturing industry, which, in turn, has contributed to the enlargement of the informal sector and a more precarious labour market (Samaniego, 2008; Banxico, 2020b).
The results mentioned above are well known. It is less clear, however, what the effects of trade liberalization on Mexico’s labour market have been when one considers aspects that go beyond the number of persons in employment or the evolution of real wages. In an effort to develop a deeper understanding of labour market conditions and their relation to trade, the International Labour Organization (ILO) built a toolkit of decent work indicators to capture multidimensional aspects of working conditions and labour rights (ILO 2008 and 2013a), which formed a pioneering contribution to debate on social and economic development issues. In September 2015, the United Nations General Assembly approved the 2030 Agenda for Sustainable Development, containing 17 Sustainable Development Goals (SDGs), which represented a “call to action to end poverty, protect the planet and ensure that all people enjoy peace and prosperity by 2030” (UNDP, n.d.). The Agenda states that, in order for people to benefit from progress, employment must guarantee social protection, job security and fair income for workers, promote social integration and offer the same opportunities for men and women. These targets form a substantial component of Goal 8 on decent work and economic growth.
It is safe to say that the whole concept of decent work in respect to traditional indicators of employment and labour relations led to a redefinition of the ILO vision at the end of the twentieth century.1 Since then, methodological discussions on how to better measure and capture the various aspects of decent work have gained more and more relevance. In fact, this was a central topic of discussion at the 17th and 18th International Conferences of Labour Statisticians, leading to a resolution containing a commitment to carry out pilot studies on decent work in a number of countries and to present a report on indicator measurement and monitoring at the next session of the Conference.
This study is rooted in that commitment. It applies the ILO framework of decent work indicators, in addition to an input–output analysis, in order to explore selected links between international trade and labour – more specifically, decent work – in the automotive and textile industries in Mexico. While both industries remain relevant to Mexico’s manufacturing sector (albeit not necessarily in the same ways), there are essential differences in their organizational and employment structures, their participation in foreign markets and their dynamics in global value chains (GVC). Even the development policies implemented in these two industries display major differences. The automotive industry has benefited from many special development programmes in Mexico. An already very important part of the national economy by the 1970s, the Mexican automotive industry has only grown in importance following the policy shift towards trade liberalization and is now considered the jewel of Mexico’s export market. The textile industry, meanwhile, suffered a severe shock as trade liberalization brought about increased competition in the domestic market. Nevertheless, to a certain extent it has responded to the export challenge and now participates in GVCs.
According to the Mexican National Institute of Statistics and Geography (INEGI) (2018), between 2003 and 2018 global manufacturing production in Mexico grew by 82 per cent in real terms.2 This export boom actually started years earlier, with roots that lie partially in the industrialization policies of the 1970s and partially in the trade liberalization process launched in the mid-1980s. During this globalization of Mexico’s manufacturing sector, the automotive and textile industries have not followed identical paths. Foreign direct investment was an essential factor in boosting the role played by the automotive industry in GVCs. According to Ruiz Durán (2013), among all Latin American countries, Mexico has best positioned itself in this industry. From 2003 to 2018, the share of Mexico’s global production relative to national total production rose from 11 per cent to 34 per cent, and its gross value added rose from 9 per cent to 21 per cent. The textile industry presents a vastly different picture over this same period, however, with its share of global production actually decreasing from the already low figure of 4 per cent in 2003 to just 1 per cent in 2018. It experienced a similar decline in gross value added, which dropped from 3 per cent to 1 per cent. Indeed, the fortunes of these two industries in terms of their commercial insertion could not be more different.
In this study, we examine the extent to which the different evolutions of these two industries regarding foreign trade matches the evolution of employment and working conditions. One of the key methodological objectives was to construct a set of relevant time series indicators of decent work for these two industries in Mexico, based on ILO guidelines and using official data.3 Armed with this set of indicators, the study explores the effects of trade liberalization on decent work in both industries in Mexico. Such an assessment is subject to many caveats, however; it should be remembered that trade liberalization was only one of the many reforms brought about by the radical shift in the nation’s development agenda away from import substitution and state-led industrialization that occurred in the mid-1980s. In addition, such liberalization gained greater momentum in 1994 with the signing of the North American Free Trade Agreement (NAFTA), a pioneering initiative that created an area of managed – if not exactly free – trade between Mexico, Canada and the United States of America. NAFTA was replaced in July 2020 by the Agreement between the United States of America, the United Mexican States and Canada (USMCA).
The present study is organized as follows: following this introduction, the first section gives a synthetic overview of Mexico’s trade, industrial and labour policies over the past three decades, in which Mexico shifted from import substitution industrialization to trade liberalization and adopted neoliberal policies. Attention is given to labour market regulatory reforms and their links to trade agreements, including the USMCA. The second section focuses on Mexico’s participation in the GVC trade, examining value added indicators in the export market and job creation rates in the automotive and textile industries, the results for which are derived primarily through an input–output analysis. The third section analyses the evolution of decent work in Mexico based on the set of indicators constructed explicitly for this study, covering the period from 1996 to the most recent year for which reliable information is available (either 2016 or 2019). The last section presents the conclusions and some policy recommendations.
Mexico: Trade, industrial and labour policies since the 1980s
As mentioned in the introduction, in the early 1980s, in the aftermath of an acute crisis in the balance of payments and fiscal spending, Mexico implemented a major shift in its economic strategy in favour of market reform. Abandoning the traditional state-oriented development agenda, domestic markets were unilaterally opened to foreign competition. The official discourse came to be that macro-stabilization – understood as fiscal discipline and low inflation – in the context of open markets undistorted by public sector intervention would ensure an efficient allocation of resources and would generate high, persistent economic expansion, using manufacturing exports as the engine of growth. The fundamental assumption was that, with the new market-oriented agenda, private investment would soar, helping to modernize Mexico’s productive structure and bring about a period of strong economic expansion led by exports.
With the embrace of neo-liberal reforms, industrial policy came to be seen as a relic of over-meddling of the State in economic affairs. In the toolkit of the development agenda, industrial policy was soon replaced by trade policy. Most public sector interventions and programmes to promote industrialization were cancelled, including a phase-out of active policies designed to stimulate manufacturing production or exports. Industrial policy survived at the national level, but it was strictly circumscribed to initiatives aimed at correcting market failures, cutting red tape and “levelling the field” for small- and medium-sized enterprises. Microfinancing became the main instrument of industrial policy. With the exception of the
Market reforms have guided Mexico’s economic agenda for decades. “The best industrial policy is no industrial policy” became the motto of the Government’s approach to structural transformation (Moreno-Brid and Ros 2009). Since 1982, all subsequent administrations, regardless of their political affiliation, have ratified and even deepened these reforms. Enrique Peña Nieto, who served as President of Mexico from 2012 to 2018, acknowledged industrial policy as a legitimate tool during his election campaign and recognized the need to grant temporary protection to infant industries in selected areas. Once in office, however, he failed to follow through on his promises, and his 2012 national development plan (known as the
In this matter, the landscape under the current president, Andrés Manuel López Obrador (who will remain in office until 2024), remains substantially unaltered. His administration currently has no active policies to foster investment, innovation, technology or value-added generation in manufacturing. Industrial policy is constrained by trade liberalization commitments; the preservation of NAFTA – now in its revamped version as the USMCA – has been a key priority, despite the stricter conditions that it imposes on Mexico’s labour market regulations and access to trade (Moreno-Brid 2020). As of December 2020, the main economic policies to promote structural transformation are competition and anti-trust, deregulation, trade liberalization and business facilitation. Moreover, no initiatives to create new competitive advantages have yet been put forward at federal level.
During this long process of reform, what happened to labour? Between the 1940s and the 1970s, with the Mexican State consolidated as a legitimate actor pushing for economic and social development, vast contingents of workers found employment and some sort of social protection in a rapidly expanding economy driven by industrialization (Bensusán 2020; Moreno-Brid and Ros 2009). However, the long-term economic slowdown that started in the 1980s brought about increasing informality and a more precarious labour market, as job creation did not keep pace with the expansion of the labour force. The shift in macroeconomic policy priorities towards efforts to contain inflation led to a phase of wage repression. The minimum wage policy led to a deterioration in real wages, as the nominal adjustments did not fully compensate for the rise in inflation. Labour policy became an implicit instrument of macroeconomic stabilization, rather than a tool to promote decent work. Low wages, linked to a low-skilled labour force, were seen as Mexico’s comparative advantage in world manufacturing. Not surprisingly, the minimum wage was used as an anchor to bring down inflation. Workers’ purchasing power dropped to levels far below those needed to cover the basic basket of goods and services. During this process, independent trade unions came to be seen more as a hindrance to investment than a partner in the protection of labour rights, structural transformation and sustained long-term growth. Indeed, with the exception of state-owned enterprises with considerable political power, trade unions were unable able to grant any significant benefits to their members above the norm. It must be stressed that, between the 1920s and the 1980s, and with very few exceptions, trade unions served more as an instrument of successive authoritarian regimes than as a vehicle to protect workers’ rights (Bensusán and Middlebrook 2012a and 2013; González Guerra and Gutiérrez Castro 2010; Blanke 2007; Bensusán and Alcalde 2013; Moreno-Brid and Ros 2009; Cárdenas Sánchez 2015). Following the neoliberal reforms, Mexico’s labour laws became increasingly biased against workers, to a scandalous extent.7 Their departure from standard – not to mention best – practices was accompanied by abhorrent measures that prevented the creation of independent unions and left individual workers with practically no legal defence against their employers.
As the apex of Mexico’s trade liberalization and reform process, aimed at creating a region of almost free trade and capital flow movement in North America, NAFTA did seem to have the potential to change the situation, if only as a by-product. When it was brought into operation in 1995, virtually all restrictions on subregional trade were lifted. In a few sectors, such as agriculture, finance, vehicles and auto parts, trade protection measures were phased out gradually over a 15-year period. A small number of industries, including oil extraction, remained protected for a much longer period, however. NAFTA offered the hope – if not the promise – that it would stimulate export-led growth and create more and better jobs in Mexico. Such hopes were based on two assumptions. The first was that the virtually unrestricted access to the US market provided by NAFTA would stimulate economies of scale in Mexico and trigger a boom in external demand and employment. Job creation was expected to increase in Mexico as the country specialized in labour-intensive manufacturing and as its partners specialized in capital-intensive areas. The second assumption was that, by locking in its market-friendly approach and its unique position as a special trade partner for the United States and Canada, private investment would soar in Mexico, helping to modernize its factories and equipment, augment its exports and boost its economic growth potential.
NAFTA was formally expanded to include two parallel, complementary agreements: one on labour, the other on environmental considerations. The North American Agreement on Labour Cooperation (NAALC) was introduced in 1993 as a formal component.8 Two of its priorities were “to create new employment opportunities and improve working conditions and living standards in their respective territories, and protect, enhance and enforce basic workers’ rights.” This parallel agreement, pushed by the Clinton administration, was designed to appease US critics who feared that NAFTA would detonate a mass relocation of manufacturing plants to Mexico, attracted by its low wages and archaic labour regulations.9 As Sanders, Baderian and DiPalma (2017) document: “[Regarding NAFTA] there was strong resistance from the trade union federation AFL-CIO, as well as from several members of Congress. They were concerned that US jobs would be lost to the Mexican labor force because of the lower salaries paid in Mexico, the control of trade unions by the Mexican government, and the prevalence of ‘protection labor contracts’.”
A key motivation behind the introduction of a parallel agreement on labour was the view from some sectors in the United States that Mexico was participating in a sort of social dumping of exports via meagre wages. The US and Canadian negotiating team wanted to impose on Mexico the obligation to modify its legislation in that regard. However, as the three partners agreed at that time that, on paper, Mexico’s labour laws were stricter than those in the United States with regard to collective bargaining and freedom of association, NAALC was adopted without any such conditions (Puyana 2018). NAALC included the following guiding principles: (a) freedom of association and protection of the right to organize; (b) the right to bargain collectively; (c) the right to strike; (d) prohibition of forced labour; (e) labour protections for children and young persons; (f) minimum employment standards; (g) elimination of employment discrimination; (h) equal pay for women and men; (i) prevention of occupational injuries and illnesses; (j) compensation in cases of occupational injury or illness; and (k) protection of migrant workers. To a certain extent, all 11 principles were already covered in the three partners’ labour regulations. With NAALC embodying the spirit of cooperation rather than confrontation, the option of launching a legal dispute that could lead to trade sanctions against one signatory by the others was provided only as a last resort in the event of non-enforcement of national labour laws.
To what extent was NAFTA instrumental in bringing about the modernization of labour regulations, the increase in wages and the improvement in working conditions in Mexico? Not much, at least formally. Indeed, since its launch, Mexico’s legal and regulatory framework for the labour market has undergone no significant alterations (Bensusán 2020). The first significant reform, enacted in 2012, was the lynchpin of the
The 2012 revision of labour regulations was the first time that the notion of decent work was explicitly – and prominently – introduced into Mexico’s legal and regulatory framework. Decent work and labour productivity were subsequently set as the two key priorities for the country’s economic growth strategy and the second wave of market reforms. The reform explicitly aimed to eliminate a whole swathe of restrictions on hiring and firing, as well as creating a formal regulatory framework for outsourcing and for hiring temporary workers. The official view was that these measures would make the labour market more flexible and stimulate formal employment (Alcalde 2013). No changes were made to the regulation of trade unions.
Evaluating the results of the 2012 labour reform is rather complicated, as it was implemented at the same time as ten or more other in-depth reforms.10 Furthermore, another approach to labour regulations soon began to take shape in Mexico, which was much more in line with the modern and democratic view held by the ILO regarding the roles and responsibilities of the state, the entrepreneur sector and organized labour. Between 2015 and 2016, a shift in minimum wage policy began to take place which finally began to reverse the long-term decline in wages. While the increasing internal political pressure, mounting social protests and growing disenchantment – which ultimately led to a massive electoral turnout in favour of López Obrador – are the main factors that explain this change in labour policy, we must also acknowledge the pressure placed on Mexico to change its labour laws during its negotiations to join the Comprehensive and Progressive Agreement for Trans-Pacific Partnership (CPTPP) and later the USMCA. During the CPTPP negotiations, it was made clear to Mexico that it would have to change its framework of labour law and regulation. The CPTPP explicitly stated that each party would adopt and maintain in its labour regulations an essential number of rights, including freedom of association and the effective recognition of the right to collective bargaining (see Annex 1). The Mexican Government accorded such high priority to attaining CPTPP membership that, on 24 February 2017, a significant labour reform was swiftly passed through Congress to modify Article 123 of the Constitution in order to bring Mexican labour law into line with progressive ILO views on all matters related to trade unions.
As mentioned above, three decades of market reforms, combined with slow economic growth, led to a deterioration in the labour market and brought about a persistent and substantial reduction in the strength and bargaining power of trade unions, making them virtually irrelevant in the vast majority of industries. Furthermore, Mexico’s employment structure poses major obstacles to the development of strong labour unions: 60 per cent of total employment is informal with no access to social security, and nearly half of all wage earners are classified as working poor, meaning that they receive an income below the amount necessary to cover the basic basket of goods. The expansion of outsourcing practices over the last ten years has cause the situation to further worsen.
The pressure placed by the US administration on Mexico during the renegotiation of NAFTA with regard to labour laws and regulation was far tougher than that experienced during the CPTPP negotiations. One reason for this was the firm belief held by the US administration, as well as several economic and political actors in the United States, including workers’ unions, that Mexico’s success in transforming its auto industry into a key player on the world markets was due to its use of “social dumping” practices involving low wages and trade union repression. They argued that NAALC had failed to respond effectively to claims raised against Mexico regarding violations of workers’ collective rights and freedom of association. In the usual parlance, the consensus was that the NAALC had no bite. An additional reason for its “failure” was the lack of strong political actors in the United States and Canada with the will and capacity to monitor and denounce Mexico’s non-compliance with its labour regulations (Bensusán 2019 and 2020).
In any case, there is consensus that NAFTA has been instrumental in Mexico’s huge success in attracting foreign direct investment to its manufacturing industry over the past two decades or more. A long-term look at the evolution of capital formation and economic activity is helpful in assessing the transformation of the Mexican economy during this period. The first striking point is that the contribution of such investment to economic growth actually declined once the market reforms (NAFTA included) were launched. Having contributed one percentage point to the total annual average rate of GDP growth in the 1960s and 1970s, its contribution dropped to seven-tenths of a percentage point in 1995–2008 and in 2010–15 (Moreno-Brid et al. 2016). In these periods, the contribution of manufacturing to GDP actually declined by nearly two percentage points (to 17.2 per cent in 2014), despite the fact that its share in the total stock of fixed capital increased by nearly four percentage points (reaching 19 per cent in 2014).
How did the textile and the auto industry fare during the structural transformation that the Mexican economy experienced from 1990 onwards? To begin to answer this question, Moreno-Brid et al. (2016) calculated the average annual rates of GDP growth and fixed capital stock growth in real terms for each manufacturing industry (including the textile and automotive industries) between 1990 and 2014 and compared them with the corresponding totals for the whole manufacturing sector. The figures showed a stark contrast. In this period, in manufacturing as a whole, fixed capital stock expanded at an annual average rate of 4.4 per cent, and its contribution to GDP grew at a rate of 2.5 per cent. The corresponding figures for the textile sector are disappointingly lower. Clothing and apparel (sector 315 of the North American Industry Classification System) registered an annual average contraction in fixed capital stock of -0.2 per cent and an annual average rate of GDP growth of just 1.8 per cent. The figures for other textile products (sector 314) are not much better, reaching 0.0 per cent for fixed capital stock growth and 1.4 per cent for GDP growth. Clearly, the textiles sector has lagged behind in terms of capital accumulation and output growth. The auto industry shows a different picture, however. Transport equipment (sector 336) was one of the most dynamic manufacturing industries, with an average annual rate of fixed capital stock growth of 6.7 per cent and of real GDP growth of 4.5 per cent. It is important to note that these figures cover capital accumulation from both foreign and domestic investors; massive investments by US, European and Asian carmakers and auto parts manufacturers strengthened Mexico’s role as an export platform for the US market.
It is safe to say that NAFTA did help to transform and modernize some parts of Mexico’s industrial structure. This transformation was accompanied by an even further polarization of Mexico’s industrial sector, however; while it created a few spectacular “winners” – among them the auto industry – it did not create enough of them to push the overall Mexican economy onto a path of rapid and sustained growth.
Recent and current Mexican administrations have all accorded top priority to efforts to reach an agreement on the renegotiation of NAFTA (subsequently renamed the USMCA) as demanded by the US Government. A crucial condition imposed during the negotiations was that the Mexican Congress must write into federal law the amendment of Article 123 of the Constitution that had been enacted in 2017. This condition was, in principle, in line with the new Mexican Government’s promise to carry out a labour reform to protect workers’ rights and strengthen their bargaining position vis-à-vis employers. On 1 May 2019, a mere six months after entering office, the Mexican Government issued the new Federal Labour Act in full accordance with the constitutional reform of 2017. This Act granted liberty of association and allowed the creation of independent trade unions, free from the influence or control of the government and employers. It eliminated numerous unnecessary requirements that had, for generations, blocked the surge in the number of independent labour organizations. It also ensured the election of union leaders via universal and confidential direct voting processes, and it provided that labour disputes must be resolved by the judiciary, rather than conciliation boards, on which employers had always been over-represented.
These changes have raised hopes that labour rights and collective action might start to be fully recognized and respected. In addition to the internal social and political pressures that will likely arise should this fail to happen, the USMCA also provide for a series of very rapid – and virtually automatic – sanction mechanisms to impose trade restrictions on Mexican exports in the event of violations of the Federal Labour Act, having established a first-of-its-kind rapid response mechanism that provides for monitoring and expedited enforcement of labour rights in Mexico at particular facilities while respecting sovereignty and due process.11 This mechanism “focuses on the denial of specific labour rights, as defined in the agreement, and establishes strong remedies that quickly penalize (and even prohibit) certain imports. A specific violation in Mexico can be alleged by outside parties by petition to the US Government” (King and Spalding Corporation 2020). The USMCA also imposes additional trade restrictions on Mexico’s auto industry, of which the most heavily discussed was its first-of-its-kind labour value content rule which requires that 40–45 per cent of auto content must be produced in a North American plant in a facility by workers making an average wage of at least US$16 per hour (USTR 2020 and n.d.). This wage is well above the Mexican average. It is too soon to predict, not to mention to assess, the impact of the USMCA and the new Federal Labour Act on the evolution of decent work in Mexico. In any case, the challenge for Mexico remains to identify how to stimulate the economy to enter a dynamic trajectory of high and sustainable long-term expansion that guarantees decent work for its population. Meeting this goal will require a policy mix that goes well beyond trade and labour tools to also contemplate, among other things, a fiscal reform and a modern industrial policy (Moreno-Brid 2020; Cordera and Provencio 2019).
Given the need to understand the relationship between international trade and the development of decent work, in this report we analyse the evolution of these issues with regard to two industries in Mexico: textile and automotive. We distinguish between production that is part of traditional trade (final goods and services) and that which forms part of GVCs. In the following section, we examine the job creation rates achieved by both types of production, in addition to their backward and forward linkages in terms of employment. In the subsequent section, we take a deeper look at the evolution of decent work in each of these two industries.
Mexico’s performance in global value chains: Exports and employment
2.1 The automotive and textile industries in Mexico
To understand the impact of international trade on economic activity and employment, it is essential to examine the evolution of GVCs, which refers to the cross-border movement of goods, investment, services, knowledge and individuals associated with an international production network (Amador and Cabral 2015). The study of GVCs allows for a better comprehension of the geographical dispersion of economic activities, the agents involved and the tasks performed in these processes by both developed and developing economies (Meyer-Stamer and Wältring 2007). Perhaps the most significant development in GVC analysis has been the availability of quantitative information that distinguishes between trade flows in value-added terms. Notably, the generation of global input–output matrices, when combined with Leontief’s (1936) inverse matrix, has made it possible to disaggregate export data and concepts that, in trade statistics, erroneously count the value of intermediate goods more than once.
By now, many investigations have documented how much of a country’s trade corresponds to production fragmentation or GVC production. Several authors have put forward methodologies for this analysis (Hummels, Ishii and Yi 2001; Johnson and Noguera 2012; Stehrer 2012; Koopman, Wang and Wei 2014; Arto et al. 2015). In this study, we follow the methodology developed by Wang, Wei and Zhu (2013), which includes a full decomposition of export data at bilateral and sector levels into four categories: domestic value-added (DVA); foreign value-added (FVA); value-added re-exported to home country; and pure double counting. DVA corresponds to the value generated in the country of analysis (in our case, Mexico) and can refer to final or intermediate goods further processed in destination countries. FVA, meanwhile, originates in a foreign country and is then “returned” to the country of analysis as imports of either intermediate or final goods. Following Koopman et al. (2011), who combine DVA and FVA, we use both categories to measure the degree to which countries participate in shared production. DVA measures the country’s participation as a “supplier” of value-added, whereas FVA captures the country’s position as a “user” of value-added incorporated from other countries. Both indicators are measured as a proportion of exports. We use these indicators to focus on two features: Mexico’s relevance in the global trade network for the two selected industries, and Mexico’s level of participation in this type of trade relative to its total exports.
To that end, we relied on the 2014 release of the World Input-Output Database (WIOD) (Timmer et al. 2015). This is a database of inter-regional input–output tables,12 which contains information on 40 countries13 and serves as a model for the rest of the world for the period between 1995 and 2011. The database comprises 35 sectors, following the International Standard Industrial Classification of All Economic Activities Revision 3 (ISIC Rev.3), of which 14 correspond to manufacturing. We concentrated on two industries (textiles and textile products, and transport equipment) and their performance across four years (1996, 2001, 2008 and 2011, this being the most recent year for which data are available).14 It should be noted that the data provided by WIOD are not further disaggregated.
In ISIC Rev.3, transport equipment covers other types of transport in addition to automobiles, such as ships and boats, railway and tramway locomotives, aircraft and spaceships. However, according to INEGI (2020), in Mexico the automotive industry represented, on average, 93 per cent of the GDP of the transport equipment sector throughout the years covered in the study. Moreover, according to data on firms that are mainly exporters, the value added in the automotive industry represented, on average, 98 per cent of the total value added in the transport equipment sector between 2003 and 2011 (INEGI 2018).
The decomposition approach used by Wang, Wei and Zhu identifies the bilateral flow of value-added between a pair of countries for each sector, which allows us to present this interchange as a global network of value-added. This type of analysis highlights the relationship among countries as well as the relative importance of individual countries with regard to the whole ensemble of participants. In the network graph, each country (or group of countries, as in the EU15 and EU13 (see footnote 17)) represents a node, and the domestic value-added exported from county to country () is captured by the line linking both countries. Thus, the resulting network is directed and weighted, because it incorporates the direction and intensity of commercial relationships between countries. We use the following filter: if of the total DVA in exports, then there is no link in the graph. The size of the nodes represents the weighted “outdegree”15 or the sum of DVA that the country exports to other countries. The colour shows the weighted “in-degree”16 or the sum of DVA received from other countries. Finally, the thickness of the line captures the magnitude of the DVA exchanged between the two countries. In Mexico’s case, the outgoing lines are purple, and the incoming lines are blue.
Figure 1.a shows the global network of DVA in textile exports for 1996. At that time, the EU15 group was the leading exporter and importer of DVA, mainly because of internal trade within the EU region, and China was the second significant exporter of DVA, trading with nearly all the economies included in the graph. The United States, meanwhile, was the leading importer of DVA. The picture changed drastically by 2011 (Figure 1.b), however, by which point China was the principal exporter within the network; its outgoing lines are considerably thicker than those for the other countries in the graph, and those directed towards the EU15 and the United States are particularly important. In 1996, Mexico exported DVA primarily to the USA and, to a lesser extent, to Canada, the EU and Brazil. Mexico also received DVA from the United States, as well as Taiwan Province of China, Canada, China, Australia, the Republic of Korea and the EU15 (in descending order of importance). Mexico’s position in the global network of DVA in textiles was concentrated in trade with the United States. By 2011, however, even its linkages with the United States had diminished in favour of trade with China.
China’s entry into the World Trade Organization in 2001, the termination of the Multifibre Arrangement in 2005 (thereby eliminating the associated quotas) and the long-running preparations undertaken by Asian countries – and especially China – with a view to liberalizing trade created the conditions for the impressive growth in global Chinese exports, in particular to the United States. In general terms, Mexico has been displaced by China as the main supplier to the United States since 2002. The competition between China and Latin American countries such as Mexico lies not only in the low cost of the labour force, but also in the ability to generate essential economies of scale, low-cost inputs (in many cases produced internally), increasing technological advances, financing and experience of full package processes, rather than their proximity to the markets or the ability to respond quickly to changes in demand and buyers (Cárdenas Castro and Dussel Peters 2007).
Figure 1. DVA in the global export network for textiles, 1996 and 2011
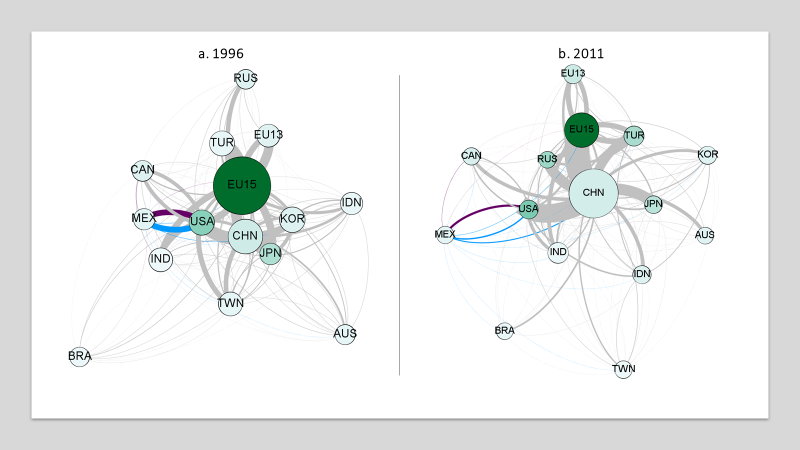
Note: For the country codes, see Annex 2.
Source: Own elaboration based on WIOD data.
Figure 2 shows the global network for DVA in transport equipment. Although the EU15, Japan and the United States were the most relevant actors in this network, Canada and Mexico also played a significant role. Particularly meaningful are the connections between Japan and the United States and between Canada and the United States, as shown by the thickness of the lines linking them. By 2011, it is noticeable that, unlike the textile network, these linkages diversified and more countries participated in the network, as shown by the thickness of the lines. In this sense, the graph reflects the spatial readjustments experienced in the automotive industry between the 1990s and 2010, when the presence of the former main actors declined, while Brazil, India, Mexico, the Republic of Korea and, most importantly, China increased their participation, with the latter ultimately becoming the leading global automobile producer. Nonetheless, companies based in Japan, the United States and the EU15 (such as Toyota, General Motors, Volkswagen, Ford and Hyundai) continue to dominate (Dussel Peters and Gallagher 2013).
Figure 2 reflects these trends. While the most important actors remained the same, the linkages between them became thinner, and those between other countries grew larger in comparison with their position in 1996. One such country is Mexico; all its connections are thicker by 2011, especially that with the United States. In the automotive industry, Mexico exports more DVA than it receives from other countries, mainly because of its exports to the United States. In fact, the automotive industry has the largest trade surplus in the Mexican manufacturing sector for the whole period, amounting to US$ 88.867 billion in 2019 (Banxico 2020). Unlike the textile industry, the Mexican automotive industry is at an advanced stage of integration with the United States, to such a degree that some authors refer to it as a regional auto parts/automobile chain with regional models, inputs, products and processes (Dussel Peters and Gallagher 2013).
Figure 2. DVA in the global export network for transport equipment, 1996 and 2011
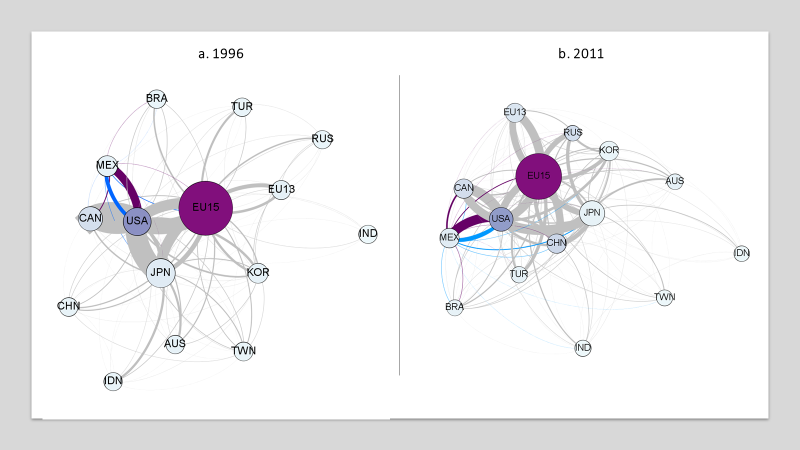
Source: Own elaboration based on WIOD data.
While it is crucial to account for the role played by Mexico in the network for each of these two industries, we also need to identify how Mexico participates in the related GVCs. One way to do this is by looking at FVA as a percentage of exports. Plotting the FVA as a proportion of each country’s gross exports, as in Figure 3, reveals interesting patterns. Almost all countries saw this proportion increase between 1996 and 2011, except for Canada. Furthermore, it appears that this proportion is higher for emerging economies such as Mexico, Taiwan Province of China and the Republic of Korea than for advanced economies such as the United States and Japan. Brazil stands out for its low percentage of FVA, reflecting its reliance on primary product exports, which are naturally high in local content. For all countries, the transport equipment sector saw a higher level of FVA than the textile industry. The changes in the proportion of FVA between 1996 and 2011 are also more substantial in the transport equipment sector.
Of this group of economies, Mexico presented the largest share of FVA in manufacturing exports and did not experience significant changes between 1996 and 2011. Typically, emerging countries with large shares of exports in segmented industries need more imported inputs in order to generate exports, leading to high levels of FVA, as is Mexico’s case. In the textile and transport equipment industries, Mexico had the second highest level of FVA as a percentage of exports, after the EU13. This indicator may reflect how countries participate in the network, with those that incorporate a higher level of FVA in their exports possibly being located in the assembly phase of the chain, meaning that they need to import more in order to export, while countries with a lower proportion of FVA may be located in, for example, the design phase of the chain, in particular in the automotive industry.
Figure 3. FVA as a percentage of exports in the overall manufacturing sector and in the textile and transport equipment industries, 1996–2011, selected countries (per cent)
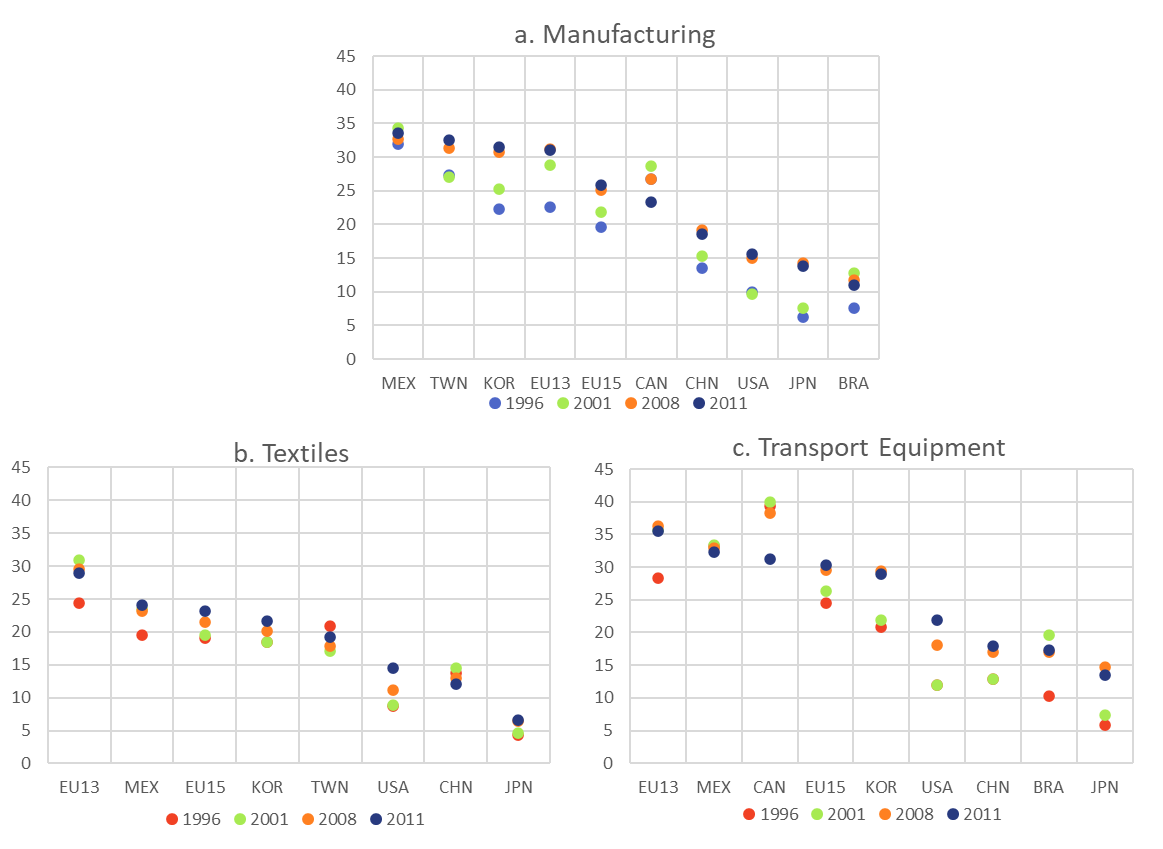
Source: Own elaboration based on WIOD data.
However, to fully understand a country’s involvement in GVCs, we also need to consider DVA, in particular that corresponding to exports of intermediate goods used by third countries, referred to as .17 The higher the level of FVA as a percentage of exports and the higher the level of , the higher the level of participation of a given country in the GVC (Taglioni and Winkler 2016). However, this does not mean that all countries present high levels for both indicators. In reality, the nature of a country’s participation in a GVC varies depending on the type of goods exported and their place in the global production process. In the case of textiles or other technologically simple consumer goods, their value depends on their level of sophistication, which translates (or not) into a trademark. In the case of highly sophisticated products, the company that owns the brand appropriates a significant part of its value. Were the production process to be fragmented internationally, the assembly country would take only the part of the value that corresponded to wages, while the owner of the brand would appropriate the value of the design, production organization, distribution and marketing.
Automotive products, on the other hand, are classified as higher technology products, for which the production process is broken down into several phases. At the head of the process is a company in charge of the most complicated phases, which allows it to generate and appropriate a large part of the value of the goods produced. A country’s position in the trade network and the division of the value of exports will depend on the phases in which the country specializes. If it specializes in the assembly of parts produced in other countries for which a highly skilled workforce is not required, the value of the exported product will have a high imported component (meaning that the internal incorporated DVA will be low).
Figure 4. Participation in GVC by FVA and DVAGVC as a percentage of exports, selected countries (per cent)
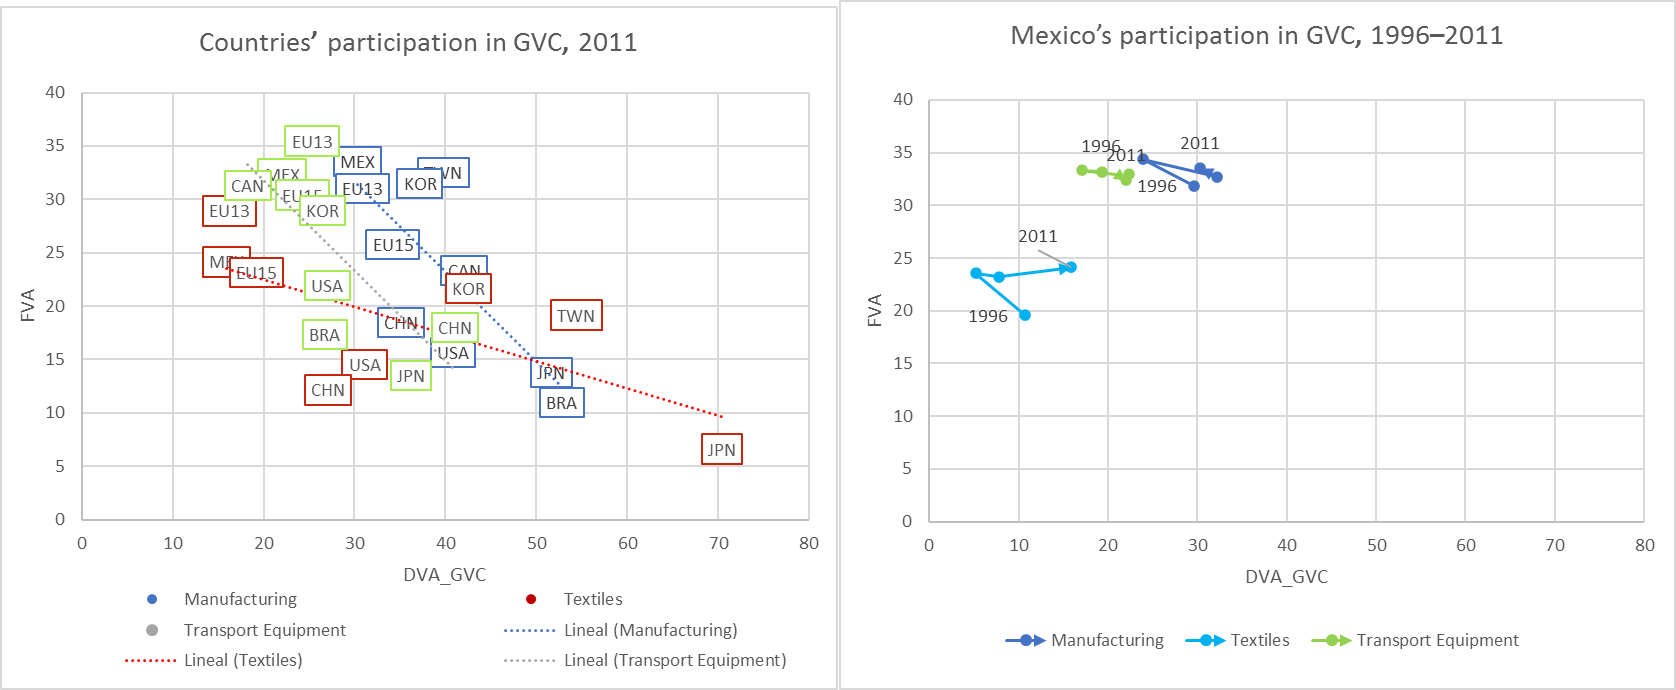
Source: Own elaboration based on WIOD data.
Figure 4 contains data on FVA and as a percentage of exports for the overall manufacturing sector and for the textile and transport equipment industries specifically. In general, we can observe that countries present either a high FVA or a high , but generally not both. Countries with high FVA present a lower level of , signalling that they might be specialized in assembly. Conversely, those with lower FVA have a higher level of . There are some exceptions; for example, Taiwan Province of China has a high level of for the transport equipment industry, but its level of FVA is not significantly low. However, Taiwan Province of China is a minor player in that network. We observe a slightly different linear trend in the textile industry; while negative, the linear slope is less steep than that of the other two categories, indicating that, on average, countries present a higher level of in this industry.
Mexico’s position is similar across all three categories. It registers a high level of FVA and a low level of , although the latter did increase between 1996 and 2011. The incorporated into its textile exports is lower than that incorporated into its transport equipment exports and its total manufacturing exports. This might be due to the fact that the Mexican textile industry relies more heavily on the import of parts and components, and it exports a higher proportion of finished products (assembled garments) than the Mexican automotive industry (the leading supplier of auto bodies and parts, including chassis, electrical components and engines, for the United States), even though it specializes mainly in assembly and therefore has also a high proportion of FVA (Dussel Peters and Gallagher 2013).
Mexico plays a relatively unimportant role in the DVA trade network for global manufacturing exports, with the exception of its link to the United States, which is one of the three most important actors in the network. Mexico’s trade relationship is heavily concentrated towards its northern neighbour, although, during the period of analysis (1996–2011), a few other countries gained a greater presence, most noticeably China and European countries.
Mexico’s textile industry – like that of many other countries – suffered a decline over this period as Chinese textile manufacturing boomed and became the major global exporter, while Mexico reduced its number of trade partners and the magnitude of value-added traded with them. The picture for the transport equipment sector was entirely different, however. Unlike the other networks analysed, more countries participate in the GVC for transport equipment. In most cases during the period of analysis, the connections became thinner, revealing greater diversification. Nevertheless, between 1996 and 2011, Mexico’s importance in the network grew, reflected in the number of links with other countries and the relative weight of those connections. Unlike in the overall manufacturing sector and the textile industry specifically, Mexico’s “exporter” role is more important than its role as an importer.
2.2 Jobs related to trade
Having analysed the trade performance of the Mexican manufacturing industry, we will now proceed to address the issue of employment with the aim of quantifying how many jobs were created by, among other things, Mexico’s increased participation in foreign trade, both in the case of final exports and trade in GVCs.
Figure 5 shows the proportion of employment provided by each industry. In 1996, the service sector provided 61 per cent of total employment, while agriculture and mining provided 20.5 per cent and manufacturing 18.2 per cent. The textile industry was the second biggest employer in the manufacturing sector, with a share of 2.5 per cent, while transport equipment was fourth with 2 per cent. By 2011, the service sector had increased its share of total employment, reaching 68.8 per cent, implying a reduction in both the primary and the manufacturing sectors, which dropped to 14.3 per cent and 16.9 per cent respectively. The proportion of employment provided by the textile industry remained practically unchanged (2.6 per cent), and although the percentage of jobs provided by the transport equipment industry did not significantly increase (rising only to 2.3 per cent), it became the third most important source of jobs in the manufacturing sector.
Conversely, in 1996 the manufacturing sector represented roughly 60 per cent of total DVA in exports, while the service sector represented 25 per cent and agriculture and mining the remaining 15 per cent (Figure 6). Transport equipment, the most relevant manufacturing industry with regard to DVA, generated 18 per cent of total value-added in exports, representing more than one quarter of the value added by the manufacturing sector as a whole. The textile industry, meanwhile, came in fourth place with 5 per cent. In 2011, manufacturing continued to represent two thirds of total DVA; while transport equipment contributed to one third of that total, textiles had dropped to 3.5 per cent. Clearly, transport equipment was the main source of DVA generated in the manufacturing sector in Mexico in the period under study, even increasing its share in the total economy, but it was not the principal employer. In textiles, however, even though its contribution to total DVA in exports dropped during that same period, the proportion of jobs generated by the industry increased.
The above data do not capture the relationship between the value added in exports in each industry and its corresponding employment level. An input–output analysis is a common and useful approach for estimating the contribution of exports to job creation. Our analysis builds on the standard methodology used in the literature (Miller and Blair 2009). It relies on the classification of productive activities into the following broad types: domestic activities, and activities that involve production sharing between two or more countries (Wang et al. 2017). The details are presented in Annex 3.
Figure 5. Employment by industry as a proportion of total employment, Mexico, 1996 and 2011 (per cent)
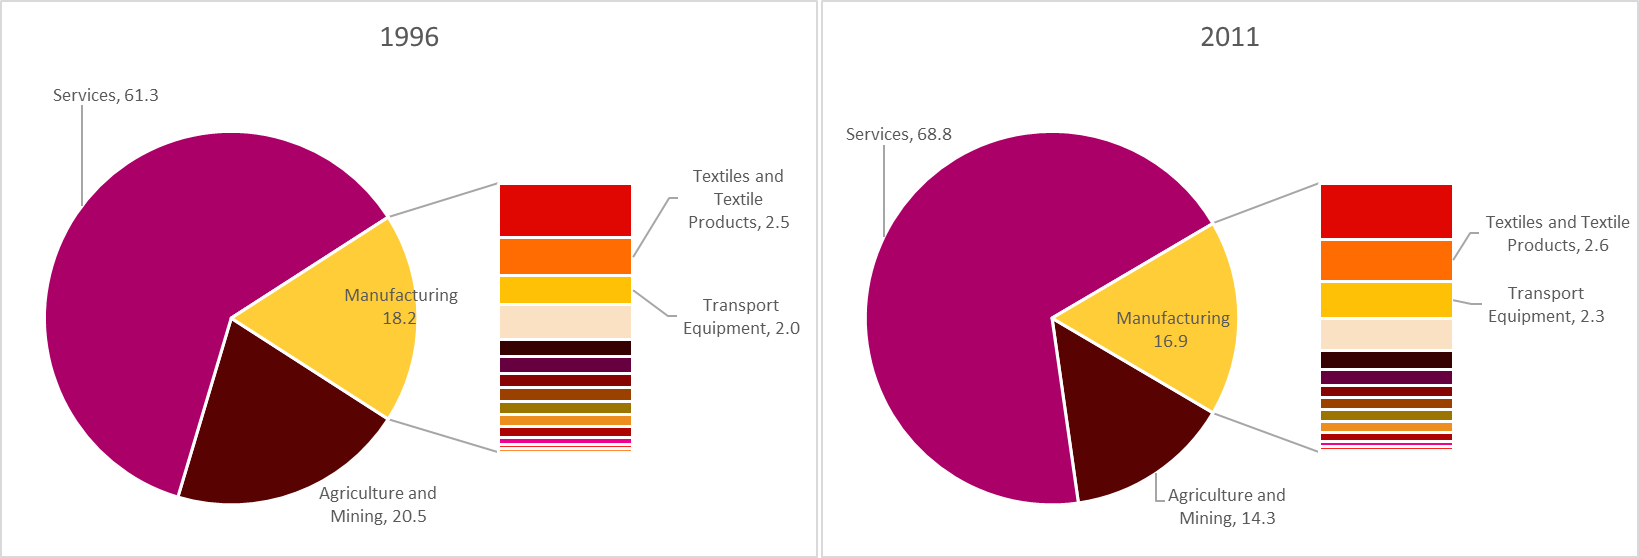
Source: Own elaboration based on WIOD data.
Figure 6. DVA in exports by industry as a proportion of total DVA, Mexico, 1996 and 2011 (per cent)
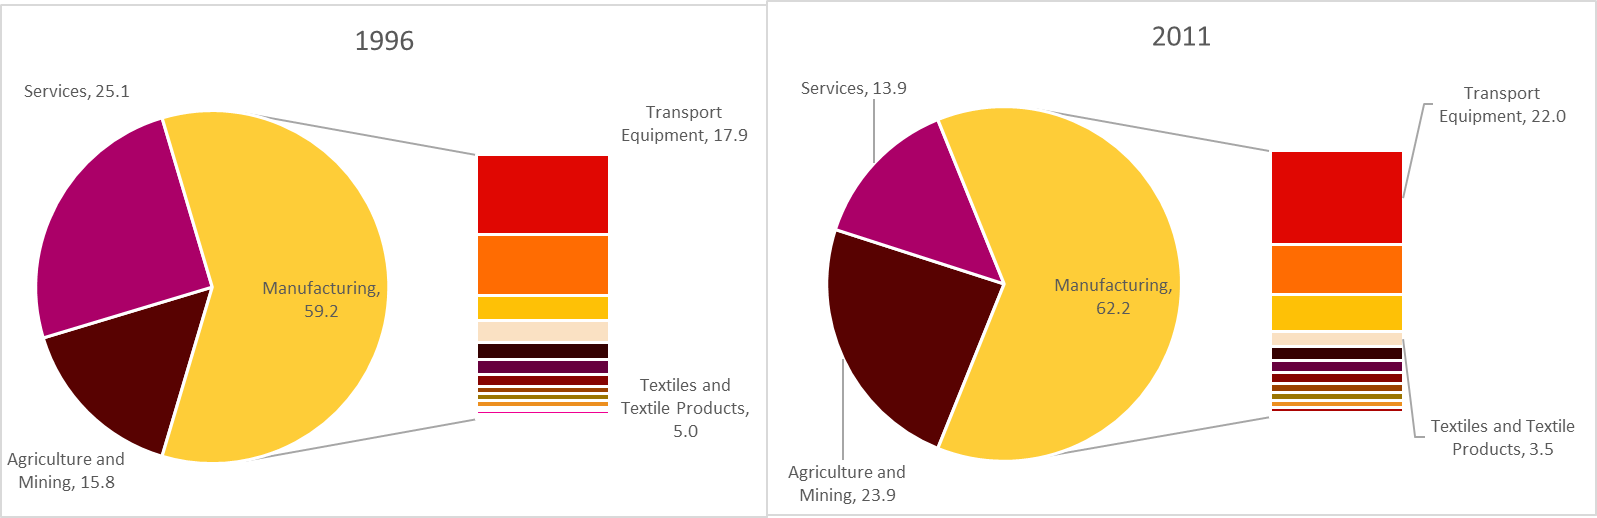
Source: Authors’ calculations based on WIOD data.
We calculated the number of jobs created directly and indirectly for each type of production. This does not only include jobs created within each industry (namely direct employment within the industry itself) but also includes those indirectly supported by domestic suppliers (backward and forward linkages) both for domestic production and for production related to international trade in both traditional (related to exports of final goods) and GVC activities (exports of intermediate goods).
As Table 1 shows, in 1996 domestic production accounted for around 40 per cent of total jobs in both the textile and the transport equipment industries; this was almost 20 percentage points lower than the rate in the overall manufacturing sector, and almost half the rate in the overall economy. Traditional trade accounted for the majority of jobs in these two industries (46.4 per cent for textiles and 40.7 per cent for transport equipment). Only 11 per cent of total jobs in the textile industry were in GVC activities. This proportion reached almost 19 per cent in the transport equipment industry, just a little above the corresponding average for the manufacturing sector as a whole. In this sense, the textile industry more accurately reflected the Mexican economy as a whole, which accounted for 8.7 per cent of jobs in GVC activities.
The picture changed radically in the following years. In textiles, domestic production became the principal source of jobs (except for 2001, where traditional trade took first place) and traditional trade lost importance (dropping to 36.3 per cent). GVC activities recorded a small increase to 12.4 per cent. On the other hand, jobs related to trade activities in the transport equipment industry increased. The share of total jobs generated by final exports reached 52.5 per cent in 2011, while the proportion generated by GVC production reached 29.6 per cent. In other words, by 2011 domestic production had lost importance in terms of employment generation in the transport equipment industry, representing only 17.9 per cent of jobs, less than half that in 1996. Nonetheless, transport equipment remained the leading industry for job creation.
Table 1. Jobs associated with domestic production, traditional trade and GVC trade as a percentage of total jobs (per cent)
|
|
|
|
|
|
|
|---|---|---|---|---|---|
|
Domestic |
42.6 |
35.2 |
53.1 |
51.3 |
|
|
|
Traditional trade |
46.4 |
57.9 |
39.2 |
36.3 |
|
GVC trade |
11.0 |
6.9 |
7.7 |
12.4 |
|
|
Domestic |
40.6 |
40.7 |
34.8 |
17.9 |
|
|
|
Traditional trade |
40.7 |
42.6 |
41.0 |
52.5 |
|
GVC trade |
18.7 |
16.7 |
24.1 |
29.6 |
|
|
Domestic |
59.7 |
54.5 |
56.6 |
51.8 |
|
|
|
Traditional trade |
22.8 |
29.3 |
22.6 |
26.6 |
|
GVC trade |
17.5 |
16.2 |
20.8 |
21.6 |
|
|
Domestic |
84.4 |
84.4 |
85.9 |
84.1 |
|
|
|
Traditional trade |
6.9 |
8.1 |
5.9 |
7.2 |
|
GVC trade |
8.7 |
7.5 |
8.2 |
8.7 |
Source: Authors’ calculations based on WIOD data.
Table 2 shows whether the jobs generated by an industry corresponded to the industry itself or whether they were related to inputs from other industries, namely indirect jobs. In GVC trade, we cannot record the jobs generated inside and outside the industry, as it would involve not only Mexican-originated inputs but also other countries’ inputs that were “embedded” in intermediate imports.18 Instead, we registered the total percentage of jobs generated by Mexican exports of intermediate inputs that other countries subsequently incorporated into their production. Job creation over the 1996–2011 period is further defined as the difference in the number of jobs between 2011 and 1996.
In the textile industry, there is a significant difference between domestic production and traditional trade in terms of employment generation. At the start of the period of analysis, two thirds of jobs in domestic production were generated within the industry itself, while one third came from other industries (both upstream and downstream). In contrast, in traditional trade, approximately 10 per cent of jobs came from other sectors – a sign of the low capacity of final exports to stimulate more jobs outside the sector. Although in 2008 and 2011, the proportion of jobs created within each industry was reduced, the difference between domestic production and traditional trade remained constant. As mentioned above, GVC activities in the textile industry are not particularly relevant to job generation, unlike the automotive industry, in which GVC activities have become as crucial to generating jobs as traditional trade.
Between 1996 and 2011, the textile industry created 477,000 jobs, the vast majority of which (305,000) came from domestic production within the sector. Traditional trade generated 86,000 jobs. It is interesting to note that traditional trade generated more jobs outside the industry (23,700) than domestic production (14,900). The textile industry did not, therefore, increase its demand for additional inputs from other industries during this period, but rather demand actually decreased in relative terms.
Table 2. Number of jobs generated within or outside the industry according to production destination, Mexico, 1996–2011 (thousands)
|
|
|
|
|
|
|
||||
|---|---|---|---|---|---|---|---|---|---|
|
|
|
|
|
|
|
|
|||
|
|
1996 |
243.2 |
127.6 |
370.9 |
370.3 |
33.7 |
404.0 |
96.2 |
871.1 |
|
2001 |
279.2 |
136.0 |
415.2 |
645.5 |
37.5 |
683.0 |
81.6 |
1179.8 |
|
|
2008 |
466.3 |
119.5 |
585.8 |
400.2 |
31.6 |
431.9 |
84.6 |
1102.2 |
|
|
2011 |
548.6 |
142.6 |
691.2 |
432.5 |
57.4 |
489.9 |
166.9 |
1348.0 |
|
|
|
|
|
|
|
|
|
|
|
|
|
|
1996 |
248.4 |
24.7 |
273.2 |
269.7 |
4.2 |
273.9 |
126.2 |
673.2 |
|
2001 |
335.8 |
36.6 |
372.3 |
382.4 |
6.8 |
389.2 |
152.9 |
914.4 |
|
|
2008 |
319.2 |
24.1 |
343.3 |
400.4 |
4.2 |
404.6 |
237.8 |
985.8 |
|
|
2011 |
176.9 |
36.9 |
213.8 |
621.8 |
5.4 |
627.2 |
353.5 |
1194.5 |
|
|
|
|
|
|
|
|
|
|
|
Note: GVC trade covers exports and imports of all goods and services that are part of a GVC.
Source: Authors’ calculations based on WIOD data.
As noted above, in the transport equipment industry, traditional trade activities played a central role in employment. These jobs were mainly created within the industry. A negligible number of jobs came from other industries, which reflects the disconnect between this activity and the rest of the economy with regard to employment generation. There was also a clear decrease in the importance of domestic production; while in 1996 domestic production created almost as many jobs as traditional trade, in 2011 it was the least relevant area of production in terms of the number of jobs generated. The transport equipment industry created 521,000 jobs between 1996 and 2011, mainly in trade activities; this included a loss of 59,000 jobs in domestic production.
The analysis points to a distinction between the textile and transport equipment industries in terms of employment creation. While textiles has an inclination for domestic production with an essential connection to other industries, transport equipment is trade-oriented with almost no need for domestic inputs or post-production services. We can corroborate this trend through typical linkage analysis. (See the methodology described in Annex 3.) Linkages measure the effect of an increase in the output in any particular industry on other activities. As we are concerned with the impact on employment, Figure 7 shows the relative position of the two industries in terms of the number of indirect jobs created, in accordance with the taxonomy commonly used in the literature (see Table 3).
Table 3. Industrial activity taxonomy, according to forward and backward linkages
|
|
|||
|
|
Less than 1.0 |
Greater than 1.0 |
|
|
Less than 1.0 |
Island |
Forward oriented |
|
|
Greater than 1.0 |
Backward oriented |
Key |
Source: Own elaboration based on Rasmussen (1957), inter alia.
In Figure 7, we present the results for both industries. It is no surprise that the transport equipment industry is classified as an “island” over the four years of study. In contrast, textiles is located in the key sector quadrant. This means that, relatively speaking, the Mexican textiles industry is an activity in which linkages with other industries are central to the generation of employment.
The textile industry is a crucial generator of employment in the Mexican economy. At the start of the period of analysis, production destined for final exports represented a source of employment that was almost as important as domestic production. However, by 2011 this situation had changed, and the industry mainly employed workers in domestic production. In addition to generating jobs within the industry, textile production destined for the domestic market generated jobs indirectly by demanding inputs from other sectors. The relative importance of these indirect jobs declined towards the end of the period of analysis, however. In activities related to foreign trade, the number of indirect jobs was much lower, although it remained an area relevant to job generation. The study of forward and backward linkages with regard to job creation corroborates the central role played by textiles in employment, which was found to be a key industry according to both indicators.
Figure 7. Backward and forward linkages in the textile and transport equipment industries based on the industrial activity taxonomy, Mexico, 1996–2011
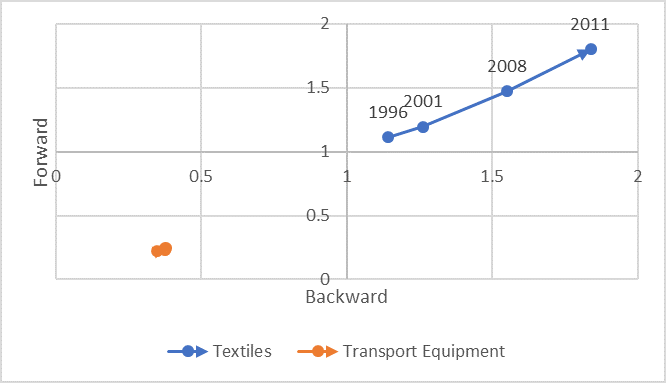
Note: See Annex 3 for the methodology for classifying forward and backward linkages.
Source: Authors’ calculations based on WIOD data.
Although the transport equipment industry is the main generator of value-added in export production, it does not have the same relevance to job creation. Employment creation within this industry is concentrated in foreign trade activities, mainly those related to final exports, although the relative importance of GVC did increase during the period of analysis.
As we have seen, a significant proportion of the inputs necessary to produce exports in the transport equipment industry come from abroad, and therefore a significant number of the jobs created are based abroad. This seems to be related to the fact that the industry generates almost no external employment in other industries. In other words, it does not have significant backward or forward linkages with the domestic economy and thus is located in the “island” quadrant. This does not mean that the industry is not labour-intensive, rather that those jobs are most likely generated outside the country.
As mentioned above, the data provided in WIOD do not allow for a deeper analysis of trade and employment in relation to decent work. The next section proceeds to address this fundamental issue through the construction of multidimensional indicators and qualitative aspects of employment, thereby facilitating an approximate assessment of the evolution of decent work in the textiles and automotive industries in Mexico.
Decent work in Mexico’s automotive and textile industries: 1996–2016
One of the main characteristics of globalization during the 1980s and 1990s was the accelerated increase in international trade and the large number of developing countries that began to participate in GVCs. This shift undoubtedly had significant repercussions on the shape of labour markets. In 2008, the ILO adopted the Declaration on Social Justice for a Fair Globalization. The Declaration emphasizes the importance of universalizing the Decent Work Agenda by promoting employment, social protection, social dialogue and labour rights.
In 2013, the ILO published two important documents for analysing the evolution towards decent work. The first of these documents is entitled
Both the automotive and textile industries cover a series of different activities, as identified by the North American Industry Classification System. To pinpoint the industrial activities linked to exports, Mexico’s National Institute of Statistics and Geography (INEGI) constructed the Global Manufacturing Export Value Added Database using the System of National Accounts framework. This aggregate figure represents the national level of manufacturing that participates in GVCs, and it has become a flagship for the analysis of global manufacturing production. It is built with data from companies that allocate two thirds of their production to the foreign market and whose majority share comes from foreign capital, as well as those that are exporters as part of a GVC.
Based on both the Global Manufacturing Export Value Added Database and the North American Industry Classification System, the automotive industry can be said to comprise the following activities linked to foreign trade: motor vehicle manufacturing, motor body and trailer manufacturing, motor vehicle parts manufacturing, and other transportation equipment manufacturing. In the case of the textile industry, industrial activities comprise fibre, yarn and thread mills, fabric mills, textile and fabric finishing mills, textile furnishings mills, other textile product mills, apparel knitting mills, cut and sew apparel manufacturing, and apparel accessories and other apparel manufacturing.
To build a set of decent work indicators for these industries, data were harvested from employment surveys regularly carried out in Mexico by official sources: the National Employment Survey, which contains annual data from 1995 to 2004, and the National Occupation and Employment Survey, which replaced the previous survey in 2005. The data on the various economic activities in the first survey are classified according to the 1993 Mexican System of National Accounts, while in the more recent survey they are organized according to the North American Industry Classification System, which was jointly prepared by Canada, the United States and Mexico following the signing of NAFTA. An homogeneous series was obtained using both sources of information.19
The construction of time series indicators for the labour market was based on the comparative tables of the different classification systems used (the North American Industry Classification System and the 1993 System of National Accounts framework) that were prepared by INEGI. The tables made it possible to conceptually compare the categories used in the current system with those used in the system that preceded it, bearing in mind that there are various limitations for obtaining some data, mainly at greater levels of disaggregation. The tables allowed us to make approximations for three-digit industrial classification at national and international level, as well as for the automotive and textile industries specifically.
The most recent information on Mexico’s labour market was collected through the Labour Statistical Information System maintained by the Secretariat of Labour and Social Welfare, which, together with INEGI, has constructed an input–output matrix based on indicators used in the National Occupation and Employment Survey. Using this matrix, we were able to identify statistical information for each industrial activity from 2005 to 2019. Using both the previous and current survey formats, it was possible to obtain indicators on employment access, which are defined below. We used the data bank of the Mexican Institute of Social Security, which houses statistics related to access to social and job security in the private sector, to develop indicators of employment security. This information is available up until 2016, the most recent year for which comparisons can be made.
3.1 Selected indicators of decent work
In accordance with the above, in this study we constructed a battery of decent work indicators based on the ILO guidelines in order to analyse employment conditions at national level and in the automotive and textile industries specifically (see Table 4). Taking into consideration the ILO (2013a) report on the situation of decent work in Mexico, these indicators are divided into four axes:
Table 4. Decent Work indicators by axis
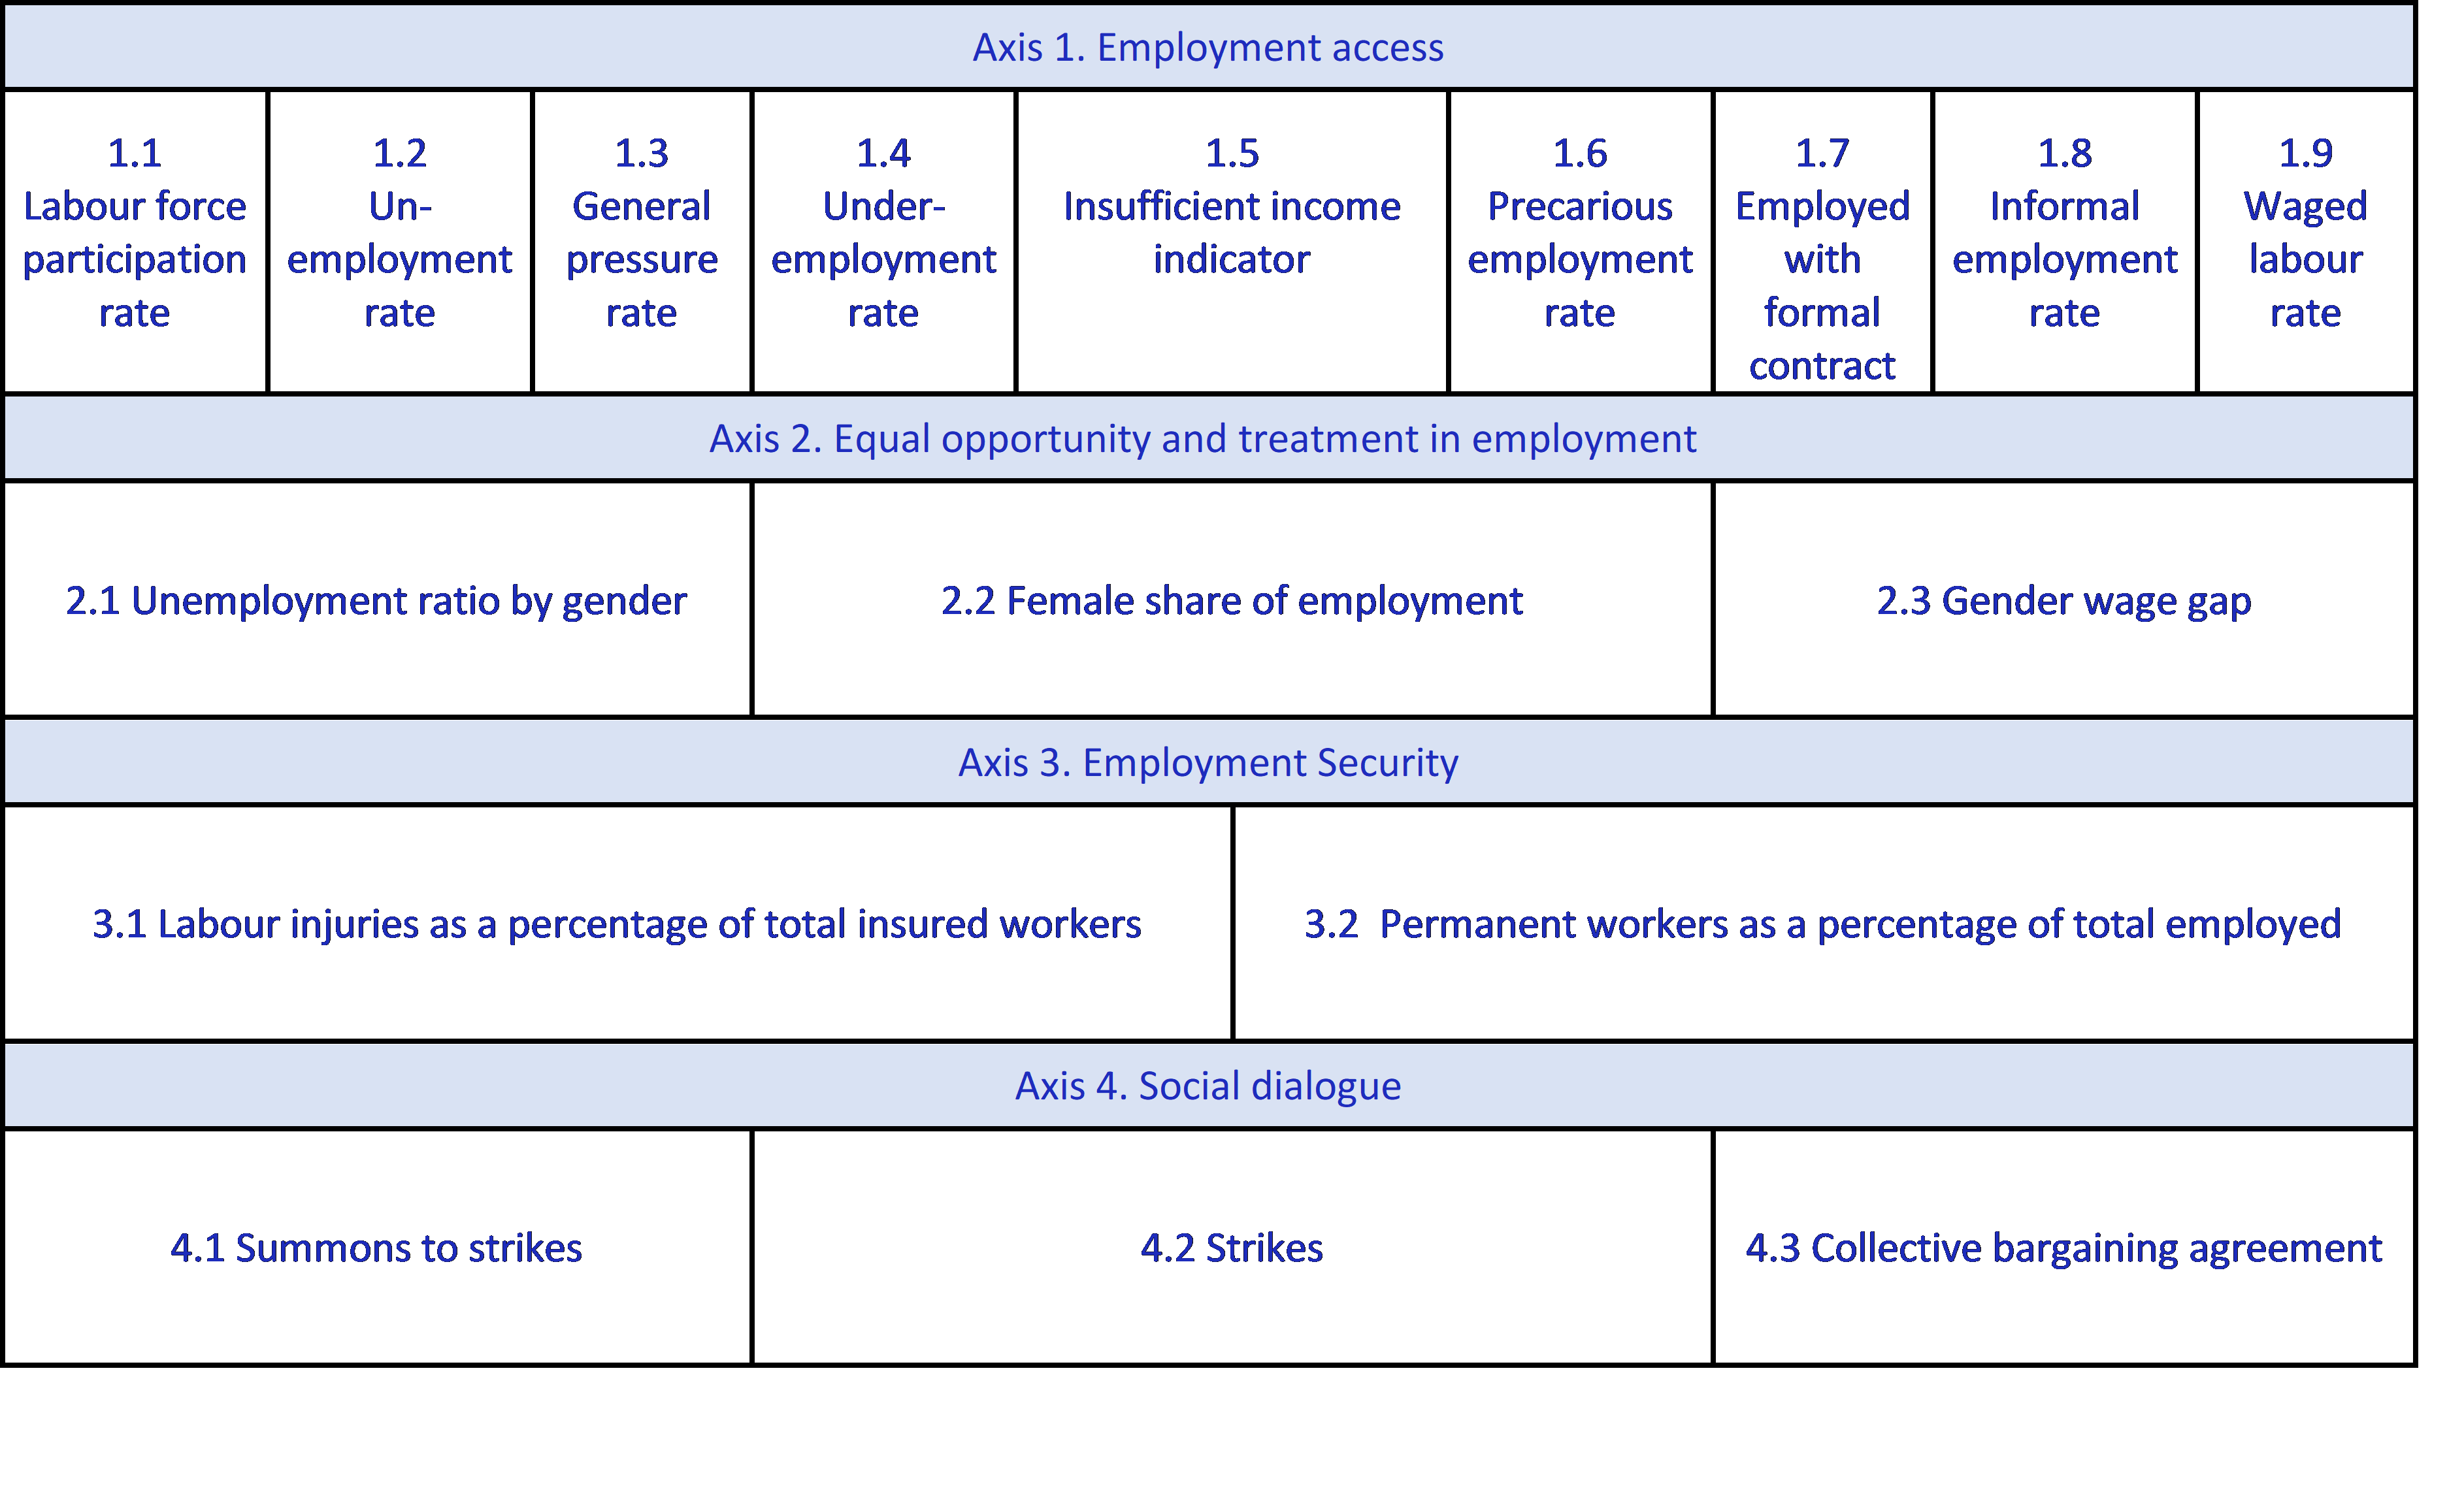
Source: Own elaboration based on ILO (2013a) and ILO (2013b).
In Annex 5, we include the methodology and data sources used for computing these indicators.
3.2 Decent work indicators for the automotive and textile industries
3.2.1 Employment access, and equal opportunities and treatment in employment
According to the National Occupation and Employment Survey, in 2019 the labour force participation rate in Mexico was close to 60 per cent, while the unemployment rate was just 5.3 per cent. Both figures are relatively similar to those in 1996. However, in general, Mexico’s working conditions are far from laudable: 59 per cent of the employed population are in informal employment, and just under half of all workers have sufficient income. As shown in Table 5, between 1996 and 2019, the precarious employment rate (characterized by few hours of work or excessive hours with insufficient income) increased by 6.5 percentage points.
Over the period of analysis, the percentage of workers in the automotive industry with an income equivalent to less than two times the minimum wage (the insufficient income indicator) stalled around 53 per cent. Although the precarious employment rate for the industry almost tripled during the same period, it remained half the national level. The automotive industry had a high proportion of salaried workers, representing 99 per cent of employed personnel, and the informal employment rate for 2019 was 2.1 per cent, which was 26 times lower than the national rate.
Table 5. Axis I: Employment access
|
|
||||||||||||
|---|---|---|---|---|---|---|---|---|---|---|---|---|
|
|
|
|
|
|||||||||
|
1996 |
2008 |
2011 |
2019 |
1996 |
2008 |
2011 |
2019 |
1996 |
2008 |
2011 |
2019 |
|
|
Labour force |
57.9% |
59.9% |
59.7% |
60.1% |
- |
- |
- |
- |
- |
- |
- |
- |
|
Unemployment |
5.2% |
4.0% |
5.4% |
5.2% |
- |
- |
- |
- |
- |
- |
- |
- |
|
General |
8.6% |
6.5% |
8.3% |
6.2% |
- |
- |
- |
- |
- |
- |
- |
- |
|
Underemployment |
7.9% |
7.1% |
9.1% |
7.5% |
- |
- |
- |
- |
- |
- |
- |
- |
|
Insufficient income |
51.1% |
32.3% |
35.5% |
51.5% |
53.2% |
21.8% |
28.5% |
53.0% |
73.7% |
49.3% |
53.5% |
73.3% |
|
Precarious |
23.9% |
34.8% |
36.3% |
30.5% |
5.5% |
6.6% |
7.7% |
14.2% |
29.4% |
40.7% |
40.9% |
42.2% |
|
Employed with |
25.5% |
28.9% |
28.7% |
22.8% |
82.0% |
84.4% |
80.6% |
63.9% |
29.9% |
25.6% |
25.7% |
21.6% |
|
Informal |
67.5% |
58.1% |
59.4% |
56.4% |
4.3% |
2.2% |
3.3% |
2.1% |
58.8% |
64.9% |
66.3% |
62.7% |
|
Waged labour |
53.4% |
61.6% |
61.9% |
68.0% |
99.1% |
99.4% |
99.3% |
99.6% |
53.6% |
53.6% |
56.7% |
60.3% |
Source: Authors’ calculations based on the National Employment Survey and the National Occupation and Employment Survey conducted by INEGI and the Labour Statistical Information System maintained by the Secretariat of Labour and Social Welfare.
On the other hand, in the textile industry, job insecurity increased during the period of analysis. The proportion of informal workers increased from 58.9 to 62.8 per cent (above the national rate), and the precarious employment rate similarly surpassed the national level.
At national level, between 1996 and 2019, the percentage of workers with a formal contract decreased from 25.5 per cent to 22.8 per cent. While, in the automotive industry, most workers (63.9 per cent) possess a contract, only 21.6 per cent of workers in the textile industry have a contract.
The role of women in both industries is entirely different (see Table 6). In the automotive industry, only 36.9 per cent of employees were women in 2019, a rate which is remarkably similar to the rest of the economy (37.5 per cent). In the textile industry, meanwhile, women represent 64 per cent of employees. In both industries, some gender inequalities prevail. At national level, the wage gap decreased from 0.35 to 0.67 between 1996 and 2019, meaning that some progress was made in closing the gap between female and male earnings. However, we find a greater gap and some indications of the reverse trend in both the textile and automotive industries. In the automotive industry, although the gap diminished (from 0.16 in 1996 to 0.36 in 2019), some improvement achieved in the previous years was lost. (In 2008, the gender gap was 0.40.) In the textile industry, the wage gap was 0.52 in 1996, but it widened to 0.24 by 2008. While by 2019 it had recuperated somewhat, reaching 0.39, it remained at a lower level than in 1996.
Table 6. Axis II: Equal opportunity and treatment in employment
|
|
||||||||||||
|---|---|---|---|---|---|---|---|---|---|---|---|---|
|
|
|
|
|
|||||||||
|
1996 |
2008 |
2011 |
2019 |
1996 |
2008 |
2011 |
2019 |
1996 |
2008 |
2011 |
2019 |
|
|
Unemployment |
0.77 |
1.07 |
0.99 |
1.02 |
- |
- |
- |
- |
- |
- |
- |
- |
|
Female share of |
34.2% |
37.2% |
37.5% |
39.1% |
28.1% |
33.1% |
32.5% |
36.8% |
59.7% |
64.5% |
63.5% |
63.8% |
|
Gender wage |
0.35 |
0.66 |
0.66 |
0.67 |
0.16 |
0.40 |
0.39 |
0.36 |
0.52 |
0.24 |
0.28 |
0.39 |
Source: Authors’ calculations based on the National Employment Survey and the National Occupation and Employment Survey conducted by INEGI and the Labour Statistical Information System maintained by the Secretariat of Labour and Social Welfare.
3.2.2 Employment security and social dialogue
The figures in
Table 7. Axis III: Employment security
|
|
||||||
|---|---|---|---|---|---|---|
|
|
|
|
|
|||
|
2008 |
2016 |
2008 |
2016 |
2008 |
2016 |
|
|
Labour injuries as a percentage of total |
2.9% |
2.3% |
1.9% |
1.1% |
1.9% |
1.4% |
|
Permanent workers as a percentage of |
28.0% |
31.0% |
65.5% |
70.3% |
36.1% |
44.6% |
Source: Authors’ calculations based on data from the Mexican Institute of Social Security.
While the percentage of permanent workers in the automotive industry had increased to 70.3 per cent by 2016, in the textile industry it had risen to only 44.6 per cent by the same year, representing a 25-percentage point gap between the two industries. Both industries were still above the national rate of 31 per cent, however. While opportunities remain to enhance the proportion of permanent workers, there has been an improvement in employment security in both the automotive and the textile industries.
The social dialogue indicators show a weakening in collective bargaining. Both nationally and in the automotive and textile industries specifically, the rate of strikes and collective bargaining agreements fell dramatically, in particular in the post-crisis period (see
Table 8. Axis IV: Social dialogue
|
|
|||||||||
|---|---|---|---|---|---|---|---|---|---|
|
|
|
|
|
||||||
|
1996 |
2008 |
2019 |
1996 |
2008 |
2019 |
1996 |
2008 |
2019 |
|
|
Summons |
7,621 |
10,814 |
7,095 |
2% |
2% |
3% |
7% |
4% |
3% |
|
Strikes |
40 |
19 |
7 |
8% |
5% |
22% |
14% |
5% |
0% |
|
Collective |
4,411 |
5,047 |
2,110 |
4% |
3% |
2% |
3% |
3% |
2% |
Source: Authors’ calculations based on data from the Secretariat of Labour and Social Welfare.
While the decent work indicators show general improvements with regard to employment security and labour rights, the industries present two different realities. On the one hand, the automotive industry experienced better results in employment generation, formal employment with defined contracts, and better wages. On the other hand, the textile industry showed poor performance in its path towards decent work. At national level, the precarious employment rate increased, which implies that employment conditions became more adverse as a result of lower incomes and fewer hours of work among the employed population, which warns of possible increases in underemployment.
In terms of gender equality, the results achieved in both industries are far from satisfactory. In the automotive industry, the proportion of female workers decreased. Although the proportion increased in the textile industry, the conditions were worse than the national average. In both cases, there is a need for men’s and women’s participation in workspaces to be more balanced and for workers to enjoy fairer conditions that provide sufficient income. Progress on social dialogue moved in the opposite direction to decent work, with a weakening of trade unions. The decline in the relevance of collective contracts and the reduction in summons to strike reflect the repressive policy towards such actions.
One crucial element in the road towards decent work is the increasing prevalence of formal labour relations and the development of a more competitive structure. More precisely, it makes a difference whether the key players in an industry tend to be big firms, operating in the formal labour markets, or if they are mainly small- and microenterprises in informal markets. In the case of the textile industry, 95 per cent of companies are small- and medium-sized enterprises (SMEs), meaning that they do not have more than ten employees, and only 0.28 per cent of companies have more than 250 employees. In the automotive industry, microenterprises represent only 38 per cent of all companies, and large companies represent 26 per cent. Over the past 20 years, foreign direct investment in the auto industry has exceeded that in textiles by a multiple of 15 or more. This difference may be crucial in explaining their distinct patterns of insertion in the world market and the evolution towards decent work.
Conclusions
Perhaps the best assessment of the broad, key contributions of our study on Mexico’s insertion policy in GVCs and the evolution of decent work, exemplified by the automotive and textile sectors, is that generously expressed by Dr Valentín Solís, INEGI’s expert on industrial and trade matters. As he stated, our study “provides a summary of a complex history of Mexico’s economic development and industry policies (or lack of it) in the last 35 years.” Furthermore, it shows that, “[d]uring most of the period considered (from 1985 to 2019), the institutional policy related to the Federal
As shown in the empirical analysis based on the construction of decent work indicators, of the two industries here examined, only the automotive industry fits within a global conception of decent work. It is a sector with strong links to production in the United States and a few other countries and with a very limited scope in its domestic value chains. In contrast, the textile sector faces many more problems in relation to compliance with the applicable standards set out in the Federal Labour Act and is further from meeting the ILO recommendations on decent work. It is much more rooted in the domestic productive structure, and it shares most of the problems experienced by the overall labour sector in Mexico. We could not agree more with Solís’s suggestion that “the sectoral disaggregation [here presented] refutes some of the reconstructions [on trade and labour] derived from a purely macroeconomic approach.”
Our study confirms that the quest to generate sufficient jobs and create better working conditions in Mexico remains unfulfilled, even though Mexico has pioneered international trade arrangements and made important strides in its insertion into GVCs. Before the COVID-19 crisis, the national unemployment rate was relatively low, as one would expect in the absence of unemployment benefits, and 57 per cent of all employment was informal. The minimum wage, having declined in real terms for decades, has started a process of recovery in recent years, with a major rise in 2019. Still, there is a vast proportion of workers whose incomes remain extremely precarious and who live below the poverty line. Gender and racial discrimination plague the labour market, productivity has been relatively stagnant, and the share of national income going to workers has been falling for years.
The reasons for this are many and intertwined, ranging from the lack of a profound transformation of the industrial structure to a balance-of-payments constraint that impedes high and sustained economic expansion. The neoliberal reforms assumed that the operation of free-trade agreements and the use of market signals undistorted by industrial policies and state intervention would put the Mexican economy on a path of export-led high and sustained growth. This did not happen, however. Exports did boom, but not sufficiently. Mexico is increasingly trapped by slow growth. On top of that, for decades – and until very recently – labour market regulation was biased against the working class. This included a minimum wage policy geared at keeping inflation down in the context of a development agenda in which low wages were a key element of international competitiveness, as well as a productive structure and innovation system that did not favour technological change. Due to poor economic growth and a far from dynamic level of capital formation, there is an overblown informal sector plagued by millions of SMEs. The list of plausible causes goes on and on, and the weight of their relevance is highly dependent on the theoretical perspective of the analysis.
In 2020, labour market conditions worsened as a result of the COVID-19 pandemic, its impact on temporary lockdowns and the collapse of economic activity. At the moment, we do not have detailed information on working conditions by industry, but at the aggregate level the data reveal an acute reduction in employment (especially in formal, full-time employment) and a massive reduction in the economically active population as vast numbers of unemployed persons simply stopped looking for jobs, discouraged by the sharp economic contraction of -9 per cent or more in real GDP in 2020. The proportion of the working poor increased sharply in the first half of the year and has not yet recovered. Despite the increase of 15 per cent in the minimum wage recently announced by the Government for 2022, the projected increase in real GDP of just 3.8 per cent in 2021 (far less than the percentage by which it collapsed in 2020) means that a major improvement in wages, employment conditions and prospects for moving closer to the goal of decent work in Mexico will become elusive in the short run. It should be remembered that the most recent data show that 56.5 per cent of the employed population works either in the informal sector or in an informal occupation within the formal sector.21
In this study, we focused on the relationship between foreign trade and employment, with emphasis on – as ILO correctly stresses – the evolution of decent work. For this purpose, we chose two of Mexico’s manufacturing industries with relevant levels of participation – and very different fortunes – in GVCs: textile and automotive. With all the caveats mentioned in the introduction, we aimed to identify a degree of association (rather than a precise quantitative impact) in the causal relations between trade liberalization and decent work. An implicit assumption was that the increased importance of exports in the value-added generation process in a developing semi-industrialized economy – or in its manufacturing activities – would correlate to better working conditions, with a more significant prevalence of decent work. One assumption that had been explored, but not actually tested, was that Mexico’s trade liberalization since the launch of NAFTA was conducive to an improvement in workers’ conditions, as measured by the ILO decent work indicators. This assumption was not verified. Although, in the auto industry, the hypothesis seems to be valid, perhaps due to the vast presence of foreign firms, in the textile industry it does not appear to be correct.
On a broad or macro scale, our study confirms that the road towards trade liberalization cemented through free trade agreements has placed pressure on Mexico to modernize its labour rules and regulation. But these external pressures, combined with internal political pressures, have only very recently led the Mexican Government to modify the role played by the State in the labour market, abandoning its repressive attitude towards labour democracy in favour of one more aligned with the ILO view. In 2017, these interactive dynamics brought about a much-needed amendment to the most crucial article on labour conditions and organization in the Federal Constitution. As we examined, the progressive wave gained further momentum and legal concrete form as Congress approved a new Federal Labour Act, which came into full effect in 2019. It is too soon to guess what impact this Act and the USMCA will have on decent work in Mexico, but they undoubtedly represent a move in the right direction.
The empirical part of our study examined the association between trade, employment and decent work in Mexico’s textile and auto industries, covering from the early days of NAFTA until the most recent year for which we have reliable information. One of the challenges faced in the study was methodological in nature, namely how to build relevant indicators of the evolution of employment and decent work in these two industries, paying special attention to their interactions in GVCs. For this purpose, we conducted the empirical study based on two complementary approaches. The first was an input–output analysis of a series of world tables, focusing on Mexico’s changing trade and value-added flows in the two chosen industries. This approach shed important light on the evolution of these industries with regard to their participation in GVCs and their employment and value-added generation capacities in Mexico through linkages with other economic activities. The second approach relied on the construction of a time series of decent work indicators for both industries and for manufacturing as a whole. For this task, we relied on the toolkit and guidance on decent work indicators published by the ILO. Drawing on a vast number of statistical sources and databases made available by INEGI and the Secretariat of Labour and Social Welfare, we built a time series from 1996 to 2016 (in some cases 2019) for the four different axes and aspects of decent work: employment access, employment security, labour rights and social dialogue.
In brief, the input–output analysis of international trade in value-added showed that Mexico is a country with relatively little importance regarding the level of domestic value-added in global manufacturing exports, with the exception of its strong relationship with one of the three most important actors on the scene, the United States. Indeed, Mexico’s trade is heavily concentrated towards its northern neighbour. However, during the period of analysis, a few other actors began to gain a presence in these markets, most noticeably China and Europe. Mexico’s participation in GVCs is characterized more as a destination/recipient22 of value-added in foreign trade, rather than as a source/provider of value-added through its exports.
Over the period of analysis, the performance of Mexico’s textile industry – like that in many other countries – worsened as its participation in international markets was kerbed by China, which became the biggest exporter of manufacturing in the world. Mexico experienced a reduction in the number of its commercial partners and, most importantly, in the magnitude of value-added traded with them. However, the textile industry remains an essential generator of employment in the Mexican economy, mainly in activities related to domestic production, both directly in the industry and indirectly through demand for inputs from other industries, measured through forward and backward linkages.
On the other hand, the transport equipment (automotive) industry shows quite a different picture. Between 1996 and 2011, Mexico’s role in trade in domestic value-added in the global network grew in importance. Contrary to the performance of the overall manufacturing sector and the textile industry specifically, in the transport equipment industry Mexico exports more value-added than it imports. Paradoxically, even though it is the main generator of value-added in Mexican exports to GVCs, it is not as relevant as the textile industry to job creation. Its role in job creation is mostly dependent on foreign trade, in particular final exports, although the relative importance of employment in GVC trade increased during the period of analysis. In terms of its backward and forward linkages in employment generation, it falls within the “island” quadrant, meaning that it has fewer connections than average, which reflects the nature of its insertion in world trade. This industry has a high proportion of FVA; in other words, a large share of the inputs that it requires to manufacture exports come from abroad. The number of jobs created domestically therefore tends to be rather low.
One obvious limitation of the empirical input–output analysis is the inability to differentiate between advances towards decent work in the various segments related to production destined for the internal economy, production destined for final exports and production destined for intermediate exports within GVCs. To fill this gap, we built a time series of indicators of decent work, based on ILO guidelines. These indicators led us to conclude that Mexico’s performance in this critical aspect of social and economic development is far from uniform across the four axes considered. In fact, at national level and in the automotive and textile industries specifically, clear progress has been made only in the area of employment security. However, we found that the rest of the decent work indicators pointed to vastly different realities in the textile and automotive industries. In the automotive industry, the percentage of informal workers is one of the lowest at national level, which helps to guarantee a set of labour rights that, unfortunately, are not present in the textile industry. In fact, the creation of jobs in the textile industry has moved in the opposite direction to the decent work model, showing signs of more precarious employment in two aspects: an increase in jobs with extended hours and insufficient wages, and an increase in jobs with an insufficient number of working hours.
In terms of social dialogue, at national level and in both industries, there has been a loss of union power, as reflected in the decrease in the number of contracts linked to collective bargaining and in the number of strikes held and summoned. This is more reflective of a policy of labour repression (sometimes referred to as a national policy of “labour pacification”) rather than an actual improvement in workers’ satisfaction. The labour reform approved in September 2019 aims to strengthen union democracy and promote freedom of association. We believe that, with the implementation of the reform, social dialogue between workers, companies and the Government may improve.
One important conclusion is that the difference in the prevalence (or absence) of decent work in both industries seems to be determined by structural, long-term factors rooted perhaps in the organization of the production process, the types of enterprises present, the forms of ownership, and technical innovations. These undoubtedly also include the varying impact of trade liberalization on each of these two industries and the role that they have played in the overall development strategy as sources of foreign exchange via exports and of foreign direct investment. For example, in the case of the textile industry, 95 per cent of companies are small businesses or microenterprises (that is, they have no more than ten employees). Only 0.28 per cent of companies in the industry have more than 250 employees, compared with the automotive industry, where 38 per cent of companies are microenterprises and 26 per cent are large enterprises. Another difference is the relevance of foreign direct investment, which is considerably more important in the automotive industry than in the textile industry. In any case, there is evidently enormous room for improvement in both the textile and the automotive industries with regard to enhancing working conditions and achieving decent work as defined by the ILO.
Finally, as Solís stresses: “The relationships between the four axes or aspects of decent work [and trade] and their empirical verification is a task that is just beginning. There are still sector measurement and precision problems that must be developed, perhaps with the aid of statistical tools that can cope with asymmetry in the social and economic relationships. A full study of these activities could perhaps be a further stage of this study.”
It is important to point out that the National Development Plan 2020–24 developed by Mexico’s Ministry of Labour has, as one of its four key priorities, the promotion of decent work and labour productivity with the help of labour inspections to ensure compliance with official norms and regulations (Mexico 2020). As a first step in this direction, the Ministry has targeted three main groups: domestic workers, rural labourers, and employees that have a type of formal contract that excludes social security coverage.23 Moreover, in 2020, even in the midst of the pandemic, the Ministry implemented a series of measures to promote decent work by, in particular, combating certain types of outsourcing, increasing social protection for domestic workers, promoting voluntary private–public agreements to ensure compliance with labour regulations without recourse to inspection, increasing accident prevention in the workplace, simplifying labour inspections, preventing child labour and combating gender discrimination.24 Given that labour inspectors are a key tool in Mexico’s decent work strategy, the federal budget should allocate funds as required to swiftly and significatively strengthen the Ministry’s capacities in this area.
In spite of the progress made in the above areas and, in general, in the overhaul of Mexico’s institutional labour framework in the direction required by the USMCA, there is still much to be done to expand new collective bargaining agreements, set up independent courts and unions and strengthen the capacity of Mexican labour inspectors to enforce the rules of the labour reform.
We are convinced that, as long as the Mexican economy remains stuck in a trap of slow long-term expansion – which has been made dramatically worse by the COVID-19 pandemic and the global recession – employment and labour conditions will most likely fail to improve significantly and may even deteriorate. Progress towards decent work may be severely derailed. We believe that a new agenda for inclusive and sustainable development is needed, two elements of which must be an in-depth fiscal reform committed to equality and an active industrial policy in the context of a Green New Deal. In the absence of such an agenda, the legal and regulatory developments to overhaul the labour market, the strengthening of labour inspections and the menace of sanctions under the USMCA may be insufficient to make decent work a reality for all but a small proportion of the employed population. Moreover, as mentioned above, the COVID-19 pandemic and its repercussions on global trade and productive activity, as well as the lack of countercyclical fiscal policies in Mexico, are severely affecting the labour market, making it even more precarious as the economy is plunged into its sharpest and most prolonged contraction in nearly a century. What policies and programmes will be put in place to address this dramatic situation? What will be the short- and long-term impact of this adverse economic and health situation on Mexico’s quest to achieve decent work? These are fundamental questions, the answers to which will shape the present and future for all Mexicans.
Annexes
Annex 1. Main provisions of trade agreements applicable to Mexico
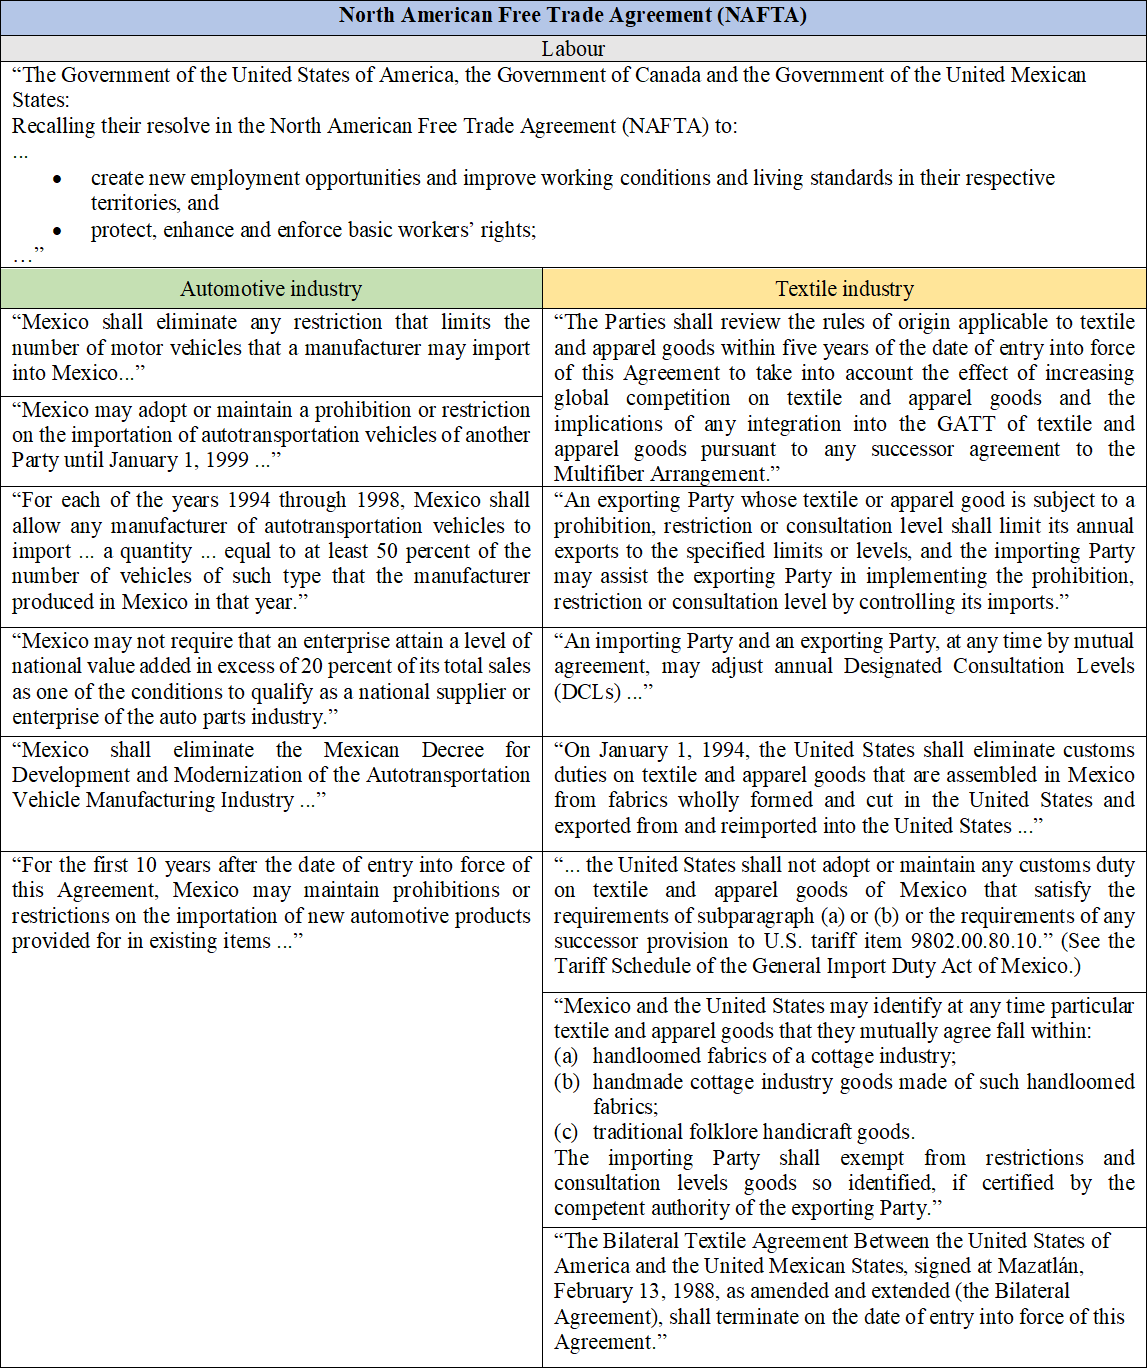
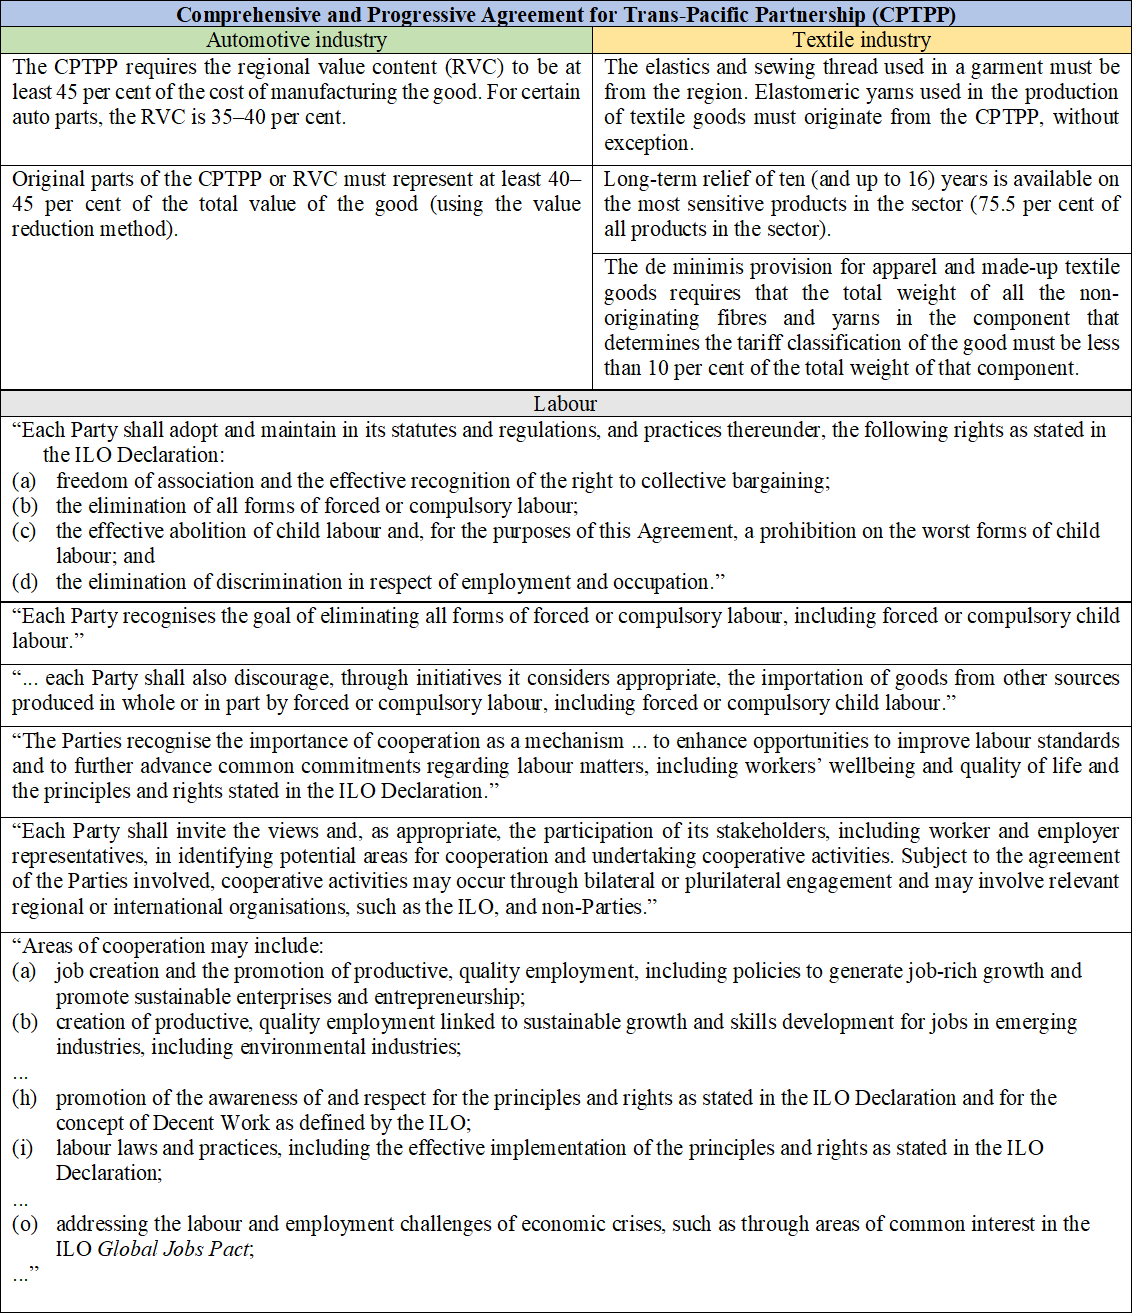
Source: Based on DOF, 2018.
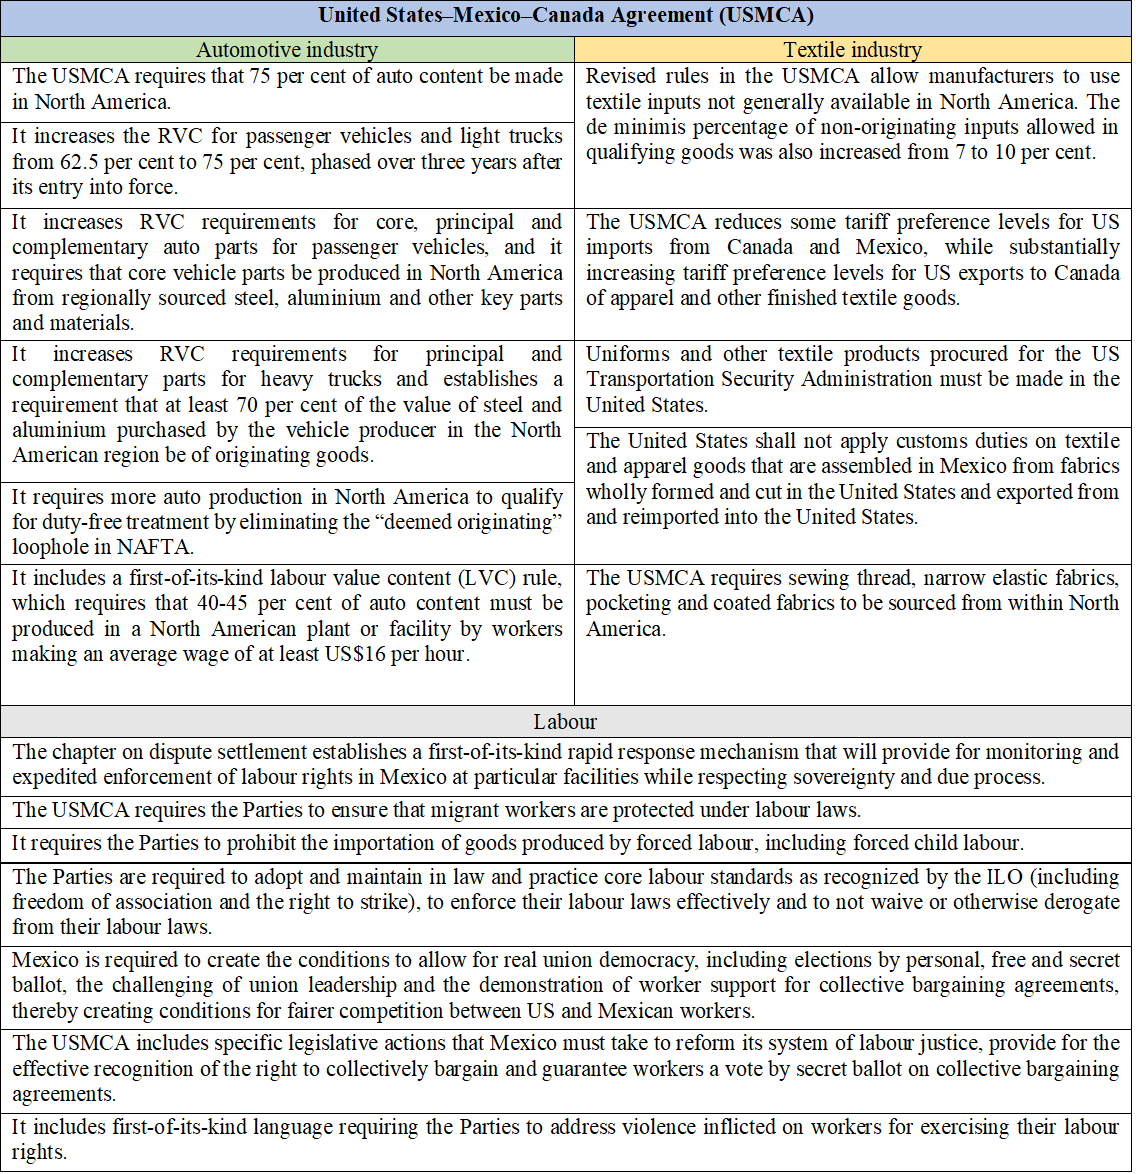
Annex 2. World Input–Output Database (WIOD) countries and territories
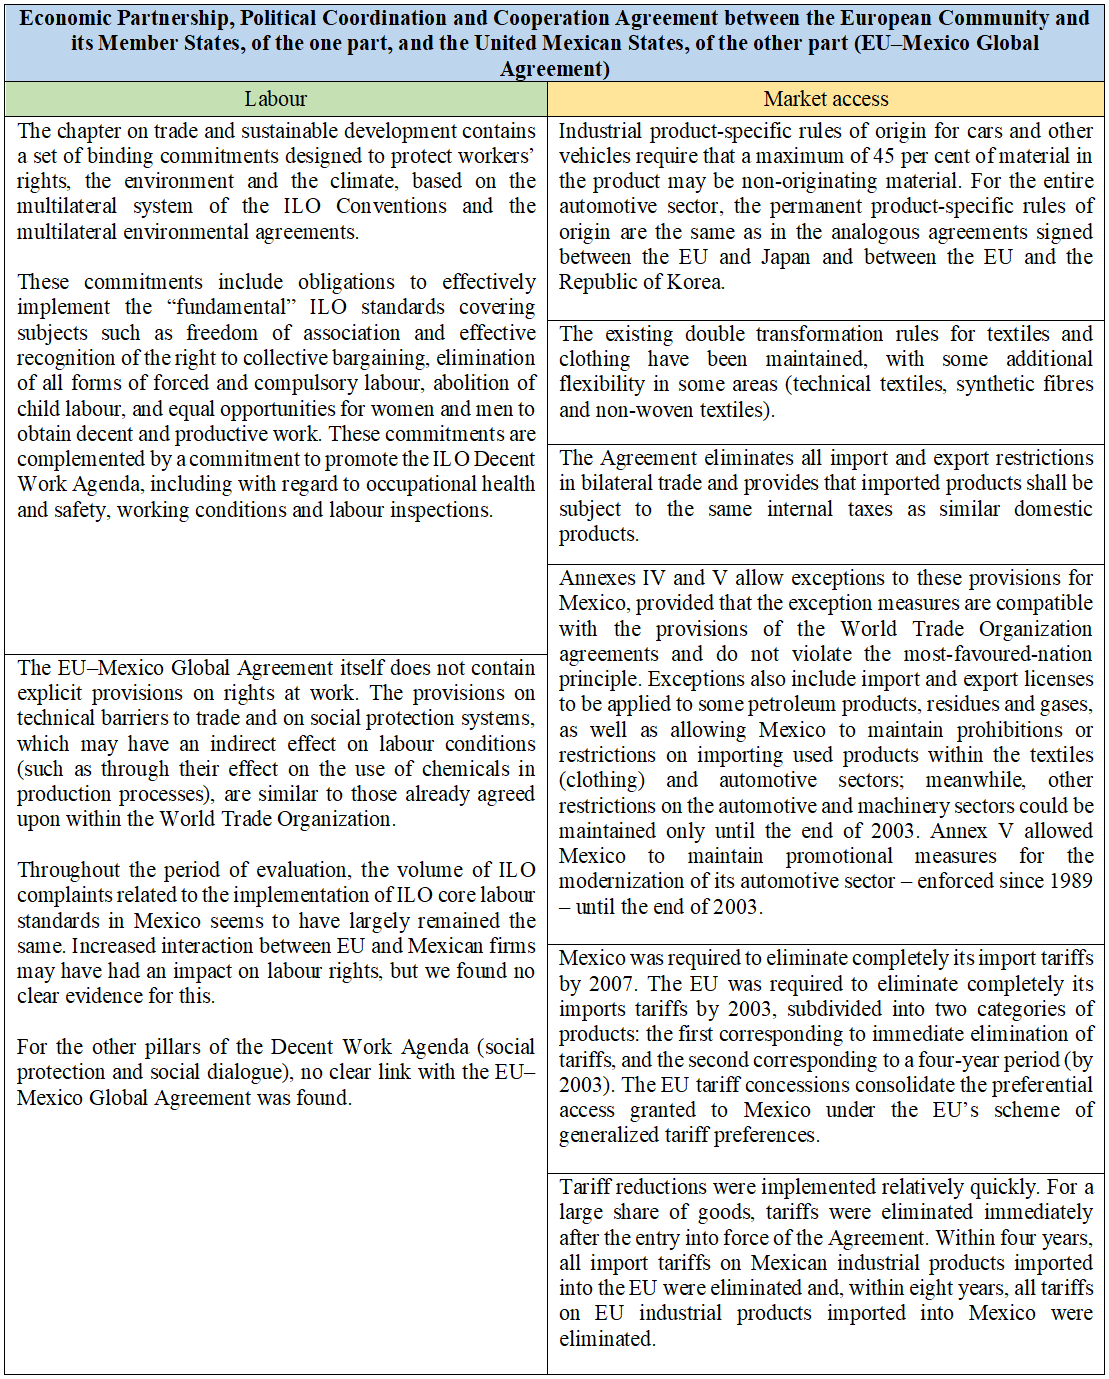
|
Acronym |
Country |
Group |
Acronym |
Country |
Group |
|
|---|---|---|---|---|---|---|
|
AUS |
Australia |
AUS |
|
Ireland |
EU15 |
|
|
AUT |
Austria |
EU15 |
|
Italy |
EU15 |
|
|
BEL |
Belgium |
EU15 |
|
Japan |
JPN |
|
|
BGR |
Bulgaria |
EU13 |
|
Republic of Korea |
KOR |
|
|
BRA |
Brazil |
BRA |
|
Lithuania |
EU13 |
|
|
CAN |
Canada |
CAN |
|
Luxemburg |
EU15 |
|
|
CHN |
China |
CHN |
|
Latvia |
EU13 |
|
|
CYP |
Cyprus |
EU13 |
|
Mexico |
Mexico |
|
|
CZE |
Czechia |
EU13 |
|
Malta |
EU13 |
|
|
DEU |
Germany |
EU15 |
|
Netherlands |
EU15 |
|
|
DNK |
Denmark |
EU15 |
|
Poland |
EU13 |
|
|
ESP |
Spain |
EU15 |
|
Portugal |
EU15 |
|
|
EST |
Estonia |
EU13 |
|
Romania |
EU13 |
|
|
FIN |
Finland |
EU15 |
|
Russia |
RUS |
|
|
FRA |
France |
EU15 |
|
Slovakia |
EU13 |
|
|
GBR |
United Kingdom |
EU15 |
|
Slovenia |
EU13 |
|
|
GRC |
Greece |
EU15 |
|
Sweden |
EU15 |
|
|
HUN |
Hungry |
EU13 |
|
Turkey |
TUR |
|
|
IDN |
Indonesia |
IDN |
|
Taiwan, China |
TWN |
|
|
IND |
India |
IND |
|
United States |
USA |
Annex 3. Methodology: Measuring job creation related to domestic and trade activities
Input–output analysis is a common and useful approach for estimating the contribution of exports to job creation. The model in matrix form is described as , where
For this purpose, we calculated employment coefficients for each sector by dividing sector employment by output in that same sector. This information, when arranged as a diagonal matrix (with employment coefficients placed along the main diagonal and zero elsewhere), pre-multiplies the Leontief inverse, allowing us to obtain the number of jobs directly and indirectly needed for the production of one unit of final demand in a national set-up. If we also post-multiply this result by a matrix of exports, , we obtain a measure of the number of jobs needed to produce net exports: . The labour coefficients matrix, , may represent different categories of employment, for example according to skill level or gender. In this sense, we can track labour outcomes in terms of the value-added paid to the labour force in the production of goods according to different classifications of jobs (gender or skill level, among others).
This idea, however, must be reviewed in the light of GVCs; if we want to calculate the number of jobs generated by a country’s exports, we have to take into account that those exports include value-added from inputs that come from other countries. The result can be misleading because we would be ignoring cross-border production linkages, which are better accounted for by trade in value-added statistics.
Jiang (2013), for example, used the 2014 release of the WIOD tables to analyse five categories of effects that trade activities had on employment during the 1995–2009 period, specifically the labour content in exports, in imports, in the import content of exports, in the export content of imports, and in intermediates contained in imports from a third country, the latter three categories representing GVC activities. Jiang’s paper focused on jobs created through the labour demand of a country, irrespective of whether they were created within the country or elsewhere.
Given our interest in estimating the number of jobs created in Mexico by domestic production versus those created by trade-related activities, we adopted the suggestions of Wang et al. (2017) and classified productive activities into broad types depending on whether they were domestic or whether they involved production-sharing between two or more countries. The matrix equation is the number of jobs involved in selected activities from a source country (or sector) that are directly or indirectly involved in final production in a given country or sector. Where is the global inverse Leontief matrix, represents a diagonal matrix with information on final production for domestic consumption, is the diagonal matrix of final products exports, and is an off-diagonal block matrix of imported input coefficients.
The equation identifies, for each country-sector, three types of jobs associated with production activities:
-
: Jobs used to produce and consume goods domestically, in which there is no cross-border trade.
-
: Employment incorporated into exports of final goods. This domestic factor content crosses national borders only for consumption (of goods and services, as well as capital) in the other country. We classify these as jobs generated in “traditional” trade.
-
: Employment included in exports/imports of intermediate goods and services. Production activities in different countries use this value, exported from the origin country, to produce their exports. Hence, the jobs created in this category are part of the interchange of production between countries or GVC activities.
Using WIOD tables for the chosen years, we can calculate the matrices. is obtained using data on the number of persons in employment taken from the Socio-Economic Accounts of the 2014 WIOD release and the output vector from WIOD. More detailed information on the construction of the Socio-Economic Accounts is available in Gouma, Timmer and de Vries (2014).
The resulting terms correspond to matrices of dimensions (41x35, 41x35); to account for the number of persons engaged in each type of activity, we therefore obtained the sum of each row. For the first two terms, it is possible to assess whether those jobs correspond to the industry under analysis or whether they relate to inputs from other industries –making them indirect jobs – because they correspond to diagonal matrices. In the case of the third term, GVC trade, we cannot differentiate between jobs generated inside and outside each industry, as such jobs include not only those pertaining to inputs that originated in the country of analysis but also those pertaining to inputs from all other countries and to those embedded in intermediate imports.
Another way to measure direct and indirect job creation is through linkage analysis. A typical backward linkage analysis shows the degree to which the output of sector
As our interest lies in employment generation, we pre-multiplied the Leontief matrix by the employment coefficients present in . So, to calculate linkages, it is enough to perform the sum for each column of the elements
Annex 4. Automotive and textile industries: Table of equivalences between the 1993 Mexican National System of Accounts (SNA) and the 2002 North American Industry Classification System (NAICS)
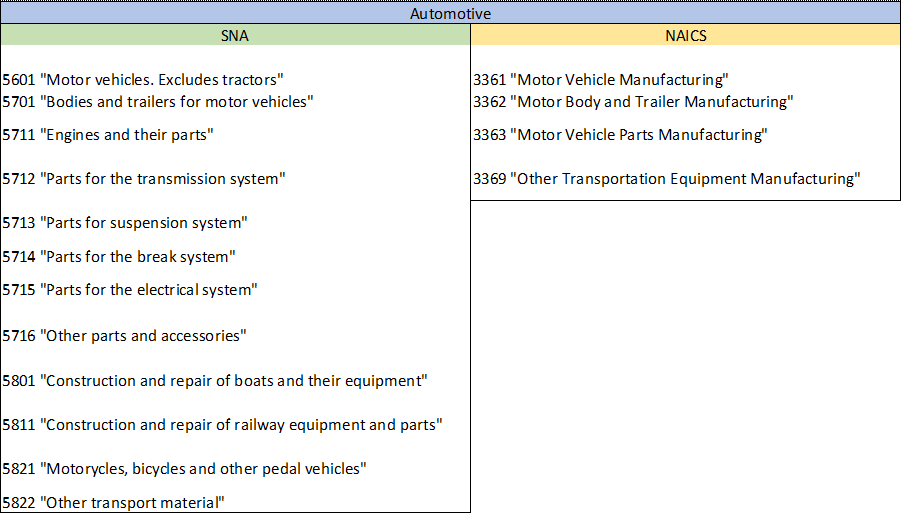
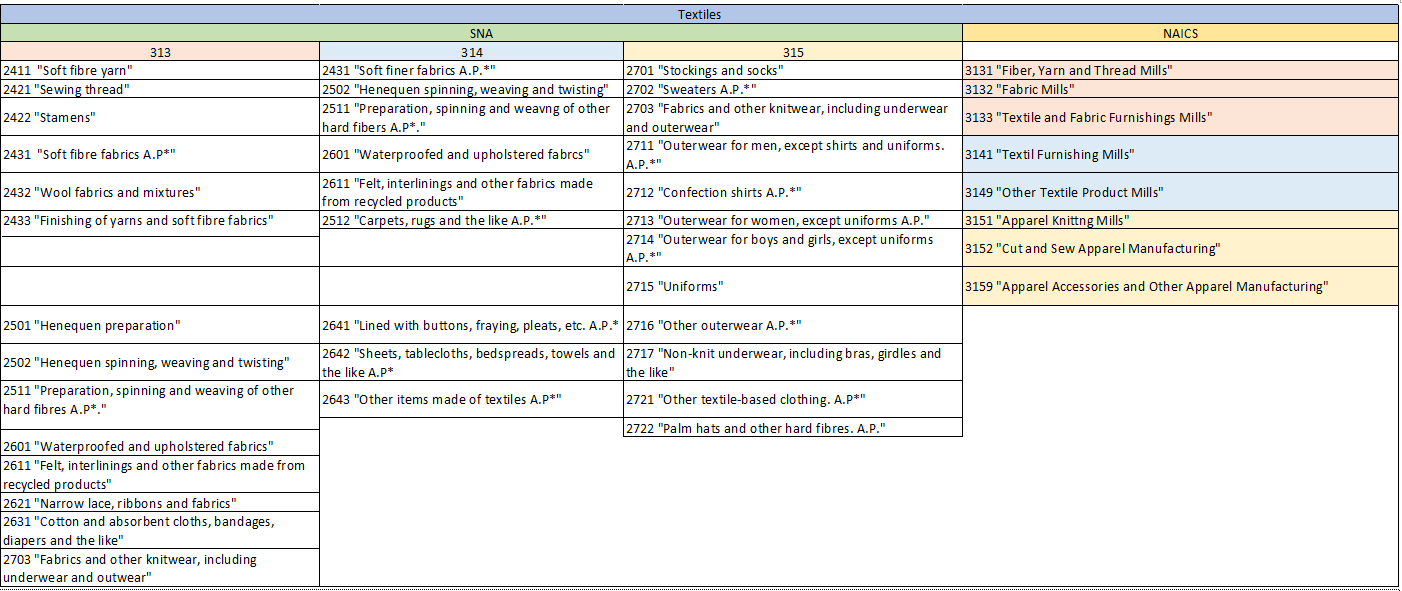
Source: Own elaboration, based on INGI (2013 and 2018).
Annex 5. Methodology: Mexico’s decent work indicators (1996–2019)
The estimation of decent work indicators for the Mexican economy and, more precisely, for the textile and automotive industries was based on the 2013 ILO manual of decent work indicators and the first edition of the ILO biannual newsletter entitled
Axis 1. Employment access indicators
Measurement objective: Percentage of the working age population (15 years and over) that participates in the labour force.
Data sources: INEGI (National Employment Survey and National Occupation and Employment Survey)
Method of computation:
Measurement objective: Percentage of the labour force that is not working but is searching for a job.
Data sources: INEGI (National Employment Survey and National Occupation and Employment Survey)
Method of computation:
Measurement objective: Percentage of the labour force represented by the unemployed population, plus the employed population in pursuit of another job.
Data sources: INEGI (National Employment Survey and National Occupation and Employment Survey)
Method of computation:
100
Measurement objective: Percentage of the employed population represented by working age individuals who need, and are available, to offer more hours of work than their current occupation allows them to perform.
Data sources: INEGI (National Employment Survey and National Occupation and Employment Survey)
Method of computation:
Measurement objective: INEGI defines persons in “precarious employment” as: employed persons who work less than 35 hours a week for market reasons; employed persons who work more than 35 hours a week and have a monthly income below the minimum wage; and employed persons who work more than 48 hours a week and earn the equivalent of no more than two times the minimum wage. According to the ILO (2013c), the precarious employment rate is the percentage of the employed population in precarious employment (as defined by INEGI).
Data sources: INEGI (National Employment Survey and National Occupation and Employment Survey)
Method of computation:
Measurement objective: Proportion of the employed population who are labour-vulnerable owing to the nature of the economic unit in which they work and/or whose labour relationship or dependency is not recognized by their source of employment.
Data sources: INEGI (National Employment Survey and National Occupation and Employment Survey)
Method of computation:
Measurement objective: Proportion of the employed population that earns the equivalent of no more than two times the minimum wage.
Data sources: INEGI (National Employment Survey and National Occupation and Employment Survey)
Method of computation:
Measurement objective: Percentage of the employed population that receives a salary from the economic unit for which they work or for which they carry out activities.
Data sources: INEGI (National Employment Survey and National Occupation and Employment Survey)
Method of computation:
Axis 2. Equal opportunity and treatment in employment
Measurement objective: Ratio between the unemployment rate for women and the unemployment rate for men.
Data sources: INEGI (National Employment Survey and National Occupation and Employment Survey)
Method of computation:
Measurement objective: Ratio of employed women who earn three or more times the minimum wage to employed men who earn three or more times the minimum wage.
Data sources: INEGI (National Employment Survey and National Occupation and Employment Survey)
Method of computation:
Measurement objective: Percentage of women of working age who are employed.
Data sources: INEGI (National Employment Survey and National Occupation and Employment Survey)
Method of computation:
Axis 3. Employment security
Measurement objective: Percentage of workers insured by the IMSS who have had an accident at work
Data sources: STPS and IMSS
Method of computation:
Measurement objective: Percentage of the employed population who are permanent workers registered with the IMSS.
Data sources: INEGI (National Occupation and Employment Survey) and IMSS
Method of computation:
Axis 4. Social dialogue
Measurement objective: Total number of summons.
Data sources: STPS
Measurement objective: Total number of strikes.
Data sources: STPS
Measurement objective: Total number of collective bargaining agreements.
Data sources: STPS
References
Alcalde, Arturo. 2013. “El
Amador, João and Sónia Cabral. 2015. “A Basic Network Perspective”. In
Argerey, Patricia, Inmaculada Hurtado and Thierry Baudassé. 2020. “The Labour Side Agreement in NAFTA: An Example to Follow?”, Go-EuroMed Working Paper No. 0618.
Arto, Iñaki, José M. Rueda-Cantuche, Antonio F. Amores, Erik Dietzenbacher, Nuno Sousa, Letizia Montinari and Anil Markandya. 2015.
Banxico. 2020a. “Sistema de Información Económica”. https://www.banxico.org.mx/SieInternet/.
———. 2020b. “Cambios estrucutrales en el mercado laboral”, presentation from Jonathan Heath at UNAM, UAM and Anahuac University in July 9th, 2020.
Bensusán, Graciela. 2019. “La revolución sindical”.
———. 2020. “The Transformation of the Mexican Labour Regulation Model and its Link to North American Economic Integration”, ILO Working Paper No. 15.
Bensusán, Graciela and Arturo Alcalde. 2013. “El sistema de justicia laboral en México: situación actual y perspectivas”.
Bensusán, Graciela and Kevin J. Middlebrook. 2012a. “El sindicalismo y la democratización en México”.
———. 2012b. Organized Labour and Politics in Mexico: Changes, Continuities and Contradictions. London: Institute for the Study of the Americas.
Blanke, Svenja. 2007. “El sindicalismo mexicano: entre la marginación y la recomposición”.
Canada. 2020. “Consolidated TPP Text – Chapter 19 – Labour”. https://www.international.gc.ca/trade-commerce/trade-agreements-accords-commerciaux/agr-acc/tpp-ptp/text-texte/19.aspx?lang=eng.
———. 2020. “North American Free Trade Agreement (NAFTA)”. https://www.international.gc.ca/trade-commerce/trade-agreements-accords-commerciaux/agr-acc/nafta-alena/fta-ale/index.aspx?lang=engand_ga=2.60463341.153121563.1595469300-1279144610.1595469300.
Cárdenas Castro, Hilda Lorena and Enrique Dussel Peters. 2007. “México y China en la cadena hilo-textil-confección en el mercado de Estados Unidos”.
Cárdenas Sánchez, Enrique. 2015.
Cordera, Rolando. 2012. “Manifiesto por la construcción de un nuevo modelo democrático de Estado de Bienestar”.
Cordera, Rolando and Enrique Provencio, coords. 2019. “Consideraciones y propuestas sobre la estrategia de desarrollo para México”. Mexico: Programa Universitario de Estudios del Desarrollo, Grupo Nuevo Curso de Desarrollo, UNAM.
Dussel Peters, Enrique. 2003. “Ser maquila o no ser maquila, ¿es ésa la pregunta?”.
Dussel Peters, Enrique and Kevin P. Gallagher. 2013. “NAFTA’s Uninvited Guest: China and the Disintegration of North American Trade”.
European Commission. 2020. “New EU-Mexico Agreement: The Agreement in Principle and its Texts”. https://trade.ec.europa.eu/doclib/press/index.cfm?id=1833.
González Guerra, José Merced and Antonio Gutiérrez Castro, coords. 2010.
Gouma, Reitze, Marcel P. Timmer and Gaaitzen J. de Vries. 2014. “Employment and Compensation in the WIOD Socio Economic Accounts (SEA): Revisions for 2008–2009 and New Data for 2010–2011”. Brussels: WIOD, Seventh Framework Programme.
Hummels, David, Jun Ishii and Kei-Mu Yi. 2001. “The nature and growth of vertical specialization in world trade”.
ILO (International Labour Organization). 1999.
———. 2008. Decent Work Indicators for Asia and the Pacific: A Guidebook for Policy-makers and Researchers. ILO Regional Office for Asia and the Pacific.
———. 2013a.
———. 2013b. Decent Work Country Profile: A Sub-national Perspective in Brazil.
———. 2013c. Decent Work Indicators: Guidelines for Producers and Users of Statistical and Legal Framework Indicators: ILO Manual – Second Version.
Independent Mexico Labor Expert Board. 2020. Interim report to the Interagency Labor Committee and the United States Congress. 15 December 2020.
INEGI (National Institute of Statistics and Geography). 2013. S
———. 2018a. Valor agregado de exportación de la manufactura global.
———. 2018b. Sistema de Clasificación Industrial de América del Norte, México 2018, SCIAN México 2018- Clasificación Industrial Internacional Uniforme Rev. 4, CIIU Rev. 4.
———. 2020. Sistema de Cuentas Nacionales de México.
Jiang, Xiao. 2013. “Trade and Employment in a Vertically Specialized World”, ILO Research Paper No. 5.
Johnson, Robert C. and Guillermo Noguera. 2012. “Accounting for Intermediates: Production Sharing and Trade in Value Added”.
King and Spalding Corporation. 2020. “Companies Face Risk from the USMCA’s New Rapid Response Mechanism to Enforce Labor Rights”. 15 July 2020.
Koopman, Robert, William Powers, Zhi Wang and Shang-Jin Wei. 2011. “Give Credit Where Credit is Due: Tracing Value Added in Global Production Chains”, HKIMR Working Paper No.31/2011.
Koopman, Robert, Zhi Wang and Shang-Jin Wei. 2014. “Tracing Value-Added and Double Counting in Gross Exports”.
Leontief, Wassily. 1936. “Quantitative Input and Output Relations in the Economic System of the United States”.
DOF (Diario Oficial de la Federación). 2012.
———. 2018. “Tratado Integral y Progresista de Asociación Transpacífico (CPTPP)”, 29 November. 2018.
———. 2020. Programa Sectorial de Trabajo y Previsión Social 2020-2024, 24 June 2020.
Mexico, Secretariat of Labour and Social Welfare. n.d. “Sistema de Información Estadística Laboral”. http://siel.stps.gob.mx:304/.
Meyer-Stamer, Jörg and Frank Wältring. 2007. “Value Chain Analysis and ‘Making Markets Work for the Poor’ (M4P): Poverty Reduction through Value Chain Promotion”. German Agency for Technical Cooperation (GTZ).
Miller, Ronald E. and Peter D. Blair. 2009.
Moreno-Brid, Juan Carlos. 2013. “Industrial Policy: A Missing Link in Mexico’s Quest for Export‐led Growth”.
———. 2020. “Pandemic, Public Policy and the Outlook for the Mexican Economy in 2020”.
Moreno-Brid, Juan Carlos and Jaime Ros. 2009. Development and Growth in the Mexican Economy: A Historical Perspective. Oxford University Press.
Moreno-Brid, Juan Carlos, Joaquín Sánchez Gómez and Luis Ángel Monroy Gómez Franco. 2020. “Mexico’s Latest –and Probably Last– Package of Market Reforms (2012-18): The Remains of the Day”.
Moreno-Brid, Juan Carlos, Esteban Pérez-Caldentey, Jamel Kevin Sandoval and Ismael Valverde. 2016. “Inversión, cambio estructural y crecimiento”.
Moreno-Brid, Robert Blecker, Isabel Salat & Joaquín Sanchez, 2018, “Modernización del TLCAN y sus implicaciones para el desarrollo de la Economía Mexicana” Economia Mexicana (3): 249-298.
Moreno-Brid, Juan Carlos, Joaquín Sánchez Gómez, Stefanie Garry. 2021. “The syncopated dance of Mexico’s industrial policy”. In Veltmeyer (ed),
Puyana, Alicia. 2018. “Trump Politics towards Mexico: Renegotiating NAFTA while Invocating the Monroe Doctrine”.
Quintana, Enrique. 2020. “A veces, la IP es la principal promotora de AMLO”.
Rasmussen, P. Norregaard. 1957.
Ruiz Durán, Clemente. 2013. “Nueva política industrial: ¿Opción para un desarrollo sustentable e inclusivo en México?”.
Samaniego, Norma. 2008. “El crecimiento explosivo de la economía informal”.
Sánchez Juárez, Isaac Leobardo and Juan Carlos Moreno-Brid. 2016. “El reto del crecimiento económico en México: industrias manufactureras y política industrial”.
Sander, John L. , Steven D. Baderian and Joseph J. DiPalma. 2017. “Labor Aspects in North America Free Trade Agreement (NAFTA) Renegotiation”.
Stehrer, Robert. 2012. “Trade in Value Added and the Valued Added in Trade”, wiiw (Vienna Institute for International Economic Studies) Working Paper No. 81.
Taglioni, Daria and Deborah Winkler. 2016.
Timmer, Marcel P., Erik Dietzenbacher, Bart Los, Robert Stehrer and Gaaitzen J. de Vries. 2015. “An Illustrated User Guide to the World Input-Output Database: The Case of Global Automotive Production”.
UN (United Nations). 2008. International Standard Industrial Classification of All Economic Activities (ISIC), Rev. 4, Statistical Papers Series M, No. 4, Rev. 4.
UNDP (United Nations Development Programme). n.d. “Sustainable Development Goals”. https://www.undp.org/content/undp/en/home/sustainable-development-goals.html.
USITA (United States International Trade Administration). n.d. “Understanding USMCA”. https://www.trade.gov/usmca-dayone-0.
USTR (United States Trade Representative). 2020. “United States–Mexico–Canada Trade Fact Sheet: Rebalancing Trade
———. n.d. “The United States–Mexico–Canada Agreement Fact Sheet: Automobiles and Automotive Parts”. https://ustr.gov/sites/default/files/files/Press/fs/USMCA/USMCA-Autos_and_Auto_Parts.pdf.
Vergara, Rosalía. 2015. “Presume la STPS cero huelgas y menor informalidad”.
Wang, Zhi, Shang-Jin Wei and Kunfu Zhu. 2013. “Quantifying International Production Sharing at the Bilateral and Sector Levels”, NBER (National Bureau of Economic Research) Working Paper No. 19677.
Wang, Zhi, Shang-Jin Wei, Xinding Yu and Kunfu Zhu. 2017. “Measures of Participation in Global Value Chains and Global Business Cycles”, NBER Working Paper No. 23222.
World Bank. “DataBank: World Development Indicators”. https://databank.worldbank.org/source/world-development-indicators.
Acknowledgements
The authors acknowledge the valuable comments and suggestions provided by Marva Corley-Coulibaly, her colleagues at the Research Department of the ILO, Valentín Solís and the participants in the workshop on trade and decent work held in Geneva on 8 October 2020 by the ILO Research Department and the European Commission. This study would not have been possible without the support of Alejandro Encinas and Roberto Gerhard Tuma, who gave us access to the splendidly organized and professionally built database of the Ministry of Labour of Mexico.

