


Costs and benefits of investing in transformative care policy packages: A macrosimulation study in 82 countries
Abstract
This study examines the annual investment required for universal, collectively funded childcare and long-term care services, as well as adequate paid care leave and breastfeeding breaks to parents in 82 countries. Simulations of policy reforms show that extending paid leave and breastfeeding breaks to all employed parents (including those in informal employment) at an adequate level of pay would require about 0.3 per cent of GDP of annual investment by 2035. Extending universal childcare would require additional annual investment of 1.5 per cent of GDP by 2035 over and above current public spending of 0.3 per cent. For long-term care, the annual additional investment by 2035 would be 2.5 per cent of GDP, over and above current public spending of 0.6 per cent. Such care investments could also provide powerful economic stimulus, creating up to nearly 300 million jobs by 2035, and recouping some of the investment through increased tax revenue.
JEL classification: C67, H51, J16
Keywords: maternity leave, parental leave, childcare, long-term care services, care economy, social infrastructure, economic stimulus, investment, input–output analysis, gender equality, sustainable development goals
Key findings
-
Funding high-quality universal care provision is an investment in the care economy and social infrastructure, with long-term and wider benefits accrued beyond their direct users.
-
Not only would care investment address care needs, it could also provide a powerful economic stimulus to help deal with the aftermath of the COVID-19 pandemic, which saw many jobs and livelihoods destroyed.
-
Together with increased provision of paid care leave, such investment has gender-equalizing effects on employment and caring roles.
-
The estimations in this report simulate the annual investment costs and potential employment creation by 2030 and 2035 of instituting universal childcare, paid childcare leave, breastfeeding breaks and long-term care services, covering 82 countries representing 87 per cent of the world employment and 94 per cent of the world GDP.
-
Following ILO Conventions and Recommendations on maternity protection, workers with family responsibilities, social protection and decent work as well as the UN 2030 Agenda for Sustainable Development, policy parameters were chosen to close the country-specific childcare gap between the end of childcare-related leave (maternity, paternity and parental leave) and entry into the school system, as well as providing free formal long-term care to all those in need.
-
Expanding paid childcare leave to each employed parent at an adequate level of pay (67 per cent of average earnings), as well as breastfeeding breaks, would require spending an additional US$269 billion in 2030, and a further US$109 billion by 2035 (in 2019 prices), or 0.3 per cent of 2035 GDP across all regions, ranging from 0.2 per cent in Asia to 0.5 per cent in Africa.
-
Universal provision of childcare after the end of paid leave would require additional annual spending of about US$1.6 trillion by 2030 and a further US$291 billion by 2035 (in 2019 prices), or 1.5 per cent of 2035 GDP, ranging between 1.1 per cent in Europe and 4.2 per cent in Africa.
-
Universal provision of long-term care services to all adults and children with care needs would require additional annual spending of about US$2.5 trillion by 2030 and a further US$578 billion by 2035, or 2.5 per cent of 2035 GDP, ranging from 1.9 per cent in Europe to 2.8 per cent in upper-middle- and high-income countries in Asia.
-
These investments could generate 280 million jobs by 2030, and a further 19 million by 2035, for a total of 299 million jobs. Of these jobs, by 2035, 233 million (78 per cent) will go to women and 251 million (84 per cent) will be formal jobs. Economies would be transformed in more caring ways, including with employment in care services representing about 8 per cent of the total employment post-investment (up from 1 per cent in 2019), closer to shares found in the Nordic countries that already have near-universal provision.
-
By 2035, employment rates would increase by 6.3 percentage points overall, ranging from 5.5 percentage points in Europe to 7.5 in Africa. Employment rates of women would rise by 10 percentage points overall, ranging from 9 percentage points in Europe and lower-income countries in Asia to 12 percentage points in the Arab States.
-
The gender gap in employment rates would fall by around 7.5 percentage points in all regions, and would close almost completely or become negative in a third of the countries studied.
-
By 2035, GDP would be higher than its projected baseline by 3.6 per cent across all regions and by up to 6 per cent in Africa. Tax revenue from increased earnings and employment would rise as well, reducing the total funding requirement of care policy packages from 4.2 per cent of GDP (before taxes) to a net 3.2 per cent of GDP (after taxes).
While transformative benefits extend beyond financial concerns, funding the investment beyond immediate tax revenue would require mobilizing diverse resources, from domestic progressive tax reforms that increase the tax base (including social security coverage) to international cooperation on debt restructuring and fighting corruption and illicit financial flows.
Introduction
The COVID-19 pandemic has laid bare the acute care crisis in most economies around the world, which rely on unpaid care work and impose a heavy burden on women (ILO 2020). Investment in a care-led recovery is not only necessary to address the care deficits around the world that pre-dated the pandemic, but also to provide a powerful economic stimulus. A care-led recovery would also be more gender-equal than equivalent investment in many other industries (De Henau and Himmelweit 2021).
Care services are a component of the so-called care economy and a form of social infrastructure due their wide-ranging benefits, including making sure the population is healthy and able to function, and thus participate in the economy. As such, care services require direct public investment to ensure quality and sustainability of provision (De Henau et al. 2016; ILO 2018a). Without people being well looked after, an economy cannot function and prosper, in the same way that without telecommunications and transport means, an economy would grind to a halt. Yet in most countries, spending on education, healthcare and social care services is not considered as spending on infrastructure, despite the wider benefits to society such services provide beyond their direct users. Without support from the State, unpaid carers – an overwhelming majority of whom are women – would not be able to access gainful employment and economic independence. Many governments are also reluctant to consider public spending on these services as constituting an investment, unlike, for example, spending on construction projects (which ironically may include the building of education and care facilities), despite both care services and construction projects offering longer-term benefits to the economy. Childcare and long-term care services of high quality confer educational, health and productivity gains that improve the well-being and quality of life of care recipients as well as reduce any crisis spending down the line (Huston, Bobbitt, and Bentley 2015; UN Women 2019).
This study estimates the annual public investment required to provide adequately paid individual maternity, paternity and parental leave, extending current provision to each parent and to informal economy workers in line with international labour standards and with a view to closing current policy gaps in legislation and provision. It further examines the annual public investment costs of providing adequate free universal provision of both childcare and long-term care of high quality. It then simulates the short-term employment benefits of such a package of investments. This work builds on previous work by the ILO on routes towards achieving the 2030 Agenda for Sustainable Development and implementing social protection systems, including social protection floors (ILO 2018a; ILO 2021a; Bierbaum and Schmitt 2022).
The study also builds on and extends previous work by Ilkkaraçan and Kim (2019) on simulating investment in education and health and social care for 46 countries. In this study, the focus is on gender-equalizing policies of paid childcare leave, breastfeeding breaks, childcare and long-term care provision. This study presents estimations covering 82 economies from around the world, representing all regions, income levels and welfare regimes (see appendix table A.1 for a full list of countries/territories). This represents, we believe, the largest degree of coverage ever undertaken at such a level of detail on policy needs and public spending related to the care economy. In total these countries and economies represented about 87 per cent of the world’s employed population and 94 per cent of the world’s GDP in 2019.
The study also simulates the employment effects that such investment would produce, using input–output multiplier techniques to derive total employment creation and the effect on gender employment gaps and tax revenue.
Scope and conceptual framework
The conceptual framework follows from the seminal ILO report
Investing in the care economy ties in well with the 2030 Agenda for Sustainable Development and the ILO Decent Work Agenda. It is central to the ILO Declaration for the Future of Work (ILO 2019) and the Global call to action for a human-centred recovery from the COVID-19 crisis that is inclusive, sustainable and resilient (ILO 2021a). The 2021 International Labour Conference Resolution concerning the second recurrent discussion on social protection (social security), which serves as a follow-up to the 2008 ILO Declaration on Social Justice for a Fair Globalization, sets forward a framework for universal social protection and also includes a reference to the care economy (ILO 2021b). These frameworks have been endorsed by governments, employers’ organizations and workers’ organizations from all over the world and are grounded on international labour standards. “Large-scale investment in the care economy” is also a key transformative measure of the UN Secretary-General’s Our Common Agenda (UN 2021a) and, more recently, the Global Accelerator on Jobs and Social Protection for Just Transitions initiative to accelerate the implementation of the Sustainable Development Goals (SDGs) by 2030. The Accelerator will aim to create at least 400 million jobs, primarily in the green and care economies, and contribute to extending social protection floors to the people currently not covered by any social protection measure (about 4 billion men, women and children) by 2030 (UN 2021b).
Taking a progressive approach, the modelling rationale for this study aims at building and strengthening existing provisions to progressively set up a system of high-quality, affordable and comprehensive provision of long-term care (LTC) services for children and adults with disabilities and older persons with care needs as well as early childhood care and education (ECCE), together with expanded provision of adequately paid childcare leave for both parents. For young children, the aim is to close the so-called “care policy gap”, defined by Koslowski et al. (2021) as the difference (in months or years) between the end of adequately paid childcare leave provided after the birth of a child and the start of an ECCE entitlement (when available) or mandatory primary school age. For disabled and frail adults, the care gap to close could be seen as the heavy reliance on long hours of unpaid care work by family members, which affects carers’ well-being, or the absence of care altogether (unmet needs).
There are different views on standards of quality and affordability, including whether, for example, the provision of care should be entirely free at the point of use or include small co-payments by users (either capped or means-tested). Although there may be grounds for considering such differences, this study primarily focuses on the total “costs” of provision, implicitly assuming that the provision of care will be free at the point of use. 1 ILO international labour standards usually follow an approach that is focused on achieving outcomes without being overly prescriptive on the chosen means so long as basic principles are met, but for the purposes of this study, the rationale is to examine transformative collectively funded packages of leave (time), rights, care-related cash benefits (income security) and services that, in combination, have showed superior advantages over market-based solutions in terms of efficiency, quality and effectiveness of care provision as well as employment creation (ILO 2018a; ILO 2021; ILO 2022). 2
Financing such spending may require increases in general taxation and social insurance contributions. This paper does not examine the detailed country-specific tax reforms that may be necessary to fund the full costs of provision, but discusses different options, in line with discussions happening more generally around financing the gaps in social protection floors (Bierbaum and Schmitt 2022; UN Women 2019; Durán Valverde et al. 2020; ILO 2020). However, at a minimum, the simulations in this study estimate the effect of such care investments on short-term tax returns (based on existing fiscal systems). Therefore, this paper’s main contribution is to simulate notional spending requirements (net of some of the tax revenue) on the supply-side of services within the next 10 to 15 years with sensible yet transformative scenarios for universal provision based on national priorities and population needs. The proposals are based on the assumption that countries will strive to progressively meet those policy scenarios and time some milestones as “minimum or floor steps” towards higher or faster coverage, according to national circumstances and based on national tripartite consultations and the participation of representatives of paid and unpaid care workers and women’s and child’s rights groups and those who provide and receive care.
These transformative scenarios are benchmarked on a few well-performing countries at the global or regional levels. Some countries have established high standards of provision either in regard to childcare, long-term care or paid care leave, or all three. Therefore, each of the relevant indicators of high-quality provision – for example, recipient-to-staff ratios – has been averaged across the top country performers to develop the benchmarks for the simulation scenarios in this study. The precise list of countries used varies by indicator, as detailed in the methods below.
These scenarios have been adapted for lower-income countries to take account of the local specificities on costs, employment and wages, but wherever possible and justified, relatively homogenous assumptions across the different economies have been utilized. For example, the international childcare literature on both lower-income and high-income countries has shown the benefits of high-quality childcare that starts early, which in all cases includes safety, a stimulating carer–child relationship, play-based learning, space, resting time, healthy meals and well-trained staff (ILO 2021a; ILO and UNICEF 2019; Simeu et al. 2017; Britto et al. 2017; Huston, Bobbitt, and Bentley 2015; Li et al. 2013). From there it is possible to derive quantitative indicators of quality standards, such as low child/staff ratios and high wages that match the qualifications at the degree level of the main childcare workers and are on par with teachers in schools (including provision for training to reach those levels).
Expanding such investment takes time and requires significant resources and planning. The costs and employment effects are modelled for the year 2030, taking into account population changes. More transformative scenarios close to universal high-quality provision have been simulated for upper-middle- and high-income countries, and intermediate scenarios have been developed for lower-middle- and low-income countries. A further expansion has been modelled for 2035, where scenarios for lower-middle- and low-income countries are adjusted upwards to get much closer to those of the upper-middle- and high-income group.
The policy scenarios follow the Sustainable Development Goal (SDG) objectives and are inspired by ILO Conventions and Recommendations on maternity protection, workers with family responsibilities, social protection and decent work. They also take into account the findings of a major ILO report,
In a nutshell, the estimations consist in simulating the annual public spending requirement for providing collectively funded 3 policy packages including:
-
individual childcare leave (maternity, paternity and parental) with durations extended according to national priorities and paid at full earnings or at least 67 per cent of earnings (based on the average wage) for formal employees, and at least at minimum wage level or 45 per cent of the average wage for those informally employed;
-
breastfeeding breaks of at least one fully paid hour per day for mothers returning to work after leave, for a period of at least 6 months; 4
-
free, full-time, full-year, high-quality early childhood care and education (ECCE) provision in collective settings to all children under primary school age (from the end of the paid leave period), with low child/staff ratios and professional childcare personnel with a mix of qualifications reflected in their wages (from at least above the minimum wage to primary school teacher wage or equivalent);
-
free, high-quality long-term care (LTC) to all children and adults, based on estimation of need prevalence, with adequate recipient-to-carer ratios and a mix of qualified personal care workers paid at 75 per cent of nurses’ wages and some with entry-level training paid at least at a rate above the minimum wage.
Justification for these parameters and imputation techniques are all explained in detail in the respective method sections that follow.
Other than the annual investment required to achieve these ambitious targets, the paper also estimates the labour market benefits of investing in care leave policies and care services as follows:
-
impact on direct employment in the care sector by gender (in full-time equivalents);
-
impact on indirect employment stemming from needing inputs from other sectors (also by gender);
-
impact on direct and indirect short-term tax returns from increased earnings and economic activity.
Since GDP is still the prevalent yardstick for comparison of economic activity between countries, the paper also examines changes in GDP due to multiplier effects that relate to the different spending efforts and fiscal returns. All estimations use 2019 as the reference year (for socio-demographic data and prices). However, as the estimations are carried out for 2030 and 2035, the relevant population variables 5 and real GDP 6 are projected to those dates to recalculate baseline employment, care spending and average wages. 7 Average wages follow GDP per capita projections. All other relative variables are kept constant as per 2019. For example, employment rates are those of 2019, applied to a working-age population projected to 2030. Wage rates in different industries and occupations are kept constant relative to the average wage as per 2019.
In sum, this study is an exercise in simulating the spending requirements and employment effects of the care policy reforms relative to the baseline spending and employment in the scenario year, not an exercise in projecting the change in spending and employment between 2019 and the scenario years. The simulated baseline scenario simply projects population by age group and GDP to the years of 2030 and 2035 while keeping constant the relative variables in the economy as they stood in 2019, such as relative prices and wages in each industry, current care spending in proportion of GDP and employment rates and composition. With respect to the ILO (2018a) terminology, the 2035 results presented below could be interpreted as the difference between the high-road and status quo scenarios’ effects, in which the status quo scenario is the baseline, business-as-usual care spending and employment projected to 2035 if no policy reform is implemented. The same holds for interpreting the 2030 results. In addition, 2030 in the model represents either a high-road scenario for high- and upper-middle-income countries or an intermediate scenario for low- and lower-middle-income countries.
Childcare leave and breastfeeding
2.1. Identifying the gap in provision and eligible groups
Paid childcare leave provisions available to households and linked to the birth and care of an infant include maternity, paternity and parental leave (box 1). Entitlements and funding mechanisms vary widely between countries, even between those with relatively well-established policies, such as European Union (EU) Member States, as described in the ILO
Box 1
ILO definitions and frameworks for maternity, paternity and parental leave and breastfeeding breaks
_________
(1) Other relevant ILO standards are the Social Security (Minimum Standards) Convention, 1952 (No. 102), and the ILO Social Protection Floors Recommendation, 2012 (No. 202).
(2) Other relevant ILO standards are the Social Security (Minimum Standards) Convention, 1952 (No. 102), and the ILO Social Protection Floors Recommendation, 2012 (No. 202).
(3) Article 22.
(4) Article 10(3–4).
(5) Recommendation No. 191, Para. 10(3), and Recommendation No. 165, Para. 22(2).
Source: ILO 2022.
Obviously when closing the childcare policy gap, the length of the leave expansion will depend on the choice of the start of any ECCE entitlement, which in many countries also needs to be decided. The ILO
The main two elements required for simulating the paid leave expansion are:
-
the size of the eligible employed population; and
-
the average earnings of eligible parents/potential parents.
Typically, the size of the eligible population would depend on legal frameworks (for example, the qualifying period of the employment contract; whether self-employed are eligible), as well as employment rates and birth rates in each country. In the model for this study, eligibility is extended to all potential parents who are gainfully employed, including those in the informal economy. This implicitly assumes no qualifying condition of employment duration. The study does not estimate the size of the population of employed parents based on the current employment rate of mothers, given the endogeneity of their employment situation to the existence of adequate provision of leave (and also of ECCE), as noted above.
For costing purposes, one needs the size of the eligible population prior to the birth of the first child. For fathers this is taken by their actual employment rate, which is often higher than for childless men of the same age and unlikely to change after the implementation of the leave reform (Kleven et al. 2019). For mothers, the study uses as a proxy the employment rate of women of childbearing age (15–54) without children. The rationale is that with better leave entitlements (followed without a gap by childcare provision), mothers will not need to drop out of the labour market (or reduce their working hours), and so their employment pattern will resemble their pre-birth pattern, which is taken to be similar to that of childless women of the same age (Kleven et al. 2019). In a few countries the presence of children cannot be estimated, so the study uses the overall employment rate of women of childbearing age.
The study draws a distinction between formal employees, formal self-employed workers and informal employment (whether as an employee or self-employed). The modelled care leave provision assumes that both formal employees and formal self-employed persons will receive a proportion of their employment income while on leave, and the assumed employment income of self-employed persons would be established at the average wage across all employees (hereafter AW). 9 Despite the different natures of maternity, paternity and parental leave, the same wage replacement rate as that of maternity leave is assumed for parental and paternity leave, since income earning is suspended for all leave takers, including men. The underpinning reason is based on data on care leave uptake by fathers and literature on the role of policy incentives, including on the level of paternity and parental leave benefits, in promoting men’s leave participation. As men tend to be over-represented among higher paid workers and still suffer stigma for leave uptake, adequate replacement rates would be necessary for gender-transformative policies that provide financial incentives for men to take leave and better share in unpaid care work. 10
It is further assumed that workers in the informal sector would receive a minimum flat-rate benefit, assumed to be equivalent to the minimum wage, if it exists, or otherwise set to 45 per cent AW (as this is the level at which minimum wages often lie, where they exist, in the sample of countries used in the study). 11 This aims to reflect the need to improve working conditions for those in the informal sector without incentivizing the reliance on informal employment over time and while facilitating workers’ transition from the informal to the formal economy and toward similar levels of income replacement as formally employed parents (ILO 2016; 2021c).
The rationale for using the average wage (AW) rather than actual individual wages for the calculations of earnings replacement rates is two-fold. First, there are data modelling restrictions: it is difficult to estimate accurate wage data for individuals whose employment needs to be estimated, given the current endogeneity of female earnings to employment. Second, using the AW enables quantitative comparisons of legal differences. In some countries certain childcare leave benefits are paid at a flat rate (such as in Australia and France for parental leave); while in other situations benefits are paid as a proportion of individual earnings (most countries for maternity leave) – sometimes with a ceiling (many European countries) and in some cases with decreasing replacement rates over time (such as in Belgium and the United Kingdom of Great Britain and Northern Ireland). Since the aim is to estimate the gap in provision and to cost it, the different systems of payment and duration are converted into a harmonized indicator of weeks paid at 100 per cent AW equivalent. That is, the duration of leave is weighted by the average payment by public funds in proportion to average earnings. In the case of proportional payments with a ceiling, if the ceiling is lower than average earnings, this will be reflected in the calculation (see below for a few examples).
Costings are done separately for maternity, paternity and parental leave benefits, but the types of leave are also aggregated for each parent given that in some countries the “parental leave” period is not fully distinguished from the period of payment for a “maternity leave” per se (for example, in Australia, Norway and Sweden). Moreover, the simulations only consider paid childcare leave provision that is afforded by social insurance and public schemes, excluding any provision paid for by employers. Given the focus on budgetary requirements rather than effective take-up, it is assumed that, in addition to maternity and paternity leave and to individually reserved parental leave periods, the remaining paid parental leave period that can be shared between parents is shared equally, even though in practice those periods are almost always exclusively taken up by mothers (Koslowski et al. 2020).
Here are a few examples of what this harmonizing method means for the total paid childcare leave available to mothers:
-
United Kingdom : 6 weeks of maternity leave at 90 per cent AW without ceiling, followed by 33 weeks at a low flat-rate (about 26 per cent AW); no paid parental leave. Moreover, employers only recoup 92 per cent of this from the State. So all in all, this is equivalent to 13 weeks at full pay at average earnings (= (6 x 0.9 + 33 x 0.26) x 0.92). -
Denmark : 18 weeks of maternity leave paid at full earnings up to a ceiling worth 73 per cent AW, followed by 32 weeks of fully paid parental leave (with no father’s quota, so it is assumed to be shared equally) up to a ceiling of 79 per cent AW. 12 This is equivalent to 26 weeks at 100 per cent AW (= 18 x 0.73 + 16 x 0.79). -
New Zealand : 26 weeks at 100 per cent AW up to a ceiling that is about 50 per cent AW (and no paid parental leave). This is equivalent to 13 weeks at 100 per cent AW (= 26 * 0.50).
It is acknowledged that offering, say, 15 weeks of maternity leave at a 100 per cent replacement rate is not the same for the recipient and their family as offering 30 weeks paid at 50 per cent, in terms of career impact, loss in daily earnings, time to care, etc. (and not all countries offer the flexibility of choosing between multiple options anyway). However, for budgetary purposes, which is what this study is focusing on, the two options would cost the same amount annually.
Table 1 shows the current average offer of paid childcare leave to formal employees and formal self-employed for different regions of the world. It shows the total leave available for mothers (when maternity leave and the period of parental leave available to mothers are added up) and for fathers (same). The total period is weighted by the AW as illustrated in the examples above. On average across all regions, formal employee mothers receive the equivalent of 16 weeks of fully paid childcare leave at 100 per cent AW equivalent, whereas men only receive just under 2 weeks. Formal self-employed mothers only receive 4 weeks of paid childcare leave at full pay equivalent, while self-employed fathers receive less than a week.
Table 1. Current provision of paid childcare leave by status of employment (weeks paid at 100 per cent AW equivalent)
|
|
|
|
||
|
|
|
|
|
|
|
Africa |
4.5 |
0.1 |
0.5 |
0.0 |
|
Americas |
11.3 |
0.5 |
7.5 |
0.5 |
|
Arab States |
0.0 |
0.0 |
0.0 |
0.0 |
|
Asia Lower |
16.9 |
0.2 |
1.3 |
0.1 |
|
Asia/Pac. Upper |
19.0 |
2.1 |
0.3 |
0.1 |
|
Europe |
25.7 |
9.4 |
20.2 |
6.5 |
|
All regions |
16.2 |
1.8 |
3.8 |
0.8 |
Note: Regional average weighted by countries’ share of regional employed population in 2030. Reference year is 2021 for legal systems. “Asia Lower” stands for lower-middle- and low-income countries in Asia (including Kyrgyzstan); “Asia/Pac. Upper” stands for upper-middle- and high-income countries in Asia and the Pacific (including Kazakhstan); Europe includes Russian Federation, Turkey and Israel. Arab States include Saudi Arabia only. Childcare leave is the sum of maternity leave and paid parental leave available to mothers, or the sum of paternity leave and paid parental leave available to fathers, both measured in 100 per cent of average wages equivalent (non-reserved leave period is split equally).
Source: Author’s calculations.
Existing paid care leave available in each of the 82 countries in the study is measured in weeks paid at 100 per cent AW equivalent. In line with the principles of international labour standards, schemes paid for by the employer (employer liability) were excluded, as this system is not considered “a collectively funded” provision, which might pose challenges in terms of coverage and compliance. Even if the leave payment was mandatory, employers might still be reluctant to hire female employees to avoid the extra cost.
In Africa, only three countries (out of the 13 covered in this study) provide the equivalent of 14 weeks of fully paid leave to female formal employees (Cote d’Ivoire, Senegal and Tunisia); while more populous countries such as Ethiopia and Nigeria offer no maternity leave benefits that are covered through social insurance, which explains the low weighted average of the region in table 1 above. No country in that regional sample offers fathers two weeks of paid leave; while provision for the self-employed is very limited. Note as well that for most African countries, even where public provision exists, the coverage of qualifying employees is very small given the large expanse of informal employment (in some cases greater than 90 per cent), for which – by definition – no mandatory social insurance provisions exist. 13
In the Americas, the provision of leave for mothers is higher, but the aggregate results remain low because the United States of America, a country with a large population, offers no social insurance-based paid leave to mothers. Also, only Canada and Colombia offer employee fathers a paid leave of two weeks (at 80 per cent AW).
In the Arab States (which in this study refers only to Saudi Arabia), no social insurance-based provision exists.
In Asia and the Pacific, 10 economies out of the 22 sampled for that region do not provide maternity benefits through social insurance. Paid leave provision for fathers barely exists in this group either, with only four (high-income) countries – Australia, Japan, Republic of Korea and Singapore – offering a minimum of 2 weeks paid fully. Both Japan and the Republic of Korea offer nearly equal care leave for employee mothers and fathers.
Europe offers, on average, far longer periods of paid leave to mothers, around 26 weeks, as well as 9 weeks to fathers (at 100 per cent AW equivalent). This masks a wide range of paid leave schemes for mothers among countries, from more than 50 weeks in Bulgaria, Romania and Estonia, to fewer than 14 weeks at full pay equivalent in Malta, Switzerland, Ireland, Turkey, Cyprus and the United Kingdom. In this latter group, either the employer is expected to foot a large proportion of the bill (Malta) or the payment is low relative to the average wage (United Kingdom).
More countries in Europe than in the other regions offer at least two weeks of paid paternity leave or parental leave reserved for fathers (again at full pay equivalent), but few countries offer equal or near equal provision to both fathers and mothers. Only Spain and Iceland do so.
The gaps that need filling in each country reflect these existing provisions. Maternity leave policy scenarios are based on the minimum requirements of the most up-to-date ILO standards on maternity leave, as detailed in Convention No. 183 and Recommendation No. 191. Paternity leave policy scenarios are inspired by the principles of Recommendations Nos. 165 and 191 as well as the 2021 International Labour Conference Resolution concerning the second recurrent discussion on social protection (social security). In addition to the latter, parental leave policy scenarios are also inspired by the principles of Conventions Nos. 102 and 183 and Recommendations Nos. 165, 191 and 202. These scenarios are related to national care policy gaps that countries will progressively fill by extending paid childcare leave provision at the household level, with gender equality considerations.
Table 2 below shows how these different scenarios for maternity, paternity and the resulting parental leave are combined for different countries. The principle behind these scenarios is that each country improves its offer to reach the next target up. By 2035, the scenario achieved by each country in 2030 is then moved up further to the next one, leaving only two groups: the two cells in the bottom row and the last two columns of table 2 (thick frame).
Table 2. Paid childcare leave scenarios for 2030 and 2035
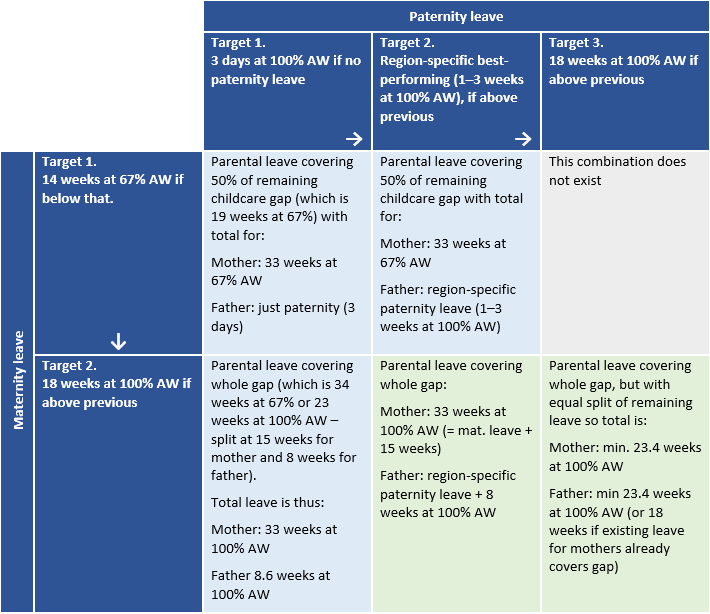
Note: For 2030, countries can target the scenarios found in either the blue or green cells; while for 2035, only the green cells of the table are possible targets. Note that not all the parameters have been agreed upon by tripartite constituents. The scenarios are illustrative.
It is important to note that these scenarios are established for the sake of costing budgetary requirements. Each country will decide the favoured combination of leave for each parent and the start of universal childcare, as discussed in Section 3. It is important to consider the balance between children’s needs, parents’ preferences and risks to parents’ careers and gender equality, including providing strong incentives for fathers’ involvement in care provision. Although the leave period extends to about one year (combined) in the 2035 scenarios of this illustrative package of policies, in practice the leave period could be shorter: for example, both parents may take significant portions of the leave together (such as the 18 weeks of maternity and paternity leave, so the partner can help the mother recover), or the mother could return to work after, say, 6 months, with either the child accessing ECCE services or the partner subsequently taking up months of parental leave, or a combination of both, on a part-time basis. The scenarios here thus present an upper-bound in terms of costings, with significant overlap expected with childcare provision.
2.2. Costing the gaps in provision
The annual spending requirement to fill the gap in provision of paid childcare leave is the product of the following four factors:
-
number of annual live births;
-
employment rate of women and men aged 15–54 (split between each type of employment);
-
average weekly target earnings; and
-
coverage gap in fully paid weeks equivalent (gap between current provision and target).
Data for annual births and population by age has been taken from the UN Population Division’s World Population Prospects 2019 database (including projections to 2030 and 2035). Employment rates and employment status are derived from micro-data for each country (labour force surveys or equivalent) and the ILOSTAT employment database. Data on informal employment is given by micro-data and/or the ILO (2018b) report
Data on parental/maternity/paternity leave systems is taken from legal sources compiled by the ILO for this study, including secondary sources (Koslowski et al. 2020; 2021).
The study assumes that the number of births per year gives a proxy for the annual number of mothers, implicitly ignoring multiple births. The number of fathers potentially eligible for leave is a proportion of the number of mothers in order to account for the greater prevalence of single mothers than single fathers. The available micro-data was used to calculate this proportion as the ratio of fathers with children aged zero to mothers with children aged zero.
Note that for five countries/territories in Asia it was not possible to identify the presence of children in the micro-data (Hong Kong (China), Japan, Indonesia, Israel and Malaysia), and access to micro-data for four additional countries was not possible (New Zealand, Kazakhstan, Singapore, Saudi Arabia). So, for these nine countries, the proportion of fathers was imputed from the regional average (with Saudi Arabia taking the average of Asia and the Pacific).
For each employment type (employee, self-employed, informal), the eligible population for paid care leave is therefore:
-
For mothers : the product of the birth rate, the employment rate of childless women aged 15–54 and the share of the relevant employment status (employee, self-employed or informal employment) in total employment. -
For fathers : the product of the birth rate, the ratio of fathers/mothers, the employment rate of fathers aged 15–54, and the share of the relevant employment status in total employment. 15
For the five countries/territories where the micro-data did not have information on parents, the employment rate of men and women aged 15–54 was used as proxy. For the four countries with no micro-data at all, the study used the employment rate of men and women aged 15–64, which was taken from the ILOSTAT database (ILO, n.d.).
Two scenarios were simulated, one for 2030 and one for 2035 (as per the scenarios in table 2). Note that in both the 2030 and 2035 scenarios, mothers in informal employment are given 14 weeks of maternity leave and a further 11 weeks of parental leave. Fathers are given 3 days of paternity leave and a further 8 weeks of parental leave. Again, for parental leave, these are illustrative scenarios, with some overlap expected with childcare policies, depending on national priorities.
2.3. Cost simulation results
2.3.1. Paid childcare leave expansion
Based on the scenarios illustrated in table 2 and the costing method explained in section 3.2, results for costing the expansion in paid childcare leave are shown in table 3. The bulk of the costing stems from the need to expand provision for fathers in most countries and to create some universal provision for those in informal employment in low- and lower-middle-income countries.
Table 3. Average cost of expansion of paid care leave by region of the world (2019 prices)
|
|
Breast-feeding breaks |
Expansion of paid maternity, paternity and parental leave |
Breast-feeding breaks |
Expansion of paid maternity, paternity and parental leave |
||
|
2030 |
2030 |
2035 |
2030 |
2030 |
2035 |
|
|
Region |
millions US$ |
% GDP 2030 |
% GDP 2035 |
|||
|
Africa |
1 149 |
12 153 |
16 921 |
0.04 |
0.48 |
0.54 |
|
Americas |
10 675 |
81 704 |
147 981 |
0.03 |
0.24 |
0.39 |
|
Arab States |
117 |
1 306 |
2 453 |
0.01 |
0.13 |
0.22 |
|
Asia Lower |
1 363 |
16 037 |
21 744 |
0.02 |
0.18 |
0.19 |
|
Asia/Pac. Upper |
9 590 |
69 731 |
92 304 |
0.03 |
0.19 |
0.20 |
|
Europe |
8 147 |
57 407 |
65 553 |
0.03 |
0.22 |
0.23 |
|
All regions |
31 041 |
238 338 |
346 957 |
0.03 |
0.22 |
0.27 |
Note: “Asia Lower” stands for lower-middle- and low-income countries in Asia (including Kyrgyzstan); “Asia/Pac. Upper” stands for upper-middle- and high-income countries in Asia and the Pacific (including Kazakhstan); Europe includes Russian Federation, Turkey and Israel. Arab States include Saudi Arabia only. Breastfeeding breaks scenarios for 2030 and 2035 are the same, so only 2030 results are shown.
Source: Author’s calculations.
Across all regions, public spending would need to rise by about US$238 billion by 2030 and a further US$109 billion by 2035 to fill the gap in universal provision (in 2019 prices). This represents an average of 0.27 per cent of 2035 GDP overall, varying from 0.2 per cent of GDP in Asia to 0.5 per cent in Africa. Results for lower-middle- and low-income countries of Asia and Africa are comparable to those estimated by Duran-Valverde et al. (2020) 16 for universal maternity benefits packages of about 0.5 per cent of GDP required in Sub-Saharan Africa and 0.1 per cent in South-Eastern and Southern Asia, representing 10 per cent and 3 per cent, respectively, of their total cost estimate for a universal package of the four social protection benefits: children, maternity, disability and old age.
Figure 1 shows that for upper-middle- to high-income countries, the majority of the gap to fill comes from formal employees. The Americas contrast with Europe, as the former requires a greater expansion of mothers’ paid leave (dominated by the United States), while in Europe it is fathers’ leave expansion that contributes most to the costs among formal employees.
In lower-middle- to low-income countries in Africa and Asia, the bulk of the required additional spending contribution comes from informal employment.
Figure 1. Breakdown of total cost of childcare leave expansion by gender and employment status (by 2035)
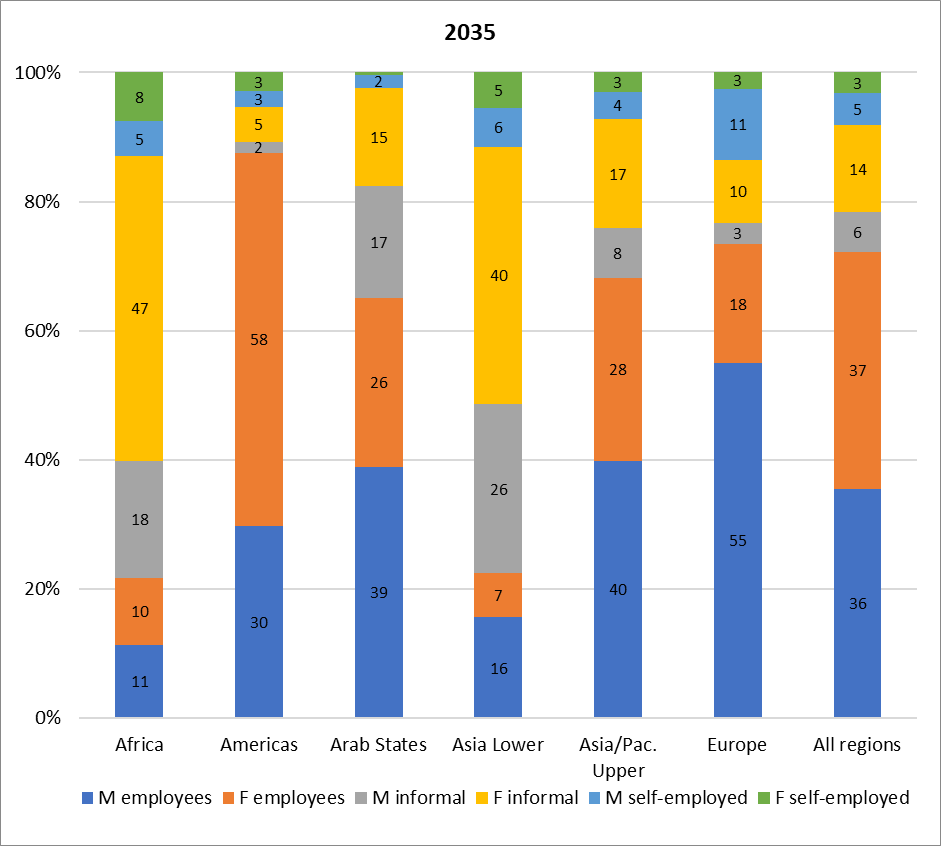
Note: “Informal” includes both employees and self-employed that are informal. “M” stands for men and “F” for women. “Asia Lower” stands for lower-middle- and low-income countries in Asia (including Kyrgyzstan); “Asia/Pac. Upper” stands for upper-middle- and high-income countries in Asia and the Pacific (including Kazakhstan); Europe includes Russian Federation, Turkey and Israel. Arab States include Saudi Arabia only.
Source: Author’s calculations.
Countries with spending requirements above 0.5 per cent of GDP are mostly in Africa, though Nepal, Cambodia and Pakistan also require public spending well above 0.5 per cent of GDP.
Note that Bangladesh and Sri Lanka contrast with Nepal and Pakistan in terms of the expansion in percentage of GDP required, despite all four countries currently having no leave provision and similar rates of informal employment and wage levels (in US$ purchasing power parity (PPP)). This is due to two factors. First, the ratio of the average wage to GDP per capita is lower in Sri Lanka and Bangladesh (0.56 and 0.97, respectively) compared to Pakistan (1.43) and Nepal (2.00). Second, the minimum wage in Pakistan and Nepal is above two-thirds of the average wage, whereas it is only 12 per cent in Bangladesh and 39 per cent in Sri Lanka. This reduces the spending requirement on informal employment in the latter two countries, by construction. The same explanation lies behind the relatively lower spending requirement in Ghana and Rwanda compared to the other African countries.
Countries in Europe have more generous existing provisions of paid leave, although a few countries (Cyprus, Israel, Switzerland and the United Kingdom) would still need to spend more than 0.4 per cent of their GDP to expand their provision, mostly reflecting the less generous maternity leave currently provisioned for in these countries compared to the remainder of the region. Note that in some countries, current provision of paid childcare leave for mothers (in 100 per cent AW equivalent) extends well beyond the scenarios simulated in table 2. So, in many cases, closing the gaps could simply require a redesign of long and often low-paid parental leave schemes, sometimes earmarked to mothers only, to be more equally shared and better paid leave entitlements, without needing any additional spending. 17 This would be a welcome gender-equalizing process.
2.3.2. Breastfeeding breaks
Although most countries do offer provision of paid breastfeeding breaks for employees of at least 60 minutes per day, only three countries do so via the social insurance system (Croatia, Slovenia and Spain). Therefore, it was assumed that all the other countries, even those providing breaks via the employer, need to budget for 60 minutes per day for 6 months at 100 per cent AW to employee mothers. The study has assumed this target to be reached by 2030. Total costs add up to about US$31 billion in 2030 for the whole world (table 3), which is about 0.03 per cent of GDP. Although 6 months are costed, it is expected that there will be significant overlap between the childcare leave provision and breastfeeding breaks in countries with more generous parental leave for mothers, so that the two budgets do not add up fully. 18
Early childhood care and education
Early childhood care and education (ECCE) services and programmes are broadly classified into two types:
-
early childhood educational development (ECED) programmes designed for children in the age range of 0–2 years; and
-
pre-primary education programmes designed for children from 3 years of age to the start of primary education (ILO 2018a).
Services available to parents can be either regular centre-based ECCE, licensed homebased ECCE or in-home services (domestic workers). Hiring a domestic worker (in-home services) to care for a child may be the preferred childcare option for infants and toddlers when publicly provided childcare is lacking or not trusted. ILO research shows that a high reliance on domestic workers for care services is indicative of insufficient care service provision in countries (ILO 2018a). Therefore, the focus of this study is to model formal childcare provision in centre-based or community settings (home-based professional childminders) – but not in-home care work (nannies) – for both of the above age groups.
3.1. Parameters for a new model of universal childcare
Estimating the parameters required to provide universal full-time childcare of high quality is relatively straightforward, based on the methodology developed by De Henau (2022). This work builds and expands on the ILO (2018a) report
The main parameters used for this simulation are:
-
number of children to be enrolled/offered a place;
-
opening hours per week and per year;
-
staff pay and qualification (and provision for training costs);
-
ratio of children per staff; and
-
overhead costs.
The model of childcare services constructed here assumes group-based ECCE facilities, which can take varied forms adapted to local contexts, such as small community settings in rural areas, school annexes in urban centres, childminders’ houses, etc. Childcare workers’ wages are modulated according to their level of qualifications, ranging from the wages of school teachers to those of professional childminders. Wages are set to progressively increase as staff gain training over the years (see table 4 below).
3.1.1. Target enrolment rates
Enrolment rates are distinguished between earlier ages (commonly termed as “early childhood care and educational development” – ECED), often up to the age of 3, and “pre-primary” ages, from 3 up to entry into primary school. 19 The age of entry into primary school varies between countries, with the majority of countries studied having an entry age of 6. Eight countries have an entry age of 5; while 17 have an entry age of 7. This will influence the costings, and the study did not adjust for this difference so as to keep these national specificities.
Figure 2 shows an illustrative enrolment rate in each type of care provision by age of the child, for the 2030 and 2035 targets. To reflect different qualification mixes, the figure distinguishes enrolment in childcare facilities by type of educational credentials: staff trained at the teacher level equates to ECCE and staff trained at the professional childminder level (including homebased professional childminders) equates to community childcare. 20 In practice both types of staff can operate in the same facility. It is assumed that upper-middle- to high-income countries will achieve the 2035 target in 2030, as they will start with a more developed childcare system. 21
The modelled target enrolment ratios in ECCE and community care for 2030 represent 50 per cent of the age group 0–2 years (75 per cent of the age group 1–2 years), which is in line with the assumptions in Ilkkaraçan and Kim (2019) and ILO (2018a). The target for higher-income countries is, however, more ambitious, at 60 per cent of the age group 0–2 years (90 per cent of the age group 1–2 years). As mentioned earlier, the first year of the child’s life, which is to be covered by paid leave, can be a modulated mix of leave and early childcare provision, depending on the country’s and the parents’ priorities.
The target enrolment rate for the pre-primary group is 100 per cent, again in line with ILO (2018a); although for lower-income countries the 2030 target is set at 90 per cent. This intermediate target would still satisfy SDG target 4.2.2 of ensuring all children have at least one year in pre-primary settings before entry into primary school. The other main difference between the 2030 and 2035 enrolment targets is the mix of community and ECCE provision (or mix of qualifications within a facility), which will impact on wages and thus overall costs.
Figure 2. Target enrolment rates of children in each type of “care” by age
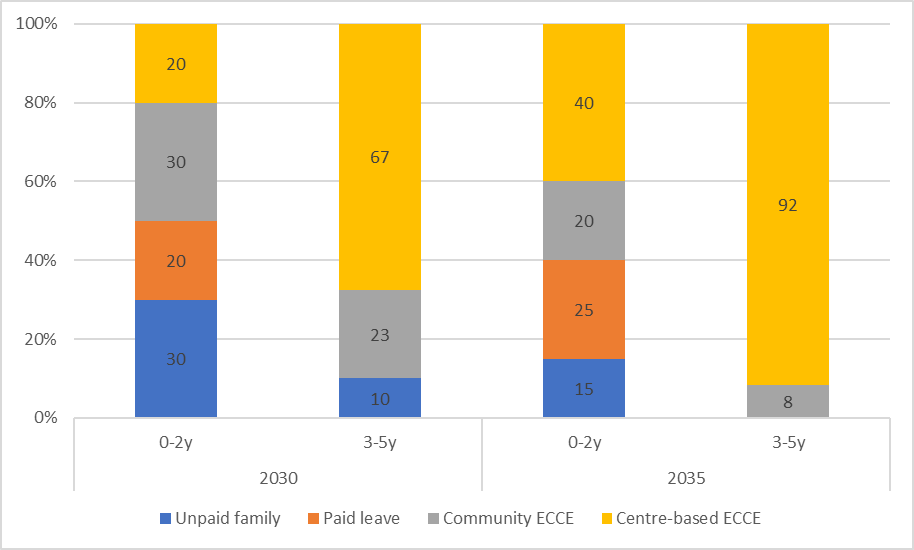
Note: “Unpaid family” refers to unpaid parental care (not employed).
3.1.2. Opening hours
The modelled provision of early childhood care is set to 40 hours per week for all countries, to reflect full-time coverage, including commuting time. In practice, countries will differ in their average full-time working hours, especially in more agrarian economies, but by setting a 40-hour model, with implicit coverage of 5 hours of commuting time, the study effectively assumes a norm of 35 hours per week of full-time employment for parents to converge towards over time.
The provision is also costed for 52 weeks, ignoring potential holidays. This is to overcome the problem of lack of childcare provision available during school holidays in many countries that have school-based provision, such as kindergartens and preschools for children aged 3+.
3.1.3. Staff pay and qualifications
Other than the demographic composition of each country, staff pay and qualifications represent the most important part of the variation in costs. As the ILO (2018a)
For simplicity and to guarantee high quality, it is assumed that the qualification mix of childcare staff (whether in group-based or community settings) follows the breakdown of ECCE/community enrolment shown in figure 2. For example, in 2035 for the age group 0–2 years, 60 per cent of children enrolled in formal childcare will be looked after by an average of two-thirds teacher staff (teacher-level credentials) and one-thirds childminder staff. For the age group 3–5 years, 92 per cent of the staff will have teacher-level credentials. Childcare workers (ECCE) trained at teacher level have at least two years of post-secondary training and preferably hold a bachelor’s degree, depending on national educational standards for school teachers.
Under the model for this study, staff trained at professional childminder level (community) 22 are to be paid at 120 per cent of the minimum wage or equivalent to reflect a different level of educational credentials.
In upper-middle- and high-income countries the average wage of childcare workers with teacher-level credentials were set to those of pre-primary school teachers, where data is available, or to primary school teachers if not. 23 In most countries with data on both, the pay level of the former is very close to that of the latter anyway (OECD, n.d.). For those countries with missing data, the study has established that the level of pay would be at the average wage (AW), since primary teachers’ wages are close to that level in upper-middle- and high-income countries with available data.
In lower-middle- and low-income countries the level for teacher-level childcare workers was set at twice the AW. This corresponds to about 2.5 to 3 times GDP per capita and is in line with primary school teachers’ earnings, using data from a more fine-grained analysis carried out by De Henau (2021) for five African countries, which is close to the assumptions in Ilkkaraçan and Kim (2019), if slightly lower. 24 However, for those countries whose average wage for professional occupations is less than twice the AW, the ratio was set to 1.5. 25
Given the sensitivity of the costings to the level of the AW, further investigation would be needed to ascertain the quality of the data for these countries. The ratio of AW to GDP per capita available in low- to lower-middle-income countries varies from 0.6 in Indonesia and 0.9 in Nigeria and Ghana to more than 2 in Kyrgyzstan, Morocco and Nepal. In higher-income countries the ratio is closer, with the AW generally below GDP per capita.
The study also includes some provision for other staff, mainly for administration, cooking and maintenance, given as 2 full-time equivalent (FTE) staff per 50 children, paid at half the teachers’ wage. The study also considers the costs of training childcare staff, in proportion to the initial training required (for example, three years for a bachelor’s degree) depreciated over the typical years of employment, based on one staff for 25 trainees. This represents about 0.006 FTE per ECCE staff annually, paid at the level of teachers/lecturers. 26
All are costed in FTE based on 40 hours per week for simplicity. Provision is made for employers’ social security contributions and pension contributions, as well as holidays and sickness leave during which the staff is to be replaced, given the required “presential” time (that is, time spent directly with children) calculated below. About 14 per cent of the working time of ECCE staff is deemed “non-presential”, to deal with administrative or special requests, and an additional 10 per cent of working time is earmarked for holiday and sickness replacements at full pay (see De Henau 2019).
3.1.4. Child/staff ratios
Child/staff ratio is the other important factor that will drive the annual spending requirement through staffing costs. It is difficult to quantify “process” indicators of quality, such as the quality of the relation between teachers and children or of the pedagogical approach used. Instead, the model uses the typical proxy for this, which is the child/staff ratio, with the “norms and standards” ratio set at a low level (that is, few children per staff) for each age group to guarantee at least some structural quality. There are no international guidelines or standards for specific child/staff ratios (ILO 2018a), so the model follows assumptions found in the literature on best practice as well as various national norms and standards across different regions.
For high- and upper-middle-income countries, a ratio of 4 children aged 0–2 per staff and 8 children aged 3–5 (pre-primary) per staff is applied and reached by 2030, in line with the six best-performing OECD countries in the dataset and the literature of successful indicators of quality childcare (Huston, Bobbitt, and Bentley 2015). The few countries in which child/staff ratios are lower keep their lower ratios (for example, Iceland and Norway).
For low- and lower-middle-income countries, the ratio is set to 5 children aged 0–2 and 15 children aged 3–5 per staff, also in line with standards and norms in various countries and best practice (Huston, Bobbitt, and Bentley 2015). 27 It is more generous than the 10 children 0–2 found in the ILO’s
3.1.5. Overhead costs
In line with Wils (2015) and the ILO (2018a), overheads (non-wage costs) are set to 33 per cent of the total wage bill in all countries by 2035, although an intermediate proportion of 50 per cent is assumed for low- and lower-middle-income countries in 2030. This is because, by construction, childcare wages in 2030 are relatively lower in these countries than in 2035, so it is expected that the proportion of non-wage costs to be higher in 2030 since these are fixed costs per child that are unrelated to changes in staff pay (such as heating costs, food, equipment). Overheads include sufficient provision for healthy meals for children to reduce stunting.
3.2. Cost calculations of early childhood care and education (ECCE) provision
Table 4 below summarizes the main parameters for the costing calculations in the new model of universal high-quality ECCE provision.
The staff required per facility in full-time equivalents (FTE) depends on the respective child/staff ratios of each age group. It is the sum across the two age groups of the respective ratios of staff per child, multiplied by 1.24, to reflect the 24 per cent additional, non-supervision time needed per full-time equivalent staff (that is, 14 per cent for non-presential time 28 and 10 per cent to cover for holidays, care leave and sickness). Each childcare employee receives their respective monthly wage as calculated above (all in FTE).
Total costings per year are therefore the annual wage bill of childcare staff across all facilities, plus that of auxiliary staff and training staff, accounting for any employer’s social security contributions on top of gross earnings, and adding overhead costs.
This provides the total annual investment required for high-quality provision that overhauls the current system. Given that existing systems are often substandard in most countries in terms of child/staff ratios and pay, it would not make much sense to only cost the expansion of high-quality coverage for those not yet enrolled, thereby creating a two-tier system. Instead costing the expansion would need to take into account the current indicators of opening hours, fees, staff pay and child/staff ratios. A quicker way to make sure the right “additional” provision is costed is to simply take the total cost as calculated above (on children currently enrolled and those projected to be in each scenario) and subtract current public spending on ECCE, as this level of spending will reflect all the costs related to the current substandard provision and enrolment.
For example, in the United Kingdom, the net enrolment rate in formal ECCE of children aged 3–5 is 100 per cent (EU-SILC data 29), but falls to 41 per cent in FTE and to 24 per cent in free FTE when accounting for the average proportion of public subsidy. So, the expansion to cost for this age group would need to provide for 76 per cent of children, not 0 per cent. Moreover, such an expansion costing method would also need to account for a necessary rise in pay levels given the substandard wage levels and qualifications of current childcare workers in the United Kingdom. The complexity of the data required to cost such an expansion accurately, especially for non-EU countries, drives the alternative, more straightforward approach used in this study. Admittedly, such an approach still relies on accurate current funding data to subtract from the total, but it is likely that countries with no information on public spending on ECCE would tend to have negligible public spending anyway, as the results show in the next section.
Table 4 provides a summary of the main costing parameters retained. Note that some costs are not explicitly modelled, such as the additional costs of building the infrastructure (facilities) and administering the massive expansion of childcare services (although they are implicitly included in the overheads). 30 These are not negligible costs, but detailing them is beyond the scope of this study. Costing improvements in education systems more broadly (both in terms of quality and coverage) is also beyond the scope of this study, although it is important to note that political priorities in terms of budget allocation will be at play in many countries that would benefit from improving their compulsory education systems as well as early childcare provision.
Table 4. Main parameters of the simulated ECCE model
|
|
|
|
|
Age group enrolment |
60% of 0–2-year-olds (high- and upper-middle-income countries by 2030) 50% of 0–2-year-olds (low- and lower-middle-income countries by 2030. 60% by 2035) |
100% of age group from 3 years till entry to primary school (high- and upper-middle-income countries by 2030) 90% for low- and lower-middle-income countries by 2030 and 100% by 2035. |
|
Child/staff ratio (maximum) |
4 (high- and upper-middle-income) 5 (low- and lower-middle-income) |
8 (high- and upper-middle-income) 15 (low- and lower-middle-income) |
|
Opening hours (supervision time) |
40 hours per week, 52 weeks per year |
|
|
Wage costs |
High- and upper-middle-income group: Pre-primary teacher or primary teacher wage (or average wage if missing) for 82% of childcare staff, and 120% minimum wage for 18% of staff. Low- and lower-middle-income group: twice the average wage or equivalent to teacher wage for 63% of childcare staff, and 120% minimum wage for 37% of staff (in 2030). Same qualification mix as for higher-income countries in 2035. All wages are then augmented by the country-specific rate of social security contributions of employers to obtain the total wage cost per employee. |
|
|
Additional time |
10% for covering holiday/sickness/care leave 14% for covering non-supervision time |
|
|
Other staff |
2 auxiliary FTE staff per 50 children (catering, admin, maintenance) 0.006 FTE per ECCE staff for training |
|
|
Overheads |
High and upper-middle: 33% of staff costs Low and lower-middle: 50% of staff costs |
|
|
Number of children per facility |
50 (divided by age group according to share of age group in ECCE target population) |
|
|
Non-modelled costings |
Construction costs (facilities), although indirectly included in overheads (mortgage repayment/rent) Compulsory education costs (to fill gaps in attainment levels when training new ECCE workers) |
Note: Facilities are assumed to have 50 children, but this can be modulated according to the type of provision. (For example, in community settings or childminders’ homes, it can be assumed that for every 50 children across different homes, two auxiliary staff are counted to help childcare staff). Note that these parameters have not been agreed upon by tripartite constituents. The scenarios are illustrative.
3.3. Results – Annual spending on early childhood care and education (ECCE) provision
Table 5 shows the total annual spending required to deliver universal provision of high-quality ECCE services as modelled in the previous section. It distinguishes between the notional expansion in funding required compared to current (estimated) levels of public spending, available from various international databases (Eurostat, OECD Family Database, UNESCO Institute of Statistics (UIS) Database). 31
Table 5. Annual spending requirements in ECCE by region (2019 prices)
|
|
Baseline |
Expansion |
Baseline |
Expansion |
Baseline |
Expansion |
Baseline |
Expansion |
|
2030 |
2035 |
2030 |
2035 |
|||||
|
Region |
billions US$ (2019 prices) |
% GDP 2030 |
% GDP 2035 |
|||||
|
Africa |
2.3 |
90.0 |
2.7 |
131.4 |
0.09 |
3.52 |
0.09 |
4.19 |
|
Americas |
104.1 |
488.8 |
112.0 |
522.6 |
0.30 |
1.43 |
0.30 |
1.38 |
|
Arab States |
0.4 |
18.3 |
0.4 |
18.4 |
0.04 |
1.85 |
0.03 |
1.67 |
|
Asia Lower |
4.3 |
178.3 |
5.1 |
265.4 |
0.05 |
2.01 |
0.05 |
2.36 |
|
Asia/Pac. Upper |
66.2 |
520.2 |
73.7 |
628.8 |
0.18 |
1.40 |
0.16 |
1.38 |
|
Europe |
162.9 |
306.8 |
172.3 |
326.8 |
0.61 |
1.16 |
0.60 |
1.14 |
|
All regions |
340.3 |
1 602.5 |
366.3 |
1 893.2 |
0.31 |
1.45 |
0.29 |
1.48 |
Note: Current spending in billions US$ is that in 2019 (projected in % GDP to follow the share of 0–4-year-olds in the population by 2030 and 2035). “Asia Lower” stands for lower-middle- and low-income countries in Asia (including Kyrgyzstan); “Asia/Pac. Upper” stands for upper-middle- and high-income countries in Asia and the Pacific (including Kazakhstan); Europe includes Russian Federation, Turkey and Israel. Arab States include Saudi Arabia only.
Source: Author’s calculations.
As expected, the bulk of the total annual spending required would come from spending on expansion, especially by 2030, with a significant effort in Africa in terms of percentage of its GDP. In total across all regions of the world, annual spending on universal childcare services of high quality would be around US$2.2 trillion by 2035, with 82 per cent coming from the expansion of services (US$1.9 trillion), a six-fold increase on current spending. Even in Europe, which includes many countries with relatively well-developed childcare systems, the expansion would account for 65 per cent of total spending requirements, meaning total annual investment should nearly treble (from US$163 billion to US$470 billion in 2030).
Figure 3 shows that the contribution of the younger age group (0–2 years – ECED) to the total costs of ECCE facilities is remarkably similar across higher-income regions (53–55 per cent) and higher for lower-income regions (62–64 per cent). These figures reflect the effect of a lower enrolment in the 0–2 age group (compared to the 3–5 age group) that is more than compensated for by the lower child/staff ratios for the 0–2 age group, especially in lower-income countries.
Figure 3. Contribution of the 0–2 years age group to total spending on ECCE (%)
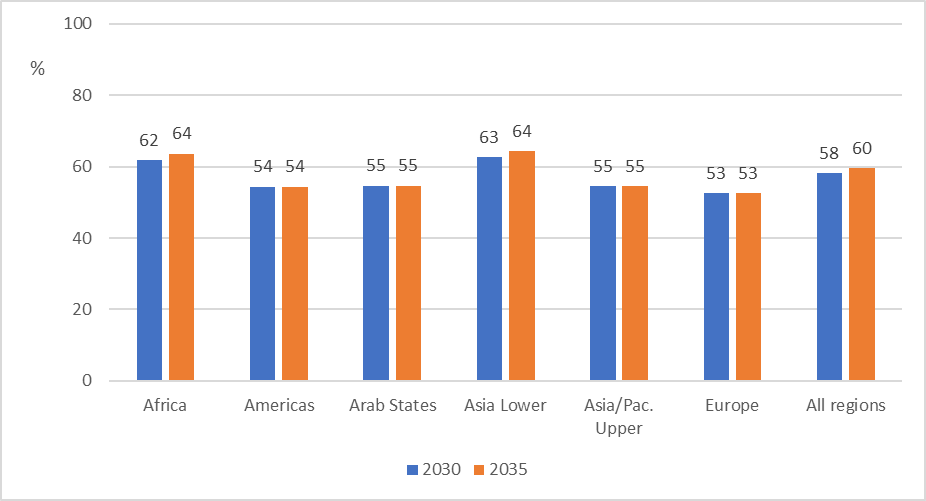
Note: “Asia Lower” stands for lower-middle- and low-income countries in Asia (including Kyrgyzstan); “Asia/Pac. Upper” stands for upper-middle- and high-income countries in Asia and the Pacific (including Kazakhstan); Europe includes Russian Federation, Turkey and Israel. Arab States include Saudi Arabia only.
Source: Author’s calculations.
Examining cross-country differences in overall costs in 2030, three main factors explain about 90 per cent of the variation, when costs are expressed as a proportion of GDP 32:
-
the population of children targeted in proportion to the total population (which explains 57 per cent of the variation alone);
-
the ratio of the average wage (AW) to GDP per capita (which explains a further 19 per cent of the variation); and
-
the modelled wages in ECCE as a proportion of the AW (which explains a further 4 per cent of the variation).
On the low-spending end of the spectrum (below 1 per cent of GDP in total), countries/territories such as Singapore, Sri Lanka, Malta, Hong Kong (China) and Brunei Darussalam have low AWs in terms of per cent of GDP per capita. On the high-spending end of the spectrum, many African countries require expenditure of more than 5 per cent of their GDP (as does Kyrgyzstan), which is mainly driven by the high proportion of pre-school children in their population (above 10 per cent in most). By contrast, spending requirements in Nigeria, Rwanda and Ghana are lower despite also having large shares of young children in their populations (10 per cent or more), because these countries have lower ratios of AW to GDP per capita (<1).
Among high-income countries of similar economic and demographic structures, a few cases are worth noting. For example, Sweden has a higher spending requirement than Norway and Denmark, not only because of one extra year of age to cover (its primary school entry age is 7) but also because of a higher incidence of employer social security contributions, which adds to the wage bill. Childcare workers in Sweden are also paid closer to the AW compared to those in the other two countries. Germany and Canada are also projected to spend close to the same levels as Sweden despite a primary school entry age of 6, but this is mostly explained by a much higher ratio of ECCE wages to AW of about 1.4, compared to most other high-income countries where the ratio is around 1 or below.
In the discussion about whether to substitute childcare services for paid childcare leave (for children under the age of 1), it is useful to compare the simulated weekly costs per child of either type of care (in per cent of AW). In most countries, the weekly cost of paid leave per child under 3 years is larger than the cost of childcare, even in countries with higher informal employment where the modelled replacement rate for leave is lower than 67 per cent AW. Given the rise in qualifications and the related pay increase of childcare workers in lower-income countries, the unit cost of childcare increases in 2035, but is higher than the cost of childcare leave only in 10 out of 25 countries in that group. In higher-income countries the cost of childcare is only markedly higher than the cost of childcare leave in Mexico, Brazil and Portugal.
Long-term care
Care needs are examined for three different age groups with limitations in their daily activities:
-
disabled dependent children;
-
working-age population with limitations in daily activities because of long-standing illness or disability; and
-
older persons facing important functional limitations in their day-to-day activities (using an arbitrary age threshold of 65).
Box 2
Key concepts related to long-term care services
Long-term care services include support and assistance to older persons, adults and children with functional limitations to enable them to carry out activities of daily living (personal care), such as bathing and eating, as well as activities that are instrumental to achieving personal care, such as maintaining a clean household, cooking, dealing with administrative tasks or socializing. Long-term care services also typically include basic medical support, such as nursing care. Services are provided by nurses as well as non-health professionals, including domestic workers (“personal assistants or personal care workers”).
Functional limitations can result from a disability or the process of ageing. Disability is a complex, dynamic and multidimensional concept, with both a medical and a social component. It is an umbrella term for impairments, activity limitations and participation restrictions, referring to the various barriers that may result from the interaction between an individual with long-term impairments (physical, mental, intellectual or sensory) and that individual’s contextual factors (environmental and personal).
Long-term care services can be provided in community-based or in institutional residential settings. Community-based care refers to all forms of care that do not require older persons or persons with disabilities to reside permanently in an institutional care setting; they include in-home care, community centres and day centres. Institutional residential care refers to institutionalized care delivered in assisted-living facilities and nursing homes. Respite care provides short-term care in order to relieve unpaid carers. It can occur in people’s homes as well as in community and day centres or residential facilities.
Long-term care services can be provided in-kind or in-cash (or a combination of both). Under the first method, beneficiary older persons receive services from the public sector or private providers fully or partially compensated by the State (through non-contributory or contributory systems, such as taxation or social insurance). In the second scenario (cash-for-care schemes), beneficiaries receive transfers that can either be spent on long-term care services provided by paid care workers (in-home or institutions), or to be used as they see fit, including to compensate for unpaid services provided by family members.
Source: ILO 2018a; ILO 2022.
One of the aims of the study is to move away from a system that by default or by design relies on unpaid carers, so as to enable these individuals to remain attached to the labour market (at least for those of working age). However, this aim of reducing reliance on unpaid care is extended to the population of retired carers as well. Although care by partners and relatives may complement the formal system, relying on existing partners, even retired, can put extreme strains on them, may affect their own well-being and may lead to higher costs down the line (Hoefman, Exel, and Brouwer 2013). This means that eligibility to receive formal care should not rest on the presence of a willing unpaid carer, even within the household. 33
For all age groups, the focus is on person-centred care service provision that enables the people receiving care to live fulfilling and dignified lives with the autonomy to function and participate in society on equal terms to those without impairments. The rationale behind the model simulated is to improve the quality of care as well as its sustainability, affordability and accessibility. It is therefore comprehensive and universal.
As such, the model assumes that every person who needs care will receive collectively funded formal care regardless of income or family circumstances, free at the point of use, albeit with different intensity depending on the level of need. The model also aims to simulate decent working conditions for personal care workers, in line with a human-centred recovery plan from COVID-19 (ILO 2021a).
The costing of universal long-term care (LTC) will thus mainly depend on the following elements:
-
the prevalence of different types and intensity of care needs in each age group;
-
the extent of needs that should be covered (severe, moderate) and their type (personal care, household care);
-
the pay of care workers and qualifications (and provision for training costs);
-
the number and hours of care workers needed to perform different tasks; and
-
overhead costs (see table 7).
4.1. Extent of needs coverage
The first two elements of costings are likely to lead to the widest range of estimates, as it is notoriously difficult to measure “needs” and “adequate service” in practice. For example, household tasks of cleaning and cooking may not only benefit the care recipient but also their household. Moreover, people reporting impairments in household surveys may not all require the same level of “care”; for example, some impairments can be addressed by additional equipment or adaptations (including in the social environment, such as public transport).
The paragraphs below describe the process to determine a plausible density of full-time LTC workers per population by age group, as a proxy for the aggregate level of adequate care provision. 34 Several approaches are possible and these densities are estimated based on levels of needs approximated from different sources and methodologies.
Ilkkaraçan and Kim (2019a), following Scheil-Adlung (2015), focused on the age group 65+. Scheil-Adlung (2015) adopted a lower-bound prevalence of care needs of 12 per cent (measured as the number of care recipients per 100 persons aged 65+), based on recipients-to-population ratios calculated in high-performing countries with legal entitlement to LTC services (ILO 2018a).
The approach followed here is conceptually similar but refined to take into account two main differences. First, the scope of coverage is expanded in order to establish dependency rates and adequate level of provision for three age groups, not just those aged 65+. Second, these rates need to be established for a much wider set of countries with significantly different demographics.
In order to inform the modelling decisions, the study started by examining data for Europe to establish a parallel between the needs identified from household surveys, and a more internationally available measure of potential needs, which is the WHO’s health-adjusted life expectancy (HALE) indicator (WHO, n.d.). Using Europe for “calibration” is useful, as it comprises a wide variety of care systems, ranging from barely existing formal services to universal provision.
The latest European Health Interview Survey (EHIS) has data for 2013–15 on the limitations faced by people aged 65+ in performing their own personal care, and shows a prevalence of activity limitations (severe or moderate) among 24 per cent of persons aged 65+ across the EU‑28, with 9 per cent reporting severe limitations (Eurostat 2020). Interestingly, rates are lower in Nordic countries than elsewhere, and the cross-EU variation is large, from 9 per cent reporting some limitations in Norway and 12 per cent in Denmark to 39–40 per cent in Czechia and Slovakia. Therefore, taking the “severe limitation” rates of the Nordic countries as a benchmark for care needs may be underestimating the scale of adjustment required in other countries. The same data shows that in Sweden, Norway and Denmark, half of the 65+ persons reporting some limitations do not need any assistance, while a quarter lack the assistance they need.
If one takes the combination of those who have moderate or severe difficulties in personal care and who require assistance (including those who get enough of it) using a narrow scope of needs (for personal care only), then the proportion of adults aged 65+ in need of care falls to 4–7 per cent in Nordic countries, 16 per cent in the EU on average, and up to 25 per cent in Greece, Czechia and Slovakia.
In another method, dependency rates can be calculated in line with Lipszyc et al. (2012) by using European Union Survey of Income and Living Conditions (EU-SILC) data on self-reported severe limitation in daily activities due to health problems as a proxy for care needs. 35 This indicator shows, for 2018, that 48 per cent of people aged 65+ have some limitation and 16 per cent experience severe limitations (Eurostat, n.d.). The two questions in the EHIS and the EU-SILC are not the same, and therefore resulting care needs estimations may differ. However, on aggregate, comparing the data around those with some limitations in personal care who require assistance (using EHIS data) and those with severe limitations in daily activities due to health problems (using EU-SILC data) seem to yield similar proportions among the 65+ population: around 16 per cent in the EU on average. The advantage of using the EU-SILC’s “severe limitation” question is that it is available for all persons aged 16+, not just the 65+ group (5 per cent of individuals aged 16–64 report severe limitations). This is important for cost calculations, because the difference in size between the two age groups means about half of adults with severe limitations are below the age of 65, at least in European countries.
Using EU-SILC data, the prevalence of severe limitations among the 65+ population is between 25 per cent and 30 per cent in eight countries in Europe and seven countries have a rate below 10 per cent (Norway, the Netherlands, Sweden and Denmark, as well as Bulgaria, Malta and Switzerland). The percentage is much lower for the 16–64 age group, but the ranking of countries does not follow that of the need prevalence in the older age group. Countries like Lithuania and Romania have a relatively lower prevalence of severe limitations among 16–64-year-olds (below 4 per cent) but mid to high rates for their 65+ populations (19–20 per cent); whereas Denmark has a relatively high rate for the 16–64 age group (6.3 per cent) and a low rate among the 65+. Only Sweden and Malta have low rates for both groups.
The next stage is to compare these levels of activity limitations with data on the care workforce and care recipients. Table 6 shows data for a selection of OECD countries on the ratio of care recipients-to-carers for 2017 (columns a and b). 36 From this and from the population of care recipients aged 65+, the density of LTC workers per 100 persons aged 65+ in the population is estimated (columns c and d). Table 6 also compares, using the EU-SILC for the available EU countries, these figures to the ratio of the 65+ population with severe limitations to the number of LTC workers (column g, which is calculated as column f divided by column c). Column e shows the proportion of remaining life at age 60 expected to be lived with disabilities or ill-health (based on healthy-life expectancy data – HALE), as a proxy for the prevalence of disability (WHO, n.d.).
Table 6. Care needs and formal care recipients and providers in selected OECD countries
|
|
Recipient-to-carer (HC) ratio |
Recipient-to-carer (FTE) ratio (all ages) |
Density of LTC workers (HC) per 100 persons aged 65+ |
Density of LTC workers (FTE) per 100 persons aged 65+ |
% of life expectancy at 60 lived with disability |
% of 65+ |
Ratio of 65+ with severe limitations to LTC workers |
|
Country |
(a) |
(b) |
(c) |
(d) |
(e) |
(f) |
(g) |
|
Denmark |
1.7 |
2.2 |
9.7 |
7.3 |
27.1 |
7.8 |
0.8 |
|
Sweden |
1.9 |
2.5 |
8.7 |
6.5 |
25.3 |
6.5 |
0.7 |
|
Norway |
1.9 |
2.3 |
8.2 |
6.8 |
28.6 |
7.1 |
0.9 |
|
United States |
2.1 |
3.8 |
4.7 |
2.6 |
28.7 |
n.a. |
n.a. |
|
Luxembourg |
2.2 |
2.7 |
5.6 |
4.7 |
26.2 |
18.5 |
3.3 |
|
Netherlands |
2.4 |
n.a. |
5.1 |
n.a. |
24.8 |
12.4 |
2.4 |
|
Rep. of Korea |
2.4 |
3.7 |
3.5 |
2.2 |
29.5 |
n.a. |
n.a. |
|
New Zealand |
2.6 |
3.6 |
5.7 |
4.1 |
26.3 |
n.a. |
n.a. |
|
Estonia |
2.6 |
2.8 |
4.0 |
3.8 |
29.0 |
26.5 |
6.6 |
|
Israel |
2.9 |
3.7 |
6.9 |
5.4 |
25.3 |
n.a. |
n.a. |
|
Portugal |
2.9 |
4.9 |
0.6 |
0.4 |
27.7 |
22.6 |
34.9 |
|
Switzerland |
3.5 |
5.6 |
6.3 |
4.0 |
25.7 |
8.1 |
1.3 |
|
Germany |
3.8 |
5.3 |
4.1 |
2.9 |
27.1 |
12.8 |
3.1 |
|
Canada |
5.8 |
n.a. |
2.2 |
n.a. |
26.0 |
n.a. |
n.a. |
|
Hungary |
7.5 |
n.a. |
1.6 |
n.a. |
26.3 |
21.5 |
13.6 |
|
Slovakia |
12.6 |
12.6 |
n.a. |
n.a. |
30.8 |
29.5 |
n.a. |
Note: Countries are ranked by column (a) (increasing order). HC stands for “headcount”, and FTE for “full-time equivalent”. LTC workers include personal care workers and nurses. n.a. = data not available.
Source: Author’s calculations using OECD health data for 2018 (OECD, n.d.) for columns a to d; WHO (n.d.) for column e; and EU-SILC for column f.
Table 6 (column a) shows that the high-performing countries of Denmark, Sweden and Norway (all with universal long-term care provision) have recipients-to-carer ratios below 2. A total of 11 out of 16 countries in table 6 have recipients-to-carer ratios below 3, but vary by the density of persons aged 65+ with severe limitations per LTC worker (column g). This implies that:
-
not all recipients of formal care have severe needs;
-
not all people with severe needs receive formal care adequately;
-
not all recipients receive the same intensity of formal care (and indeed many care workers work part-time).
The three countries that have universal long-term care systems with extensive coverage (Norway, Sweden and Denmark) have slightly lower than a one-to-one ratio of persons 65+ with severe needs per LTC worker (column g), which translates into an average headcount of 9 LTC workers per 100 persons aged 65+ (column b), or 7 in FTE (column d). If a one-to-one ratio for severe needs was applied in other EU-SILC countries, this would go up to 30 LTC workers per 100 persons aged 65+ in countries like Slovakia, Greece, Croatia and Turkey.
The approach adopted for this study is more moderate, by targeting a uniform density of 9 headcount (7 FTE) LTC workers per 100 persons aged 65+ in the population based on two rationales as a first step in determining the care workforce numbers.
First, countries with high prevalence of severe needs all have very low formal provision, which could explain the high severity of needs (due to lack of preventative care, for example). Granted, setting the ratio at the average level of the three Nordic countries of 9 LTC workers per 100 persons aged 65+ means a lower ratio for countries with higher prevalence of severe needs. However, this ratio would remain below a maximum of 3 recipients per carer (in headcount), which is the ratio below which most of the OECD countries with available data seem to lie (column a). Slovakia, the country in table 6 with the highest prevalence of severe needs (column f), would still see a fourfold reduction in its recipient-to-carer ratio from 12.6 (column a) to 3.
Second, when compared to HALE data from the WHO (n.d.) (column e), the cross-country difference in the proportion of life expectancy (LE) lived with disability (= 1 – HALE / LE), measured at age 60, is not as pronounced as that shown by the severe limitations data for European countries using the EU-SILC. Considering the sample of countries in table 6, if HALE data is a good proxy for prevalence of care needs (both moderate and severe) and there are 7 FTE carers per 100 persons aged 65+, then this would imply a recipient to carer ratio varying between 3.5:1 in the Netherlands and 4.4:1 in Slovakia. However, it is known from OECD data that about 16 per cent of the 65+ population in the three Nordic countries receive formal LTC, which is equivalent to about 55 to 64 per cent of those living with a disability as measured by HALE data. Applying this proportion of roughly 60 per cent to the data in column e for 7 FTE carers per 100 persons 65+ would yield recipient-to-carer ratios of 2.2/2.5:1 in the three Nordic countries (as per column b), and ranges from 2.1 in the Netherlands to 2.6 in Slovakia.
HALE data is available for all the countries/territories in the sample (except Hong Kong, China), so this approach is used. So, for persons aged 65+, instead of a strictly uniform density of 7 FTE carers per 100 persons aged 65+, the model retains a country-specific density figure, calculated as 60 per cent of the HALE-based disability prevalence divided by 2.5 for upper-middle- and high-income countries, 37 and by 3 for lower-middle- and low-income countries (to account for greater restrictions in implementing new services). The resulting densities range from 5 to 7 FTE carers per 100 persons aged 65+ in the lower-income group of countries and 6 to 8 FTE carers in the higher-income group.
For the population aged 15–64, it is assumed that only 50 per cent of HALE-measured disabled people in that age group have care needs, which for Europe corresponds roughly to the share of 15–64-year-olds with severe limitations using EU-SILC data. A recipient-to-carer ratio has been applied to that care need prevalence figure for each country. This ratio is assumed to be 2.5:1 in upper-middle- and high-income countries and 4:1 in lower-middle- and low-income countries (to reflect a lower policy priority for that age group). This yields a range of densities of FTE carers per 100 persons aged 15–64 of between 1.1 and 1.6 in the lower-income group and 1.1 and 2.5 in the higher-income group. 38
For the child population a simple ratio based on world data on severe disability has been used. The estimated world average of prevalence of severe disability was 2.7 per cent for persons aged 15–59 as measured in 2004 in the latest WHO
4.2. Pay levels and other considerations
Pay levels of long-term care workers should be raised along with their qualifications (in a continuum to represent career development through different tasks and responsibilities, with some routes towards other professions such as specialized nursing or social work). Like childcare, long-term personal care work is a skilled occupation, with specialized post-secondary qualifications that need to be reflected in adequate pay.
One suggestion used in the ILO (2018a) report
A blended approach would be to use the salary of professional nurses as a benchmark and raise the salary of personal carers to a certain level relative to this benchmark based on their qualifications. Personal care workers in the three Nordic countries with universal LTC provision earn about 75 per cent of nurses’ salaries, who themselves earn about the average wage (Denmark, n.d.; Norway, n.d.; Sweden, n.d.). By contrast personal care workers in the United States, the United Kingdom and Australia earn 40 per cent, 50 per cent and 57 per cent of nurses’ wages, respectively (De Henau et al. 2016).
So, following the Nordic countries’ benchmark, the model assumes personal care workers are to be paid at 75 per cent of nurses’ wages (or of the average wage if data on nurses’ wages is missing) 40 in high- and upper-middle-income countries. 41 For low- and lower-middle-income countries, qualified personal care workers’ wages are set at a target of 75 per cent of the wage of teacher-level childcare workers, as simulated in Section 3 (that is, effectively implying that nursing professionals and childcare teachers earn the same wage). However, this wage is modulated further to take account of a potentially larger proportion of care workers in low- to lower-middle-income countries with different levels of educational credentials, with less-credentialed LTC workers assumed to be paid at a lower rate of 120 per cent of the minimum wage or equivalent. It is arbitrarily assumed that the proportion of such lower-paid workers is 67 per cent. With increased training and higher qualifications by 2035, this proportion is reduced to 33 per cent.
In order to help with the preventative objective of the new care system, the model follows Denmark’s policy of systematic assessment visits by qualified nurses, where everyone aged 75+ receives a twice-yearly visit to check their situation, assess potential needs development, and discuss options for adaptations (Schulz 2010). For simplicity, the age threshold used in this model is set to 65. This is costed as a three-hour visit twice a year for everyone aged 65+, at full cost of a nurse pay rate.
Training staff provision is also added, similar to the childcare model in Section 3 above, though using a two-year post-secondary qualification for personal carers, rather than a bachelor’s degree, to keep the distinction with qualified nurses. 42
Overheads are added to wages and employers’ social security contributions. For simplicity the same overheads as for childcare are used, since it is difficult to ascertain the relative proportion of residential versus domiciliary care in the new model (the former arguably attracting larger overheads).
Table 7. Main parameters of the simulated LTC model
|
|
|
|
|
|
Population with care needs |
A quarter of the proportion found for the 15–64 age group |
50% of the proportion of disabled 15–64-yeard-olds as measured by HALE data |
60% of the proportion of disabled 65+ as measured by HALE data |
|
Recipient-to-carer ratio (FTE) |
2.5:1 (higher-income group) 4:1 (lower-income group) |
2.5:1 (higher-income) 4:1 (lower-income) |
2.5:1 (higher-income) 3:1 (lower-income) |
|
Wage costs |
High- and upper-middle-income group: 75% of nurses’ wages (or AW if missing) in both 2030 and 2035 Low- and lower-middle-income group (2030): 75% of ECCE teacher wages for 33% of care workers, and 120% min wage for 67% of care workers. In 2035, 67% of care workers are at 75% of ECCE teacher wages (and 33% at 120% min wage). Social security contributions added to these wages |
||
|
Other staff |
3-hour nurse visit twice a year to all 65+ population 0.004 FTE per ECCE staff for training |
||
|
Overheads |
High and upper-middle: 33% of staff costs Low and lower-middle: 50% of staff costs (33% in 2035) |
||
|
Non-modelled costings |
Construction costs (of residential facilities and adapted housing) Compulsory education costs (to fill gaps in attainment levels when training new LTC workers) |
Note: these parameters have not been agreed upon by tripartite constituents. The scenarios are illustrative.
4.3. Results – Annual spending on long-term care (LTC) provision
Table 8 shows the cross-regional variation in public spending required to achieve universal provision of LTC services, compared to current levels of public spending on LTC as gathered from the OECD Health Database and the WHO Global Health Observatory database. 43
Given the difficulty to find data on the split between current care recipients of working age and current care recipients aged 65+, it was not possible to adapt the current spending in per cent GDP to 2030 and 2035 population projections to account for the effect of change in the share of the elderly population (which is growing faster than the working-age population). Therefore, the baseline “current” spending is only adapted to follow GDP changes (that is, it remains a constant proportion of GDP). Therefore, the simulated additional spending from the reform will reflect a mixture of new policies (expanding coverage and quality) and of the need to cater to a larger share of elderly people. Given that current LTC spending does not seem to follow demand automatically, it is a reasonable step to include the need for a growing share of elderly as part of the reform scenario rather than the baseline. Indeed, spending data available from Eurostat and the OECD Health Database show that over the last ten years or so, current spending on LTC (in per cent of GDP) has remained constant despite increased demand from an ageing population (see also The King’s Fund 2018).
Table 8. Annual long-term care spending requirements (2019 prices)
|
|
Baseline |
Expansion |
Baseline |
Expansion |
Baseline |
Expansion |
Baseline |
Expansion |
|
2030 |
2035 |
2030 |
2035 |
|||||
|
Region |
billions US$ (2019 prices) |
% GDP 2030 |
% GDP 2035 |
|||||
|
Africa |
1.0 |
52.2 |
1.1 |
81.9 |
0.04 |
2.04 |
0.04 |
2.61 |
|
Americas |
188.4 |
839.7 |
208.6 |
938.3 |
0.55 |
2.45 |
0.55 |
2.48 |
|
Arab States |
0.0 |
25.6 |
0.0 |
29.4 |
0.00 |
2.58 |
0.00 |
2.67 |
|
Asia Lower |
6.7 |
163.9 |
8.4 |
269.2 |
0.08 |
1.85 |
0.08 |
2.40 |
|
Asia/Pac. Upper |
141.0 |
981.0 |
153.4 |
1 265.6 |
0.38 |
2.64 |
0.34 |
2.79 |
|
Europe |
354.4 |
475.7 |
380.7 |
530.7 |
1.33 |
1.79 |
1.32 |
1.84 |
|
All regions |
691.5 |
2 538.1 |
752.2 |
3 115.1 |
0.63 |
2.30 |
0.59 |
2.44 |
Note: “Asia Lower” stands for lower-middle- and low-income countries in Asia (including Kyrgyzstan); “Asia/Pac. Upper” stands for upper-middle- and high-income countries in Asia and the Pacific (including Kazakhstan); Europe includes Russian Federation, Turkey and Israel.
Source: Author’s calculations.
By 2035, total annual spending requirements on universal LTC services across all age groups would amount to US$3.9 trillion (3 per cent of GDP), of which about US$3.1 trillion would be additional spending (81 per cent). Africa would require 2.04 per cent of its GDP by 2030 and 2.61 per cent by 2035. The higher-income group in Asia, Europe and the Americas would all end up spending around 3 per cent to 3.2 per cent of their GDP on LTC by 2035, reflecting a much higher share of over 65s, although the additional investment is larger in Asia given the lower baseline spending.
Most of the variation in additional spending requirements between countries reflects differences in the ratio of nurses’ wages to GDP per capita. Countries like Spain and Greece have a relatively high ratio of nurses’ wages to GDP per capita (1.2 and 1.3, respectively). This, together with a large proportion of persons over 65, translated into a total annual spending requirement of more than 4 per cent of GDP, in contrast to less than 2 per cent in countries/territories like Hong Kong (China), Singapore and Latvia, which have similar shares of elderly in their populations but much lower nurses’ wages in proportion to GDP per capita.
Figure 4 shows that LTC services for the elderly population, despite this age group having greater needs and being allocated more LTC staff, only represent the majority of costs in Europe and high- and upper-middle-income countries of Asia, while LTC services for the working-age population account for the majority of costs in lower-to-middle-income countries of Asia and in Africa and the Arab States. 44 By construction, the demographic structure of each country entirely explains these cost differences.
Figure 4. Contribution of over 65s to total modelled costs of long-term care services
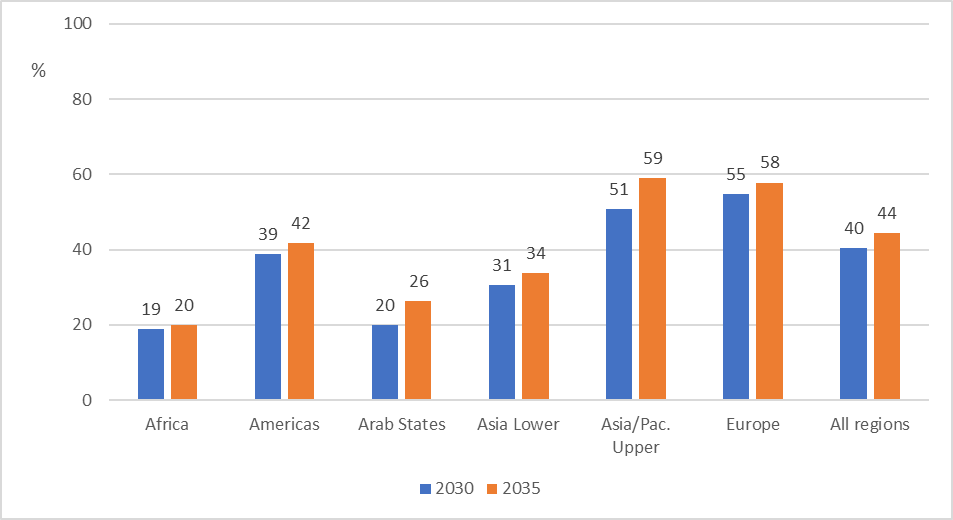
Note: “Asia Lower” stands for lower-middle- and low-income countries in Asia (including Kyrgyzstan); “Asia/Pac. Upper” stands for upper-middle- and high-income countries in Asia and the Pacific (including Kazakhstan); Europe includes Russian Federation, Turkey and Israel. Arab States include Saudi Arabia only.
Source: Author’s calculations.
Obviously, the levels of spending requirements presented in table 2 are substantial when compared to current healthcare spending, especially in low- and lower-middle-income countries, where current public spending on healthcare is in the magnitude of 1–2 per cent of GDP (WHO, n.d.). However, as calculated by Duran-Valverde et al. (2020), providing universal healthcare protection would require public spending to rise to about 10 per cent of GDP in low-income countries and 4 per cent of GDP in lower-middle-income countries. With these objectives, the simulated total LTC spending of table 2 (baseline + expansion) at around 2–2.5 per cent of GDP would be about half to a quarter of the required health spending increase in those regions, corresponding to proportions found in higher-income countries. For example, the simulated LTC spending of around 3 per cent of GDP in Europe is about half to a third of healthcare spending in those countries, which stands at 6–9 per cent (WHO, n.d.).
Both investments in long-term care and in healthcare are important and should be seen as complementary. While there are health benefits to gain from improving healthcare systems, such as some reduction in disability prevalence that might reduce the need for LTC services, such gains are limited, as the need for LTC services has far from disappeared in higher-income countries (indeed, they do not have substantially lower levels of disability prevalence). 45
Estimation of short-term economic benefits
5.1. Employment creation
Investing in childcare and long-term care creates jobs not only directly in the industry being invested in but in its supplying industries too (called “indirect” effects) and more broadly when newly employed workers use part of their increased earnings to spend in the local economy (called “induced” effects).
To estimate this additional job creation, a standard input–output analysis is carried out. Such an analysis rests on the use of input–output tables, which are statistical tables computed according to national accounting conventions. They show the relationship between industries and sectors of the economy, in terms of how much output (that is, the value of what it produces) of one industry is needed as input to produce one unit of output of another industry, and how much of each industry’s output do the government, households and export sectors consume. As demand for the output of one industry increases (for example, through investment in care services by a government), inputs from other industries will be purchased, thereby increasing labour requirements in those supplying industries (indirect effects). And as new people are hired both in the industry where the investment takes place (direct effect) and in the supplying industries (indirect effects), part of the wages of these employees are then spent in the domestic economy, further increasing demand for the outputs of different industries and thus increasing the employment requirements of these industries (induced effects). This is under the assumption that increase in demand can be met by increased production – that is, there is no supply constraint in the domestic economy.
Typically, total employment creation that includes both indirect and induced effects is seen as an upper-bound, while only including indirect effects is considered a lower-bound estimate (ILO 2018a). Following from the ILO (2018a) report
Total employment created in the economy as a result of direct and indirect effects is called the Type I effect. While direct employment creation is measured directly from the parameters of the simulated care investment (for example, number of staff required to provide childcare in each scenario), indirect effects are derived from the so-called Type I multiplier, which is calculated from the input–output table. The Type I employment multiplier of investing in a given industry returns the number of total (direct and indirect) jobs created in the economy per direct job created in that industry.
Given the labour supply effects of relieving unpaid care constraints to some extent, investing in care is not expected to create a shortage of employment and thus inflation in the economy overall; neither is raising the wages of carers likely to increase the cost structure of other industries, as care is not a significant input in any other industry (that is, care is mostly a final consumption of households or government) (De Henau and Himmelweit 2021; Makaye Gongbé 2021).
For most countries in the list, input–output data with disaggregated sectors has been taken either from the OECD Structural Analysis (STAN) database (with the reference year 2015) or from the Data Library of the Asian Development Bank (with the reference year 2017). For some countries in Africa, the study uses publicly available social accounting matrices (SAMs), developed either by the International Food Policy Research Institute (IPFRI) or the Joint Research Centre (JRC) of the European Commission. 47 Appendix table A.1b provides the list of countries with the type of input–output table used. 48
In all three types of input–output data used in this study, the social work sector (industries 87 and 88 of ISIC rev4 2-digit, which include childcare and long-term care services) is amalgamated with the human health industry (industry 86) at ISIC one-digit level (industry Q); while pre-primary education is amalgamated with the broader education sector (industry 85) 49. The calculations do not correct fully for potential aggregation bias, as discussed in Kim et al. (2019). It is assumed that childcare investment will resemble investment in education, on the grounds that the model is based on a high labour intensity and wages on par with teachers in school. For long-term care, the aggregated sector “health and social work” is used as a proxy. Indirect effects derived from this aggregate proxy are adjusted to account for higher labour intensity in care than in the rest of the health system. 50
In these calculations, employment for both employees and the self-employed is measured in headcount without adjustment for working hours. The only adjustment that was deemed necessary was on self-employment in agriculture in seven African and seven Asian countries to reflect the much lower working hours compared to other industries. 51 Because this category of employment dominates the labour market in these countries, not adjusting their “workload” would inflate the employment creation results beyond plausible ranges.
Another important issue to bear in mind is that input–output tables, being a static snapshot of the economy in a given year, are a tool best suited for short-term impact analysis. This study simulates employment and investment requirements in 2030 and 2035. This entails results based on inter-industry linkages that would be 15 to 20 years old, given the reference years of the input–output data. Following ILO (2018a), it is assumed that the main structural inter-industry variables do not change over the period, so that the multipliers derived from the tables can be applied to the direct employment creation estimated for 2030 and 2035. Given the labour-intensive nature of care, which translates into small indirect multipliers, the potential distortion impact of any change in the composition of the supply chain is reduced, especially as the results are taken on aggregate; that is, the composition of the indirect effects by industry is not analysed.
5.1.1. Total employment creation
Table 9 shows the results of the estimations of employment creation overall (an increase in labour demand) and separately for the main two investment interventions in care services, by type of effect (direct and indirect). 52 Across all regions of the world, the total additional investment in both ECCE and LTC would increase employment by 280 million by 2030 compared to the baseline. With the 2035 investment targets, the increased employment would be nearly 300 million compared to the 2035 baseline. This represents an increase of nearly 10 per cent on the 3.1 billion people employed in these 82 countries in the baseline 2035 projection.
By 2035, the ECCE investment of 1.48 per cent of GDP would create 114 million new jobs and the LTC investment of 2.45 per cent of GDP would create 184 million new jobs.
Implicitly for this to be a genuine creation of jobs, such increase in labour demand needs to be met with corresponding increase in labour supply, either from the pool of unemployed or from additional labour force participation. Additional labour force participation – mostly from women substituting paid employment for unpaid care work – is likely to be strong, given that investment in universal high-quality care not only creates employment opportunities but also releases childcare and other care responsibilities that would otherwise impede the labour force participation of women. This is compounded by the effect of adequately paid maternity/parental leave that close the care policy gap, ensuring continuity in employment and earnings. 53
These results show that investing in care policies provides an excellent employment stimulus in the wake of the COVID-19 pandemic, responding to the UN Secretary-General’s call for a Global Accelerator on Jobs and Social Protection.
Table 9. Total net employment creation from investment in care, 2030 and 2035 (in millions of jobs)
|
|
ECCE investment |
LTC investment |
Both |
||||
|
Region |
Direct |
Indirect |
Total |
Direct |
Indirect |
Total |
Total |
|
|
|||||||
|
Africa |
19.4 |
5.0 |
24.5 |
12.5 |
4.3 |
16.8 |
41.3 |
|
Americas |
11.4 |
1.9 |
13.3 |
20.5 |
6.0 |
26.5 |
39.8 |
|
Arab States |
0.6 |
0.1 |
0.7 |
0.9 |
0.4 |
1.3 |
2.0 |
|
Asia Lower |
30.4 |
5.4 |
35.8 |
41.1 |
18.9 |
60.0 |
95.8 |
|
Asia/Pac. Upper |
19.4 |
3.4 |
22.8 |
38.9 |
12.6 |
51.6 |
74.3 |
|
Europe |
7.1 |
0.9 |
8.0 |
14.8 |
3.6 |
18.5 |
26.5 |
|
All regions |
88.3 |
16.7 |
105.0 |
128.8 |
45.8 |
174.6 |
279.6 |
|
|
|||||||
|
Africa |
23.8 |
6.1 |
30.0 |
14.1 |
4.8 |
18.9 |
48.9 |
|
Americas |
11.1 |
1.8 |
13.0 |
21.4 |
6.2 |
27.6 |
40.6 |
|
Arab States |
0.6 |
0.1 |
0.6 |
1.0 |
0.4 |
1.4 |
2.0 |
|
Asia Lower |
34.4 |
6.1 |
40.5 |
43.9 |
20.1 |
64.1 |
104.6 |
|
Asia/Pac. Upper |
18.9 |
3.3 |
22.2 |
40.4 |
13.1 |
53.5 |
75.7 |
|
Europe |
7.0 |
0.9 |
7.9 |
15.2 |
3.7 |
18.9 |
26.7 |
|
All regions |
95.9 |
18.3 |
114.2 |
135.9 |
48.4 |
184.3 |
298.6 |
Note: “Asia Lower” stands for lower-middle- and low-income countries in Asia (including Kyrgyzstan); “Asia/Pac. Upper” stands for upper-middle- and high-income countries in Asia and the Pacific (including Kazakhstan); Europe includes Russian Federation, Turkey and Israel. Arab States include Saudi Arabia only.
Source: Author’s calculations.
Employees and formal employment would constitute the bulk of employment creation in most regions, because the employment in care which dominates the overall effect is by construction made up of formal employees only. Even in the lower-income group, formal employment would be a very large part of the overall employment creation (81 per cent in Africa and 78 per cent in lower-income Asia, compared to 87 per cent in the Americas and higher-income Asia and up to 96 per cent in Europe). This is remarkable considering that 90 per cent or more of employment is currently informal in most of the lower-income countries.
In all regions, women take the larger share of the employment increase (78 per cent overall – which adds up to 220 million jobs by 2030 or 234 million by 2035), ranging from 70 per cent in the Arab States to 86 per cent in upper-middle- and high-income countries of Asia. This is expected, since direct employment effects in care are the larger contributor to the total increase, and women dominate the care sector.
These estimates assume that the gender distribution of employment in each industry is unchanged. The same assumption was made in ILO (2018a). This is a plausible assumption as gender segregation has been found to persist over time across various economies (Borrowman and Klasen 2020; Cohen 2016). However, improving the status of a female-dominated occupation (in terms of qualifications and pay) is a factor in attracting and retaining men in female-dominated occupations (Torre 2018). Therefore, it could be expected that an increase in care jobs with better working conditions and qualifications will reduce occupational segregation in the care economy. In addition, higher availability of care policies conducive of gender-equal caring behaviour might make it easier for women to take up other highly paid occupations (and more men to see caring occupations as a career), thus further reducing overall occupational segregation in the labour market.
Table 9 also shows that the share of direct employment creation in ECCE is slightly higher than that in LTC, reflecting smaller indirect (Type I) multipliers in the former as education is a more labour-intensive industry than long-term care. The share of direct jobs varies from 80 per cent to 89 per cent with the ECCE investment and 72 per cent to 80 per cent with the LTC investment.
5.1.2. Changes in gender employment gaps
Cross-regional differences in employment creation from investing in care can be more easily appreciated when compared to population sizes, even more so in this exercise, which projects population changes to different horizons. Figure 5 shows the increase in employment-to-population ratios overall (among 15–64-year-olds), assuming all jobs are going to that age group. The baseline employment rate is assumed constant at the level of 2019, under the plausible assumption that employment rates will have recovered from the impact of COVID‑19 by then, in line with IMF projections of GDP.
Overall, the simulated employment creation adds 6.3 percentage points (ppts) to the global employment rate of 58 per cent by 2035 when considering indirect effects only, ranging from 5.5 ppts in Europe to 7.5 ppts in Africa. If induced effects were added the total increase would be 9.1 ppts (and 12.5 ppts in Africa).
Figure 5. Changes in overall employment-to-population ratios (ages 15–64), 2035
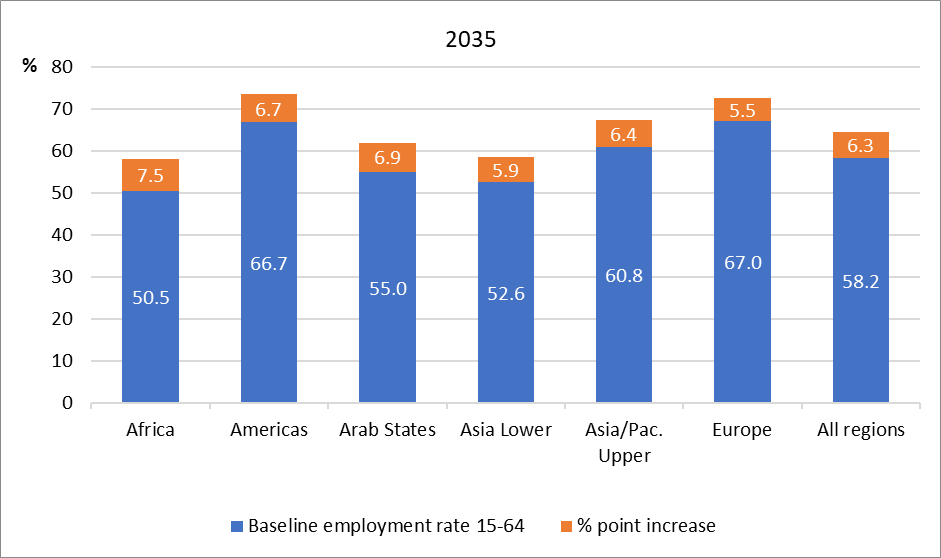
Note: “Asia Lower” stands for lower-middle- and low-income countries in Asia (including Kyrgyzstan); “Asia/Pac. Upper” stands for upper-middle- and high-income countries in Asia and the Pacific (including Kazakhstan); Europe includes Russian Federation, Turkey and Israel. Arab States include Saudi Arabia only.
Source: Author’s calculations.
Figure 6 shows the increase in employment-to-population ratios (ages 15–64) by gender for the 2035 scenario. As expected, women’s employment rate would increase far more than that of men. The difference between the two bars shows the decrease in the gender employment gap (that is, the gap between male and female employment rates). Overall, women’s employment rates would increase by 10.2 ppts and men’s by 2.6 ppts. This means the gender employment gap would be reduced by 7.4 ppts (from a current gender employment gap of 26 ppts). In relative terms, the gap would be reduced by half in Africa (from 14 to 6.6 ppts) and by nearly two-thirds in Europe (from 11 to 4 ppts).
Figure 6. Changes in employment-to-population ratios (ages 15–64) by gender, 2035 (percentage points)
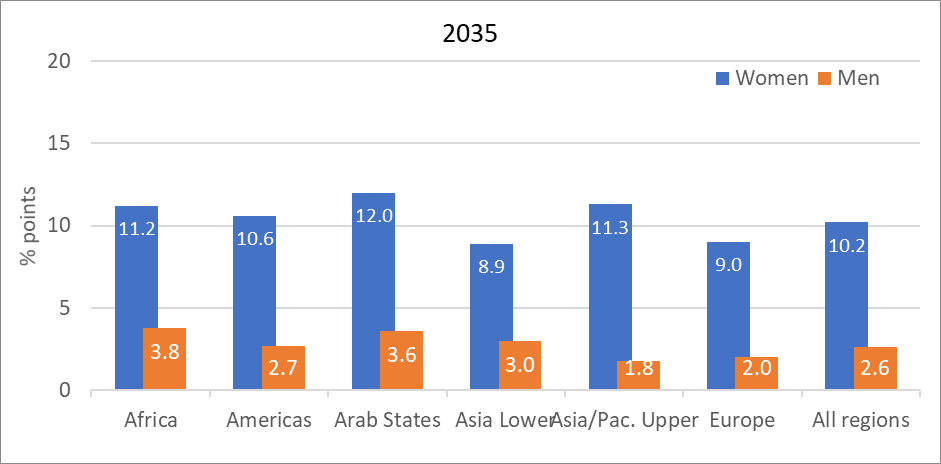
Note: “Asia Lower” stands for lower-middle- and low-income countries in Asia (including Kyrgyzstan); “Asia/Pac. Upper” stands for upper-middle- and high-income countries in Asia and the Pacific (including Kazakhstan); Europe includes Russian Federation, Turkey and Israel. Arab States include Saudi Arabia only.
Source: Author’s calculations.
The gender employment gap becomes negative or very small (below 3 ppts) in 31 countries (38 per cent of the sample), where baseline gender employment gaps are below 10 per cent. The gap remains between 4 and 12 per cent in another third of countries, most of which have medium-to-high gaps to start with of between 10 per cent and 20 per cent. The gap would still narrow by a good third in most countries in this group. The remainder of countries would benefit from a much smaller reduction of their gender employment gap, which reflects their heavily male-dominated current labour markets, a feature more pronounced in Arab countries in Northern Africa and the Middle East, as well as Turkey and countries in South Asia.
5.1.3. Employment in childcare and long-term care
Another interesting result from this exercise is the convergence of care employment in the total new employment across countries. Table 10 shows that employment in care would reach about 7 to 9 per cent of total employment post-reform. When excluding other social work from care employment, the current share of care employment in total employment is about 8 per cent in Denmark and 9 per cent in Norway. Even though this simulation exercise is performed across a wide range of economies and employment structures, this uniformity is unsurprising to some extent given the focus on universal provision on par with Scandinavian countries. This contributes to transform the economies towards becoming more caring.
Table 10. Share of the care sector (long-term care and ECCE) in total employment (%)
|
|
|
|
|
|
Africa |
0.2 |
8.1 |
8.5 |
|
Americas |
1.8 |
8.5 |
8.5 |
|
Arab States |
0.4 |
9.1 |
9.0 |
|
Asia Lower |
0.2 |
6.8 |
7.2 |
|
Asia/Pac. Upper |
0.9 |
6.5 |
6.9 |
|
Europe |
2.8 |
8.5 |
8.6 |
|
All regions |
0.9 |
7.3 |
7.6 |
Note: “Asia Lower” stands for lower-middle- and low-income countries in Asia (including Kyrgyzstan); “Asia/Pac. Upper” stands for upper-middle- and high-income countries in Asia and the Pacific (including Kazakhstan); Europe includes Russian Federation, Turkey and Israel. Arab States include Saudi Arabia only.
Source: Author’s calculations.
Nevertheless, this cross-regional uniformity masks cross-country differences. Care employment oscillates around 7–10 per cent of total employment in 90 per cent of the countries sampled, buts ranges from 4–5 per cent in countries like Viet Nam and Cambodia (two countries with very high overall employment rates) to 11 per cent in Senegal (a country with a very low overall employment rate).
For men, the share of care employment in total employment would remain very low, below 3 per cent in most countries, but would reach 6 per cent in Senegal.
For women, the share of care employment as a result of the investment would vary much more widely, reflecting initial levels of female employment. For most countries it would reach around 12–18 per cent, but would be as low as 6 per cent in Cambodia (which has very high female employment rates to start with) and as high as 28 per cent in India and Pakistan, and 37 per cent in Egypt and 40 per cent in Saudi Arabia, all reflecting very low initial levels of female employment to increase from.
5.2. Effects on unpaid care work time
This study implicitly assumes some substitution of formal care for unpaid care time and thus a reduction in women’s unpaid care work time through the effect on increased labour supply only. This is a strong assumption, as paid employment is not a full substitute for unpaid care time, and neither is formal childcare or long-term care, given the complementarities that can occur. More likely the substitution might mirror changes in time spent on household tasks overall, as earnings gained from employment can be used more broadly to outsource such activities (or to pay for time-saving equipment). This is expected to be the case, as childcare is a more desirable, “social” activity than more menial household tasks such as cleaning. Indeed, for European data, the difference in time spent on overall household tasks between “homemakers” and full-time employed women is more pronounced than that spent on childcare, even when only looking at those with childcare responsibilities (using HETUS 54 data for 2010 or thereabout, from the Eurostat database). The difference in the former is commensurate to the increase in time spent in paid employment.
The same sort of relative substitution is likely to occur in the other countries studied, albeit with a question mark for low-income countries where household tasks are more difficult to outsource or “save” because of lack of adequate basic infrastructure (for example, fetching water from a well). All in all, the full employment substitution implicitly assumed on the demand side (that is, with no supply constraint) is likely to represent an upper-bound. Therefore, it is important to note that substantial investments in care policy reforms should be accompanied by significant investments in basic infrastructure in lower-income countries (such as for water, transport, electricity) to enable effective use of the benefits of the care reforms, as should there be complementary investments in health and education more generally.
5.3. Tax revenue and net spending requirements
Tax revenue from the increase in economic activity (and substitution from unpaid to paid care work) is estimated using existing ratios of tax-to-GDP taken from the UNU-WIDER Government Revenue Dataset 55 (Prichard, Cobham, and Goodall 2014; McNabb 2017). The total tax and social security contributions revenue in per cent of GDP has been applied to the Type I GDP multiplier calculated using the same input–output and social accounting matrix (SAM) tables as for employment. This gives a proxy for the short-term (annual) fiscal “return on investment” per fraction of GDP invested in care. However, note that this fiscal “return” does not include any reduction in public spending on social security benefits that would stem from the increased employment and care investment (for example, unemployment benefits). 56
In any case this “return” is certainly not the whole picture of the fiscal and economic benefits of investing in care. The main story of a “social return on investment” is one of long-term benefits from increased employment of mothers of young children and unpaid carers, and of even longer-term economic benefits reaped by the children when they grow up, such as increased productivity and earnings (and thus tax revenue) and reduced public spending on social services and educational remediation, to name but a few. However, these long-term benefits are harder to quantify and beyond the scope of this study. 57
Bearing these considerations in mind, table 11 shows the gross and net amounts of total investment in care and paid leave (in per cent GDP), 58 that is before (gross) and after (net) the overall increase in short-term tax revenue is taken into account. The net investment represents the fiscal effort that would need to be funded through other resources (additional taxes, borrowing or rebalancing of government spending).
When measured in per cent of GDP, this fiscal effort is further reduced because the economy would have grown, pushing up the denominator (new GDP) to which the fiscal effort is related. 59 Table 11 shows the gross investment in proportion to the
Overall, about 27 per cent of the gross investment is recouped in short-term tax revenue on average across all regions, reducing the net investment that needs additional funding to 2.4 per cent GDP by 2030. The 2035 scenario would entail a net 2.8 per cent GDP in additional funding requirements. The Arab State of Saudi Arabia sees the lowest reduction in spending; just 9 per cent of its gross spending is recouped (because of low taxes) whereas 36 per cent is recouped in Europe. The other regions lie in between, reflecting their relative levels of formal activity and thus tax reach, as well as tax incidence.
Note that when including the induced effects, given higher employment and thus earnings and consumption that can be taxed, the short-term “self-funding rates” would increase overall from 27 per cent to 41 per cent, and up to 55 per cent in Europe.
Table 11. Gross and net (post-tax) investment in the care policy package
|
|
Gross investment |
Increase in real GDP from baseline |
Net investment |
% of investment (in % GDP) that is self-funding |
|||
|---|---|---|---|---|---|---|---|
|
Region |
billions US$ |
% GDP |
billions US$ |
(%) |
billions US$ |
% new GDP |
|
|
|
|
|
|
|
|
|
|
|
Africa |
156 |
6.1 |
128 |
5.0 |
136 |
5.1 |
18% |
|
Americas |
1 421 |
4.1 |
1 193 |
3.5 |
1 090 |
3.1 |
27% |
|
Arab States |
45 |
4.6 |
44 |
4.4 |
43 |
4.2 |
9% |
|
Asia Lower |
360 |
4.1 |
340 |
3.8 |
308 |
3.3 |
18% |
|
Asia/Pac. Upper |
1 581 |
4.3 |
1 379 |
3.7 |
1 226 |
3.2 |
26% |
|
Europe |
854 |
3.2 |
647 |
2.4 |
577 |
2.1 |
37% |
|
All regions |
4 416 |
4.0 |
3 731 |
3.4 |
3 380 |
3.0 |
27% |
|
|
|||||||
|
Africa |
231 |
7.4 |
191 |
6.1 |
203 |
6.1 |
18% |
|
Americas |
1 619 |
4.3 |
1 312 |
3.5 |
1 256 |
3.2 |
27% |
|
Arab States |
50 |
4.6 |
48 |
4.3 |
48 |
4.2 |
9% |
|
Asia Lower |
558 |
5.0 |
529 |
4.7 |
477 |
4.1 |
19% |
|
Asia/Pac. Upper |
1 996 |
4.4 |
1 747 |
3.8 |
1 551 |
3.3 |
26% |
|
Europe |
937 |
3.3 |
713 |
2.5 |
636 |
2.2 |
36% |
|
All regions |
5 392 |
4.2 |
4 540 |
3.6 |
4 171 |
3.2 |
27% |
Note: “Asia Lower” stands for lower-middle- and low-income countries in Asia (including Kyrgyzstan); “Asia/Pac. Upper” stands for upper-middle- and high-income countries in Asia and the Pacific (including Kazakhstan); Europe includes Russian Federation, Turkey and Israel. Arab States include Saudi Arabia only.
Source: Author’s calculations.
Europe shows greater reductions in fiscal requirements compared to the other regions, owing to large tax intakes in many countries. Of the 34 European countries sampled in this study, 27 would potentially recoup more than a third of the investment, with 9 countries seeing their gross fiscal effort recouped by above 40 per cent in the short term (with France being the highest at 46 per cent). 60 This results in most countries in the upper-middle- and high-income group (48 out of 57) having their annual net fiscal effort to provide universal childcare (including well-paid leave) and long-term care of high quality lie below 3 per cent of GDP, on par with the levels of public investment in the EU on average (European Commission 2017). And this ignores the lower spending on social security benefits (such as, on low-income and/or unemployment benefits) resulting from higher employment and earnings.
The total spending requirement remains high even in net terms, above 5 per cent of the new GDP, in about 15 countries, mostly in Africa, as well as in Pakistan, Nepal, Kyrgyzstan and Cambodia. The latter three countries stand out from their regional counterparts for having very high minimum wages in proportion to their average wages and/or higher average wages in proportion to GDP per capita. This helps explain greatly their higher costs of childcare leave and care investment relative to GDP.
The high pending requirements in lower-income countries may seem implausible to achieve, even across a 10- to 15-year period of progressive implementation, given current fiscal conditions in many of these countries, and their difficulty to borrow on international markets. But this exercise is meant to be transformative. It gives a sense of the coordinated effort required internationally to achieve those ambitious objectives that would transform the economy of these countries for the better. Granted, significant efforts are also required to improve social protection more generally, as well as healthcare and education in many of these countries (Durán-Valverde et al. 2020; ILO 2018a), but these need to be seen as complementary. As economies are reshaped and become more caring and more equal, with higher wages and more formal employment of higher quality, it is expected that the tax base will increase. This in turn would enable more structural tax reforms and thus reduce the net spending requirement annually over time. 61 In a recent ILO working paper, Bierbaum and Schmitt (2022) – building on Ortiz et al. (2019), Duran-Valverde et al. (2020) and ILO (2020a) among others – explore some of the funding options to close financing gaps of social protection floors, to which childcare, long-term care and leave policies are intrinsically linked. Focusing on domestic solutions, they recommend establishing fairer and more progressive tax systems, expanding social security coverage, fighting corruption and illicit financial outflows, and reprioritizing and reallocating public expenditure.
At the same time, international cooperation on trade and financial regulation should gear up towards enabling lower-income countries to retain more of the resources that are produced in their territory rather than them flowing out to richer countries, including through restructuring foreign debt (UN Women 2019). Ideas such as a global minimum wage, wealth transaction taxes, more stringent material footprint curtailment and international solidarity are all possible solutions to be mobilized together to see genuine progress being shared more globally (Hickel 2020).
Conclusion
This comprehensive study has aimed to shed a light on the annual public spending required to expand paid care leave and provide universal, high-quality services of childcare and long-term care, a key component of the social infrastructure of any economy. The study considered 82 countries, representing 94 per cent of the world GDP and 87 per cent of total employment, across all income groups and geographies.
Using simulation methods based on the current economic and demographic structure of each country, policy scenarios to close care policy gaps progressively by 2030 and 2035 were examined reflecting principles geared towards high-quality universal needs-based entitlements. The simulations also estimated the gender-equalizing employment effects of closing childcare and long-term care policy gaps. In other words, it examined the effects not only of investing in universal ECCE and LTC services, but also of expanding access to paid care leave for parents in order to achieve continuity of care and employment for many families, including those in informal employment – a novel aspect of this study.
Results have shown that the additional public spending required is a substantial part of GDP, and higher still in countries with less developed systems and large populations in need of care. The policy scenarios simulated in this study are far more ambitious than in the simulations carried out in ILO (2018a), albeit restricted to fewer areas of the care economy (that is, without examining school education and healthcare provision). Such ambitious levels of investment would transform economies to make them more caring, including with a larger proportion of total employment in care and stronger incentives for paid childcare leave for fathers. This would also result in substantial employment creation, not only in the care sector but in other industries as a result of indirect effects. Employment-to-population-ratios could rise significantly, by 6 percentage points on average overall and up to 10 percentage points for women; while it is expected to reduce the motherhood pay gap through continuity of care provision.
Reflecting persistent gender segregation in care and other industries, the vast majority of new jobs were simulated to go to women in most countries. This would reduce the gender employment gap substantially, to below 3 percentage points or even negative territory in a third of the countries studied.
The short-term recurrent benefits also extend to fiscal returns, with the net spending (in per cent of GDP) reduced for countries with relatively higher tax revenue (such as in Europe) or greater GDP multipliers (such as in Africa).
These changes would happen gradually, moving away from default positions of relying on private market solutions or unpaid care work. A virtuous cycle is expected to emerge: care constraints are relieved, allowing women to remain attached to the labour market with increased earnings. This would bring in more tax revenue to help fund care services and leave provision. At the same time more formal employment is created, expanding the tax base further. This would enable structural tax reforms and increases towards a sustainable path without choking off employment, contributing to making the investment pay for itself over time. Although not examined in this study, long-term benefits would also contribute to the fiscal effort, in the form of productivity increases from a better educated and better looked-after population, as well as through reductions in unpaid work and other aspects of social spending. In addition, in order to maximize the benefits of such investments, complementary investments are required in basic and social infrastructure, including water, sanitation, healthcare, education and social protection. However, these were beyond the scope of this study.
But, as repeated time and again in multiple outlets (ILO 2018a; De Henau and Himmelweit 2021; Kim et al. 2019; UN Women 2019), beyond these narrow economic considerations of fiscal and employment benefits, the best case to put forward about the need to keep investing in high-quality formal care services is the infrastructure case: an economy – let alone a society – cannot function and be sustained without adequate care provision. Ignoring the huge contribution of unpaid care work to gainful economic activities, as has become clear during the pandemic, is as dangerous as ignoring the damage that the “productive” sphere of the economy does to the environment. Therefore, rather than mostly worrying about whether or not they can afford public care provision, governments would benefit from primarily asking themselves whether they can afford not to care. It is hoped that this study will help in this way and reduce gender bias in the framing and making of policy.
Appendix 1. Note on calculating induced employment effects
Because of the labour-intensive nature of care work, induced effects from household consumption of employees’ increased earnings (from both direct and indirect job creation) are likely to be more prominent than indirect effects, especially in countries where the simulated pay rise is substantial (mostly low- and lower-middle-income countries). This note explains the assumptions required to derive induced effects.
The Type II employment multiplier of a given industry gives the number of total jobs created in the economy (that is, direct, indirect and induced jobs) per direct job created in the industry.
Some studies, such as ILO (2018a), stop short of estimating Type II employment effects with input–output analysis because of the problem of heterogeneous propensity to consume for households. Typically, in input–output tables using one aggregate household sector, 62 induced employment effects are the same for a given increase in total income irrespective of the industry in which the investment takes place, because household consumption is estimated on aggregate across all types of households. This reduces the aggregation bias of using proxy industries such as education and health for care investment. However, it may introduce another bias if wages in care do not reflect the average wages in the proxy industries. Calculations follow a method developed by De Henau and Himmelweit (2021) to correct for any difference between the modelled average wage in care and average wages in the proxy industries by adjusting the Type II employment multipliers of these industries. The problem of heterogeneity of households’ propensity to consume remains, but this is likely to cause less bias when investment is large – such as those envisaged in this study’s scenarios. It is likely that many households across the whole income distribution will benefit from the investment, so that an average propensity to consume based on the aggregate household sector seems adequate.
Note that the SAM-based derivation of Type II employment effects is straightforward when the household sector and the income paid to factors of production are endogenous to the model (Breisinger et al. 2009). SAM tables used in this study distinguish different households, which makes the calculation of the induced effect based on heterogeneous propensity to consume more accurate. The method to derive indirect and induced effects is similar to that used in input–output analysis, where industry input–output tables are augmented by the household sector to which compensation of employees is allocated.
Another issue raised in Type II calculations is the need to estimate the correct level of resources from which consumption is derived, which includes not just earnings but also unearned/saved income. The latter is taken into account with the average propensity to consume based on total resources available, using National Account data on primary and secondary resources.
Estimating induced employment effects also requires data on employment income of both employees and the self-employed, since part of this income will be spent in the economy by the households of the newly employed. Employment income for the self-employed cannot be identified in the input–output table data at hand, as it is amalgamated with the gross operating surplus of enterprises. Therefore, only the income of employees is used in the calculation of induced effects, and divided among both employees and self-employed workers. In most countries the self-employed form a small part of the employment creation, so this lower-bound estimate is not too problematic. Fortunately, in Sub-Saharan African countries, where self-employment constitutes the bulk of employment, the social accounting matrices consider all forms of income so that consumption effects can be calculated accurately for both employees and the self-employed.
Appendix 2. List of countries and sources
Table A.1a. List of countries by region and income level
|
Region |
Country/Territory |
iso3code |
Income group |
|---|---|---|---|
|
Africa |
Côte d'Ivoire |
CIV |
Lower-middle income |
|
Africa |
Egypt |
EGY |
Lower-middle income |
|
Africa |
Ethiopia |
ETH |
Low income |
|
Africa |
Ghana |
GHA |
Lower-middle income |
|
Africa |
Kenya |
KEN |
Lower-middle income |
|
Africa |
Morocco |
MAR |
Lower-middle income |
|
Africa |
Mozambique |
MOZ |
Low income |
|
Africa |
Nigeria |
NGA |
Lower-middle income |
|
Africa |
Rwanda |
RWA |
Low income |
|
Africa |
Senegal |
SEN |
Lower-middle income |
|
Africa |
South Africa |
ZAF |
Upper-middle income |
|
Africa |
Tanzania, United Republic of |
TZA |
Low income |
|
Africa |
Tunisia |
TUN |
Lower-middle income |
|
Africa |
Uganda |
UGA |
Low income |
|
Americas |
Argentina |
ARG |
Upper-middle income |
|
Americas |
Brazil |
BRA |
Upper-middle income |
|
Americas |
Canada |
CAN |
High income |
|
Americas |
Chile |
CHL |
High income |
|
Americas |
Colombia |
COL |
Upper-middle income |
|
Americas |
Costa Rica |
CRI |
Upper-middle income |
|
Americas |
Mexico |
MEX |
Upper-middle income |
|
Americas |
Peru |
PER |
Upper-middle income |
|
Americas |
United States |
USA |
High income |
|
Arab States |
Saudi Arabia |
SAU |
High income |
|
Asia and the Pacific |
Bangladesh |
BGD |
Lower-middle income |
|
Asia and the Pacific |
Cambodia |
KHM |
Lower-middle income |
|
Asia and the Pacific |
India |
IND |
Lower-middle income |
|
Asia and the Pacific |
Indonesia |
IDN |
Lower-middle income |
|
Europe and Central Asia |
Kyrgyzstan |
KGZ |
Lower-middle income |
|
Asia and the Pacific |
Lao People's Democratic Republic |
LAO |
Lower-middle income |
|
Asia and the Pacific |
Mongolia |
MNG |
Lower-middle income |
|
Asia and the Pacific |
Nepal |
NPL |
Low income |
|
Asia and the Pacific |
Pakistan |
PAK |
Lower-middle income |
|
Asia and the Pacific |
Philippines |
PHL |
Lower-middle income |
|
Asia and the Pacific |
Viet Nam |
VNM |
Lower-middle income |
|
Asia and the Pacific |
Australia |
AUS |
High income |
|
Asia and the Pacific |
Brunei Darussalam |
BRN |
High income |
|
Asia and the Pacific |
China |
CHN |
Upper-middle income |
|
Asia and the Pacific |
Fiji |
FJI |
Upper-middle income |
|
Asia and the Pacific |
Hong Kong, China |
HKG |
High income |
|
Asia and the Pacific |
Japan |
JPN |
High income |
|
Europe and Central Asia |
Kazakhstan |
KAZ |
Upper-middle income |
|
Asia and the Pacific |
Malaysia |
MYS |
Upper-middle income |
|
Asia and the Pacific |
New Zealand |
NZL |
High income |
|
Asia and the Pacific |
Republic of Korea |
KOR |
High income |
|
Asia and the Pacific |
Singapore |
SGP |
High income |
|
Asia and the Pacific |
Sri Lanka |
LKA |
Upper-middle income |
|
Asia and the Pacific |
Thailand |
THA |
Upper-middle income |
|
Europe and Central Asia |
Austria |
AUT |
High income |
|
Europe and Central Asia |
Belgium |
BEL |
High income |
|
Europe and Central Asia |
Bulgaria |
BGR |
Upper-middle income |
|
Europe and Central Asia |
Croatia |
HRV |
Upper-middle income |
|
Europe and Central Asia |
Cyprus |
CYP |
High income |
|
Europe and Central Asia |
Czechia |
CZE |
High income |
|
Europe and Central Asia |
Denmark |
DNK |
High income |
|
Europe and Central Asia |
Estonia |
EST |
High income |
|
Europe and Central Asia |
Finland |
FIN |
High income |
|
Europe and Central Asia |
France |
FRA |
High income |
|
Europe and Central Asia |
Germany |
DEU |
High income |
|
Europe and Central Asia |
Greece |
GRC |
High income |
|
Europe and Central Asia |
Hungary |
HUN |
High income |
|
Europe and Central Asia |
Iceland |
ISL |
High income |
|
Europe and Central Asia |
Ireland |
IRL |
High income |
|
Europe and Central Asia |
Israel |
ISR |
High income |
|
Europe and Central Asia |
Italy |
ITA |
High income |
|
Europe and Central Asia |
Latvia |
LVA |
High income |
|
Europe and Central Asia |
Lithuania |
LTU |
High income |
|
Europe and Central Asia |
Luxembourg |
LUX |
High income |
|
Europe and Central Asia |
Malta |
MLT |
High income |
|
Europe and Central Asia |
Netherlands |
NLD |
High income |
|
Europe and Central Asia |
Norway |
NOR |
High income |
|
Europe and Central Asia |
Poland |
POL |
High income |
|
Europe and Central Asia |
Portugal |
PRT |
High income |
|
Europe and Central Asia |
Romania |
ROU |
Upper-middle income |
|
Europe and Central Asia |
Russian Federation |
RUS |
Upper-middle income |
|
Europe and Central Asia |
Slovakia |
SVK |
High income |
|
Europe and Central Asia |
Slovenia |
SVN |
High income |
|
Europe and Central Asia |
Spain |
ESP |
High income |
|
Europe and Central Asia |
Sweden |
SWE |
High income |
|
Europe and Central Asia |
Switzerland |
CHE |
High income |
|
Europe and Central Asia |
Turkey |
TUR |
Upper-middle income |
|
Europe and Central Asia |
United Kingdom |
GBR |
High income |
Table A.1b. List of input–output data
|
Country/Territory |
Input–output data |
|---|---|
|
Côte d'Ivoire |
SAM 2013 |
|
Egypt |
SAM 2011 |
|
Ethiopia |
SAM 2015 |
|
Ghana |
SAM 2013 |
|
Kenya |
SAM 2014 |
|
Morocco |
OECD |
|
Mozambique |
SAM 2015 |
|
Nigeria |
SAM 2006 |
|
Rwanda |
SAM 2011 |
|
Senegal |
SAM 2014 |
|
South Africa |
OECD |
|
Tanzania, United Republic of |
SAM 2013 |
|
Tunisia |
OECD |
|
Uganda |
SAM 2013 |
|
Argentina |
OECD |
|
Brazil |
OECD |
|
Canada |
OECD |
|
Chile |
OECD |
|
Colombia |
OECD |
|
Costa Rica |
OECD |
|
Mexico |
OECD |
|
Peru |
OECD |
|
United States |
OECD |
|
Saudi Arabia ** |
OECD |
|
Bangladesh |
ADB |
|
Cambodia |
OECD |
|
India |
OECD |
|
Indonesia * |
OECD |
|
Kyrgyzstan |
ADB |
|
Lao People's Democratic Republic |
ADB |
|
Mongolia |
ADB |
|
Nepal |
ADB |
|
Pakistan * |
ADB |
|
Philippines |
OECD |
|
Viet Nam |
OECD |
|
Australia |
OECD |
|
Brunei Darussalam |
OECD |
|
China |
OECD |
|
Fiji |
ADB |
|
Hong Kong, China * |
OECD |
|
Japan * |
OECD |
|
Kazakhstan ** |
OECD |
|
Malaysia |
OECD |
|
New Zealand ** |
OECD |
|
Republic of Korea |
OECD |
|
Singapore ** |
OECD |
|
Sri Lanka |
ADB |
|
Thailand |
OECD |
|
Austria |
OECD |
|
Belgium |
OECD |
|
Bulgaria |
OECD |
|
Croatia |
OECD |
|
Cyprus |
OECD |
|
Czechia |
OECD |
|
Denmark |
OECD |
|
Estonia |
OECD |
|
Finland |
OECD |
|
France |
OECD |
|
Germany |
OECD |
|
Greece |
OECD |
|
Hungary |
OECD |
|
Iceland |
OECD |
|
Ireland |
OECD |
|
Israel * |
OECD |
|
Italy |
OECD |
|
Latvia |
OECD |
|
Lithuania |
OECD |
|
Luxembourg |
OECD |
|
Malta |
OECD |
|
Netherlands |
OECD |
|
Norway |
OECD |
|
Poland |
OECD |
|
Portugal |
OECD |
|
Romania |
OECD |
|
Russian Federation |
OECD |
|
Slovakia |
OECD |
|
Slovenia |
OECD |
|
Spain |
OECD |
|
Sweden |
OECD |
|
Switzerland |
OECD |
|
Turkey |
OECD |
|
United Kingdom |
OECD |
Notes: ** Countries with no micro-data (for paid care leave eligibility estimations). * Countries with no presence of children identifiable in micro-data. OECD STAN input–output data are for 2015 and ADB data for 2017.
References
Antonopoulos, Rania, and Kijong Kim. 2011. “Public Job-creation Programs: The Economic Benefits of Investing in Social Care”, Levy Economics Institute Working Paper No. 671.
Antonopoulos, Rania, Kijong Kim, Thomas Masterson, and Ajit Zacharias. 2011. “Investing in Care: A Strategy for Effective and Equitable Job Creation”, Levy Economics Institute Working Paper No. 610.
ADB (Asian Development Bank). 2021. “Data Library”, available at: https://data.adb.org/search/content/type/dataset.
Bierbaum, Mira, and Valérie Schmitt. 2022. “Investing More in Universal Social Protection: Filling the Financing Gap through Domestic Resource Mobilization and International Support and Coordination”, ILO Working Paper No. 44.
Bing Wu, Kin, Mary Eming Young, and Jianhua Cai. 2012.
Borrowman, Mary, and Stephan Klasen. 2020. “Drivers of Gendered Sectoral and Occupational Segregation in Developing Countries.”
Boulanger, Pierre, Hasan Dudu, Emanuele Ferrari, and Alfredo Mainar Causape. 2017.
Breisinger, Clemens, Marcelle Thomas, and James Thurlow. 2009.
Britto, Pia R., Stephen J. Lye, Kerrie Proulx, Aisha K. Yousafzai, Stephen G. Matthews, Tyler Vaivada, Rafael Perez-Escarmilla, Nirmala Rao, Patrick Ip, Lia C.H. Fernald, Harriet MacMillan, Mark Hanson, Theodore D. Wachs, Haogen Yao, Hirokazu Yoshikawa, Adrian Cerezo, James F. Leckman, Zulfiqar A. Bhutta. 2017. “Nurturing Care: Promoting Early Childhood Development.”
Cohen, Philip N. 2011. “The Persistence of Gender Segregation at Work.”
Cruz, António S., Fausto Mafambissa, Mónica Magáua, Vincenzo Salvucci, and Dirk van Seventer. 2018. “A 2015 Social Accounting Matrix (SAM) for Mozambique”, UNU-WIDER Working Paper 2018/20.
De Henau, Jerome. 2019. “Employment and Fiscal Effects of Investing in Universal Childcare: A Macro-Micro Simulation Analysis for the UK”, IKD Working Paper No. 83.
De Henau, Jerome, and Susan Himmelweit. 2021. “A Care-Led Recovery from Covid-19: Investing in High-Quality Care to Stimulate and Rebalance the Economy.”
De Henau, Jerome, Debbie Budlender, Fernando Filgueira, Ipek Ilkkaraçan, Kijong Kim, and Rafael Mantero. 2018.
De Henau, Jerome, Susan Himmelweit, and Diane Perrons. 2017.
De Henau, Jerome, Susan Himmelweit, Zofia Lapniewska, and Diane Perrons. 2016.
de la Maisonneuve, Christine, and Joaquim Oliveira Martins. 2015. “The Future of Health and Long-Term Care Spending.”
Denmark, Statistics Denmark. n.d. StatBank Denmark database. Available at: https://www.statbank.dk/statbank5a/default.asp?w=1280.
Durán-Valverde, Fabio, José Pacheco-Jiménez, Taneem Muzaffar, and Hazel Elizondo-Barboza. 2020a. “Financing Gaps in Social Protection: Global Estimates and Strategies for Developing Countries in Light of COVID-19 and Beyond”, ILO Working Paper No. 14.
European Commission. 2017. “Investment in the EU Member States: an Analysis of Drivers and Barriers”, Institutional Paper No. 062.
Eurostat. n.d. “Eurostat Database”, available at: https://ec.europa.eu/eurostat/data/database .
Evans, David K., Fei Yuan, and Deon Filmer. 2020. “Are Teachers in Africa Poorly Paid? – Evidence from 15 Countries”, World Bank Policy Research Working Paper No. 9358.
García, Jorge Luis, James J. Heckman, Duncan Leaf, and María José Prados. 2016. “The Life-Cycle Benefits of an Influential Early Childhood Program”, NBER Working Paper No. 22993.
Ghana Statistical Services, ISSER (Institute for Statistical, Social and Economic Research), and IFPRI (International Food Policy Research Institute). 2017. “2013 Social Accounting Matrix for Ghana”, available at: https://dataverse.harvard.edu/dataset.xhtml?persistentId=doi:10.7910/DVN/YVZ8KR.
Hickel, Jason. 2020.
Hoefman, Renske J., Job van Exel, and Werner B.F. Brouwer. 2013. “Measuring the Impact of Caregiving on Informal Carers: A Construct Validation Study of the CarerQol Instrument.”
Huston, Aletha C., Kaeley C. Bobbitt, and Alison Bentley. 2015. “Time Spent in Child Care: How and Why Does It Affect Social Development?”
Ilkkaraçan, Ipek, and Kijong Kim. 2019a.
IFPRI (International Food Policy Research Institute). 2014. “Rwanda Social Accounting Matrix (SAM), 2011”, available at: https://dataverse.harvard.edu/dataset.xhtml?persistentId=doi:10.7910/DVN/28532.
IFPRI (International Food Policy Research Institute) and CAPMAS (Central Agency for Public Mobilization and Statistics). 2016. “Egypt Disaggregated Social Accounting Matrix, 2010/11", available at: https://dataverse.harvard.edu/dataset.xhtml?persistentId=doi:10.7910/DVN/DH37H9.
ILO. 2014.
IMF (International Monetary Fund). 2021. World Economic Outlook Database, October 2021 edition. Available at: https://www.imf.org/en/Publications/WEO/weo-database/2021/October.
Japan, Ministry of Health, Labour and Welfare. 2019.
KNBS (Kenya National Bureau of Statistics). 2020.
Kim, Kijong, Ipek Ilkkaraçan, and Tolga Kaya. 2019. “Public Investment in Care Services in Turkey: Promoting Employment & Gender Inclusive Growth.”
The King’s Fund. 2018. “Key Challenges Facing the Adult Social Care Sector in England”, Kings Fund Briefing.
Kleven, Henrik, Camille Landais, Johanna Posch, Andreas Steinhauer, and Josef Zweimuller. 2019. “Child Penalties Across Countries: Evidence and Explanations.”
Koslowski, Alison, Sonja Blum, Ivana Dobrotić, Gayle Kaufman, and Peter Moss (eds). 2020.
Li, Weilin, George Farkas, Greg J. Duncan, Margaret R. Burchinal, and Deborah Lowe Vandell. 2013. “Timing of High-Quality Child Care and Cognitive, Language, and Preacademic Development.”
Lipszyc, Barbara, Etienne Sail and Ana Xavier. 2012. “Long-Term Care: Need, Use and Expenditure in the EU-27”, European Commission Economic Papers No. 469.
Mainar Causapé, Alfredo J., Pierre Boulanger, Hasan Dudu, Emanuele Ferrari, Scott McDonald, and Arnaldo Caivano. 2017.
Makaye Gongbé, Blaise. 2021. “Analysis of the Sectoral Causes of Inflation in Côte d'Ivoire: An Approach Using Leontief's Input-Output Multipliers.”
Manson, Nwafor, Xinshen Diao, and Alpuerto Vida. 2010. “A 2006 Social Accounting Matrix for Nigeria: Methodology and Results”, available at: https://dataverse.harvard.edu/dataset.xhtml?persistentId=doi:10.7910/DVN/LHXP97.
McNabb, Kyle. 2017. “Toward Closer Cohesion of International Tax Statistics”, UNU-WIDER Working Paper 184/2017.
Mengistu, Andualem T., Firew Bekele Woldeyes, Ermias Dessie, Zewdu Ayalew, Alekaw Yeshineh, Alfredo J. Mainar Causapé, Emanuele Ferrari, Arnaldo Caivano, and Javier Castro Malet. 2019.
New Zealand, Statistics New Zealand. n.d. NZ.Stat database. Available at: http://nzdotstat.stats.govt.nz/wbos/Index.aspx.
Norway, Statistics Norway. n.d. StatBank Norway database. Available at: https://www.ssb.no/en/statbank/.
Ortiz, Isabel, Anis Chowdhury, Fabio Durán Valverde, Taneem Muzaffar, and Stefan Urban. 2019.
OECD (Organisation for Economic Co-operation and Development). 2021. OECD.Stat database. Available at: https://stats.oecd.org/.
Prichard, Wilson, Alex Cobham, and Andrew Goodall. 2014. “The ICTD Government Revenue Dataset”, ICTD Working Paper No. 19.
Samman, Emma, Elizabeth Presler-Marshal, and Nicola Jones. 2016.
Scheil-Adlung, Xenia. 2015. “Long-Term Care Protection for Older Persons: A Review of Coverage Deficits in 46 Countries”, ILO Extension of Social Security Working Paper No. 50.
Schulz, Erika. 2010. “The Long-Term Care System in Denmark”, ENEPRI Research Report No. 73.
Simeu, N., S. Muthuri, C. Kabiru, D. Doughman, S. Laszlo, and S. Clark. 2017. “What Are the Benefits of Subsidized Early Childcare? Evidence from Kenya”, GrOW Research Series Policy Brief.
Sweden, Statistics Sweden. n.d. Statistical Database. Available at: https://www.statistikdatabasen.scb.se/pxweb/en/ssd/.
Torre, Margarita. 2018. “Stopgappers? The Occupational Trajectories of Men in Female-Dominated Occupations.”
UIS (UNESCO Institute of Statistics). n.d. UIS.Stat database. Available at: http://data.uis.unesco.org/.
UN (United Nations). 2021.
———. 2021b. “Investing in Jobs and Social Protection for Poverty Eradication and a Sustainable Recovery”, UN Secretary-General’s Policy Brief, 28 September.
UN Women. 2019.
UNDESA (United Nations Department of Economic and Social Affairs), Population Division. 2019. “World Population Prospects 2019 database”. Available at: https://population.un.org/wpp/.
UNU-WIDER (United Nations University World Institute for Development Economics Research). n.d. Government Revenue Dataset database. Available at: https://www.wider.unu.edu/project/government-revenue-dataset.
van Seventer, Dirk, Shannon Bold, Sherwin Gabriel, and Rob Davies. 2019. “A 2015 Social Accounting Matrix (SAM) for South Africa”, SA-TIED Working Paper No. 35.
WHO (World Health Organization). 2011.
Zacharias, Ajit, Thomas Masterson, Fernando Rios-Avilla, Michalis Nikiforos, Kijong Kim, and Tamar Khitarishvili. 2019.
Acknowledgements
The author would like to thank the team in the Gender, Equality, Diversity and Inclusion Branch (GEDI) of the ILO’s Conditions of Work and Equality Department (WORKQUALITY) for their great support and guidance throughout this project: Laura Addati, Umberto Cattaneo, Emanuela Pozzan and Lorena Pastor Palacios. Thanks also go to Manuela Tomei and Chidi King, who have been steering this project. The author is also extremely grateful for the detailed and continuous reviews received from various departments of the ILO, including from Maria Helena André, Christina Behrendt, Jae-Hee Chang, Amanda Claribel Villatoro, Valeria Esquivel, Roger Gomis, Steven Kapsos, Ursula Kulke, Oliver Liang, Yuta Momose, Shahrashoub Razavi, Victor Hugo Ricco, Emmanuelle St-Pierre Guilbault, Helmut Schwarzer, Lou Tessier, and Veronika Wodsak.
Finally, the author would like to thank the copyeditor, John Maloy, for helpful suggestions and thorough corrections, and Clémentine Etienne and the ILO Publications Production Unit for assisting with the production process.
This working paper would not have been possible without the financial support of the Bill and Melinda Gates Foundation.
This paper only reflects the views of the author and not those of the ILO, its constituents and donors.

