


Using Online Vacancy and Job Applicants’ Data to Study Skills Dynamics
Abstract
We assess whether online data on vacancies and applications to a job board are a suitable source for studying skills dynamics outside of Europe and the United States, where a rich literature has examined skills dynamics using online vacancy data. Yet, the knowledge on skills dynamics is scarce for other countries, irrespective of their level of development. We first propose a taxonomy that systematically aggregates three broad categories of skills – cognitive, socioemotional and manual – and fourteen commonly observed and recognizable skills sub-categories, which we define based on unique skills identified through keywords and expressions. Our aim is to develop a taxonomy that is comprehensive but succinct, suitable for the labour market realities of developing and emerging economies and adapted to online vacancies and applicants’ data. Using machine-learning techniques, we then develop a methodology that allows implementing the skills taxonomy in online vacancy and applicants’ data, thus capturing both the supply and the demand side. Implementing the methodology with Uruguayan data from the job board BuscoJobs, we assign skills to 64 per cent of applicants’ employment spells and 94 per cent of vacancies. We consider this a successful implementation since the exploited text information often does not follow a standardized format. The advantage of our approach is its reliance on data that is currently available in many countries across the world, thereby allowing for country-specific analysis that does not need to assume that occupational skills bundles are the same across countries. To the best of our knowledge, we are the first to explore this approach in the context of emerging economies.
Introduction
Major transformative phenomena, such as technological progress and trade, are shaping labour markets. Skills are an important factor in this process. They influence how labour market transformations change the relative demand for different jobs and occupations. For example, the demand for a given job or occupation rises if it relies heavily on skills that are complementary to a newly introduced technology. That same demand declines if instead a job or occupation requires skills that are substitutes of technological innovations. As a result, skills affect the comparative resilience of some groups of workers in contemporary labour markets, and the relative vulnerability of other groups.
A rich literature has thus examined skills dynamics in Europe and, in particular, the United States. Computer technology is found to replace work that can be routinized and to complement non-routine analytical and interactive work
In this paper, we assess whether online data on vacancies and applications to a job board (or job portal) are a suitable source for studying skills dynamics outside of the high-income economies that the literature has so far focused on. The advantage of this approach is its reliance on data that is currently available in many countries across the world, thereby allowing for country-specific analysis that does not need to assume that occupational skills are the same across countries. Another distinguishable feature is the ability to study detailed skills dynamics across time, representative of both labour demand and supply. This results from the panel nature and granularity of the data, which is distinct from currently available survey data from emerging and developing economies. Finally, to the best of our knowledge, we are the first to explore this approach in the context of an emerging economy.
This study relates to a growing literature that uses online vacancy data from the United States to study questions related to skills dynamics, as we use similar classification methods and big data in the context of an emerging economy.
In more detail, our taxonomy systematically aggregates three broad categories of skills – cognitive, socioemotional and manual – and fourteen commonly observed and recognizable skills sub-categories, which we define based on unique skills identified through keywords and expressions.1 Our aim is to obtain a taxonomy that is comprehensive but succinct, suitable for the labour market realities of developing and emerging economies and adapted to online vacancies and applicants’ data. We then develop a methodology that allows implementing this skills taxonomy in big online vacancy and applicants’ data. For this purpose, we take our taxonomy to the data, exploiting information from the Uruguayan job board BuscoJobs. BuscoJobs is the biggest private job-search portal in Uruguay. 2 Our data include the entire content uploaded between 2010 and 2020, capturing both the supply side (through applicants sharing their current profile and labour market biographies) and the demand side (in the form of vacancies posted by firms). Exploiting rich open-text descriptions of job ads posted by firms and employment histories of applicants, we pre-process the text, distil and analyze the keywords and expressions that pertain to a given skill. For this, we use machine-learning techniques (i.e., a natural language processing (NLP) model). To test our methodology, we use three types of metrics: first, the share of observations (vacancies and applicants’ job spells) classified in terms of their skills content; second, the degree of representativeness and bias of these data in comparison to the overall labour market, and how stable this is across time; and, finally, the possibility of capturing a broader set of skills vis-à-vis existing studies that have analyzed similar data in a high-income context and neglected, in particular, manual skills.
To preview our empirical results, we find that our NLP model performs well with regard to the number of observations (vacancies and applicants’ job spells) that we can characterize in terms of skills requirements and the skills that people have. The results significantly improve once we consider synonyms in addition to the keywords and expressions included in our pre-defined skills taxonomy. Then, 64 per cent of applicants’ job spells and 94 per cent of vacancies are assigned at least one of our 14 skills-subcategories. This means that we can classify a meaningful number of observations, which is especially notable considering the substantial heterogeneity in the quality of information available in the free-text descriptions we use to code the skills variables. This gives hope to the possibility of replicating our methodology in similar data sources of other countries. Further improvements to our methodology might be possible by training a prediction model. For example, we discuss the potential of using as a benchmark the skills classification of the Occupational Information Network (O-NET) Uruguay, which is currently in its pilot phase.
We also find that our data are not fully representative of the country’s labour force, based on the Uruguayan household survey. For example, applicants tend to be younger, more educated, and more likely to live in the capital, compared to the labour force. They are also more likely to work in clerical support occupations and are less represented in craft and other trades. This is inherent to online vacancy and applicants’ data and may require focusing the analysis on specific segments of the labour market and/or using weighting techniques to account for specific biases
Finally, we demonstrate the importance of capturing a mixture of different skills, which might be especially relevant when analyzing skills dynamics outside of Europe and the United States. A large share of classified skills (61 per cent in the case of the applicants’ data) is attributable to keywords and expressions from studies analyzing online data, which neglect manual skills. However, additional sources also play a meaningful role. For the applicants’ data, 31 per cent of classified skills thus relate to keywords and expressions from studies using non-online sources and 9 per cent to complementary keywords and expressions from the pilot version of O-NET Uruguay. Likewise, within occupations we find considerable differences when comparing our findings to what we would have obtained, had we used O-NET data from the United States.
This study advances the literature on skills dynamics in emerging and developing countries. While the relative scarcity in empirical evidence in these economies is in large part due to the absence of appropriate data, some studies have addressed this data challenge in innovative ways. One strand of the literature studies skills dynamics in low- and middle-income countries by imputing occupational task information from the United States’ O-NET data
This paper is structured as follows. Chapter 1 develops the skills taxonomy and explains how we classify unique skills within categories and subcategories. Chapter 2 describes the BuscoJobs data. Chapter 3 summarizes our methodology to implement the skills taxonomy in the BuscoJobs data. It describes the process we follow to create skills variables through the identification of keywords and expressions and the use of machine-learning techniques. The paper concludes with a brief discussion of how online job data could be used in the future to analyze a range of research questions for emerging and developing countries.
Assessing skills outside of Europe and the United States: A skills taxonomy for research purposes
Our taxonomy has to strike a balance between different objectives. To begin with, we want to categorize skills in a comprehensive way, capturing broadly defined skills with a view to understanding major labour market trends. In addition, we want these broadly defined skills categories to be suitable for a Latin American context and, more generally, to be representative of an emerging and developing-country labour market. This requires adjustments in comparison to approaches that were developed for a North American or European country context. Finally, our taxonomy needs to be suitable for an implementation using online data on job vacancies and applicants. This requires adapting the taxonomy to the mode of expression and vocabularies specific to this type of data.
With these objectives in mind, our taxonomy consists of the three broad categories of cognitive skills, socioemotional skills, and manual skills that we disaggregate into 14 sub-categories (Table 1). Recent research confirms that these three broad skills categories represent vastly different attributes. Across workers’ employment biographies, each category entails unique learning and adjustment patterns and therefore produces distinct returns
We deliberately focus on skills, rather than occupations. This is based on the realisation that, first, skills are a central dimension for understanding how major transformative phenomena, such as technological progress or trade, affect employment opportunities (e.g.,
As shown in Table 1, our taxonomy builds on
The fourteen subcategories of our taxonomy capture both skills that pertain to tasks that workers perform on the job10 and skills that refer to individuals’ personal attributes. Both types of skills are important to provide a consistent representation for labour market developments in a wide range of contexts. In combination, they encompass skills that employers demand in vacancies and skills that workers supply as presented in workers’ online profiles. It is important to note that even if some skills subcategories are closely related, the words used to categorize them are mutually exclusive.11 This allows for the unique identification of skills categories in our granular data.
Our categorization has the advantage of being both complete and succinct. The comprehensiveness of this approach is necessary for it to be relevant to different countries’ realities and is possible thanks to the granularity of online data. Meanwhile, its compactness into three broad categories and only 14 subcategories is tailored to research purposes, where overly detailed taxonomies or uncategorized lists of skills may add complexity that would be difficult to exploit in a meaningful way.
Table 1. Categorization of skills, keywords, and sources
|
Category |
Source of the category |
Keywords/expressions |
Source of keywords/expressions |
|---|---|---|---|
|
Cognitive skills |
|||
|
Cognitive skills (narrow sense) |
DK (2018) |
Problem solving, research, analytical, critical thinking, math, statistics |
DK (2018) |
|
Mathematics, adaptability, direction, control, planning |
ALM (2003) (from nonroutine analytic tasks) |
||
|
Data analysis, data engineering, data modelling, data visualization, data mining, data science, predictive analytics, predictive models |
DN (2020) |
||
|
Analyse, design, devising rule, evaluate, interpreting rule, sketch |
S-O (2006), APST (2020) (from nonroutine analytic tasks) |
||
|
Calculation |
ALM (2003) (from routine analytic tasks) |
||
|
Bookkeeping, correcting, measurement |
S-O (2006), APST (2020) (from routine cognitive tasks) |
||
|
Information processing, decision making, generation of ideas, memory |
O-NET Uruguay |
||
|
Computer (general) skills |
DK (2018) |
Computer, spreadsheets, common software, Excel, PowerPoint |
DK (2018) |
|
Computer literacy, Internet skills, Word, Outlook, Office, Windows |
|
||
|
Software (specific) skills and technical support |
DK (2018) & DN (2020) |
Programming language or specialized software, Java, SQL, Python |
DK (2018) |
|
Computer installation, computer repair, computer maintenance, computer troubleshooting, web development, site design |
DN (2020) |
||
|
Machine Learning and Artificial Intelligence |
DK (2018) DN (2020) |
Artificial intelligence, machine learning, decision trees, apache hadoop, Bayesian Networks, Automation Tools, Neural Networks, Support Vector Machines (SVM), Supervised learning, TensorFlow, MapReduce, Splunk, Convolutional Neural Network (CNN), Cluster Analysis |
DN (2020) |
|
Financial skills |
DK (2018) |
Budgeting, accounting, finance, cost |
DK (2018) |
|
Writing skills |
DK (2018) |
Writing |
DK (2018) |
|
Editing, reports, proposals |
DN (2020) |
||
|
Project management skills |
DK (2018) |
Project management |
DK (2018) |
|
Socioemotional skills |
|||
|
Character skills (conscientiousness, emotional stability and openness to experience) |
DK (2018) |
Organized, detail oriented, multitasking, time management, meeting deadlines, energetic |
DK (2018) |
|
Self-starter, initiative, self-motivated |
DN (2020) |
||
|
Competent, achieving, hardworking, reliable, punctual, resistant to stress, creative, independent |
KBHT (2016), HK (2012) |
||
|
Social skills (including agreeableness and extraversion) |
DK (2018) |
Communication, teamwork, collaboration, negotiation, presentation |
DK (2018) |
|
Team, persuasion, listening |
DN (2020) |
||
|
Flexibility, empathy, assertiveness |
KBHT (2016), HK (2012) |
||
|
Advice, entertain, lobby, teaching |
S-O (2006), APST (2020) (from non-routine interactive tasks) |
||
|
Interact with others, verbal abilities |
O-NET Uruguay |
||
|
People management skills |
DK (2018) |
Supervisory, leadership, management (not project), mentoring, staff |
DK (2018) |
|
Staff supervision, staff development, performance management, personnel management |
DN (2020) |
||
|
Customer service skills |
DK (2018) |
Customer, sales, client, patient |
DK (2018) |
|
Persuading, selling |
ALM (2003) (from nonroutine analytic and interactive tasks) |
||
|
Advertise, sell, buy, purchase |
S-O (2006), APST (2020) (from non-routine interactive tasks) |
||
|
Repetitive customer service |
ALM (2003) (from routine analytic and interactive tasks) |
||
|
Manual skills |
|||
|
Finger-dexterity skills |
ALM (2003), under routine manual tasks |
Picking, sorting, repetitive assembly, mixing ingredients, baking ingredients, sewing and decorative trimming, operating tabulating machines, packing agricultural produce |
ALM (2003) |
|
Control, equip, operate |
S-O (2006), APST (2020) |
||
|
Repetitive movements |
O-NET Uruguay |
||
|
Hand-foot-eye coordination skills |
ALM (2003), under nonroutine manual tasks |
Attending cattle, attending other animals, driving to transport passengers, driving to transport charge, piloting airplanes, pruning and treating ornamental and shade trees, performing gymnastic feats, performing other sports requiring skill and balance |
ALM (2003) |
|
Accommodate, renovate, repair, restore, serving, cleaning |
S-O (2006), APST (2020) |
||
|
Reaction on time, fine manipulations |
O-NET Uruguay |
||
|
Physical skills |
O-NET Uruguay |
Resistance, time dedicated to walking and running, carrying heavy loads |
O-NET Uruguay |
Notes: ALM (2003) stands for
Within the category of cognitive skills, we define the subcategory ‘cognitive skills (narrow sense)’ as the abilities or qualities needed to perform tasks that require analysis and calculation, problem-solving, intuition, flexibility and creativity
One strand of this literature thus looks at the polarization of occupations by skill level vis-à-vis technological change and automation.12 This literature finds that occupations largely requiring cognitive skills have thrived with the development of computer technology, both in terms of job creation and wage growth. This is driven by cognitive skills that are difficult to routinize (notably, those associated with non-repetitive cognitive tasks), where occupations relying on such tasks have been more resilient to technological shocks. Meanwhile, low-skilled occupations (also non substitutable by technology, as discussed below) have likewise witnessed a broad-based increase in employment, relative to middle-skilled occupations. More recent studies suggest that the rise of high-skilled occupations has evolved, documenting a reversal in the demand for cognitive skills in the United States in 2000
Another strand of the literature complements this knowledge by focusing on skill changes within occupations.13 These studies take advantage of richer data sources with greater granularity, such as vacancy data. They find substantial variation in skill requirements within occupations. While cognitive skills are an important driver of this variation, socioemotional skills are taking on a key role
Finally, we complete cognitive skills by adding five additional sub-categories from
Our second broad category of socioemotional skills adds to the categorization a set of personal attributes that involve intellect, but more indirectly and less consciously than cognitive skills. The literature uses a range of expressions to refer to such skills, including non-cognitive skills, soft skills, socioemotional skills, or personality traits.14 These different terms suggest different properties. First, we avoid the use of the term ‘non-cognitive skills’, as all skills require some sort of cognition. Second, while ‘traits’ gives a sense of immutability, ‘skills’ connotes the possibility of learning
Measuring and classifying socioemotional skills is a challenge. Yet, the psychology literature has arrived at a well-accepted categorization of these skills, called the “five-factor personality model” or “big five”
In terms of our taxonomy, we divide the five-factor model between the subcategories ‘character skills’ and ‘social skills’. Our sub-category ‘character skills’ follows
There is no single agreed way to aggregate the five-factor personality model into broader categories. Most researchers bundle together various socioemotional skills depending on their specific research questions. We aggregate them into ‘character skills’ and ‘social skills’, as distinguishing between all five categories separately would increase the probability of making mistakes at this finer level of aggregation, without necessarily adding considerable value to the analysis. Instead, the two groups of ‘character skills’ and ‘social skills’ are based on the similarities in their predictive nature that have been found by the empirical literature. As such, we bundle conscientiousness, emotional stability and openness to experience together within our subcategory ‘character skills’, because these three factors appear to share the ability to predict education and labour market outcomes, although not with equal strength
We complete the category of socioemotional skills with three of
The importance the literature attributes to social skills and other socioemotional skills has considerably increased during the last decade and policy debates emphasize the core relevance of these skills across workers’ life-cycles
Our third category, manual skills takes as point of departure how
The model by
Finally, we complement the categorization of manual skills with a ‘physical skills’ sub-category that pertains specifically to personal attributes, physical strength and effort, such as resistance, as well as related tasks such as those requiring walking and running, and carrying heavy loads.
Manual skills have been less studied in the literature than cognitive ones. One reason is that these tasks, especially the part that can be routinized, have been declining in the advanced world
While our taxonomy focuses on cognitive, socioemotional and manual skills, irrespective of their routine intensity, the discussion above shows that routine intensity of skills matters for understanding important labour market trends. As a result, routine intensity is central for the literature on skill-biased technological change. Specifically, the substitutability of routine-manual and routine-cognitive tasks by technology underlies the declining demand for middle-skilled labour, and hence the polarization of employment structures in high-income countries
To capture routine intensity in our categorization of skills, we followed the economic literature
Data and descriptive statistics
To implement our skills taxonomy empirically, we rely on online data from the Uruguayan online job board BuscoJobs. BuscoJobs is a private job board. It contains detailed information on (i) workers searching for jobs, (ii) vacancies posted by firms, and (iii) applications jobseekers have made to the vacancies posted. Our data cover the entire content uploaded on the job board from January 2010 through December 2020 in Uruguay, where BuscoJobs has its headquarters.20
To post online vacancies through BuscoJobs, enterprises need to create an account on the portal and pay a small fee. The portal offers several types of enterprise subscriptions, which cover different time spans and allow firms to publish a distinct number of vacancies (going from three to 600 vacancies, depending on the length and the type of subscription). All subscriptions enable firms to view users’ curriculum vitaes (CVs) for the duration of the chosen subscription. Given the information that firms provide in the vacancies they post, the database contains rich information on firm characteristics, industry, vacancy requirements in terms of education and experience, and vacancy characteristics such as working conditions. In addition, each vacancy has a job title and an open text describing each vacancy, which will be crucial for implementing our skills taxonomy and generating the International Standard Classification of Occupations (ISCO) variable.
As a distinguishable feature of BuscoJobs, the job board does not only offer the possibility to firms to post vacancies, but also allows jobseekers to register and apply for these vacancies directly through the portal. Jobseekers can create an account for free. They include in their profile basic personal information, information about their educational attainment, their entire history of employment, the technical skills they possess, and the languages they master. This allows us to observe rich longitudinal data on individuals’ characteristics and employment biographies. Jobseekers can also express their job preferences, whether they are actively seeking a job, whether they are employed or unemployed and whether they want their profiles to be fully visible by employers.21 Finally, the applicants include their past work experiences and ongoing employment spells. This is detailed in an open-text format, which is important for us to characterize the skills associated with these spells, according to our skills taxonomy, and to create the ISCO variables.
Another advantage of the BuscoJobs database, in comparison to other job boards and job aggregators in the country, is that BuscoJobs does not include duplicate job postings and presents a much lower volatility over time
2.1 Coverage and applicability of applicants’ and vacancy data to identify and measure skills variables
When assessing the demand and supply of skills, and pursuing any kind of related analytical work, online data have two general advantages, compared to other traditionally used data sources, such as labour force surveys (see also
First, online vacancies and applicants’ data have a high degree of granularity. This allows identifying detailed trends in skills and skills needs by generating variables of the tasks performed on the job, in the case of job seekers, and the tasks requested in vacancies. These statistical indicators can be computed without recurring to proxies, such as occupational categories or industries. They can thus measure an important but largely overlooked phenomenon, namely, the actual skills compositions of jobs and changes in skills within occupations
Second, online vacancy and applicants’ data is typically collected at high frequency, making it possible to avoid time gaps associated with more common data collection methods, such as survey data, which are sampled in ‒ sometimes long ‒ intervals. Given the real-time character of online data, some of the delays associated with the processing and cleaning of survey data can be avoided
One of the major drawbacks associated with the use of data from online job boards and aggregators is their representativeness. As they are not based on random sampling, it is difficult to draw generalised conclusions about the universe of firms or the overall working age population, as the data tend to be biased towards certain segments of the labour market, in particular higher-skilled occupations
The representativeness depends on several characteristics inherent to the country of interest for the analysis, including the internet penetration rate. In Uruguay, 83.4 per cent of individuals used the internet in 2019, according to ITU data.22 This is considerably above the global average, estimated at 56.7 per cent, and the regional level, reaching 68.3 per cent for Latin America and the Caribbean (LAC). These figures suggest that exploiting web-based big data in the Uruguayan context could be associated with less bias, compared to other countries. Nonetheless, also among more advanced countries where a high share of individuals uses the internet on a regular basis (e.g., the European Union, where 83.8 per cent of individuals used the internet in 2019, ibid), there are major differences in the share of vacancies posted online. Within the countries of the European Union, for example, the proportion of job vacancies published online in 2017 varied from below 50 per cent in countries such as Romania or Denmark to close to 100 per cent in Finland, Sweden and Estonia
Online vacancies also tend to be advertised by larger firms (e.g., international firms) and less by smaller firms, or firms operating in the construction, agricultural and hospitality sectors
Uruguay’s labour market characteristics are thus amenable to the use of online portals by firms and jobseekers. Beyond this, it is important to assess the degree and direction of biases of our data. As such, in the following we assess empirically the representativeness of the BuscoJobs data and investigate whether representativeness has changed over the period analyzed.
2.2 BuscoJobs applicants’ data
The BuscoJobs applicants’ database has 666,797 user profiles, out of which 388,041 include information related to their previous work experience, which is fundamental for our analysis. Since we could construct the detailed employment biographies of these individuals, our overall sample size consists of 1,231,555 job spells. As shown in Figure 1, we have good data coverage for all years between 2010 and 2020 and observe that the number of individuals joining the job board tended to increase between 2010 and 2017, to slightly decrease again until 2020.
The applicants’ database provides rich information about applicants’ personal characteristics (e.g., sex, birth dates, and places of residence), as well as previous work experience (e.g., job spells’ dates, position, location and a detailed open-text description of the position), and their education background. As mentioned above, applicants can also indicate the skills developed in each job spell and can participate in a soft-skills test, the results of which appear on the general profile of each user and are available to us. Furthermore, prior to the process of recognizing and classifying skills through our taxonomy, a classification of occupations was carried out through a machine-learning approach, where we created variables that further characterized employment spells in terms of the associated two-digit ISCO-08 occupation (more details on the machine-learning approach are provided in Chapter 3). This occupation variable, along the skills variables created, will allow us to capture skills compositions within occupations and assess the representativeness of the data in terms of the occupational distribution.
To assess the representativeness of the database, we compare selected characteristics of the job board’s users with information from the Uruguayan household survey, the Encuesta Continua de Hogares.24 We mostly rely on data for 2020 for our analysis, unless a variable of interest is not available, in which case we refer to 2019 data.25
Within the applicants’ data, 54.6 per cent are women, which is in line with estimates for the working-age population in Uruguay, of which 52.2 per cent were female in 2020. 66.5 per cent of the applicants were located in the Montevideo area in 2020, compared to 41.3 per cent of the overall labour force. The overrepresentation of the Montevideo area in the BuscoJobs applicants’ database is likely related to the different job-search methods used in large metropolitan areas, such as Montevideo, compared with smaller urban areas or rural areas. This is consistent with the previous finding of the higher relevance of print media and word-of-mouth communication in rural areas

Notes: We exclude a small share of individuals joining the job board in earlier years, since our data cover all profiles that were active between January 2010 and December 2020.
In terms of the age distribution, the applicants’ data contains a disproportionately high share of younger applicants (Figure 2). This discrepancy is the most pronounced among individuals aged 25-29, who account for 26.2 per cent of BuscoJobs users in 2020, compared to nine per cent of the Uruguayan working-age population in the same year. More similar representations are observed for the age category 35-39, that accounts for 12.5 per cent of BuscoJobs users and 11.3 per cent of the working-age population. The tendency is inverted as older age categories are taken into account.
The larger share of young portal users is intuitive given their stronger familiarity and use of IT tools, compared with older workers. It can also be rationalized by younger workers entering the labour market for the first time, and thus searching more actively for employment. However, it is somewhat difficult to put our findings into perspective, since previous studies using online applicants’ data do not provide similar age information.27
Figure 2. Age distribution, BuscoJobs applicants' database compared to household survey data, 2020

Notes: Author’s calculations based on BuscoJobs applicants’ database (orange line) and the Uruguayan household survey data (blue line). Household survey data calculations consider the labour force as the comparison group.
When looking at educational attainment, we find that applicants using the BuscoJobs job board have a higher level of education compared to the Uruguayan labour force. In 2019, 27.3 per cent of BuscoJobs applicants possessed an undergraduate degree and 32.3 per cent a graduate or technical degree. Meanwhile, according to data from the Uruguayan household survey, 12.3 per cent of the labour force had achieved the first degree of tertiary education, and 2.3 per cent had completed a degree of the secondary stage of tertiary education.28
In terms of the occupational distribution, Figure 3 shows a certain divergence when comparing BuscoJobs applicants’ employment spells in 2020 with the national estimates for the same year. Notably, a disproportionately large share of the BuscoJobs users was employed in a clerical support profession (34.8 per cent), while none of the users indicated any work experience in an agricultural profession, meaning that this category is completely absent from the database. This suggests that when analyzing the applicants’ data, it may be appropriate to focus on certain groups of workers that are well represented without making inferences to the whole population and/or to use weighting techniques to improve representativeness. As a matter of comparison, while many studies exploiting online applicants’ data do not provide information on individuals’ occupations,
Figure 3. Comparison of the occupational distribution across applicants' employment spells and the national occupational employment distribution in 2020 (%)
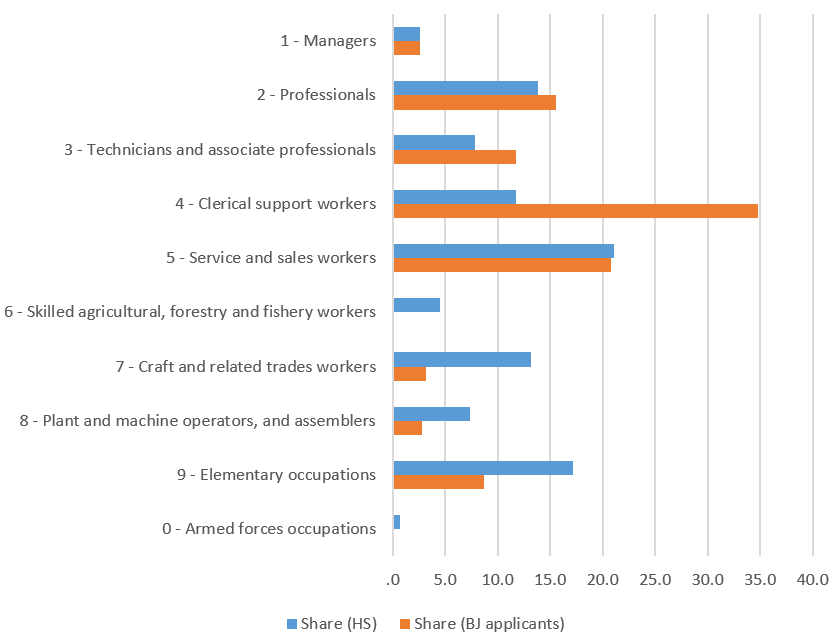
Notes: Author’s calculations based on BuscoJobs applicants’ database (orange bars) and Uruguayan household survey data (blue bars). The calculations based on the household survey take into account all people in employment. Occupations are defined according to the one-digit ISCO 08 classification.
While the applicants’ dataset is not fully representative of the overall employed population, it has several comparative advantages. The dataset includes reasonably large samples for occupations requiring intermediate or lower levels of formal qualification, such as services and sales workers, clerical support workers, and even workers from elementary occupations. This suggests that the data can be used for analyses that extend beyond highly qualified workers, which one might not have thought at first glance.30 Moreover, as mentioned above, the database contains rich information and its granularity – in particular the precise information on tasks performed on the job by individuals – is an asset to obtain a better understanding of skills dynamics.
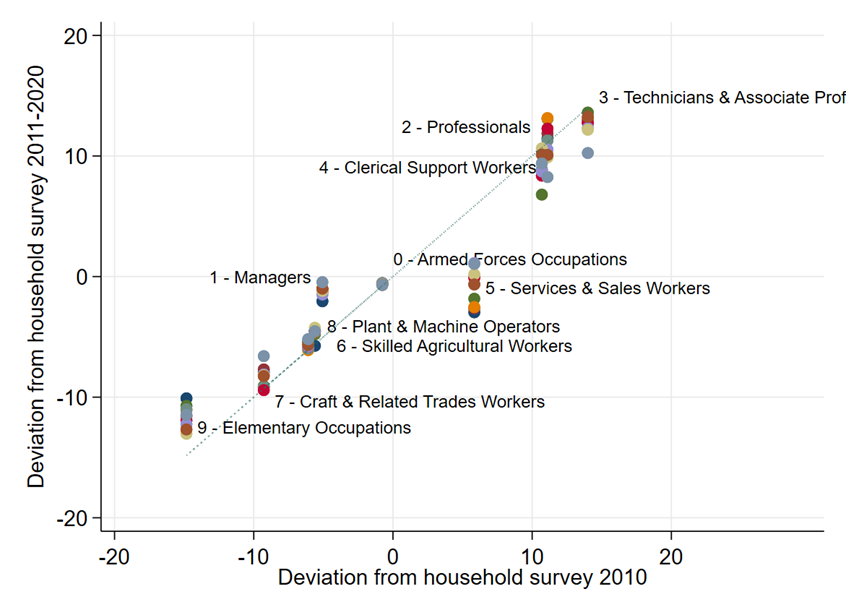
Figure 4. Representativeness of BuscoJobs occupations in applicants’ data, relative to occupational distribution in Uruguayan household survey data (2010-2020)

Notes: Author’s calculations based on BuscoJobs applicants’ database and Uruguayan household survey data. The Household Survey calculations are based on all people in employment. Based on
Although BuscoJobs’ applicants are disproportionally concentrated among younger and more educated jobseekers in the Montevideo area, looking for jobs in clerical and technical occupations, the distributions are stable across time as illustrated in Figure 4. A primary concern when using this data is whether the representatives of the sample changes over time as this would be a threat to internal validity of any analysis exploiting a temporal dimension
2.3 BuscoJobs vacancy data
BuscoJobs is one of the leading job boards in Uruguay. According to the provider’s calculations, it captures around 50 per cent of online vacancies in Uruguay (BuscoJobs market statistics shared with the authors), providing information that is detailed and reliable. Vacancies are recent and have high turnover and most of the fields available for each vacancy are complete
We restrict our attention to vacancies that refer to jobs located in Uruguay and the period from 2010 to 2020. This results in a total of 86,966 vacancies, posted by more than 6,000 firms. It is important to note that not every observation corresponds necessarily to one open position. In fact, 70.3 per cent of the job advertisements posted on the job board are associated to one vacancy only, while 12.1 per cent are associated to two vacancies (i.e., the firm aims to hire two people with the same job posting), and 8.1 per cent are linked to three to five open vacancies.
As shown in Figure 5, the number of vacancies posted in the job board has increased constantly to reach a peak in 2014. The observed numbers have remained at a high level also over the following years, with a drop in the job postings in 2020. This might be explained by the economic slowdown induced by the COVID-19 pandemic.
Figure 5. Absolute number of job postings per year
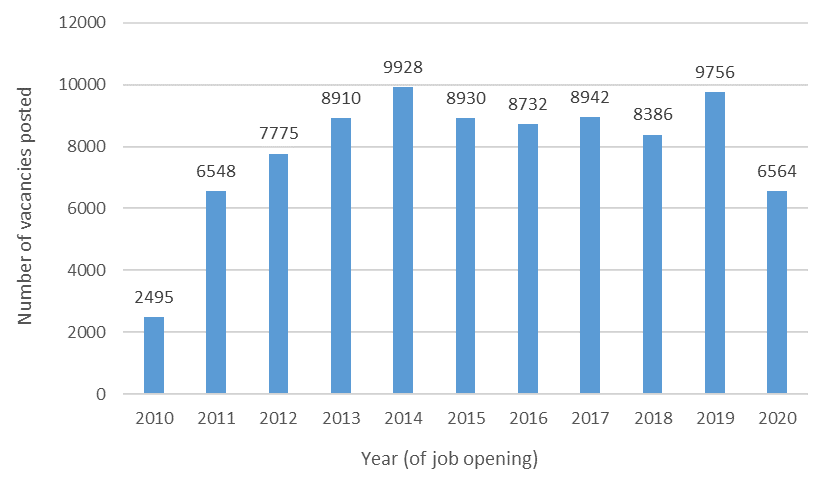
Notes: Authors’ compilation based on BuscoJobs online vacancies.
The job board allows capturing very detailed information associated with each job advertisement. This includes characteristics of the firm posting the vacancy (e.g., name and location), characteristics of the vacancy (e.g., desired age of the candidate and sex31, work experience expected, and the wage range offered for the advertised position) and a detailed description of the job advertised, along with the educational and the skills requirements. Furthermore, BuscoJobs generated upon request a variable indicating the economic sector to which an enterprise is associated, following the International Standard Industrial Classification (ISIC), Revision 4, at the four-digit level. For this, the BuscoJobs data were matched to the administrative database of enterprises produced by the country’s statistical institute (Instituto Nacional de Estadísticas, INE) with information until 201732, using unique firm identifiers. From 2018 forward, the matching to the ISIC Revision 4 was done manually using the economic activity reported by firms when registering in BuscoJobs. Finally, as for the applicants’ data, we created a variable capturing occupational categories, following the two-digit ISCO-08 classification and using a machine-learning approach (see Chapter 3 for details).
For the assessment of the representativeness of the BuscoJobs online vacancy dataset, we focus on the year of 2020 and again compare selected summary statistics to those derived for the same year from the Uruguayan household survey. This comparison is indicative only, given that the online job vacancy data and household survey data are collected in an inherently different way. Vacancy data depend on turnover rates in the labour market, which may differ across economic sectors, while the household survey data represent a snapshot of workers’ characteristics in a given moment. Nevertheless, this comparison yields meaningful insights to assess the representativeness ‒ or lack thereof ‒ of the data.33
To begin with, 61.3 per cent of the vacancies are located in the capital of Montevideo in 2020, compared to 41.3 per cent of the overall labour force. Moreover, the data from BuscoJobs online vacancies include a disproportionally high share of high- and medium-skilled professional categories, and underrepresents low-skilled occupations, when compared to national labour market estimates (see Figure 6). With 86.0 per cent of all online vacancies, the broad ISCO-08 categories 2-5 (i.e., professionals, technicians and associate professionals, clerical support workers, and service and sales workers) dominate in the BuscoJobs data. This suggests that the data allow for meaningful analysis especially of these groups of workers, which cover a significant share of the employed overall (54.0 per cent according to the household survey). Low-skilled occupations, captured by the broad category ‘elementary occupations’, are underrepresented in the BuscoJobs data, although they still account for 5.6 per cent of the observations (compared with 17.2 per cent in the household survey). Furthermore, skilled agricultural occupations are completely absent from the BuscoJobs online vacancy database, while they account for 4.6 per cent of the occupations observed in Uruguay.
Overall, these patterns are not surprising as national employment distributions across occupations deviate in similar ways from other online vacancy sources studied in the literature. This includes the BurningGlass data, which capture vacancies for professional jobs in a more comprehensive way than other types of vacancies
Figure 6: Comparison of the occupational distribution across BuscoJobs job vacancies and the national occupational employment distribution in 2020 (%)

Note: Authors’ calculations based on BuscoJobs online vacancies database and Uruguayan household survey data. Occupations are defined according to the one-digit ISCO 08 classification. The share in the household survey was calculated considering all people in employment.
As discussed above, we again look at changes in the representativeness of the BuscoJobs vacancy data over time to ensure the internal validity of temporal analyses. Reassuringly, Figure 7 illustrates no major changes in the occupational distribution over time, when comparing it with the same distributions from the Uruguayan household survey. The only exception are again services and sales workers in 2010.
Figure 7. Representativeness of BuscoJobs occupations in vacancy data, relative to occupational distribution in Uruguayan household survey data (2010-2020)
Notes: Author’s calculations based on BuscoJobs vacancy database and Uruguayan household survey data. The calculations based on the household survey consider all people in employment. Based on
Empirical implementation of the skills taxonomy
3.1 Text-mining model
To create the skills variables in the BuscoJobs data, we employ a text-mining approach and build on the taxonomy and the keywords and expressions34 that characterize each of the fourteen skill sub-categories that we pre-defined in Chapter 1. These keywords and expressions are the unique skills of which the sub-categories consist of. Our model consists of around 800 unique skills.35 We consider a skill sub-category as present in the vacancy or job spell of applicants whenever we identify at least one of its associated keywords or expressions (i.e., unique skill) or a pertinent synonym of one of its keywords. By using various keywords and expressions to define each subcategory, we are considering that each skill can be expressed in multiple ways. We carry out this process through Natural Language Processing (NLP) methods using Python. We also coded related variables capturing how many times a relevant unique skill (keyword/expression) appears in the data, as a proxy for skill intensity. We now describe the details of this method and then evaluate its performance in terms of the share of vacancies and applicants’ employment spells that the model could classify.
To begin with, we decided to rely on the open text-variables from the BuscoJobs data. Specifically, for the vacancy data we use the job title and vacancy description, while for the applicants’ data we focus on the applicants’ description of each job spell. Compared to other variables in the database, the open-text variables contain the most detailed information on the skills demanded and supplied. These variables are available for almost all vacancies (99.9 per cent) and most of the applicants’ job spells (68.5 per cent), in a functional manner as they contain a comparatively low share of missing values or meaningless observations (e.g., those with single letters and characters instead of meaningful text description). In addition, these variables are typically present in similar data sources and thus will allow for replicating our methodology using different databases.
Since we rely on free-text descriptions, we then organized the text variables in a way that allows computers to read, understand and process them. This NLP method works through machine learning (ML) techniques, storing words and the ways in which these words are combined in logical sequences. To do this, we processed our data, with the aim of distilling cleaned and useful pieces of information that facilitate the mapping between the skills taxonomy and BuscoJobs data in an efficient way:
-
Translation of keywords and expressions : As explained in Chapter 1, our skills taxonomy initially defines fourteen sub-categories through keywords/expressions that we identified from the existing literature on skills dynamics. Since our online data are in Spanish, we first translated the keywords/expressions from English. Appendix Table A2 provides this translation. -
Text normalization : As is typical for data analyses of this kind(see, e.g., Gentzkow, Shapiro, and Taddy 2019) , we normalized the text through text-mining techniques, mainly using the Natural Language Toolkit (NLTK)36 library in Python. This step was similarly performed for the relevant variables in the BuscoJobs data and for the list of keywords/expressions in the skills taxonomy. It included: (1) lowercasing of capital letters; (2) “unidecoding” to simplify characters and delete accents that are used in Spanish (for example, changing “á” to “a”); (3) eliminating all characters that are not actual text (for example, ”NaN” or “Null” values, which are the common representation of missing data in Python); (4) eliminating stop words, which are commonly used prepositions and conjunctions that do not provide useful information by themselves (for example, the Spanish equivalents of “the”, “a”, “of”, and “in”)37; and (5) eliminating other concepts that do not add value, such as names of months, days, cities and countries and single letters. -
Extended keywords and expressions in the skills taxonomy : So far, our pre-defined taxonomy does not consider that words can be expressed in multiple ways, while referring to the same concepts (e.g., when referring to “collaboration”, this could be done through the noun or through the verb “collaborate”). To account for this, we relied on the process of “stemming”, which reduces the words to their roots. This is equivalent to extending the set of words so they capture their various forms of expression (i.e., as a noun or verb, feminine or masculine forms, singular and plural forms, etc.). To give one example, the Spanish word “estadística” (i.e., “statistics”) has the root “estadistic”, which pertains to the various words capturing this concept, such as “estadística”, “estadístico”, “estadísticas”, “estadísticos.” The words stemmed can be either keywords or words that are part of an expression. -
Tokenization of the skills taxonomy : We tokenized the text information, moving from free-text format to a vector model. Tokenization yields a segmentation of texts into single words (so-called tokens) or phrases (i.e., a combination of several words, called n-grams, where “n>1” denotes the number of words included). The tokens and n-grams are then arranged as separated elements in a long list. To give an example, we had initially included in our skills taxonomy the expression “predictive analytics” as one of the terms characterizing “cognitive skills (narrow sense)”. We manually identify and consider other (Spanish) versions of the same concept, such as "Análisis Predictivo de Datos" or – after applying the text-normalization described before – "analisis predictivo datos". Once we carry out the tokenization, a total of seven elements are added to our list: the tokens "analisis", "predictivo" and "datos"; the 2-grams "analisis predictivo", "analisis datos" and "predictivo datos"; and the original 3-gram "analisis predictivo datos". In this way, we give our taxonomy greater power to capture relevant concepts within the free-text descriptions of vacancies and applicants’ job spells. The tokenization is carried out using the NLTK library but requires a manual revision of the results. For example, for “programming language” (included in the skills sub-category of “software (specific) skills and technical support”) we kept the token “programming” but deleted the token “language”, as the latter does not pertain to software skills and would have induced an error in the classification. The number of keywords/expressions in our taxonomy was still small enough to allow for such manual processing within a reasonable amount of time. -
Tokenization of the vacancy and applicants’ data : We similarly tokenized the relevant BuscoJobs variables, using an automated process based on the NLTK library, to distil all possible text combinations from the data. We imposed two restrictions on this automated process: (1) We identified all possible combinations of tokens, 2-grams, and 3-grams, but neglected combinations of four and more words. We imposed this restriction as our taxonomy includes normalized expressions with a maximum length of three words (such as the above example of "analisis predictivo datos"). (2) We kept the order of words as they appear in the original text description, as otherwise the task would not be manageable for a regular server to process.
With the text organized, we proceeded to create the skills variables:
-
Initial variable creation : For the creation of the skills variables, we coded indicator variables for each of the fourteen sub-categories of skills, which take the value of one whenever a relevant token or n-gram was identified in the BuscoJobs data. We also coded related variables capturing how many times a relevant keyword/expression appeared in the data, as a proxy for skill intensity. Here, we did not count repetitions of the same keyword/expression, but considered each keyword/expression only once per observation. -
Refined variable creation using synonyms : We further expanded the initial list of keywords by also accounting for their synonyms. For this, we used an automated webscrapping method that targeted the website www.wordreference.com and recorded, for each initial keyword from our taxonomy, direct, or first-order, synonyms.38 Once we had identified these additional keywords, we again performed the steps above with the extended keyword list (mainly the “stemming” process) and re-coded the skills variables. As we show in the section below, this method significantly increases the probability of identifying skills in the data. -
Manual correction : We scrutinized all synonyms manually and excluded a few, whose meaning would have caused misleading classifications. This was especially true for some synonyms in the manual skills category, which might have mistakenly captured managerial activities. For example, “solucionar” is most relevant in the context of finding solutions but was identified as a synonym of “reparar” (“to repair”). For a similar reason, we manually changed “controlar” (“to control”) to “controlar máquinas”, “controlar aparatos”, and “controlar artefactos” (“control machines” etc.). We also added relevant synonyms that we identified based on our work with the BuscoJobs data and previous knowledge, including accountant software programmes that frequently appear in vacancy texts and are relevant for capturing financial skills. To facilitate possible replications of our methodology, we provide the full set of initial keywords and additional synonyms in Table A3 in the Appendix.
3.2 Evaluation of the variable coding
Based on the number of observations (vacancies and applicants’ job spells) we could classify and the corresponding number of skills per observation (Table 2), we are satisfied with the performance of our text-mining approach.39 Using only the initial keywords and expressions and neglecting for the time being the number of times keywords/expressions appear in the data (i.e., the proxy for capturing the intensity of skills), we assigned on average 0.88 of our 14 skills sub-categories to each applicant-job spell observation (column (1) in Table 2), while the same average was 2.53 in the case of the vacancy data (column (3)). This is associated with the fact that 47.0 per cent of the applicants’ observations cannot be assigned any skill sub-category, whereas the same is true for 13.8 per cent of vacancies (columns (1) and (3)). Once we additionally consider synonyms, we assign an average of 1.47 skills sub-categories to the applicants’ job spells and 3.90 skills sub-categories to the vacancy data (columns (2) and (4)). The use of synonyms significantly reduces the number of applicants’ observations that cannot be assigned any skill to 35.9 per cent, and in the case of vacancies to only 5.7 per cent. This means that we can classify a meaningful number of skills, especially considering the substantial heterogeneity in the quality of information available in the free-text descriptions we use to code the skills variables (in particular, the self-reported text from applicants does not follow any standardized format). This gives hope to the possibility of replicating our methodology in similar data sources.
In addition, Table 2 allows drawing two central conclusions. First, the text-mining model performs significantly better when using a combination of keywords and synonyms to capture skills. This implies that the use of synonyms is a decisive step for implementing a skills taxonomy in online labour intermediation data. Second, the vacancy data tends to be richer than the applicants’ job spells in terms of the information provided that can be used to capture skills. For example, 6.3 per cent of vacancies are assigned eight or more skills sub-categories when using keywords and synonyms, compared with zero per cent in the applicants’ data. We note, however, that the statistics on applicants refer to a given employment spell. Once we aggregate skills over workers’ employment biographies, the average number of skills sub-categories increases to 2.45 (standard deviation of 2.51) per person (for the method that is based on keywords and their synonyms). Also, the share of persons without any assigned skill sub-category is only 24.6 per cent, compared to 35.9 per cent of all employment spells that cannot be classified.
Table 2. Evaluation of the success of the empirical implementation, all years
|
|
Applicants' data |
Vacancy data |
||
|
|
(1) |
(2) |
(3) |
(4) |
|
Average number of assigned skills sub-categories |
0.88 |
1.47 |
2.53 |
3.90 |
|
(standard deviation) |
(1.12) |
(1.66) |
(1.81) |
(2.51) |
|
Share with 0 skills |
0.470 |
0.359 |
0.138 |
0.057 |
|
Share with 1 skill |
0.322 |
0.268 |
0.191 |
0.105 |
|
Share with 2 skills |
0.124 |
0.156 |
0.200 |
0.131 |
|
Share with 3 skills |
0.049 |
0.100 |
0.181 |
0.157 |
|
Share with 4 skills |
0.021 |
0.056 |
0.143 |
0.159 |
|
Share with 5 skills |
0.009 |
0.030 |
0.082 |
0.142 |
|
Share with 6 skills |
0.004 |
0.017 |
0.043 |
0.113 |
|
Share with 7 skills |
0.001 |
0.009 |
0.016 |
0.073 |
|
Share with 8+ skills |
0.000 |
0.006 |
0.007 |
0.063 |
|
N |
843,761 |
843,761 |
87,019 |
87,019 |
Notes: Columns (1) and (3) refer to the skills sub-categories coded using the initial keywords and expressions, whereas columns (2) and (4) pertain to those coded also considering synonyms; see Chapter 1 for the definition of the 14 skills sub-categories (i.e., each skills sub-category is equal to one, whenever at least one unique skill/descriptive word is present in the data, and equal to zero otherwise). For the applicants’ data, the level of observation is at the applicant-job spell level. The vacancy data refer to individual postings.
Why can some observations not be classified? Despite the overall success of our text-mining model, we find that a notable share of observations, particularly in the applicants’ data, does not have any associated skill sub-category. A lack of sufficient text description drives this pattern. The unclassified employment spells have only 5.5 words on average (i.e., with many not containing any meaningful description) whereas the number of words significantly increases for employment spells with one or several mapped skills sub-categories (see Table 3). This may in part be related to the fact that some applicants include descriptions that are largely self-explanatory. For example, there are observations that only include the description “biology teacher”, presumably because the tasks and skills of a biology teacher are considered as being common knowledge.
Table 3. Correlation between the number of identified skills sub-categories and the number of words available in the text descriptions, all years
|
|
Applicants' data |
Vacancy data |
||
|
Number of words (mean) |
Words per skill sub-category |
Number of words (mean) |
Words per skill sub-category |
|
|
Number of assigned skills sub-categories |
(1) |
(2) |
(3) |
(4) |
|
0 |
5.5 |
21.0 |
||
|
1 |
9.9 |
9.9 |
30.1 |
30.1 |
|
2 |
18.5 |
9.3 |
41.0 |
20.5 |
|
3 |
31.0 |
10.3 |
54.5 |
18.2 |
|
4 |
46.5 |
11.6 |
66.6 |
16.7 |
|
5 |
66.3 |
13.3 |
79.5 |
15.9 |
|
6 |
91.0 |
15.2 |
95.0 |
15.8 |
|
7 |
121.5 |
17.4 |
111.9 |
16.0 |
|
8 |
161.8 |
20.2 |
145.2 |
18.2 |
|
9 |
223.0 |
24.8 |
184.7 |
20.5 |
|
10 |
456.0 |
45.6 |
275.8 |
27.6 |
|
11 |
333.0 |
30.3 |
- |
- |
|
12 |
- |
- |
524.0 |
43.7 |
Notes: Columns (1) and (3) refer to the mean number of words needed to identify the given number of skills sub-categories for the applicants’ job spells and vacancies, respectively. Columns (2) and (4) display the mean number of words per skill sub-category (i.e., with indicator variables equal to one). The results are based on the initial keywords and expressions, while neglecting the synonyms. The conclusions do not change when including also the synonyms.
Figure 8 further highlights the importance of including synonyms in the variable-coding process. By definition, the number of classified observations increases for each of the fourteen sub-categories. Interestingly, this effect is not uniform across categories. In the case of the applicants’ data, synonyms make a substantial difference for capturing cognitive skills (narrow sense), social skills, people management skills, and finger-dexterity skills. For the vacancy data, synonyms are additionally decisive for significantly increasing the number of identified character skills. Moreover, cognitive skills (narrow sense), customer service skills, people management skills, social skills, and finger-dexterity skills are the five categories that appear most often in the applicants’ data (i.e., looking at the variable that accounts for synonyms). These sub-categories, likewise, play the greatest role for the vacancy data, although there are some differences in the ordering. In addition, character skills, computer skills and software skills feature prominently in the vacancy data, but this trend is less obvious in the applicants’ data.
Figure 8. Skills distribution for applicants’ and vacancy data, comparing the initial keyword approach and the extended approach relying on keywords and synonyms, all years

-
-
Applicants’ data
-

-
-
Vacancy data
-
Notes: The figure displays the frequency with which the fourteen skills sub-categories appear in the applicants’ data (panel (a)) and the vacancy data (panel (b)), comparing the approach that relies on initial keywords and expressions (blue bars) with the approach that also exploits synonyms (orange bars).
Despite the success of NLP methods when extracting information about skills from the vacancies and applicants’ job spells and creating our skills variables, complementing this effort with a prediction model could have potential. However, a prediction model requires that a proportion of the data are classified using an external source of categorization (i.e., one that is not linked to our taxonomy or its implementation). In this way, the already classified part of the data can serve as a benchmark to train the prediction model against which the results obtained from our coding of the variables can be compared to. For example, this benchmark can be a classification carried out by a group of experts, based on clearly defined criteria and a review process of the classification results. Additionally, this benchmark must be long and varied enough to “teach” the computer and train the model properly, thus making it a demanding exercise. The lack of such a benchmark for skills variables currently prevents us from employing a prediction model. In the future, we will explore whether it might be possible to use a benchmark classification from O-NET Uruguay, which is currently in its pilot phase.
We already followed a similar approach for coding two-digit ISCO 08-occupations for both the vacancy and job applicants’ data. The same text variables used to classify skills were exploited and the pre-processing of the variables followed the same stages described above, namely, translation, text normalization, stemming, and tokenization. However, we took advantage of the existence of an external classification of occupations (carried out by BuscoJobs) to execute two classification processes using machine-learning techniques: (i) a classification based on text-mining techniques and NPL, similar to that carried out in our classification of skills; and (ii) a classification based on a predictive model, using as benchmark the existing classification carried out by BuscoJobs.
As part of process (i), we created a dictionary of keywords and expressions with high frequency using the free texts of both the vacancies and applicants’ job-spells variables, to which the corresponding ISCO-08 code was assigned. In specific situations, this required manual classification. Then, this dictionary was paired with the pre-processed texts achieving the classification based on the text matches. Regarding process (ii), we observed approximately 5,000 observations already classified at the four-digit level by BuscoJobs in each of the databases. Based on this and process (i), we trained a predictive model. After several tests, we concluded that a two-stage model would be the best approach. In the first stage, the model was able to predict the ISCO classification at the one-digit level, and the second stage was used for the classification model at the two-digit ISCO level. The strategy for training the model also included various steps: Reducing the databases to those observations when the dictionary-based model differed from the BuscoJobs’ classification; separating this subset into a training sample (two thirds of the data) and a test sample (one third); and searching for the best combination of model and parameters according to the results. Ultimately, we tested three models to process the text columns: Random Forest, Support Vector Machine, and Gradient Boosting. Through a comprehensive testing strategy of different combinations of hyperparameters and various cross-validations for each combination, we chose Gradient Boosting to code the one- and two-digit ISCO 08-occupations in the vacancy data and Random Forest for the applicants’ data.
3.3 Relevance of source types and comparison to O-NET-based results
We now investigate the usefulness of having combined a comprehensive set of studies and sources to devise our initial skills taxonomy (see Chapter 1). Alternatively, researchers could merely rely on one or several of the prominent studies using online vacancy data. Table 4 indicates that most identified keywords and expressions indeed stem from such studies (72.3 per cent for the vacancy data and 60.6 per cent for the applicants’ data).40 Yet, supplementary keywords and expressions from non-online data sources play a meaningful role, accounting for 17.7 per cent of identified unique skills in vacancies and 30.6 per cent in applicants’ job spells. The final source of O-NET Uruguay adds an additional 10.0 per cent for vacancies and 8.8 per cent for applicants. These latter two sources as thus important for capturing a broader set of skills. In particular, the two latter sources allow us to capture manual skills, which continue to be comparatively more important outside of Europe and the United States. Overall, this confirms the usefulness of our approach of combining a comprehensive set of different, seminal sources.
Table 4. Number of identified keywords/expressions in the vacancy and applicants’ data, attributable to different types of sources (absolute and % for all years)
|
|
Unique skills (keywords/expressions) captured (1) |
Source type 1: Online data (2) |
Source type 2: Non-online data (3) |
Source type 3: O-NET Uruguay (3) |
|
Vacancies |
372,879 |
269,603 |
65,853 |
37,411 |
|
(72.31%) |
(17.66%) |
(10.03%) |
||
|
Applicants |
1,065,305 |
645,809 |
325,416 |
94,080 |
|
(60.62%) |
(30.55%) |
(8.83%) |
Notes: The table displays the number of keywords/expressions identified across vacancies and applicants’ job spells and how these are attributable to different types of sources. For each vacancy or applicants’ job spell, we only consider unique skills (i.e., a keyword/expression could appear multiple times but is considered only once per observation). Moreover, we only consider initial keywords/expressions, and neglect synonyms, as these are less straight-forward to attribute to source types. Source types are the following: Type 1 refers to studies based on online-data, namely DK (2018), DN (2020), HK (2012), KBHT (2016). Type 2 refers to non-online based data, namely ALM (2003), S-O (2006), APST (2020). Type 3 refers to O-NET Uruguay, which we have used as a supplementary source. See Chapter 1 and Table 1 for more details.
We also assess how our approach compares to one that would have relied on imputing US O-NET data at the occupational level. For this purpose, we map O-NET skills categories to our taxonomy. For both the O-NET and the BuscoJobs applicants’ data, we then compute scores that capture the relevance of cognitive, socioemotional and manual skills at the one-digit occupational level, normalized to sum up to 100. This comparison yields clear differences between the country-specific BuscoJobs results and the US-based O-NET results. Across occupations, manual skills matter comparatively little according to the data from the United States. In contrast, manual skills play a larger role in the Uruguayan data, consistent with the expectation that manual skills matter more outside of high-income economies (Figure 9).41 This is especially the case for plant and machine operators and assemblers, elementary occupations, and crafts and related trades workers. Accordingly, these occupations have lower scores in the socioemotional skills category and, especially, the cognitive skills category.
A potential concern with this comparison is that the O-NET data are representative for occupations in the United States, whereas we documented in Chapter 2 that the BuscoJobs data are not representative for the Uruguayan labour market. Possibly, the comparison in Figure 9 is partly shaped by differences in the population covered. Yet even when we consider the example of clerical support workers, for which the BuscoJobs data have a particularly high coverage, there are discrepancies between the O-NET and BuscoJobs results. The Uruguayan data suggest a less important role for cognitive skills, while emphasizing manual skills more. Consistent with our general motivation for this study and previous findings in the literature
Figure 9. Relative importance of cognitive, socioemotional and manual skills at the one-digit occupational level, comparing O-NET data and BuscoJobs applicant data (2019)

-
-
Cognitive skills
-

-
-
Socioemotional skills
-

-
-
-
Manual skills
-
-
Notes: We focus on 2019 as this represents the most recent year prior to any distortions induced by the COVID-19 pandemic. For the BuscoJobs analysis, we focus on the applicants’ data, transformed to an annual panel. Across applicants’ job spells, we sum up the number of relevant keywords and expressions (including synonyms) identified in the data, per broad skill category and one-digit ISCO-08 occupation; expressed relative to the total number of unique keywords and expressions, including synonyms, that define each broad skill category. We then normalize the resulting scores for the three broad skill levels, such that their sum equals 100. The O-NET results were obtained by first mapping O-NET skills to the 14 skill sub-categories used in this paper. We rely on the O-NET database 24.1, where SOC 2010 codes were mapped to ISCO-08 four-digits using the crosswalk of the Bureau of Labour Statistics. The O-NET importance and level scores were standardized to a scale ranging from zero to 100. The data was then aggregated to ISCO-08 occupations for each skill by taking a simple average of standardized importance and level scores. Finally, a composite score was computed by taking the product between the average standardized importance and level scores.
Conclusions
Many countries outside of Europe and the United States currently lack longitudinal data on skills, despite the importance of the topic for policy makers and academic debates. We assess whether data from online job vacancies and applicants’ profiles, which are increasingly becoming available, can be a suitable source for studying skills dynamics. Based on the literature from the social sciences, in particular from labour economics and psychology, we derive a skills taxonomy that is comprehensive but succinct as well as applicable to individual country-contexts and to online data. The taxonomy consists of the three broad categories of cognitive, socioemotional, and manual skills as well as fourteen more detailed sub-categories, which are defined in terms of keywords and expressions. Based on natural language processing techniques, we then implement the taxonomy, exploiting data from the Uruguayan job board BuscoJobs. We are able to classify skills requirements and skills that applicants possess for a large number of job vacancies and applicants’ employment spells (94 and 64 per cent, respectively). We consider this a success going beyond our initial expectations, especially when taking into account that the implementation is based on free-text descriptions that do not necessarily follow a standardized format.
We conclude that data from online job vacancies and applicants’ profiles are a promising source for analyzing skills dynamics, including in countries where job boards and job aggregators do not have a long tradition. This is a relevant finding, given that these data capture country-specific developments, are available in many countries, and entail granular and longitudinal information, often for both labour demand and supply. We also analyze and discuss that such data are not fully representative of countries’ labour forces, which might require weighting techniques and/or an analytical focus on selected labour market segments. The BuscoJobs data are no exception to this trend. Yet, contrarily to what one might have expected ex ante, the data capture in meaningful ways intermediate and even lower educational levels of jobs and jobseekers in addition to highly qualified labour. Moreover, representativeness biases appear not to fluctuate substantially across time. Most importantly, BuscoJobs and similar sources of data allow studying skills dynamics in countries where this would otherwise not be possible given the current state of alternative data sources available.
This conceptual and methodological effort, the first carried out outside Europe and the United States, opens new doors for future research on skills dynamics. Such future research may address empirical questions related to the role of skills in fostering transitions to better jobs and in increasing the resilience of firms and individuals when facing global transformations that affect labour markets. Moreover, one could now study the skills composition of occupations and the within-occupational skills change at the national level, to either understand trends, evaluate the impact of shocks and regulations, or to test for the widespread use of other classifications of skills inspired from high-income countries.
Annex
Table A1. Comparison of the industrial distribution in 2020, BuscoJobs vacancies versus household survey data
|
Share BJ vacancies (1) |
Share HS data (2) |
|
|---|---|---|
|
A - Agriculture, forestry and fishing |
NA |
8.01 |
|
B - Mining and quarrying |
0.05 |
0.15 |
|
C – Manufacturing |
10.19 |
10.28 |
|
D - Electricity, gas, steam and air conditioning supply |
0.02 |
0.46 |
|
E - Water supply; sewerage, waste management and remediation activities |
0.09 |
0.65 |
|
F – Construction |
4.04 |
6.69 |
|
G - Wholesale and retail trade; repair of motor vehicles and motorcycles |
28.70 |
17.07 |
|
H - Transportation and storage |
1.60 |
5.17 |
|
I - Accommodation and food service activities |
1.74 |
3.44 |
|
J - Information and communication |
7.13 |
2.45 |
|
K - Financial and insurance activities |
2.13 |
1.74 |
|
L - Real estate activities |
1.61 |
0.57 |
|
M - Professional, scientific and technical activities |
11.97 |
4.07 |
|
N - Administrative and support service activities |
23.71 |
4.98 |
|
O - Public administration and defence; compulsory social security |
NA |
7.60 |
|
P – Education |
1.48 |
7.12 |
|
Q - Human health and social work activities |
3.84 |
8.96 |
|
R - Arts, entertainment and recreation |
0.78 |
1.62 |
|
S - Other service activities |
0.93 |
3.18 |
|
T - Activities of households as employers; undifferentiated goods- and services-producing activities of households for own use |
NA |
5.69 |
|
U - Activities of extraterritorial organizations and bodies |
NA |
0.09 |
|
X - Not elsewhere classified |
NA |
0.01 |
Notes: The table shows the industry distribution for the BuscoJobs vacancy data (column (1)) in comparison to overall employment, as captured in the household survey (column (2)), in 2020. Industries are classified according to the one-digit level of ISIC Revision 4.
Table A2. Dictionary of initial keywords and expressions, per skill sub-category (in Spanish)
|
Skill sub-category |
Initial keywords/expressions |
|---|---|
|
HABILIDADES COGNITIVAS (SENTIDO ESTRICTO) |
resolver problemas, investigacion, analisis, pensamiento critico, matematica, estadistica, matematica, adaptabilidad, direccion, control, planificacion, analisis datos, ingenieria datos, modelamiento datos, visualizacion datos, mineria datos, ciencia datos, analisis predictivo, modelos predictivos, analizar, disenar, reglas diseno, evaluacion, interpretacion, calculo, contabilidad, corregir, medicion, procesamiento informacion, toma decisiones, generacion ideas, memoria |
|
HABILIDADES COMPUTACIONALES (GENERALES) |
computadora, hojas calculo, programa, software, excel, powerpoint, internet, word, outlook, office, windows |
|
HABILIDADES COMPUTACIONALES (ESPECÍFICAS) |
lenguaje programacion, programacion, java, sql, python, instalacion de computadoras, reparacion de computadoras, mantenimiento computadoras, desarrollo web, diseno web |
|
HABILIDADES DE APRENDIZAJE MAQUINAL E INTELIGENCIA ARTIFICIAL |
inteligencia artificial, artificial intelligence, aprendizaje maquinal, machine learning, arboles de decision, apache hadoop, redes bayesianas, automatizacion, redes neuronales, support vector machines, svm, tensorflow, mapreduce, splunk, convolutional neural network, analisis cluster |
|
HABILIDADES FINANCIERAS |
presupuesto, contabilidad, finanzas, costos |
|
HABILIDADES DE ESCRITURA |
escribir, editar, reportes, propuestas |
|
HABILIDADES DE ADMINISTRACIÓN DE PROYECTOS |
administracion proyectos |
|
HABILIDADES DE CARÁCTER |
organizado, detallista, multitarea, puntual, energico, iniciativa propia, motivado, competente, diligente, esforzado, confiable, puntual, resistente estres, creativo, independiente |
|
HABILIDADES SOCIALES |
comunicacion, trabajo equipo, colaboracion, negociacion, presentacion, equipo, persuasion, escucha, flexibilidad, empatia, asertividad, consejo, entretener, lobby, ensenar, interaccion, habilidades verbales |
|
HABILIDADES DE GESTION DE PERSONAL |
supervision, liderazgo, gestion, mentoria, staff, supervision equipo, desarrollo equipo, gestion desempeno, gestion personas |
|
HABILIDADES DE SERVICIO AL CLIENTE |
cliente, venta, paciente, persuadir, vender, publicitar, vender, comprar, pagar, servicio cliente |
|
HABILIDADES DE DESTREZA CON LOS DEDOS |
recoleccion, clasificacion, ensamblaje, mezclar ingredientes, hornear, costura, corte, maquina tabulacion, empaque productos agicola, controlar maquinas, controlar aparatos, controlar artefactos, equipar, operar, movimientos repetitivos |
|
HABILIDADES DE COORDINACION OJO-MANO-PIE |
atender ganado, atender animales, conducir transporte pasajeros, conducir transporte carga, pilotar aviones, podar arboles, gimnasia, deporte equilibrio, acomodar, reparar, renovar, restaurar, servir, limpiar, reaccionar tiempo, manipulacion fina |
|
HABILIDADES FÍSICAS |
resistencia, caminar, correr, cargar peso |
Notes: The keywords and expressions correspond to those introduced in Chapter 1.
Table A3. Dictionary of synonyms for keywords (in Spanish)
|
resolver |
solucionar, aclarar, averiguar, descifrar, solventar |
|
investigacion |
exploracion, indagacion, averiguacion, busqueda, encuesta, pesquisa, sondeo |
|
analisis |
estudio, examen, observacion, comparacion, particion, separacion, distincion |
|
matematico |
exacto, cabal, preciso, justo, riguroso, automatico |
|
estadistico |
catastral, censual, demografico, descriptivo |
|
adaptabilidad |
ductilidad, elasticidad |
|
direccion |
gobierno, mando, jefatura, administracion, directivo, gerencia |
|
control |
inspeccion, observacion, examen, comprobacion, registro |
|
planificacion |
proyecto |
|
ingenio |
genio, inteligencia, listeza, talento, perspicacia, capacidad, seso, lucidez, razon |
|
ciencia |
sabiduria, sapiencia, conocimiento, erudicion |
|
analizar |
examinar, estudiar, observar, averiguar, comparar, considerar, descomponer, detallar, distinguir, individualizar, separar |
|
disenar |
proyectar, trazar, esbozar, esquematizar, abocetar, delinear, plantear |
|
evaluacion |
valoracion, tasacion, peritaje, estimacion, apreciacion |
|
interpretacion |
comentario, explicacion, analisis, apreciacion, lectura, glosa, definicion, conclusion, deduccion, entendimiento, exegesis |
|
calculo |
computo |
|
contabilidad |
administracion, tesoreria, caja |
|
corregir |
enmendar, subsanar, reformar, rehacer, modificar, retocar, perfeccionar |
|
medicion |
medida, evaluacion, calculo, sondeo |
|
procesamiento |
proceso |
|
decision |
determinacion, resolucion |
|
idea |
representacion, sensacion, percepcion, imaginacion, ilusion, pensamiento, juicio, comprension, conocimiento, concepto, nocion, reflexion, designio, arquetipo, modelo |
|
memoria |
recuerdo, evocacion, retentivo, rememoracion, mencion, conmemoracion |
|
programa |
exposicion, plan, planteamiento, proyecto, sistema, linea, conducto, programacion, esquema, borrador, boceto, bosquejo, anuncio, aviso |
|
programacion |
programa |
|
computadora |
ordenador, calculadora, procesador, electronico |
|
presupuesto |
calculo, computo, estimacion, evaluacion, partida, fondo, coste, determinacion |
|
finanzas |
negocio, economia, dinero, inversion, hacienda, capital |
|
costos |
coste, precio, importe, gasto, tarifa |
|
* |
softland, erp, sap, xubio, wave, cloudbooks, nubox, bloomberg, anfix |
|
escribir |
transcribir, manuscribir, copiar, anotar, firmar, rubricar, autografiar, trazar, caligrafiar, mecanografiar, taquigrafiar |
|
editar |
publicar, imprimir, difundir, reproducir, reimprimir |
|
reportar |
contener, refrenar, frenar, aplacar, apaciguar, calmar, sosegar |
|
propuesta |
proposicion |
|
organizado |
organico, estructurado, sistematizado, planeado, ideado |
|
puntual |
regular, exacto, preciso, formal, metodico, escrupuloso, diligente, rapido |
|
energico |
activo, decidido, resuelto, firme, eficaz, eficiente, emprendedor, dinamico, intenso, poderoso, tenaz, vigoroso, fuerte, concluyente, autoritario |
|
iniciativa |
decision, dinamismo, imaginacion, idea, adelanto, advenimiento, delantera, iniciacion, proyecto |
|
motivado |
originar, causar, promover, producir |
|
competente |
capacitado, cualificado, apto, idoneo, entendido, experto, diestro, capaz, especialista, eficiente, eficaz, habil, preparado |
|
diligente |
rapido, activo, agil, presto, resuelto, solicito, vivo, inquieto, expeditivo, listo |
|
esforzado |
animoso, atrevido, bizarro, valiente, luchador, ardoroso, brioso, afanoso |
|
independiente |
individualista, autosuficiente, liberado, emancipado, libre, autogobernado, autonomo, autonomico, alejado, aislado, neutral, autarquico, imparcial |
|
comunicacion |
comunicado, mensaje, oficio, nota, misiva, escrito, telegrama, circular, aviso, saludo, notificacion |
|
equipo |
conjunto, agrupacion, grupo, personal, cuadrilla, brigado, pandilla, camarillo |
|
colaboracion |
cooperacion, asistencia, auxilio, ayuda, contribucion |
|
negociacion |
convenio, pacto, tratar, concierto, tratado |
|
presentacion |
mostrar, manifestacion, exhibicion, exposicion, aparicion |
|
persuasion |
argumentacion, convencimiento, atraccion, seduccion, incitacion, sugestion |
|
escuchar |
atender, percibir, enterar |
|
flexibilidad |
ductilidad, elasticidad, maleabilidad, cimbreo, plasticidad |
|
consejo |
recomendacion, sugerenciar, advertencia, aviso, exhortacion, asesoramiento, indicacion, invitacion, observacion, opinion, parecer |
|
entretener |
distraer, divertir, agradar, amenizar, animar, recrear, alegrar, deleitar, aliviar |
|
ensenar |
instruir, adiestrar, educar, criar, adoctrinar, ilustrar, alfabetizar, catequizar, iniciar, explicar, aleccionar, preparar |
|
supervision |
inspeccion, control, revision, verificacion, vigilancia |
|
gestion |
tramite, diligencia, papeleo, mandato, encargo, mision, cometido |
|
desempeno |
desembargo, rescate, recuperacion, descargo |
|
persona |
individuo, sujeto, semejante |
|
cliente |
parroquiano, asiduo, comprador, consumidor, usuario |
|
venta |
enajenacion, transaccion, cesion, oferta, reventar, negocio, adjudicacion, saldo, comercio, despacho, exportacion |
|
paciente |
tolerante, sosegado, calmoso, tranquilo, estoico, resignado, sufrido, enfermo, flematico, manso |
|
persuadir |
convencer, inducir, mover, seducir, fascinar, impresionar, atraer, inclinar, incitar, arrastrar, impulsar |
|
vender |
traspasar, enajenar, expender, despachar, subastar, saldar, liquidar, exportar |
|
comprar |
adquirir, obtener, mercar, comerciar, traficar, negociar, chalanear, comerciar |
|
pagar |
abonar, remunerar, sufragar, apoquinar, retribuir, reembolsar, cotizar, desembolsar, compensar, recompensar, gratificar, costear, reintegrar, cancelar, liquidar |
|
servicio |
encargo, prestacion, asistencia, actuacion, destino, funcion, mision, oficio, ocupacion, favor, ayuda, auxilio |
|
recoleccion |
cosecha, siega, vendimia, acopio, acumulacion |
|
clasificacion |
ordenacion, separacion, distribucion |
|
ensamblaje |
ensambladura |
|
mezclar |
revolver, agitar, aunar, diluir, barajar, enredar |
|
ingrediente |
componente, remedio |
|
hornear |
gratinar, tostar, dorar, asar, brasear, calentar, cocer, preparar |
|
costura |
cosido, zurcido, calado, embaste, encaje, hilar, pespunte, vainica, bordado, dobladillo, cadeneto, sutura |
|
corte |
tajo, cortadura, incision, hendidura, herido, amputacion, tajadurar, cisura, tijeretado |
|
empaque |
|
|
producto |
articulo, fruto, manufactura, genero, elaboracion, resultado, obra |
|
equipar |
abastecer, proveer, dotar, aprovisionar, surtir, suministrar, vestir |
|
operar |
actuar, ejecutar, obrar, elaborar, ejercitar, manipular, efectuar |
|
ganado |
ganaderia, reses, animal, rebano, manada, hato, vacado, yeguada |
|
|
transportar, acarrear, trasladar, canalizar, encauzar |
|
transporte |
acarreo, traslado, porte, traslacion, carga, mudanzar, pasaje, transito, transbordo |
|
carga |
fardo, bulto, embalaje, lastre |
|
pilotar |
navegar |
|
podar |
cortar, talar, limpiar, desmochar, cercenar, escamondar, mondar |
|
gimnasia |
ejercicio, atletismo, deporte, entrenamiento, acrobacia, ejercitacion |
|
deporte |
ejercicio, gimnasia |
|
equilibrio |
|
|
acomodar |
|
|
reparar |
recomponer, restaurar, arreglar, remendar |
|
renovar |
restaurar, reconstruir, sustituir |
|
restaurar |
reparar, recomponer, renovar |
|
servir |
|
|
limpiar |
asear, adecentar, acicalar, higienizar, desinfectar, lavar, fregar, barrer, banar, duchar, enjuagar, humedecer, mojar, rociar, quitar, deshollinar, lustrar, abrillantar, pulir, frotar |
|
manipulacion |
fabricacion |
|
resistencia |
aguante, vigor, vitalidad, fuerza, energia, fortaleza, entereza, potencia |
|
caminar |
andar, pasear, trotar, vagar, trasladar, deambular, transitar |
|
correr |
trotar, galopar |
|
cargar |
embarcar, abarrotar, lastrar, colmar, estibar, transportar, acarrear |
Notes: See Chapter 3.1 for details on how the synonyms were obtained. The field marked by a * was added manually to capture software programs typically used by accountants, which are categorized under financial skills. Moreover, we manually went through all synonyms and took out those that capture other meanings than the initial keyword and underlying concept. For example, a synonym of “to transport” (“transporte”) is “conducir”, which can capture a supervisory activity where someone is leading a team. This explains why some cells are empty and others have fewer synonyms than would be identified when no manual correction is done.
References
Acemoglu, Daron, and David Autor. 2011. “Skills, Tasks and Technologies: Implications for Employment and Earnings”. In The Handbook of Labor Economics, edited by Orley Ashenfelter and David Card, 4:1043–1171. Amsterdam: Elsevier.
Acevedo, Paloma, Guillermo Cruces, Paul Gertler, and Sebastian Martinez. 2017. “Living Up to Expectations: How Job Training Made Women Better Off and Men Worse Off”. National Bureau of Economic Research Working Paper No. 23264.
Adhvaryu, Achyuta, Namrata Kala, and Anant Nyshadham. 2018. “The Skills to Pay the Bills: Returns to On-the-Job Soft Skills Training”. National Bureau of Economic Research Working Paper No. 24313.
Almeida, Rita, Carlos Corseuil, and Jennifer Poole. 2017. “The Impact of Digital Technologies on Routine Tasks. Do Labor Policies Matter?” World Bank Policy Research Working Paper No. 8187.
Almeida, Rita, Ana Fernandez, and Mariana Viollaz. 2020. “Software Adoption, Employment Composition, and the Skill Content of Occupations in Chilean Firms”. The Journal of Development Studies 56 (1): 169–85.
Almlund, Mathilde, Angela Lee Duckworth, James Heckman, and Tim Kautz. 2011. “Chapter 1 - Personality Psychology and Economics”. In Handbook of the Economics of Education, edited by Eric A. Hanushek, Stephen Machin, and Ludger Woessmann, 4:1–181. Amsterdam and Oxford: Elsevier.
American Psychological Association. 2020. “APA Dictionary of Psychology”. https://dictionary.apa.org/openness-to-experience.
Arntz, Melanie, Terry Gregory, and Ulrich Zierahn. 2016. “The Risk of Automation for Jobs in OECD Countries: A Comparative Analysis”. OECD Social, Employment and Migration Working Paper Series No. 189. Paris: OECD.
Atalay, Enghin, Phai Phongthiengtham, Sebastian Sotelo, and Daniel Tannenbaum. 2020. “The Evolution of Work in the United States”. American Economic Journal: Applied Economics 12 (2): 1–34.
Autor, David. 2014. “Polanyi’s Paradox and the Shape of Employment Growth”. National Bureau of Economic Research Working Paper No. 20485.
Autor, David, and David Dorn. 2013. “The Growth of Low-Skill Service Jobs and the Polarization of the US Labor Market”. American Economic Review 103 (5): 1553–97.
Autor, David, Frank Levy, and Richard Murnane. 2003. “The Skill Content of Recent Technological Change: An Empirical Exploration”. Quarterly Journal of Economics 118 (4): 1279–1333.
Bakker, Arnold, Evangelia Demeranti, and Lieke L. ten Brummelhuis. 2012. “Work Engagement, Performance, and Active Learning: The Role of Conscientiousness”. Journal of Vocational Behavior 80: 555–64.
Ballon, Paola, and Jorge Dávalos. 2020. “Inequality and the Changing Nature of Work in Peru”. UNU-WIDER Working Paper No. 168.
Barbarasa, Estera, Jacqueline Barrett, and Nicole Goldin. 2017. Skills Gap or Signaling Gap?: Insights from LinkedIn in Emerging Markets of Brazil, India, Indonesia, and South Africa. Report, Solutions for Youth Employment and LinkedIn.
Beaudry, Paul, David A. Green, and Benjamin M. Sand. 2016. “The Great Reversal in the Demand for Skill and Cognitive Tasks”. Journal of Labor Economics 34 (S1): S199–247.
Bhorat, Haroon, Morne Ossthuizen, Kezia Lilenstein, and Amy Thornton. 2018. “The Rise of the “missing Middle” in an Emerging Economy: The Case of South Africa”. Mimeo.
Bidisha, Sayema Haque, Tanveer Mahmood, and Mahir A. Rahman. 2021. “Earnings Inequality and the Changing Nature of Work: Evidence from Labour Force Survey Data of Bangladesh”. UNU-WIDER Working Paper No. 7.
Blair, Peter, and David Deming. 2020. “Structural Increases in Demand for Skill after the Great Recession”. AEA Papers and Proceedings 110 (May): 362–65.
Borghans, Lex, Angela Lee Duckworth, James Heckman, and Bas ter Weel. 2008. “The Economics and Psychology of Personality Traits”. Journal of Human Resources 43 (4): 972–1059.
Borghans, Lex, Bas ter Weel, and Weinberg, Bruce. 2014. “People Skills and the Labor-Market Outcomes of Underrepresented Groups”. Industrial and Labor Relations Review 67 (2): 287–334.
Bowles, Samuel, Herbert Gintis, and Melissa Osborne. 2001. “The Determinants of Earnings: A Behavioral Approach”. Journal of Economic Literature 39 (4): 1137–76.
Boyatzis, Richard E. 2008. “Competencies in the 21st Century”. Journal of Management Development 27 (1): 5–12.
Brunello, Giorgio, and Martin Schlotter. 2011. “Non Cognitive Skills and Personality Traits: Labour Market Relevance and Their Development in Education & Training Systems”. IZA Discussion Paper No. 5743.
BuscoJobs. 2021. “BuscoJobs”. https://www.buscojobs.com.uy/paginas/quienes-somosn.
BuscoJobs Internacional. 2021. “BuscoJobs Internacional”. https://www.buscojobs.com/.
Bustelo, Monserrat, Luca Flabbi, and Mariana Viollaz. 2019. “The Gender Labor Gap in the Digital Economy”. IDB Working Paper No. 01056. Washington, D.C.: Inter-American Development Bank.
Campos, Francisco, Michael Frese, Markus Goldstein, Leonardo Iacovone, Hillary C. Johnson, David McKenzie, and Mona Mensmann. 2017. “Teaching Personal Initiative Beats Traditional Training in Boosting Small Business in West Africa”. Science 357 (6357): 1287–90.
Carbonero, Francesco, Jeremy Davies, Ekkehard Ernst, Frank Fossen, Daniel Samaan, and Alina Sorgner. 2021. “The Impact of Artificial Intelligence on Labor Markets in Developing Countries: A New Method with an Illustration for Lao PDR and Viet Nam”. IZA Discussion Paper No. 14944.
Carneiro, Pedro, and James Heckman. 2005. “Human Capital Policy”. In Inequality in America: What Role for Human Capital Policies?, edited by James Heckman and Alan Krueger, Revised ed. edition. Cambridge, Mass.: The MIT Press.
Caunedo, Julieta, Elisa Keller, and Yongseok Shin. 2021. “Technology and the Task Content of Jobs across the Development Spectrum”. National Bureau of Economic Research Working Paper No. 28681.
Cedefop (European Centre for the Development of Vocational Training). 2015. “Work-Based Learning in Continuing Vocational Education and Training: Policies and Practices in Europe”. CEDEFOP Research Paper No. 49.
———. 2019. “Online Job Vacancies and Skills Analysis: A Cedefop Pan-European Approach”. Luxembourg: Publications Office of the European Union.
———. 2021. “Perspectives on Policy and Practice: Tapping into the Potential of Big Data for Skills Policy”. Luxembourg: Publications Office of the European Union.
Cherniss, Cary, Daniel Goleman, Robert Emmerling, Kimberly Cowan, and Mitchel Adler. 1998. “Bringing Emotional Intelligence to the Workplace”. In The Consortium for Research on Emotional Intelligence in Organizations, Rudgers University.
D’Anchiano. 2021. “D’Anchiano, The Easiest and Fastet Way to Evaluate Talent”. https://danchiano.com/.
Davies, Robert H., and Dirk van Seventer. 2020. “Labour Market Polarization in South Africa: A Decomposition Analysis”. UNU-WIDER Working Paper No. 17.
Deming, David, and Lisa Kahn. 2018. “Skill Requirements across Firms and Labor Markets: Evidence from Job Postings for Professionals”. Journal of Labor Economics 36 (S1): S337–69.
Deming, David, and Kadeem Noray. 2020. “Earnings Dynamics, Changing Job Skills, and STEM Careers”. Quarterly Journal of Economics forthcoming.
Di Capua, Laura, Virginia Queijo, and Graciana Rucci. 2020. Demanda de Trabajo En Uruguay: Un Análisis de Vacantes on Line. Inter-American Development Bank.
Equipos Consultores. 2020. Uruguay: Análisis de Oferta y Demanda de Empleo a Partir de Bases de Datos a 4 Meses de La Pandemia COVID-19. Montevideo: Equipos Consultores.
European Commission. 2013. “Work-Based Learning in Europe: Practices and Policy Pointers”. Brussels.
Fabo, Brian, and Lucia Mýtna Kureková. 2022. “Methodological Issues Related to the Use of Online Labour Market Data”. ILO Working Paper No. 68.
Frey, Carl, and Michael Osborne. 2017. “The Future of Employment: How Susceptible Are Jobs to Computerization?” Technological Forecasting and Social Change 114: 254–80.
Gentzkow, Matthew, Jesse M. Shapiro, and Matt Taddy. 2019. “Measuring Group Differences in High-Dimensional Choices: Method and Application to Congressional Speech”. Econometrica 87 (4): 1307–40.
Goleman, Daniel. 2000. “Leadership That Gets Results”. Harvard Business Review, no. March-April: 2–17.
Goos, Maarten, Alan Manning, and Anna Salomons. 2014. “Explaining Job Polarization: Routine-Biased Technological Change and Offshoring”. American Economic Review. 104 (8): 2509–26.
Green, Francis, David Ashton, and Alan Felstead. 2001. “Estimating the Determinants of Supply of Computing, Problem-Solving, Communication, Social, and Teamworking Skills”. Oxford Economic Papers 53 (3): 406–33.
Groh, Matthew, Nandini Krishnan, David McKenzie, and Tara Vishwanath. 2016. “The Impact of Soft Skills Training on Female Youth Employment: Evidence from a Randomized Experiment in Jordan”. IZA Journal of Labor & Development 5 (1): 9.
Grugulis, Irena, and Steven Vincent. 2009. “Whose Skill Is It Anyway? “Soft” Skills and Polarization”. Work, Employment and Society 23 (4): 597–615.
Hardy, Wojciech, Piotr Lewandowski, Albert Park, and Du Yang. 2018. “The Global Distribution of Routine and Non-Routine Work”. Institute for Structural Research Working Paper No. 5.
Heckman, James, Tomáš Jagelka, and Timothy D. Kautz. 2019. “Some Contributions of Economics to the Study of Personality”. National Bureau of Economic Research Working Paper No. 26459.
Heckman, James, and Tim Kautz. 2012. “Hard Evidence on Soft Skills”. Labour Economics 19 (4): 451–64.
Heckman, James, Jora Stixrud, and Sergio Urzua. 2006. “The Effects of Cognitive and Noncognitive Abilities on Labor Market Outcomes and Social Behavior”. Journal of Labor Economics 24 (3): 411–82.
Hershbein, Brad, and Lisa Kahn. 2018. “Do Recessions Accelerate Routine-Biased Technological Change? Evidence from Vacancy Postings”. American Economic Review 108 (7): 1737–72.
ILO (International Labour Organization). 2017. “ILO Toolkit for Quality Apprenticeships - Vol. 1: Guide for Policy Makers”.
———. 2020. “The Feasibility of Using Big Data in Anticipating and Matching Skills Needs”.
———. 2021a. “Global Framework on Core Skills for Life and Work in the 21st Century”.
———. 2021b. “World Employment and Social Outlook: Trends”.
INE Uruguay (Instituto Nacional de Estadística). 2020. “Ficha técnica Encuesta Continua de Hogares - 2019”.
———. 2021. “Instituto Nacional de Estadística de Uruguay”. https://www.ine.gub.uy/.
Kautz, Tim, James Heckman, Ron Diris, Bas ter Weel, and Lex Borghans. 2014. Fostering and Measuring Skills: Improving Cognitive and Non-Cognitive Skills to Promote Lifetime Success. Commissioned Report through the project on Education and Social Progress. Paris: OECD.
Keister, Roma, and Piotr Lewandowski. 2017. “A Routine Transition in the Digital Era? The Rise of Routine Work in Central and Eastern Europe”. Transfer: European Review of Labour and Research 23 (3): 263–79.
Khurana, Saloni, and Kanika Mahajan. 2020. “Evolution of Wage Inequality in India (1983-2017): The Role of Occupational Task Content”. UNU-WIDER Working Paper No. 167.
Kis, Viktoria, and Hendrickje Catriona Windisch. 2018. “Making Skills Transparent: Recognising Vocational Skills Acquired through Workbased Learning”. OECD Education Working Papers No. 180.
Kureková, Lucia Mýtna, Miroslav Beblavý, Corina Haita, and Anna-Elisabeth Thum. 2016. “Employers’ Skill Preferences across Europe: Between Cognitive and Non-Cognitive Skills”. Journal of Education and Work 29 (6): 662–87.
Kureková, Lucia Mýtna, and Zuzana Žilinčíková. 2018. “What Is the Value of Foreign Work Experience for Young Return Migrants?” International Journal of Manpower 39 (1): 71–92.
Lewandowski, Piotr, Albert Park, Wojciech Hardy, and Yang Du. 2019. “Technology, Skills, and Globalization: Explaining International Differences in Routine and Nonroutine Work Using Survey Data”. IZA Discussion Paper No. 12339.
Lewandowski, Piotr, Albert Park, and Simone Schotte. 2020. “The Global Distribution of Routine and Non-Routine Work”. UNU-WIDER Working Paper No. 75.
Lindqvist, Erik, and Roine Vestman. 2011. “The Labor Market Returns to Cognitive and Noncognitive Ability: Evidence from the Swedish Enlistment”. American Economic Journal: Applied Economics 3 (1): 101–28.
Lise, Jeremy, and Fabien Postel-Vinay. 2020. “Multidimensional Skills, Sorting, and Human Capital Accumulation”. American Economic Review 110 (8): 2328–76.
Lo Bello, Salvatore, Maria Laura Sanchez Puerta, and Hernan Winkler. 2019. “From Ghana to America, The Skill Content of Jobs and Economic Development”. World Bank Policy Research Working Paper No. 8758.
Lu, Qian. 2015. “The End of Polarization? Technological Change and Employment in the U.S. Labor Market”. Working Paper University of Texas at Austin.
Marinescu, Ioana, and Roland Rathelot. 2018. “Mismatch Unemployment and the Geography of Job Search”. American Economic Journal: Macroeconomics 10 (3): 42–70.
Marinescu, Ioana, and Daphné Skandalis. 2021. “Unemployment Insurance and Job Search Behavior”. The Quarterly Journal of Economics 136 (2): 887–931.
Marinescu, Ioana, Daphné Skandalis, and Daniel Zhao. 2021. “The Impact of the Federal Pandemic Unemployment Compensation on Job Search and Vacancy Creation”. Journal of Public Economics 200 (August): 104471.
Marinescu, Ioana, and Ronald Wolthoff. 2020. “Opening the Black Box of the Matching Function: The Power of Words”. Journal of Labor Economics 38 (2): 535–68.
Marouani, Mohamed Ali, Phuong Le Minh, and Michelle Marshalian. 2020. “Jobs, Earnings, and Routine-Task Occupational Change in Times of Revolution: The Tunisian Perspective”. UNU-WIDER Working Paper No. 171.
Maurizio, Roxana, and Ana Paula Monsalvo. 2021. “Changes in Occupations and Their Task Content”. UNU-WIDER Working Paper No. 15.
McCrae, Robert R., and Paul T. Costa Jr. 2008. “Empirical and Theoretical Status of the Five-Factor Model of Personality Traits”. In The SAGE Handbook of Personality Theory and Assessment: Personality Theories and Models, edited by Gregory J. Boyle, Gerald Matthews, and Donald H. Saklofske, 1:273–94. London: SAGE Publications Ltd.
Ministerio de Trabajo y Seguridad Social, Uruguay. 2020. Análisis Primario de Resultados de La Primera Ola de Relevamiento Del Perfil de Ocupaciones - O*Net. Unpublished Report.
Mischel, Walter, and Yuichi Shoda. 1995. “A Cognitive-Affective System Theory of Personality: Reconceptualizing Situations, Dispositions, Dynamics, and Invariance in Personality Structure”. Psychological Review 102 (2): 246–68.
Mischel, Walter, and Yuichi Shoda. 2008. “Toward a Unified Theory of Personality: Integrating Dispositions and Processing Dynamics within the Cognitive-Affective Processing System”. In Handbook of Personality: Theory and Research, edited by Oliver P. John, Richard W. Robins, and Lawrence A. Pervin, 3rd Edition, 208–41. New York, NY, US: The Guilford Press.
Modestino, Alicia, Daniel Shoag, and Joshua Ballance. 2020. “Upskilling: Do Employers Demand Greater Skill When Workers Are Plentiful?” Review of Economics and Statistics 102 (4): 793–805.
Nübler, Irmgard. 2016. “New Technologies: A Jobless Future or a Golden Age of Job Creation?”, ILO Research Department Working Paper No. 35.
Reijnders, Laurie, and Gaaitzen de Vries. 2018. “Technology, Offshoring and the Rise of Non-Routine Jobs”. Journal of Development Economics 135: 412–32.
Rodrik, Dani. 2018. “New Technologies, Global Value Chains, and Developing Economies”. National Bureau of Economic Research Working Paper No.25164.
Roys, Nicolas A., and Christopher R. Taber. 2019. “Skill Prices, Occupations, and Changes in the Wage Structure for Low Skilled Men”. National Bureau of Economic Research Working Paper No. 26453.
Spitz‐Oener, Alexandra. 2006. “Technical Change, Job Tasks, and Rising Educational Demands: Looking Outside the Wage Structure”. Journal of Labor Economics 24 (2): 235–70.
Stops, Michael, Ann-Christin Bächmann, Ralf Glassner, Markus Janser, Britta Matthes, Lina-Jeanette Metzger, Christoph Müller, Joachim Seitz, and Alina Hanebrink. 2020. “Machbarkeitsstudie Kompetenz-Kompass. Forschungsbericht 553.” Bundesministerium für Arbeit und Soziales Berlin.
Thaler, Richard H. 2008. “Master Class 2008: Putting Psychology into Behavioral Economics (Class 6)”. https://www.edge.org/conversation/richard_h_thaler-daniel_kahneman-sendhil_mullainathan-master-class-2008-putting
Valerio, Alexandrio, Maria Laura Sanchez Puerta, Namrata Tognatta, and Sebastien Monroy-Taborda. 2016. “Are There Skills Payoffs in Low- and Middle-Income Countries? Empirical Evidence Using STEP Data”. World Bank Policy Research Working Paper No. 7879.
Velardez, Miguel Omar. 2021. “Análisis de distancias ocupacionales y familias de ocupaciones en el Uruguay”. Documento de Proyectos LC/TS.2021/36. Desarrollo Económico. CEPAL.
Weinberger, Catherine. 2014. “The Increasing Complementarity between Cognitive and Social Skills”. Review of Economics and Statistics 96 (4): 849–61.
World Bank. 2021. “World Bank Databank”. https://databank.worldbank.org/home.aspx.
Xing, Chunbing. 2021. “The Changing Nature of Work and Earnings Inequality in China”. UNU-WIDER Working Paper No. 105.
Yusuf, Arief Anshory, and Putri Riswani Halim. 2021. “Inequality and Structural Transformation in the Changing Nature of Work: The Case of Indonesia”. UNU-WIDER Working Paper No. 81.
Zapata-Román, Gabriela. 2021. “The Role of Skills and Tasks in Changing Employment Trends and Income Inequality in Chile.” UNU-WIDER Working Paper No. 48.
Acknowledgments
This article was written as part of a collaboration between the “Labour Market Trends and Policy Evaluation Unit” of the ILO’s Research Department and the Work Area “Skills Strategies for Future Labour Markets” in the ILO’s Employment Department. We are grateful to Johannes Brehm, Angela Doku, Joana Duran-Franch and Henry Stemmler for excellent assistance in cleaning and processing the original BuscoJobs data and to Marcos Aguiar, Diego Alanis and Jorge Eguren for providing the data and answering detailed questions about them. Sergio Herrera and Javiera Lobos contributed to creating occupational variables, while Lucas Ng kindly shared O-NET-based statistics with us. Thanks, are also due to Janine Berg, David Deming, Cornelius Gregg, Piotr Lewandowski, Clemente Pignatti, Olga Strietska-Ilina, Michael Stops, and Bolormaa Tumurchudur Klok for valuable comments and suggestions; and to Gonzalo Graña and Fernando Vargas (ILO CINTERFOR) for important country-specific feedback. The responsibility for opinions expressed in this article rests solely with its authors, and publication does not constitute an endorsement by the International Labour Office of the opinions expressed in it

