


What has been driving work-to-work transitions in the emerging world? – A comparative study of Indonesia and South Africa
Abstract
There is little knowledge about the shape, prominence and drivers of work-to-work transitions in low- and middle-income countries. This paper examines these elements in the context of South Africa and Indonesia – two middle-income countries with similar development levels yet different labour market characteristics. We employ a comparative cross-country methodology using long-term panel data. This enables us to examine work-to-work transitions across and within age cohorts and exploit the panel structure of the data through a fixed-effects model to identify the drivers of these transitions. We find that while the prominent transition types differ between the two countries, younger workers have higher transition rates. Moreover, we find that precarious forms of employment are persistent: individuals who start their careers at the bottom of the transition ladder (i.e., in informal work, the agriculture sector or a low-skill occupation) are less likely to transition out of this situation. Finally, we unveil suggestive evidence that computer and socioemotional skills play a role in encouraging certain transitions in South Africa and Indonesia, respectively.
Introduction
Transformative changes in labour markets are redefining and possibly multiplying the work-to-work transitions people experience during their life. Individual-level transitions represent today a key element of labour markets around the world. Still, there is little knowledge regarding the shape and prominence of these transitions, and the implications they have for the development of decent work, career and life trajectories, in low- and middle-income (LMIC) countries. In this paper, we examine these elements comparatively in two middle-income countries: Indonesia and South Africa.
The literature shortage in LMIC is partly due to how we define and interpret transitions, which has evolved significantly over time. The prevailing labour economic literature of the 1990s largely understood transitions as the individual’s movement from one labour market status to another, such as from unemployment to employment or from education to the world of work. Conversely, contemporary definitions of transitions include a wider set of phenomena including the different moves faced by people throughout their working lives, and within these transitions, the shift between various working conditions and working relations. For some of these transitions, the most traditional ones, there is a significant body of academic research. For example, there is a meaningful amount of literature on school-to-work transitions and transitions between employment and unemployment in the advanced world 1 We also find literature on school-to-work transitions within developing and emerging economies,2 and there also exists some literature on the transition from unemployment to employment within this context.3
We expect these factors to shape transitions in different ways outside of high-income countries, which implies that the findings from the literature can hardly be generalized across diverse country contexts. For example, temporary employment may take the form of casual employment in LMIC, which is often located within the informal sector (ILO, 2018). We can expect transitions from casual informal employment to permanent for- mal employment to be different from the patterns observed in high-income economies.
Country-specific assessments of work-to-work transitions in LMIC are thus needed. One important component of these assessments, for which there is indeed some relevant literature outside the high-income world, are movements from informal to formal work. For example, McCaig and Pavcnik (2015) find that in Vietnam, individuals who are younger, urban, male, and have a higher level of education are more likely to switch to formal work, highlighting the difficulty of individuals in marginalised groups to make the switch.4
Analyses of more comprehensively defined work-to-work transitions are rare in middle-income countries, and when available, the literature suffers limitations. In addition to some research being inconclusive, most studies analyse a single country, which makes them difficult to generalize to other middle-income country contexts. Moreover, to be able to assess transitions, the analysis must track individuals over time. Longer panels capturing more years of an individual’s life would allow for observing when transitions take place and assessing the permanency of transitions. However, long-term panel data are scarce outside high-income countries, and the panels that do exist are often short, limiting the conclusions of such analyses. To counteract these limitations, we employ a comparative cross-country methodology in two major middle-income economies, namely Indonesia and South Africa, using rich and long-term panel data. The analysis is conducted in the form of a comparative study to provide insights into the drivers of work-to-work transitions in countries of similar development levels, yet different labour market characteristics. We have also selected these countries given the availability of large and nationally representative individual-level panel datasets – i.e., the National Income Dynamics Study (NIDS) in South Africa with its five waves of panel data from 2008 to 2017, and the Indonesian Family Life Survey (IFLS), which has five waves of data from 1993 to 2014/15. Both countries are among the few in their respective regions in which we can study life-cycle transitions at the individual and cohort levels, counteracting the major data availability and accessibility challenge for the empirical assessment of work-to-work transitions.
The multifaceted approach towards transitions as per the contemporary debate opens three questions that this paper aims to answer: What are the prominent work-to-work transitions for people in different labour market contexts within LMIC? At what stage during their working lives are they happening (e.g., what are the crucial stages for transitions)?
Which implications do these transitions have with regard to the movement towards decent work?
We find that both countries exhibit important mobility patterns across and within age cohorts. Across cohorts, both countries appear to be experiencing a shift in employment status, whereby younger cohorts are increasingly absorbing employee jobs, which also appear to be of better quality (formal and performing higher-skilled occupations). However, in Indonesia, this shift is more diffused than in the case of South Africa, because it has been occurring over a longer time frame. For South Africa, the transitions have to be evaluated against the backdrop of high unemployment, which is particularly pronounced for younger age cohorts. Focusing on the transitions individuals experience during their working lives, our analysis points to the presence of considerable working mobility in South Africa during the study period, notwithstanding the large literature on rigidities in the South African labour market, but in line with findings from other longitudinal studies (Banerjee et al., 2008; Cichello et al., 2014; Essers, 2016). In comparison, the incidence of these transitions is lower in Indonesia within cohorts, but transitions have increased drastically over time and are more prominent now. We find that most transitions between employment statuses happen, naturally, at the very beginning of the individuals’ careers in both countries.
In South Africa, transitions between employment statuses, however, are the least prevalent type of transition. There is much more mobility between formal and informal work than there is between employment statuses in the country. Most of these transitions are out of informality and towards formal jobs, and this type of mobility, though more prevalent at the beginning of people’s careers, remains high at other stages of people’s working lives. In contrast, in Indonesia, where a much higher incidence of informality characterizes the labour market, the rate of transitions is lower compared to those in South Africa for all cohorts. This reflects the stickiness of informality in the country. Despite the low mobility between formal and informal work in Indonesia, most of the transitions that occur are out of informality. Meanwhile, transitions between employment statuses are the most prevalent type of transition in Indonesia (more people transition between employment statuses than between occupations or the formality/ informality of work), where most people shift from their own account worker to employee status, followed closely by transitions across sectors.
We also observe relatively important mobility between sectors and occupations in both South Africa and Indonesia. In South Africa, shifts between the skill level of occupations are the most prevalent type of transition, where most transitions occur from lower to higher skill-level occupations among individuals in the younger cohorts. Meanwhile, individuals in older cohorts (but also as younger cohorts get older) start transitioning back from higher to lower skill-level occupations. Shifts between economic sectors are less prevalent in the country, but we do observe some mobility from industry to services and vice versa. In Indonesia, while there is mobility between occupations’ skill levels, people shift occupations much less than they shift economic sectors and employment statuses. Moreover, unlike in South Africa, barely half of the transitions between occupations’ skill levels occur from lower to higher skill-level occupations. In terms of shifts between economic sectors, most transitions are from industry to services, but other transitions are also relevant, especially those from services to agriculture, from agriculture to services and from services to industry.
Lastly, when assessing the drivers of individuals’ transitions from wave to wave through a fixed effects model with covariates, we confirm that younger individuals transition more than older individuals in both countries. Also, we find that transitions have a nonlinear relationship with age, which displays an inverse-U shape, where people tend to decrease their transition rate during prime age. Other than younger age, we find that precarious forms of employment are persistent. In particular, individuals who start their careers at the bottom of the transition ladder (i.e., in informal work, the agriculture sector or a low-skill occupation) are less likely to transition out of this situation. Finally, we unveil suggestive evidence that computer skills and socioemotional skills play a role in encouraging certain types of transitions in South Africa and Indonesia, respectively.
The remainder of the paper is structured as follows. Section 1 briefly outlines the development patterns of the two countries during the last two decades and describes the nature of their overall labour markets. This section provides the context for our study of work-to-work transitions. Section 2 describes the research methods and data used in the paper. The analysis of work-to-work transitions is presented thereafter. Section 3 reviews how workers from different age cohorts have transitioned over time and what the crucial stages of transition are. Section 4 takes this analysis one step further. Using the panels of IFLS and NIDS, which allow us to follow individuals for a period of around 20 and 10 years, respectively, we assess how individuals within a given cohort experience different work mobility patterns. This allows us to identify the frequency and direction of transitions in each age cohort, as well as the permanency of transitions during individuals’ working lives over a longer time horizon than is usually studied in the transitions literature. Then Section 5 assesses whether different switching behaviour of workers across age cohorts may reflect differences in worker characteristics other than age (e.g., education, skills, etc.) and identifies these drivers. Finally, Section 6 discusses the results and concludes the study.
Background: Growth and development patterns in Indonesia and South Africa
Indonesia and South Africa make interesting cases for the analysis of work-to-work transitions, especially from a comparative perspective. Both countries face a scarcity of decent jobs, due to slow job creation and segmentation of the labour market between workers who can access high-skilled jobs, usually of better conditions, and workers who cannot. Mismatches between labour supply and demand are also profound in both countries, mainly due to shortages of skilled labour. The reasons for these common challenges, however, differ between both countries. The diverse nature of their labour markets brought about by their distinct economic and societal transformations, are thus particularly informative to understand the mechanisms and drivers of work-to-work transitions.
In Indonesia, the labour market is characterized by slow job growth, high levels of labour underutilization and high levels of informal employment (Allen, 2016). Recent research indicates that there are low transition rates towards permanent work. In particular, there is a lack of mobility from self-employment (which in the country is largely characterized by inadequate working conditions, such as lack of benefits and protection) to permanent forms of employment (Naidoo et al., 2015). South Africa’s labour market is characterized by high rates of unemployment and low rates of underemployment and informal employment, relative to other countries at similar income levels (Fox et al., 2013; Kingdon and Knight, 2004).5 Meanwhile, the formal sector suffers from labour demand and supply mismatches, mainly driven by a severe skills shortage, a product of the sluggish transformation of the education system. The country has experienced a steep increase in demand for high-skilled workers associated with the services-led structural transformation of the last two decades (Bhorat et al., 2020b). To illustrate these patterns in more detail, Table 1 and 2 compare key labour market indicators for the two countries between 1995 and 2019.
Both South Africa’s and Indonesia’s labour force participation rates (LFPR) have remained relatively stable during the last two and a half decades, with Indonesia displaying a higher participation rate (i.e., in 2019, South Africa’s LFPR was 56.1 percent, while Indonesia’s was 68.0 percent). The large gender gap in South Africa’s LFPR has been narrowing over time, as the male LFPR has been decreasing while that for women has been increasing (Table 2). Indonesia has also seen a higher LFPR for women over time, and the country displays a higher LFPR for women compared to South Africa. The level of unemployment, however, is remarkably different between the two countries. The post-apartheid South African labour market is characterized by a very high unemployment rate, where strong gender inequalities come to the fore (more than a 10 percentage point difference in 1995) (Banerjee et al., 2008). While gender differences have been declining, women remain more likely to be unemployed (30.5 percent compared to 26.8 percent for men in 2019, see Table 2). Meanwhile, Indonesia’s unemployment rate is low, at 3.6 percent in 2019 compared to South Africa (28.5 percent), despite an increase following the 2005 and 2006 natural disasters.
In Indonesia, the higher level of LFPR and lower unemployment is absorbed by a higher level of informal employment. Indeed, the informal sector is large in Indonesia – 80.4 percent of individuals were employed informally in 2019, compared to 34.7 percent in South Africa6 – and it acts as a secondary option for individuals who cannot obtain formal sector jobs (Comola and Mello, 2011). As such, efforts to foster transitions to decent work can be hindered by the dualistic labour market structure of the country (e.g., changes in minimum wage legislation in 2001, ibid). In stark contrast, South Africa is considered a regional and international outlier, having a small informal sector, relative to its middle-income counterparts (Kingdon and Knight, 2007). Barriers to entry to the informal sector (e.g., licensing and restrictive by-laws; poor access to capital, credit, and land; crime; and high transport costs) – partially due to legacies from apartheid – are named as possible reasons why the informal sector does not act as a cushion for the lack of jobs (Essers, 2016; Kingdon and Knight, 2007). Another explanation is that informality is hidden by an outburst of “casualized/informalized” arrangements in the formal sector, whereby work is outsourced to labour brokers and subcontractors (Zizzamia, 2020) – close to 14 percent of total employment growth between 1995 and 2016 was outsourced and subcontracted (Bhorat et al., 2016). Women and youth make up the larger share of individuals with informal employment in both countries (Table A.1 of the appendix).
Table 1: Key labour market indicators for South Africa and Indonesia, 1995–2019

Notes: Categories do not necessarily sum to 100 as the share of ‘not classified’ is omitted. All classifications follow ILOSTAT definitions. Blanks indicate that no data is available. For the skill level of occupations, please see footnote 7. +Occupation data for Indonesia is only available in 1994 and then from 2007 onwards (the latest year available is 2019), in South Africa, the earliest data is available in 2000. *Informality data for South Africa corresponds to the years 2010, 2016 and 2019; for Indonesia to 2016 and 2019. Informality estimates from ILOSTAT were calculated using each country’s labour force survey. Source: ILOSTAT explorer.
Table 2: Key labour market indicators for South Africa and Indonesia by sex, 1995, 2015 and 2019

Notes: Categories do not necessarily sum to 100 as the share of ‘not classified’ is omitted. All classifications follow ILOSTAT definitions. Blanks indicate that no data is available. For the skill level of occupations, please see footnote 7. +Occupation data for Indonesia is only available in 1994 and then from 2007 onwards (the latest year available is 2019), in South Africa, the earliest data is available in 2000. *Informality data for South Africa corresponds to the years 2010, 2016 and 2019; for Indonesia to 2016 and 2019. Informality estimates from ILOSTAT were calculated using each country’s labour force survey. Source: ILOSTAT explorer.
The two countries also portray considerably different employment structures, with important implications for the possible work-to-work transitions as will be observed in section 3. In South Africa, most of the employed individuals are waged employees (83.7 percent in 2019), while self-employment (defined in the country by a combination of own-account workers and employers) plays a less important role (10.1 and 5.7 percent, respectively). In Indonesia, the share of waged employees has been rising over the past few years but is still considerably lower (48.2 percent in 2019). Meanwhile, the share of own-account workers remains relatively high, though declining over time (35.1 percent). In South Africa, the rise of the share of employees seems to largely be driven by women, while in Indonesia, the rise of this share is being driven mainly by youth and prime-aged workers (as the share of both male and female employees have increased in the country; see Table 2 and Table A.1 of the Appendix). Compared to South Africa, contributing family workers play a much stronger role in the Indonesian labour market, albeit declining. It is important to note that the shares of own-account workers and contributing family workers have markedly decreased in the 24 years to 2019 (by about 13 and 5 percentage points, respectively), giving way to a larger share of waged employees. Gender differences continue to exist, however, with the share of women among contributing family workers reaching almost five times higher than that of males in the same year.
In terms of the sectoral composition of employment, the share of employment in agriculture has been declining for both countries over the past two decades. Nevertheless, the agricultural sector still employed 28.5 percent of the workforce in Indonesia in 2019, while in South Africa, it employed only 5.3 percent. The industrial sector employed similar shares of workers in South Africa and Indonesia in the same year (22.3 and 22.4 percent, respectively). However, in Indonesia, the industrial sector has expanded. In particular, after the earthquake in 2006, there was a shift from employment in the (low-wage) agricultural sector towards the construction sector, due to the increase in the demand for workers in sectors, which produced non-tradable goods following the environmental disaster (Kirchberger, 2017). Meanwhile, South Africa has been undergoing a long-term deindustrialization for the past two decades (Bhorat et al., 2020c; Rodrik, 2008). While the industrial sector employed 27.9 percent of the workers in 1995, this share decreased to 22.3 in 2019. The declining share of industrial employment has been particularly pronounced for women. Meanwhile, the services sector has expanded considerably, employing 72.4 percent of workers in 2019, compared to 60.9 percent in 1995. Here, the increase is again particularly pronounced among women: in 2019, 84.2 percent of working women were employed in the service sector. Employment in the services sector has also increased in Indonesia, but at its peak in 2019, it stood at only 49 percent.
The expansion of the services sector and the collapse of the manufacturing industry during the 2000s have brought about a proliferation of low-paid jobs in South Africa (Bhorat et al., 2020a). In fact, some authors argue that to the extent that job creation for the most vulnerable has occurred, it has mostly consisted of precarious forms of employment in low-skill service and retail sectors. These patterns point to important work-to-work transitions to consider within both countries, which are looked at in the following sections.
Meanwhile, the shares of individuals employed in occupations with different skill levels7 are an interesting prior.
Following the global financial crisis of 2008, South Africa experienced a simultaneous decrease in the share of employment in medium-skilled occupations and an increase in that of low-skilled occupations. While the share of men in low-skilled occupations increased considerably over the timespan considered (from 18.8 percent in 2000 to 24 percent in 2019), women remain much more likely to be employed in low-skilled occupations (35.5 percent in 2019). Employment in high-skilled occupations gradually increased but has recently been falling again (23.4 percent in 2019). The South African labour market is thus segmented between workers who can access high-skilled jobs and workers who cannot, as well as groups that are able to access jobs of good quality and groups that are not (Essers, 2016). Though the South African labour market also presents some mobility, it is submerged by a deep wage polarization and one of the highest levels of income inequality in the world (Bhorat et al., 2020b). Understanding what drives transitions to better jobs is thus of significant importance in South Africa.
By contrast, likely due to rapid industrialization, Indonesia has seen a large increase in the share of individuals in medium- and high-skilled occupations from 1994 to 2019. Meanwhile, the share of workers in low-skilled occupations has decreased. This has mainly been driven by a fall in the share of women (by close to 25 percentage points) working in low-skilled occupations, although the share of men has also fallen (by close to 7 percentage points). Throughout the period, more and more women have moved to medium-skilled occupations and, to a lesser extent, to high-skilled occupations. On the demand side, Indonesia’s information technology sector has developed rapidly since the 2000s, changing the skills demanded by the labour market (Tentua and Winarko, 2020). However, some authors sustain that the country has seen important increases in education levels, which are not necessarily in line with the skills needs of the economy (Manning and Pratomo, 2018). These major economic and societal transformations have led to various mismatches in the labour market, such as shortages of skilled labour, particularly of semi-skilled blue-collar workers, and skill mismatches, notably concerning IT skills. Therefore, the case of Indonesia is particularly informative to understand how major transformations affect transitions, as well as the role of skills in equipping individuals with the tools to respond effectively to these transformations.
Methodology and data
2.1 Data
For the analysis of work-to-work transitions in Indonesia, we use data from the five waves of the Indonesian Family Life Survey (IFLS). The IFLS is a large-scale socio-economic longitudinal survey, spanning about twenty years. The sample represents around 83 percent of the Indonesian population living in 13 of the 27 provinces (Mani et al., 2018). The first wave (IFLS1) started in 1993, interviewing 7,224 households and collecting individual- level data for more than 22,000 individuals. Wave 2 was then carried out in 1997/98; wave 3 in 2000; wave 4 in 2007/08, and wave 5 in 2014/15. The IFLS collects extensive information at the individual, household, and community levels, on demographics, education, health, employment, household expenditures, migration, etc.
For the analysis of South Africa, we use the five waves of the publicly available section of the National Income Dynamics Study (NIDS) database. This longitudinal survey began in 2008 with a nationally representative sample of over 28,000 individuals living in 7,300 households across the country.8 The survey follows these same household members every two years. Wave 1 was conducted in 2008, wave 2 in 2010/11, wave 3 in 2012, wave 4 in 2014/15 and wave 5 in 2017. The NIDS examines the livelihoods of individuals and households over time. Themes include changes in poverty and well-being; household composition and structure; fertility and mortality; migration; labour market participation and economic activity; human capital formation, health and education; vulnerability and social capital.
There are two caveats to take into account. First, long term panel data underestimates the number of transitions people experience in between waves. This situation is more pronounced for Indonesia as the longer the time elapsed between waves, the larger the unobserved working mobility. This time-aggregation bias is common when assessing labour market flows where time intervals are discrete (Samaniego and Viegelahn, 2021). While it is unavoidable in our case, we do not expect this to bias our results in a particular direction, such that we believe our findings hold but are an underestimation of the true trends.
Second, sample attrition is often a concern. If non-attritors and attritors systematically differ in the outcome variables of interest and attrition is found to be non-random, a solution is to create inverse probability weights which adjust for sample attrition (Fitzgerald et al., 1998; Wooldridge, 2010). Fortunately, in the case of South Africa, NIDS has released panel weights along with the data, which are intended to correct for bias resulting from non-random attrition between wave 1 and subsequent waves (Branson and Wittenberg, 2019). The IFLS similarly has cross-sectional and panel weights, designed to correct attrition and sampling design. The panel weights adjust the original survey design to ensure that the weighted distribution of households who remain in the sample (non-attritors) is comparable to the cross-sectional distribution of households in the first wave. The panel weights in the IFLS, though, are only included for individuals who are present in all five waves. In Appendix B we provide detailed attrition analyses and show that applying panel weights produces attrition test results that generally indicate that attrition is random for the NIDS while they decrease the bias for the IFLS. Consequently, we apply these weights in our analysis.
2.2 Research methods
In the following sections, we empirically identify the shape and prominence of work-to-work transitions across and within birth cohorts, allowing us to determine their crucial stages (e.g., whether such transitions happen more at specific ages over the life course). Ultimately, the objective is to use the empirical results to systematically characterize work-to-work transitions within a framework and identify what drives these transitions and their implications regarding movements to decent work. To achieve this, we focus on two aspects of work-to-work transitions: first, we consider movements between the employment of different characteristics, such as transitions between different employment statuses and changes between sectors and occupations, focusing on age. Second, we assess transitions by considering additional potential drivers, such as skills.
We start our analysis by assessing transitions across age cohorts. Through this analysis, we want to observe how workers of different age cohorts differ in their work mobility by exploiting the large and representative cross-sectional data for both countries, which allows us to follow cohorts over time. Cohorts are based on respondent age in 2007 for Indonesia (wave 4 of the survey) and in 2008 for South Africa (wave 1 of the survey), so we can observe comparable cohorts between the two countries. This first part of the analysis (Section 2) illustrates differences in the composition of employment status, as well as in the economic sector, informality and occupational skill levels of the jobs held by different cohorts. This allows us to determine whether differences arise from across or within-cohort variations. Additionally, workers within a given cohort may experience different transitions. In Section 3, we exploit the individual-level panels available in our data for Indonesia and South Africa to illustrate these different transitions and study how workers actually sort between these different types of employment. This also allows us to establish the crucial stages of transitions, their frequency, and the permanency of those transitions.
After assessing transitions across and within birth cohorts, we assess the factors driving the transitions observed in sections 4 and 5. Different switching behaviour of workers across age cohorts may reflect differences in worker characteristics other than age, such as education, skills, etc., as well as the interaction of these factors with the characteristics of the country’s labour market. Section 5 empirically assesses these questions. A series of fixed effect models identify individual and cohort factors that drive labour market transitions and characterize individuals who do not transition between sectors, occupations, nature of employment or status in employment.
Differences in labour market characteristics across and within birth cohorts
What is the role of age cohorts in the changing composition of labour market characteristics over time in South Africa and Indonesia?
In South Africa, young workers starting their working lives between 2008 and 2017 (aged 15–24 in 2008, then 24–33 in 2017) are more likely to work as employees (and less likely to be self-employed), than any other cohort, whether prime age (25–54 in 2008) or the older, exiting cohort (55–64 in 2008). Results are displayed in figure 1 and in table C.1 of the appendix. Within the two younger cohorts, around 90 percent of workers were employees in 2017, compared to somewhere between 84 and 59 percent for the older cohorts in the same year.
If we compare cohorts when they have the same age using the different waves (e.g. the youth cohort aged 24–33 years in 2017 with the prime 1 cohort aged 25–34 years in 2008), we can observe that the younger the cohort, the higher the share in the employee status category relative to the following age cohort (see grey arrows in figure 1). Likewise, the younger the cohort, the lower the share in the self-employment status category, relative to the following age cohort (table C.1 of the appendix). This supports the idea of a shift in employment status across cohorts, whereby younger cohorts are increasingly absorbing employee jobs.
Figure 1: Share of workers with an employee status or formal working status in South Africa, by age cohort

Notes: The figure exhibits the evolution within each cohort in the share of workers who were employees or had a formal working status between 2007 (W4) and 2014 (W5). Age cohorts were fixed in 2007 (weights applied), which means that workers aged 15 to 24 in wave 4 (2007) were 22 to 31 in wave 5 (2014), and so on and so forth for the other cohorts. The grey arrows compare people from different cohorts when they had the same age. Source: authors elaboration based on NIDS.
While our interest is in work-to-work transitions in this paper, we should not forget that the South African labour market is characterized by high unemployment. Figure 2 displays the labour force status by age cohorts in South Africa for the first survey wave in 2008. While there is an important increase (of over 33 percentage points) in the share of people in the youth cohort who were in employment between 2008 (when they were 15 to 24 years old) and 2017 (when they were 24 to 33 years old), the share of people in the same cohort who became unemployed also increased. As such, it seems important to take unemployment into account in the case of South Africa, even if the bulk of the analysis is on work-to-work transitions.
Figure 2: Share of workers by labour force status in South Africa, by age cohort

Notes: The figure exhibits the evolution of each cohort in their status in the labour market (employed, unemployed or inactive, which means outside the labour force) between 2007 (W1) and 2017 (W5). Age cohorts are fixed in 2008 (panel weights applied), which means that workers aged 15 to 24 in wave 1 (2008) were 24 to 33 in wave 5 (2017), and so on and so forth for the other cohorts. Source: authors elaboration based on NIDS.
The higher shares of employee status amongst younger cohorts are associated with a large within-cohort decrease of employment in agriculture, a smaller but still significant decrease of employment in industry, compounded by a steep within-cohort increase of employment in services (table C.1 of the Appendix). These trends hold for other age cohorts. All cohorts experienced large increases in employment in services across time, and most cohorts (except those in the older age group) experienced decreases in the share of employment in agriculture. Interestingly, only the youth and older cohorts showed decreases in employment in industry, while the prime age cohorts maintained their shares relatively unchanged.
What does the switch of younger cohorts towards employee jobs and towards the services sector mean in terms of work quality? In terms of the formality of jobs, the first proxy of working conditions, figure 1 illustrates that younger cohorts experienced greater within-cohort job formalization over the decade analysed than older cohorts. Still, most cohorts (but the eldest) benefited from job formalization. This formalization of the work carried out by younger cohorts can be observed relative to older cohorts in 2017, but also when comparing cohorts over time (i.e., different cohorts when they had the same age as shown by the grey arrows in the figure).
The skill level of occupations supports the idea of a shift of younger cohorts towards not only different jobs but potentially better ones. There is a general increase in the skill level of occupations within cohorts between 2008 and 2017. Figure 3 highlights that each birth cohort has seen a decrease in their share of low-skilled occupations, offset by increases in medium- but mostly high-skilled occupations. This is surprising given findings from Section 2, which point to an overall increase in the share of workers in low-skilled occupations. The answer is in the distribution of these jobs across cohorts. Across-cohort employment is concentrated among medium-skilled occupations. There is a palpable rise in the share of high-skilled occupations (encompassing technicians, professionals, and managers), and a fall in the share of low-skilled occupations (containing elementary occupations) for the two youngest and the eldest cohorts. Findings from Bhorat et al. (2020a) note that the service-led structural transformation has resulted in a simultaneous proliferation of low-skilled occupations (cleaning, security services) and high-skilled occupations in business, finance and communication services, further deepening inequality in South Africa. Our cross-cohort findings imply then that prime-age workers are disproportionately occupying these low-skilled occupations, while the two youngest and the eldest cohorts are securing jobs in higher-skilled occupations.
It is noteworthy that the younger cohorts have higher comparative shares of medium- skilled occupations and growing shares of high-skilled occupations despite their new career paths. At a similar age, younger cohorts have higher shares of jobs in higher-skilled occupations than older cohorts. For example, 22 percent of workers aged 24–33 years in 2017 are employed in high-skilled occupations, compared to 16 percent of workers of the same age (25–34 years) in 2008 (the previous cohort), and so on and so forth.
Figure 3: Share of workers in low-, medium-, and high-skill level occupations in South Africa, by age cohort

Notes: The figure exhibits the evolution of each cohort in their share of workers in each of the three skill levels of occupations (low, medium, and high) between 2007 (W1) and 2017 (W5). Age cohorts are fixed in 2008 (panel weights applied), which means that workers aged 15 to 24 in wave 1 (2008) were 24 to 33 in wave 5 (2017), and so on and so forth for the other cohorts.
Source: authors elaboration based on NIDS.
Indonesia also appears to be experiencing a shift in employment status across cohorts, whereby younger cohorts are increasingly absorbing employee jobs. However, this shift is more diffused than in the case of South Africa, possibly because it has been occurring over a longer time frame. Young workers that start their careers somewhere between 2007 and 2014 (aged 15–24 in 2007, then 22–31 in 2014) have higher employee shares and lower own-account worker shares than any other cohort (figure 4; and table C.2 in the Appendix). In fact, the younger the cohort the higher the employee share and the lower the own-account worker share. However, the concentration of workers within the younger cohorts in these employment statuses is less pronounced than in South Africa, with an employee share of 67 percent and an own-account worker share of 23 percent for the youngest cohort. Moreover, unlike what was observed in South Africa, the longer time horizon of the IFLS allows us to illustrate that the shift in employment status across cohorts had already taken place by 2007. This can be observed by the small changes in the employment status shares between waves 4 and 5 and the larger changes between waves 1 and 4 (table C.2 of the Appendix).
Figure 4: Share of workers with an employee and formal working status in Indonesia, by age cohort

Notes: The figure exhibits the evolution of each cohort in the share of workers who were employees or had a formal working status between 2007 (W4) and 2014 (W5). Age cohorts were fixed in 2007 (weights applied), which means that workers aged 15 to 24 in wave 4 (2007) were 22 to 31 in wave 5 (2014), and so on and so forth for the other cohorts. The grey arrows compare people from different cohorts when they had the same age. Source: authors elaboration based on IFLS.
The higher shares of employee jobs amongst younger cohorts are associated with lower and decreasing shares in agriculture, considerably higher shares in industry and somewhat higher and increasing shares in services, relative to the other cohorts. The larger, albeit stagnant, share of jobs held by younger cohorts in the industrial sector is one difference worth noting with regard to the South African transition story. Another difference is the fact that, while decreasing, the share of agricultural jobs held by the younger cohorts in 2014 remained significant (18 percent for the youngest cohort and 23 percent for the young prime age cohort aged 25-34 in 2007 were employed in agricultural jobs in 2014).
What does the switch of younger cohorts towards employee jobs in the industry and services sectors mean in terms of work quality? As in South Africa, younger cohorts in Indonesia benefited from higher shares of formal jobs than other cohorts. They also experienced greater increases in within-cohort job formalization over time – particularly the youngest birth cohort. This formalization can be observed relative to older cohorts in 2014, but also when comparing cohorts when they had the same age during different waves (see the grey arrows in figure 4). In spite of this improvement, the shares of job formality remain low in Indonesia relative to South Africa, in line with the discussion of Section 2. Rothenberg et al. (2016) find that high informality in Indonesia stems both from barriers to formalization (i.e., uncertain benefits coupled with high regulatory costs), and from the prevalence of a dual economy whereby informal sector firms cater to a different consumer, which possibly does not compete with the formal sector.
The relative formalization of jobs and the change in the sectoral composition towards industry and services sectors have not been accompanied by changes in the skill levels of occupations (figure 5). Within cohorts, the composition of occupations has remained mostly unchanged between 2007 and 2014, with a large concentration of medium-skilled occupations. In fact, for the older cohorts that were already in the labour market since 1993 (wave 1), the composition of occupations has remained somewhat constant since then, though we do observe a decrease in the share of older workers in high-skilled occupations by 2014. Compared to other cohorts, younger cohorts have slightly higher shares of low-skilled occupations, and slightly lower (and decreasing) shares of medium-skilled occupations, compounded by noticeable higher (and increasing) shares of high-skilled occupations. This is in line with the larger across-cohort increase in job formalization for this younger cohort. In fact, the shares of high-skilled occupations show some across- and within-cohort mobility. In particular, the youth cohort illustrates a relatively important within-cohort increase in the share of high-skilled occupations, while the older cohort shows a decrease in the share of these occupations. Nevertheless, the lassitude of these trends is in line with the findings that there are shortages of skilled labour, particularly with regards to IT skills that are bearing on the Indonesian labour market.
Figure 5: Share of workers in low-, medium-, and high-skill level occupations in Indonesia, by age cohort

Notes: The figure exhibits the evolution of each cohort in their share of workers in each of the three skill levels of occupations (low, medium, and high) between 2007 (W4) and 2014 (W5). Age cohorts fixed in 2007 (weights applied), which means that workers aged 15 to 24 in wave 4 (2007) were 22 to 31 in wave 5 (2014), and so on and so forth for the other cohorts. Source: authors elaboration based on IFLS.
Workers’ sorting between different types of transitions: within cohort analysis
Section 3 highlights the differences in employment status across and within birth cohorts in South Africa and Indonesia and how these shares have evolved over time. It also shows the differences in economic sectors, formalization and the skill levels of occupations of jobs held by the various cohorts over time. Section 4 takes the analysis one step further. Using the panels of IFLS and NIDS, we follow individuals for a period of around 20 and 10 years, in Indonesia and South Africa, respectively. We illustrate how workers within a given age cohort transition between different forms of employment, e.g., how they sort between employment statuses, economic sectors and occupations, and how they transition between formal and informal jobs. This allows us to identify the frequency of transitions in each age cohort, as well as their direction. It also allows us to study the crucial stages of transitioning during individuals’ working lives and assess the permanency of the transitions over a longer time horizon than is usually studied in the transitions’ literature.
In South Africa, around 15 percent of individuals (i.e., overall change between waves 1 and 4) have transitioned across employment statuses (i.e., employee, self-employed and contributing family worker) between each panel wave during the period of analysis (2008 to 2017, table 39). Most transitions between employment statuses happened, naturally, at the very beginning of the individuals’ careers (close to 16 percent of individuals transition during their first years in the labour market, i.e., when they are aged 15 to 24 years— figure 6). A fair share of transitions also takes place at the upper tier of an individual’s career, i.e., in the few years following ages 45–54. Most of these transitions correspond to workers from all cohorts moving from self-employment to employee status. At the very beginning of their career, youth also move from contributing family workers to employee status. While South Africa shows some differences in mobility between employment statuses across cohorts, within cohort mobility is also important during the period of analysis. This indicates the presence of considerable working mobility in South Africa during the study period, notwithstanding the large literature on rigidities in the South African labour market (see Section 1) but in line with findings from other longitudinal studies (Banerjee et al. (2008); Essers (2016)). In line with the literature, we find evidence for considerable movements in and out of employment, as well as outside the labour market (table D.1 in the Appendix). The youngest age cohort experience, on average, the most transitions in their labour force status (between employment, unemployment and inactivity), while this mobility tends to decrease with age.
In Indonesia, the incidence of transitions between the various forms of employment is higher when comparing similar time periods to the South African sample. During the entire period (1997/98 to 2014), on average, around 20 percent of individuals have transitioned between employment statuses (figure 7). This figure goes up to over 28 percent, when we use a comparable period (2007 to 2014, see table 3). Examining overall transitions within cohorts between the status of employment, the highest shares are stemming from transitions from own account worker to employee status, but the variation across age cohorts is relatively high (e.g., a large share of youth transition from contributing family worker to employee status, followed by contributing family worker to own account worker). As in South Africa, most transitions in Indonesia occur at the beginning of individuals’ careers, and we observe mobility across and within cohorts.
Table 3: Work-to-work transitions in South Africa and Indonesia, comparable wave lengths

Notes: The table illustrates the share of individuals who have transitioned (irrespective of their direction) between the various status of employment, nature of employment (formality vs. informality), aggregate economic sectors, and in their occupation skill level between the respective survey waves. Survey waves have been chosen to make periods of analysis comparable between Indonesia and South Africa. In Indonesia, comparing wave 4 to wave 5 means assessing the period 2008–2015. In South Africa, comparing wave 1 to wave 4 means studying the period 2008–2014. Panel weights applied. Source: authors’ calculations based on NIDS and IFLS.
There is much more mobility between formal and informal jobs than there is between employment statuses in South Africa (figure 6). This mobility is again higher at the beginning of individuals’ careers (i.e., a lower share of transitions for older cohorts), but mobility remains high as well at other stages of people’s working lives. Within cohorts, the number of transitions decreases as individuals age. In terms of direction, most transitions occur from informal to formal employment. This is particularly the case of younger cohorts, while the share is much smaller (generally less than half of those transitioning) for older-age cohorts. In fact, a small share of people in the older cohort starts transitioning towards informality as they get older.
In contrast, in Indonesia, where a much higher incidence of informality characterizes the labour market, the rate of transitions is markedly lower compared to those in South Africa for all cohorts (26.4 percent of individuals switch between formality and informality statuses in South Africa, compared to 7.3 percent in Indonesia, when using comparable time frames—table 3). This reflects the stickiness of informality in the country. Despite the low mobility between formal and informal jobs, most of the transitions that occur are out of informality. As in South Africa, younger cohorts make up the largest share of individuals moving towards formal employment in Indonesia from 2000 to 2007. Still, the majority of transitions for all cohorts, stem from transitions towards formal employment.
Figure 6: Share of individuals who have transitioned between survey waves and direction of these transitions - status of employment and nature of employment, South Africa
|
|

Notes: Figure 6 depicts the share of individuals who have transitioned between the various status of employment (figure 6a) and nature of employment (formality vs. informality) between the respective survey waves, irrespective of the transitions’ direction. For the nature of employment, the shares of figure 6c provide information on the direction of the transitions from informal to formal work. The total share of transitions in figure 6b equals the respective shares on figure 6c plus the transitions in the opposite direction (formal to informal), which are not reported due to space constraints. Panel weights applied. Source: authors calculations based on NIDS and IFLS.
Figure 7: Share of individuals who have transitioned between survey waves and direction of these transitions - status of employment and nature of employment, Indonesia

Notes: Figure 7 depicts the share of individuals who have transitioned between the various status of employment (figure 7a) and nature of employment (formality vs. informality) (panels b and c) between the respective survey waves, irrespective of the transitions’ direction. For the nature of employment, the shares in figure 7c provide information on the direction of the transitions from informal to formal work. The total number of transitions in figure 7b equals the respective shares in figure 7c plus the transitions in the opposite direction (formal to informal), which are not reported due to space constraints. Source: authors calculations based on IFLS.
We also observe relatively important mobility between sectors and occupations in both South Africa and Indonesia. Again, focusing on the share of workers who transitioned between waves, individuals in the youngest cohort experience the highest mobility at the onset of their career in both countries between sectors (figures 8 and 9) and occupations (figures 10 and 11). In South Africa, the incidence of transitions between sectors decreases both with age across cohorts and as individuals in each of those cohorts become older (within cohort comparison). As to the direction of these transitions, South Africa displays a low share of workers switching from agriculture to either industry or services, and from industry or services to agriculture. However, there is notably higher mobility from industry to services and vice versa. Indeed, on average, around 7 percent of individuals transition in each direction, which accounts for around 39 to 37 percent of total transitions across sectors—there is no one direction that clearly dominates the other.
Meanwhile, in Indonesia, the average share of people transitioning between sectors is higher than in South Africa (28 percent compared to 24 percent, when using comparable time frames—table 3). Transitions are also more prominent among younger cohorts. Interestingly, within cohorts, there is a systematic increase in the incidence of transitions between sectors during the period 2000 and 2017 (i.e., between waves 3 and 4) for all cohorts. This period coincides with the three most recent and impactful natural disasters suffered by the country (an earthquake and tsunami in 2004, followed by earthquakes in 2005 and 2006), which brought about increased unemployment (ILO, 2005) and a shift of labour from the agricultural to the construction sector (Kirchberger, 2017). The shift from agriculture to industry (that includes construction) between waves 4 and 5 allows us to observe some of this shift, although this transition is by no means the most relevant in Indonesia. Like South Africa, most transitions are from industry to services—on average, around 6.5 percent of individuals experience this shift (figure 8), which accounts for 24 percent of all transitions among sectors. Surprisingly, transitions from services to agriculture are also relevant (close to 18 percent of all sectoral transitions), especially among older cohorts and have remained stable during the 20 years of analysis. They are followed by transitions from agriculture to services and from services to industry, each accounting for around 17 percent of all sectoral transitions. We do observe high variation across age cohorts, though, with youth again having generally higher transition rates across sectors.
Figure 8: Share of individuals who have transitioned across sectors between survey waves and direction of these transitions, South Africa

Notes: Figure 8a depicts the share of individuals who have transitioned between economic sectors, irrespective of their direction, amongst the respective survey waves. Figures 8b, 8c, and 8d provide information on the direction of the transitions. The total number of transitions adds up to the respective shares in 8b, 8c and 8d, plus the transitions in the opposite direction (industry to agriculture; services to industry, and services to agriculture), which are not reported in the table due to space constraints. Panel weights applied. Source: authors calculations based on NIDS.
Figure 9: Share of individuals who have transitioned across sectors between survey waves and direction of these transitions, Indonesia

Notes: Figure 9a depicts the share of individuals who have transitioned between economic sectors, irrespective of their direction, amongst the respective survey waves. Figures 9b, 9c, and 9d provide information on the direction of the transitions. The total number of transitions add up to the respective shares in 9b, 9c, and 9d, plus the transitions in the opposite direction (industry to agriculture; services to industry, and services to agriculture), which are not reported in the table due to space constraints. Source: authors calculations based on IFLS.
Transitions between the skill level of occupations follow a different and less systematic pattern. In South Africa, people shift between occupations’ skill levels much more often during their career lives than they shift sectors and employment statuses (figure 10). Again, we find that the share of individuals who transition between occupations’ skill levels decreases the older the age cohort, and as each cohort gets older over time. We find that most transitions occur from low- to mid-skill-level occupations and from mid- to high-skill-level occupations. Unsurprisingly, there are only few transitions from low- to high-skill level occupations, and those transitions happen predominantly within the younger age cohorts. Overall, most individuals in all cohorts transition from lower to higher-skill level occupations in South Africa—on average, close to 56 percent of all transitions between occupations’ skill levels. This share is more pronounced for the youngest cohort (around 65 percent on average), but it’s the least pronounced for the cohort prime age 3 (around 51 percent on average). However, as younger cohorts age, they start transitioning from higher to lower skill level occupations. This could indicate that as workers age, there is a tendency of declining upward mobility in terms of skill-level of occupations.
Figure 10: Share of individuals who have transitioned between occupation’s skill levels amongst survey waves and direction of these transitions, South Africa

Notes: Figure 10a depicts the share of individuals who have transitioned between the three skill levels of occupation, irrespective of their direction, amongst the respective survey waves. Figures 10b, 10c, and 10d provide information on the direction of the transitions. The total number of transitions add up to the respective shares in 10b, 10c, and 10d, plus the transitions in the opposite direction (mid-skill to low-skill level; high-skill to mid-skill level, and high-skill to low-skill level), which are not reported in the table due to space constraints. Panel weights applied. For the definition of the skill levels of occupations, please see footnote 7. Source: authors calculations based on NIDS.
In Indonesia, while there is mobility between occupations’ skill levels, people shift occupations much less than they shift economic sectors and employment statuses. However, we observe mobility with an overall increase in transitions across occupation skill levels over the period of analysis (2000–2017) for all cohorts. Unlike South Africa, most people in the two younger cohorts (on average during the period, 63 and 56 percent of individuals, respectively) experienced upper mobility in terms of the skill level of occupations. The opposite is true for the older three cohorts, where a larger share of people transitioned towards occupations of a lower skill level. Considering those who transitioned from lower to higher skill-level occupations (which account for close to half of all transitions of this type), most transitions occur from low to mid-skill level and from mid- to high-skill level. To understand better whether there is more movement within occupational skill levels than across, we look in more detail at the transitions across specific mid-level occupations (table D.2 of the appendix), after all, the majority of workers (about 83 percent10) in Indonesia are employed in mid-skill level occupations. Looking at the transitions for the mid-skill level occupations with the highest share of individuals – services and sales workers; skilled agricultural, forestry and fishery workers; and craft and related trades workers (about 78 percent of workers fall under these three categories), we observe that most people transition from skilled agriculture and from craft and related trades, towards services and sales. As transitions across sectors are still more prominent in the Indonesian sample, these transitions between mid-skill level occupations are likely partially representing sectoral changes.
In sum, we find that, in South Africa, shifts between the skill level of occupations are the most prevalent type of transition (over 31 percent of people during the period of analysis—table 3), followed by transitions between formality-informality of jobs (26 percent) and between economic sectors (24 percent). Transitions between employment statuses are much less prevalent, at 15 percent. Meanwhile, in Indonesia, transitions between employment statuses as well as between sectors are the highest (28 percent each, using a comparable period of analysis), and also higher than in South Africa. The share of individuals transitioning between various occupations’ skill levels and between formality-informality of jobs is lower than in South Africa, totalling 16 and 7 percent, respectively.
Figure 11: Share of individuals who have transitioned between occupation’s skill levels amongst survey waves and direction of these transitions, Indonesia

Notes: Figure 11a depicts the share of individuals who have transitioned between the three skill levels of occupation, irrespective of their direction, amongst the respective survey waves. Figures 11b, 11c, and 11d provide information on the direction of the transitions. The total number of transitions in figure 11a add up to the respective shares in figures11b, 11c, and 11d, plus the transitions in the opposite direction (mid-skill to low-skill level; high-skill to mid-skill level, and high-skill to low-skill level), which are not reported in the table due to space constraints. Panel weights applied. For the definition of the skill levels of occupations, please see footnote 7. Source: authors calculations based on IFLS.
What drives different worker transitions across cohorts?
In this section, we seek to deepen our understanding of the relationship between age and the probability of transitioning and investigate what factors besides age may be driving work-to-work transitions. To that end, we first explore whether individual characteristics – such as having certain skills – are associated with transitioning. Second, given the consistent importance of the relationship between age and the probability of transitioning, we investigate this further by allowing the nonlinear relationship of age to have more flexibility through the use of fractional polynomials. We split our transition estimations by sex, to observe any potential gender effects.11
Building upon the descriptive explorations of work-to-work transitions in the two countries in the previous two sections, we estimate an individual-level fixed effects model to explore what determines transitioning vs. staying, considering the same type of transitions previously discussed: sector, status of employment, nature of employment, and occupation skill level. The linear probability model (LPM) applied is represented by the following equation:
Yijt = α + βAgeijt + ζXit + γi + ϕj + δt + ϵijt
where Y is a binary variable, which equals one if individual i in cohort j in time t (i.e., wave) transitioned from one wave to the next, which we refer to as transitioners hereafter, and 0 if they stayed between waves (stayers); Age are our age variables; X is a set of time-varying individual characteristics. Individual, cohort, and time fixed effects are included (γ, ϕ, and δ respectively), with age-cohort again fixed to 2008.
Section 4 gave insight into the most frequent transitions in South Africa and Indonesia, which we further discuss in this section to assess their drivers. Starting with South Africa, we analyze the most prevalent types of work-to-work transitions (assembling most of the work-to-work transitions): the skill-level of occupations and the nature of employment.
Table 4 compares workers who transition between skill levels to those who stay in the same occupation skill level; all estimations are linear probability models12 . The first thing that we observe is that the inclusion of individual and wave fixed effects is important, as indicated by the large increase of R2 in the specifications. Another finding worth highlighting is that individuals living in rural areas tend to transition more between occupations. This may be surprising as it indicates that rural jobs do not appear to trap individuals into occupations of a set skill level. Moreover, we find that middle- and high-skill education determine staying in that occupational skill level, with statistically significant effects found in columns 4, 5, and 6. In other words, individuals with higher education are less likely to transition across the skill level of occupations from wave to wave compared to those with low or no education. This may indicate that these individuals remain in occupations associated with higher salaries and job quality. In addition, the coefficient of the starting position –i.e. a dummy indicating whether an individual has started in a low-skilled occupation, is large and statistically significant. This indicates that individuals starting in a low-skilled occupation tend to stay in that occupation skill level. This may highlight the difficulty of transitioning "up" the ladder when one starts at the bottom. In short, we provide evidence that the educational level of individuals is associated with a lack of mobility between occupation skill levels.
To observe any potential gender effects, we split our transition estimations by sex in table E.14 and table E.15 of the Appendix. We find that the men sub-sample drives the positive association between living in rural areas and occupational skills levels, and the negative association between education and transitioning. For women, those variables are not statistically significant.
Table 4: South Africa: Occupation skill level – stayers vs. transitioners

Notes: Clustered standard errors at the individual level are in parentheses. All columns control for province. *p < 0.1, **p < 0.05, ***p < 0.01. Source: authors elaboration based on NIDS.
Finally, in order to observe any nonlinearities in the relationship between age and the probability of transitioning, we include an age-squared term in the estimations. We additionally analyze the nonlinear relationship between age and transitioning across skill levels of occupations more nuancedly, by means of fractional polynomials. Results are shown in Figure 12. Here, the component fit (i.e., E = Eit + ζ1ˆitXit, where Eit are the residuals from the full model, ζ1it is the regression coefficient for age, and Xit is age) is plotted against the fractional polynomial (i.e., age), and draws a line of best fit. This allows us to further test whether we observe a nonlinear structure in age. The left-hand side figure displays the fractional polynomial results for occupation skill level based on column 6 in table 4 (nature of employment, on the right-hand side, is assessed below). We find a consistent relationship between age/age-squared and the probability of transitioning between occupation skill levels, which displays an inverse-U shape relationship, where younger individuals transition across the skill level of occupations more often than older individuals – i.e., as age increases, the coefficient Age is positively sloped, until reaching a turning point, where it becomes negatively sloped. This supports our previous transition matrix findings in a stricter model, including covariates and fixed effects (FE). However, the level of significance decreases with the inclusion of the interaction between age cohort and wave FEs, though the signs remain the same.
Figure 12: South Africa stayers vs transitioners: Fractional polynomials

Notes: This figure displays the fractional polynomial results for occupation skill-level and nature of employment based on column 6 in table 4 and table 5, respectively. Source: authors elaboration based on NIDS.
The second most prevalent transition in South Africa is between formal and informal jobs, i.e., what we call nature of employment (table 5). With respect to age, we find again that younger cohorts tend to transition more. This pattern is consistent, although Age and Age2 are not statistically significant in the strictest estimations shown in columns 5 and 6. We nevertheless investigate the nonlinear relationship between age and transitioning across the nature of employment applying fractional polynomials as we did for the transitions between occupation skill levels. The right-hand side of figure 12 shows the results. The fractional polynomial estimation supports our previous findings, namely that older individuals tend to stay while younger individuals are more likely to transition.
The statistical significance of other effects is less consistent across specifications. Still, the coefficient indicating whether individuals started their careers in an informal job is negative and significant, indicating that informal employment is persistent. Again, we split the sample by sex to observe potential differential effects. Table E.16 and table E.17 of the Appendix display the results. Here we find that living in rural areas is associated with higher odds of transitioning for women only.
Table 5: South Africa: Nature of employment – stayers vs transitioners

Notes: Clustered standard errors at the individual level are in parentheses. All columns control for the province. *p < 0.1, **p 0.05, ***p < 0.01. Source: authors elaboration based on NIDS.
We have relegated the sector and status of employment analysis to Appendix E,13 as these transitions are less prevalent in the country, but a couple of points are worth mentioning in terms of sectoral transitions. First, age appears once again to be an important driver of transitions between sectors (table E.3). Moreover, the analysis illustrates that individuals living in rural areas tend to stay in the same sector, instead of transitioning between sectors. Third, the starting point matters in the mobility of workers. People who start their careers in agriculture have higher chances of staying in that sector and not transitioning to other economic sectors.
Finally, an emerging body of evidence (Adhvaryu and Nyshadham, forthcoming; Dimitriadis and Koning, 2022; Chioda and Carney, 2021) highlights the importance of skills for labour market outcomes in LMIC and identifies the relationship of various types of skills and transitions to better jobs as avenues for future empirical research (Bennett et al., 2022; Deming, 2022). We thus investigate the possible relationship between transitioning and skills by including cognitive skills measures in our main estimation. We use the literacy of respondents in their home language and English14, their computer literacy skills, and whether they possess a driver’s license as measures of cognitive skills. Tables E.1 and E.2 in the Appendix, iteratively add skill-related variables to the fixed-effects regression controlling for individual and the interaction between age cohort and wave FEs (based on column 5 of table 4). Figure 13 displays the coefficients adding all skills-related variables simultaneously to the nature of employment and occupation skill level estimations. We find that computer literacy has a positive relationship with transitioning between informal and formal jobs, while the other skill measures remain insignificant. On the contrary, table E.7 shows that cognitive skills do not seem to have a clear relationship with the probability of transitioning between economic sectors. That being said, it may be the case that other forms of (unobserved) cognitive and socioemotional skills may play a more significant role in transitions across the South African labour market.
For the analysis of Indonesia, we focus our estimations on the probability of transitioning between status of employment and economic sectors, as these are the most prevalent transitions in the country (following the transitions matrices in section 4). Analyses on the nature of employment and occupation skill levels are included in Appendix E.
Similar to South Africa and in line with our findings from the transition matrices, first focusing on status of employment (STE), Age and Age2 have a consistent statistically significant relationship with transitions across different employment statuses (i.e., contributing family workers, own account workers, and employees) in all estimations (table 6).15 Younger individuals transition across STE more often than older individuals. HHsize is negative and significant in columns 2, and 4-6, indicating individuals in larger households transition across status of employment less. Both Rural and the education variables are not consistently significant; when Mid-edu and High-edu are significant, they are negative, indicating that individuals with higher levels of education transitions less than those with lower levels of education. Moreover, individuals who start their careers as contributing family workers (Start as CFW) are more likely to stay a contributing family worker in the next wave (about 36% more likely).
Figure 13: South Africa stayers vs transitioners: Cognitive skills
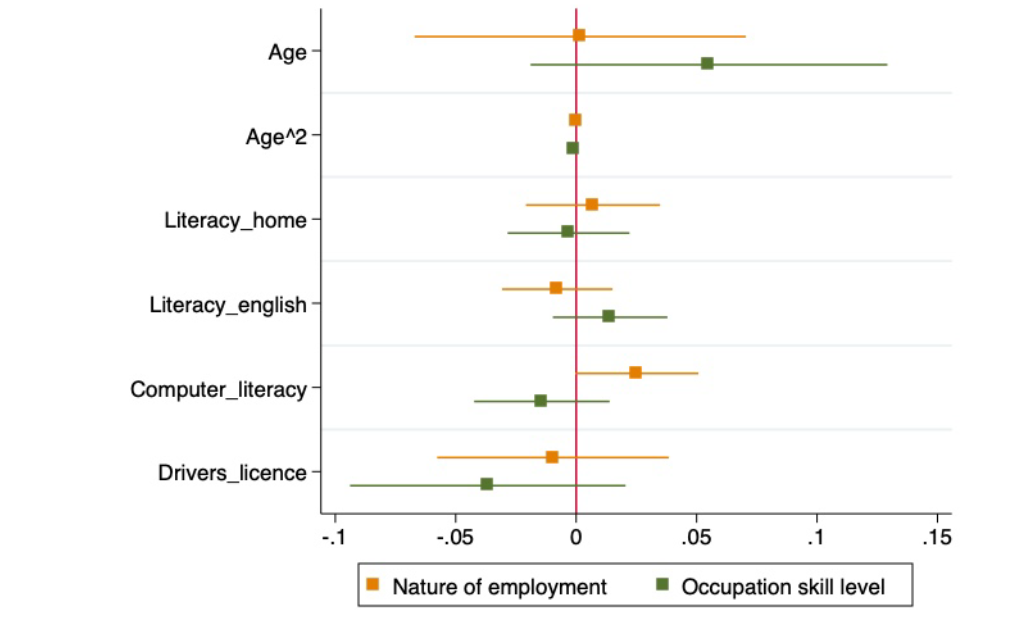
Notes: This figure depicts the effect of adding all skill-related variables simultaneously to the fixed-effects regression controlling for individual and age cohort × wave FEs (based on column 5 of table 4 and table 5, respectively). Source: authors elaboration based on NIDS.
We next observe transitions across sectors in table 7. Similar to the previous estimations we find a consistent relationship between age and age-squared and the probability of transitioning across economic sectors, where younger individuals transition across sectors more often than older individuals. High-edu is also negative and significant in all estimations, indicating that individuals with higher education are less likely to transition across sectors from wave to wave compared to those with low or no education. This may highlight a sort of specialization acquired through education. The statistical significance of the variable identifying the starting point in the mobility of workers (Start in agric) reinforces this – i.e., individuals who start their careers in the agriculture sector are more likely to stay in agriculture in the following waves (in line with what we observe in the transition matrix, in table 9, comparing age cohorts across transitions), similar to the case of South Africa.
Table 6: Indonesia stayers vs. transitioners: Status of employment

Notes: Clustered standard errors at the individual level are in parentheses. All columns control for province. *p < 0.1, **p < 0.05, ***p < 0.01. Source: authors elaboration based on IFLS.
Rural is negative and significant in columns 2, and 4-6; individuals living in rural areas may transition across sectors less than those in urban areas, though the sign changes in column 3. We additionally split our transition estimations by sex in the appendix (tables E.18 to E.21,16) in order to observe any potential gender effects. In the sector estimations (tables E.20 and E.21), we find that the relationship between living in rural areas and transitioning across sector is driven by women, while Rural is never significant in the estimation for men. This may point towards women living in rural areas having lower transition rates across sector compared to men. Both the nature of employment and occupation tables (tables E.9 and E.11, respectively) display a similar nonlinear relationship between age and the probability of transitioning, as do the estimations that are split by sex (tables E.18 to E.21).
We further explore the non-linear relationship between age and the probability of transitioning, as in the case of South Africa. Figure 14 displays this relationship for the probability of transiting between status of employment and economic sectors, using fractional polynomials (estimations are displayed in table E.13 of the Appendix), based on column 6 of tables 6 and 7. We observe that the inverse U-shaped pattern changes from upward to downward sloping during prime age (in the linear probability model estimations, the turning point for STE and sector is approximately 45 and 44 years of age, respectively). Within those estimations, youth and early prime age individuals are more likely to transition, while mid-prime age and older individuals have a higher likelihood of being stayers.
Table 7: Indonesia stayers vs. transitioners: Sector

Notes: Clustered standard errors at the individual level are in parentheses. All columns control for province. *p < 0.1, **p < 0.05, ***p < 0.01. Source: authors elaboration based on IFLS.
Figure 14: Indonesia stayers vs transitioners: Fractional polynomials

Notes: This figure displays the fractional polynomial results for sector and status of employment based on column 6 in tables 7 and 6, respectively. Source: authors elaboration based on IFLS.
Similar to South Africa, the IFLS included measures of cognitive skills. In waves 3 and 4 of the survey, individuals aged 7-24 were asked questions eliciting fluid intelligence (i.e., Raven’s tests17), and mathematical skills (i.e., arithmetic questions). Younger children aged 7-14 were asked easier arithmetic questions (Cog_easy), with the harder arithmetic test given to older children/young adults aged 15-24 (Cog_hard). Cognitive skill questions were extended to all adults (i.e., including the sample above 24 years old) in wave 5 of the survey. Adults were given fluid intelligence tests in wave 5, while only those up to age 59 were asked the arithmetic questions (i.e., adults were given the Cog_hard questions). In order to test the relationship between cognitive skills and the probability of transitioning, we created a few variables using the fluid intelligence and arithmetic test questions. First, we used confirmatory factor analysis to create latent variables based on individual responses to all of the questions in Cog_easy and Cog_hard. This follows the method- ology used in the seminal cognitive/socioemotional skills literature (e.g., Heckman et al. (2006), Cunha et al. (2010), Heckman et al. (2013)). We also aggregate the number of correct answers for both the fluid and arithmetic questions (i.e., aggregating the raw scores), to create the variable Cog_all. Given that only youth were asked cognitive skill questions in waves 3 and 4, only one year of data (wave 5) allows us to look at a sample which includes adults.
In addition to cognitive skills, individuals in wave 5 of the survey were given the Big Five personality test. The Big Five test is widely used in psychology and has been used with increasing frequency in economic literature (Almlund et al., 2011; Heckman et al., 2019). Based on factor analysis, this personality test has created a measure for five personality traits: openness, conscientiousness, extraversion, agreeableness, and neuroticism. The IFLS uses the 15-question scale, with individuals answering a five-point Likert scale (i.e., from disagree strongly to agree strongly) for each question. Scores for each of the five traits were aggregated to create the variables used.
Figure 15: Indonesia stayers vs transitioners: taking into account cognitive and noncognitive skills

Notes: This figure depicts the effect of adding all skill-related variables simultaneously to the fixed-effects regression controlling for individual and age cohort × wave FEs, thus representing column 5 in tables E.7 and E.8, respectively. Source: authors elaboration based on IFLS.
Both the cognitive and socioemotional indicators give interesting insights into other potentially important factors which are related to the probability of transitioning. Figure 15 displays the point estimates for the hard cognitive skill test Cog_hard and five personality traits, along with Age and Age2.18 Once again, age displays an inverse U-shaped relationship with the probability of transitioning across all estimations when our cognitive and socioemotional skill measures are included. Overall, cognitive skills do not have a consistent relationship with the probability of transitioning. Conversely, socioemotional skills matter. In particular, we observe statistically significant relationships in measures of openness and neuroticism. Individuals who are more open to new experiences display higher odds of transitioning between sectors, nature of employment, and occupation skill levels. Meanwhile, neuroticism (which is the opposite of emotional stability) is negatively and statistically significantly related to transitions between formal and informal jobs (i.e., nature of employment), indicating that people with a higher level of neuroticism (i.e., who lack emotional stability) have higher chances of being a stayer. These findings suggest that the skills required to be mobile in the labour market are specific to the type of transition we are observing, even when looking at socioemotional skills. This finding could have been expected for transitions that occur between occupations19, and to a lesser extent sectors20, given existing evidence. It is, however, a novel finding to understand other types of transitions such as between formal and informal jobs. This suggestive evidence, based on a cross-sectional estimation (as the personality questions were only asked in wave 5) opens the door to a new research avenue. Further research using panel data that allows the identification of various skills, and multiple transition periods would be an interesting next step in this line of research.
Conclusion
While there is a significant amount of literature observing labour market transitions, such as school to work, or employment to unemployment, the literature which focuses on work- to-work transitions is scant, especially in LMIC. This study takes a cross-country comparative approach in two major middle-income economies, Indonesia and South Africa, through the use of long-term panel data. Focusing on work-to-work transitions, we first explore the shape and frequency of transitions over time, across and within age cohorts. Across cohorts, both countries appear to be experiencing a shift in employment status, whereby younger cohorts are increasingly absorbing employee jobs, which also appear to be of better quality (formal and performing higher-skilled occupations).
There are clear differences in transition patterns between the two countries when looking within cohorts. South Africa overall displays larger working mobility, although transitions have increased drastically in Indonesia over time. In South Africa, shifts between the skill level of occupations are the most prevalent type of transition, where most movements occur from lower to higher skill-level occupations among individuals in the younger cohorts. Meanwhile, individuals in older cohorts (but also as younger cohorts get older) start transitioning back from higher to lower skill-level occupations. Moreover, there is much more mobility between formal and informal jobs than there is between employment statuses in the country. Most of these transitions are out of informality and towards formal jobs, and this type of mobility, though more prevalent at the beginning of people’s careers, remains high at other stages of people’s working lives. Finally, shifts between economic sectors are less prevalent in the country, but we do observe some mobility from industry to services and vice versa.
In contrast, in Indonesia, transitions between employment statuses are the most prevalent type of mobility, where most people shift from own-account work to employee status. While there is mobility between occupations’ skill levels, people shift occupations much less than they shift economic sectors and employment statuses. Moreover, barely half of the transitions between occupations’ skill levels take place from lower to higher skill-level occupations. In terms of shifts between economic sectors, most transitions are from industry to services, but other transitions are also relevant, especially those from services to agriculture, from agriculture to services and from services to industry. Finally, the rate of mobility between formal and informal jobs is low in Indonesia, where a high incidence of informality characterizes the labour market. Nevertheless, most of the transitions that occur are out of informality.
These results are confirmed when looking at the probability of transitioning or staying, through a fixed effects model with covariates. We find that younger cohorts transition more than older cohorts. Additionally, our analysis finds that precarious forms of employment are persistent. In particular, individuals who start their careers at the bottom of the transition ladder (i.e., in informal work, the agriculture sector or a low-skill occupation) are less likely to transition out of this situation. This finding reflects the greater hurdle faced by vulnerable individuals to transition towards decent jobs. Moreover, even when transitions are likely, the journey towards decent jobs might be long. As observed in the Indonesia and South Africa samples, people tend to decrease their transition rate during prime age, indicating that it may take individuals many years to move towards stable employment. In sum, younger age determines transitioning towards better jobs, but what else matters? Though our exploration of skills as drivers of labour mobility is not conclusive, there is suggestive evidence that socioemotional skills play a role in encouraging certain types of transitions. For example, in South Africa, computer literacy is positively related to transitioning between informal and formal jobs. Meanwhile, in the Indonesian sample, higher levels of openness to new experiences are related to a higher probability of transitioning across sectors, nature of employment, and occupation; and the lack of emotional stability is related to lower transition probabilities between informal and formal jobs.
These results highlight the importance of furthering the understanding of the context in which transitions are being observed, and, therefore, of collecting panel data that allows for such exploration. In this regard, our research point to two important research avenues so far unexplored in LMIC: (i) the need to deepen our understanding of the role of certain skills (e.g., socioemotional ones) in fostering advantageous work-to-work transitions; (ii) examining how changes in the labour market structure of different countries or regions have affected transitions over time. Moreover, future research could investigate transitions at a more granular sectoral level and how the transformation to a sustainable economy will affect working transitions (e.g. transitions out of fossil-fuel-based industries and sectors to green jobs and industries.
Appendix A: Labour Force Survey indicators
Table A.1: Key labour market indicators for South Africa and Indonesia by age cohort, 2010, 2016, and 2019

Notes: Age categorizations include: ‘Youth’ (15-24 years), ‘Prime aged’ (25-54 years) and ‘Older’ (54-64 years). Categories not necessarily add up to 100 as the share of ‘not classified’ is omitted. All classifications follow ILOSTAT definitions. Blanks indicate that no data is available. For the definition of the skill level of occupations please see footnote 7 Source: South African labour force survey in 2010, 2016, and 2019 from ILOSTAT. Indonesian quarterly labour force survey in 2010-Q3, 2016-Q3, and 2019-Q3 from ILOSTAT.
Appendix B: Further information on the panel sample sizes and attrition rates in the IFLS (Indonesia) and NIDS (South Africa)
When working with panel data, sample attrition is often a concern. It may reduce the precision of the estimation by reducing the sample size. It could also bias results if attrition is non-random. A variety of reasons may lead to attrition from the survey: some individuals may not have been tracked, refused to be interviewed, died between survey waves, etc. Table B.1 depicts the extent of individual attrition between waves for the two panel databases. Overall, attrition in Indonesia is quite low, especially considering the time spans between each wave of the survey. The sample size increased as additional household members were interviewed in subsequent waves. The low rates of attrition were made possible due to the IFLS team tracking individuals who have relocated to other households in between the survey waves (Dartanto et al., 2020). The low rates of attrition are in line with findings in other studies. Mani et al. (2018) and Thomas et al. (2012) report they are able to follow 81 and 86 percent of individuals, respectively, between waves 1 through 4.
Meanwhile, while the NIDS also aims to track all original respondents in South Africa, a considerable number of people attrite between waves. Wave-to-wave attrition fluctuates around 25 percent which is relatively high but in line with household panels in other developing and emerging countries (Alderman et al., 2001). Besides, it should be noted that this wave-to-wave attrition is higher than the panel attrition rate, as the former does not take into account individuals who have previously exited the survey but have been successfully interviewed in subsequent waves. While attrition occurs, the sample size is still increasing as younger household members (15+) enter the adult survey and individuals are added to the sample to maintain representativeness.
Though overall attrition is low in Indonesia, attrition attributed to individuals who answered questions in the employment module is considerably higher. Table B.2 in the appendix displays the sample sizes and attrition rates of individuals who answered the employment module in the IFLS, as well as those who are employed. First, observing the sample size of those who answered the employment module, we observe smaller sample sizes. This is due to the sampling scheme employed by the IFLS. In the first round of the survey (IFLS1), specific household members were randomly selected to give de- tailed information, as interviewing all members of each household would be expensive. The following individuals were selected to obtain detailed information, including the employment modules: the household head, the spouse of the household head, a household member over the age of 50 and their spouse, two children of the spouse aged between zero and fourteen (randomly selected), and from the remaining household members, a member aged between fifteen and forty-nine and her/his spouse (though only for 25% of the households, which were randomly selected (Strauss et al., 2016). In terms of the higher attrition rates for those who answered the employment module, though individuals may have given basic information in multiple waves of the surveys (thus, the low attrition rates displayed in Table B.1), they may not have answered questions in the employment module for all survey rounds. Setyonaluri (2014) states that this may be due to respondent fatigue. Considering individuals who answered the employment module, the average attrition rate overall five waves is more similar to that of South Africa (approximately 26% for South Africa, and 29% for Indonesia).
Table B.1: Panel sample sizes and attrition rates between waves
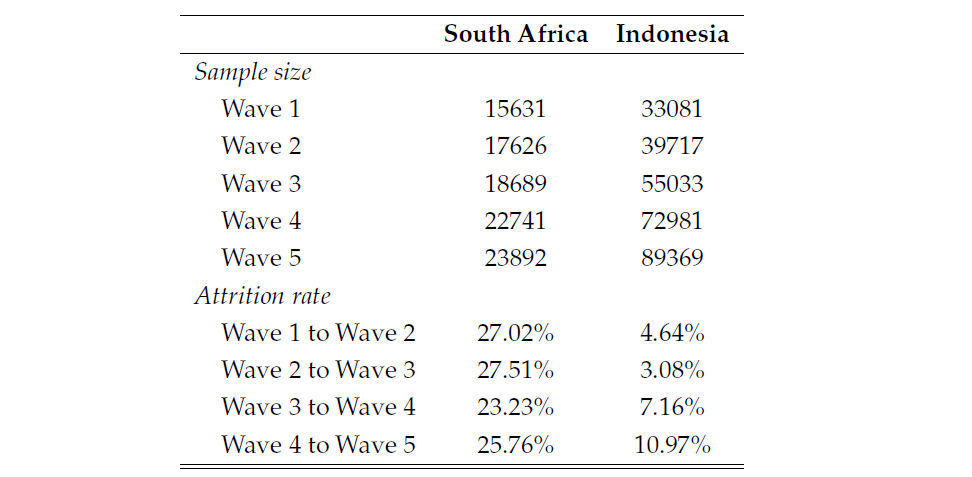
Notes: The South African sample size corresponds to the number of respondents of the NIDS adults (15+) questionnaire. Source: authors calculations based on NIDS and IFLS.
If non-attritors and attritors systematically differ in the outcome variables of interest and attrition is found to be non-random, a solution is to create inverse probability weights which adjust for sample attrition (Fitzgerald et al., 1998; Wooldridge, 2010). Fortunately, in the case of South Africa, NIDS has released panel weights along with the data, which are intended to correct for bias resulting from non-random attrition between Wave 1 and subsequent waves (Branson and Wittenberg, 2019). The IFLS similarly has cross-sectional and panel weights designed to correct for attrition and sampling design. The panel weights adjust the original survey design to ensure that the weighted distribution of households who remain in the sample (non-attritors) is comparable to the cross-sectional distribution of households in the first wave. The panel weights in the IFLS, though, are only included for individuals who are present in all five waves.
To determine whether attrition is non-random, we perform a series of tests. These tests rely on a binary variable indicating whether an individual present in one wave exits the survey in the subsequent wave. We conduct two tests that are commonly applied in the literature to determine whether attrition is random: attrition probits (Fitzgerald et al., 1998) in which the attrition variable is regressed on the outcome variable of interest and the Becketti, Gould, Lillard and Welch (or BGLW) test (Becketti et al., 1988), which is simply the inverse of the attrition probit, in which the attrition selection is based on the significance of the coefficient of the attrition dummy. Significant coefficients indicate the presence of non-random attrition, which can be remedied by applying inverse probability weights. To determine whether the weights have corrected the issue of attrition, all specifications for both tests are conducted with and without weights.
The tests are conducted separately for each outcome of interest. In our case, this is complicated by the fact that our outcome variables of interest (i.e., whether an individual has transitioned in their status of employment, sector, etc.) depends on an individual being present in at least two waves. Consequently, no such variable can be created for those that attrite. We use the underlying variables (status in employment, sector, etc.) as a proxy to determine whether attrition is non-random.
Table B.3, presents the results of the attrition probit and the BGLW test for South Africa. Applying the panel weights produces attrition test results that generally indicate that attrition is random, suggesting that the weights perform well. We thus apply these weights in our analysis. Similar to the NIDS, the IFLS provides weights to correct for attrition and sampling bias, creating a more representative sample to that of the population in the thirteen provinces captured in the survey. It must be noted that the included weights in the IFLS correct for attrition of the entire sample, not for that of the employment module. Table B.4 shows the results of the tests for random attrition in Indonesia. It is clear that attrition is not random; however, the bias decreases once the weights are used.
Table B.2: Panel sample sizes and attrition rates between waves, employment module, Indonesia (IFLS)
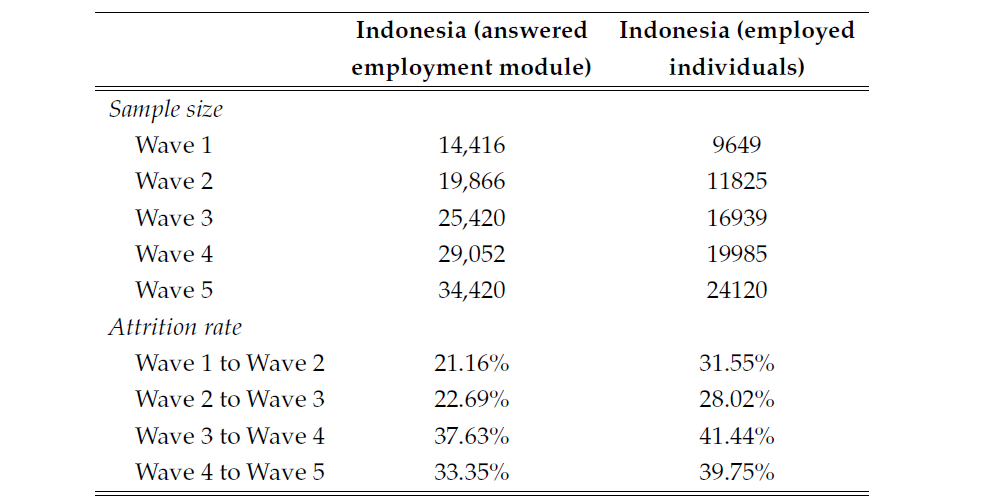
Notes: This table displays the sample sizes and attrition rates of individuals who answered the employment module in the IFLS, as well as those who are employed in Indonesia. Source: authors’ calculations based on IFLS.
Table B.3: Results of the tests for selective attrition, South Africa (NIDS)

Notes: This table presents the results of the attrition probit and the BGLW test for South Africa. * p < 0.10, ** p < 0.05, *** p < 0.01, with significant coefficients here indicating that attrition is non-random. For the NIDS, the panel weights are provided by NIDS to correct for non-random attrition. Standard errors in parentheses. Source: authors’ calculations based on NIDS.
Table B.4: Results of the tests for selective attrition, Indonesia (IFLS)

Notes: This table presents the results of the attrition probit and the BGLW test for Indonesia. * p < 0.10, ** p < 0.05, *** p < 0.01, with significant coefficients here indicating that attrition is non-random. For the IFLS, weights are provided by IFLS to correct for non-random attrition and sampling. Standard errors in parentheses. Source: authors’ calculations based on IFLS.
Appendix C: Differences in the composition of labour market variables across and within cohorts in Indonesia and South Africa
Table C.1: Share of workers by status of employment, sector, occupation skill level and formality by age cohort in South Africa, wave 1 (2008) and wave 5 (2017)

Notes: The table illustrates the evolution across waves 1 and 5 in the share of workers in each employment status, sector, occupation skill level and formality by age cohorts in South Africa. ‘Diff’ denoted the difference in the share between Wave 1 (2008) and Wave 5 (2017). Panel weights are applied. Source: authors elaboration based on NIDS.
Table C.2: Share of workers by status of employment, sector, occupation skill level and formality in Indonesia by age cohort, wave 1 (1993), wave 4 (2007/08) and wave 5 (2014/15)


Notes: The table illustrates the evolution across wave 1 (1993), wave 4(2007/08) and wave 5 (2014/15) in the share of workers in each employment status, sector, occupation skill level and formality by age cohorts in Indonesia. ‘Diff’ denoted the difference in the share between waves 1 and 4 (1993–2008) and waves 4 and 5 (2008–2015). Panel weights are applied. Source: authors elaboration based on IFLS.
Appendix D: Transitions across labour market statuses over time by age-cohort, South Africa and Indonesia
Table D.1: Share of individuals transitioning across labour force statuses (employment, unemployment and inactivity) between survey waves in South Africa and Indonesia)

Notes: The table depicts the share of individuals who have transitioned (irrespective of their direction) between labour force statuses (employment, unemployment and inactivity) between the respective survey waves Age cohorts fixed in W1 (2008) for South Africa and W4 (2007/08) for Indonesia, Panel weights applied. Source: authors elaboration based on NIDS and IFLS.
Table D.2: Share of individuals who have transitioned across different mid-skill level occupations in Indonesia

Notes: The table depicts the share of individuals who have transitioned between the following mid-level occupations in Indonesia: craft/trades to agriculture, agriculture to services and sales, and craft/trades to services and sales, across the respective survey waves. Age cohorts fixed in W4 (2007/08). Panel weights applied. Source: authors calculations based on IFLS.
Appendix E: Section 6 – Additional analyses
Table E.1: South Africa: Occupation – stayers vs transitioners with cognitive skills

Notes: Clustered standard errors at the individual level are in parentheses. All columns control for province and include individual and age-cohort x wave fixed effects. *p < 0.1, **p < 0.05, ***p < 0.01. Source: authors elaboration based on NIDS.
Table E.2: South Africa: Nature of Employment – stayers vs transitioners with cognitive skills

Notes: Clustered standard errors at the individual level are in parentheses. All columns control for province and include individual and age-cohort x wave fixed effects. *p < 0.1, **p < 0.05, ***p < 0.01. Source: authors elaboration based on NIDS.
Table E.3: South Africa: Sector – Stayers vs Transitioners

Notes: Clustered standard errors at the individual level are in parentheses. All columns control for province. *p < 0.1, **p < 0.05, ***p < 0.01. Source: authors elaboration based on NIDS.
Table E.4: South Africa: Sector – stayers vs transitioners with cognitive skills
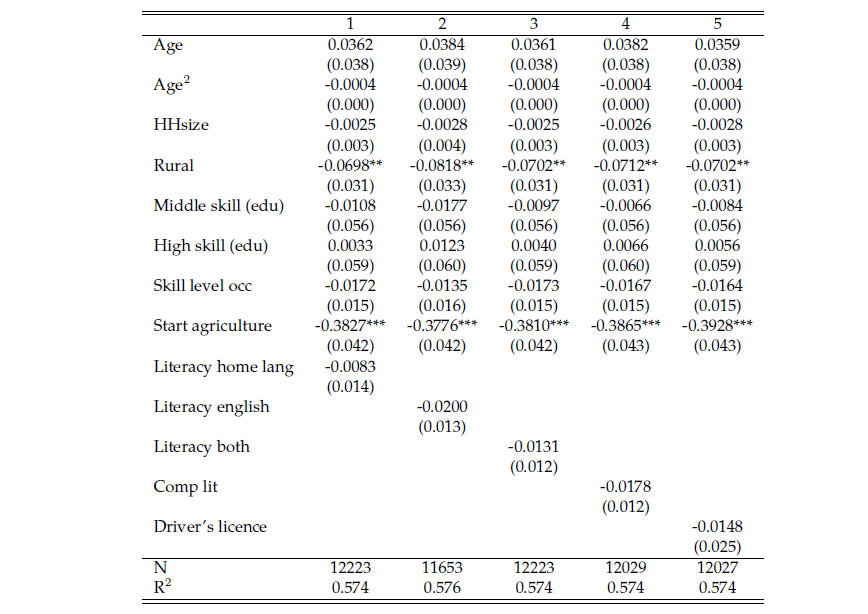
Notes: Clustered standard errors at the individual level are in parentheses. All columns control for province. *p < 0.1, **p < 0.05, ***p < 0.01. Source: authors elaboration based on NIDS.
Table E.5: South Africa: Status of employment – Stayers vs Transitioners

Notes: Clustered standard errors at the individual level are in parentheses. All columns control for province. *p < 0.1, **p < 0.05, ***p < 0.01. Source: authors elaboration based on NIDS.
Table E.6: South Africa: Status of employment – stayers vs transitioners with cognitive skills

Notes: Clustered standard errors at the individual level are in parentheses. All columns control for province and include individual and age-cohort x wave fixed effects. *p < 0.1, **p < 0.05, ***p < 0.01. Source: authors elaboration based on NIDS.
Table E.7: Indonesia stayers vs transitioners: sector - cognitive and socioemotional skills
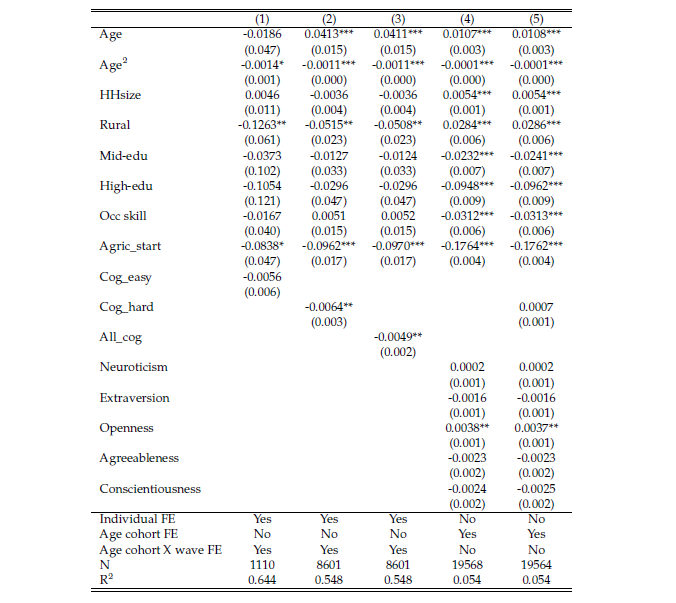
Notes: Clustered standard errors at the individual level are in parentheses. All columns control for province. *p < 0.1, **p < 0.05, ***p < 0.01. Source: authors elaboration based on IFLS.
Table E.8: Indonesia stayers vs transitioners: status of employment - cognitive and socioemotional skills

Notes: Clustered standard errors at the individual level are in parentheses. All columns control for province. *p < 0.1, ** p < 0.05, ***p < 0.01. Source: authors elaboration based on IFLS.
Table E.9: Indonesia: Nature of Employment – stayers vs transitioners

Notes: Clustered standard errors at the individual level are in parentheses. All columns control for province. *p < 0.1, **p < 0.05, ***p < 0.01. Source: authors elaboration based on IFLS.
Table E.10: Indonesia: Nature of Employment – stayers vs transitioners with cognitive and socioemotional skills
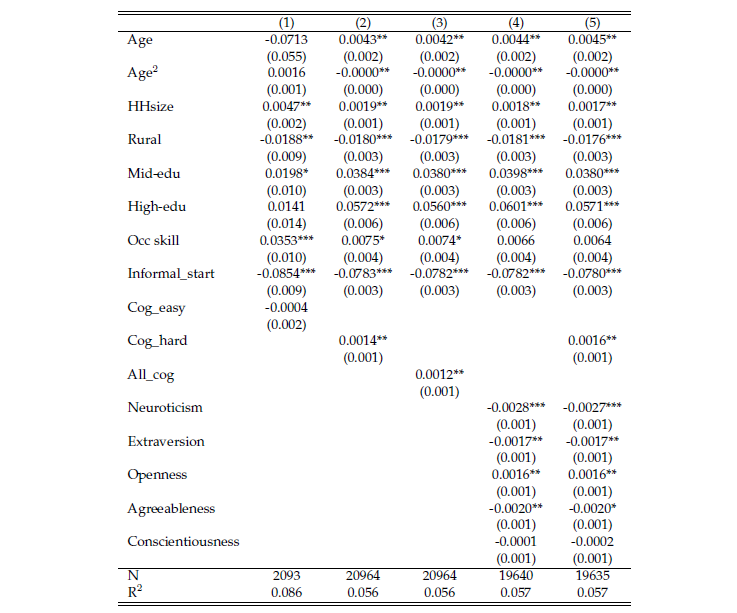
Notes: Clustered standard errors at the individual level are in parentheses. All columns control for province and include individual and age-cohort x wave fixed effects. *p < 0.1, ** p < 0.05, ***p < 0.01. Source: authors elaboration based on IFLS.
Table E.11: Indonesia: Occupation – stayers vs transitioners
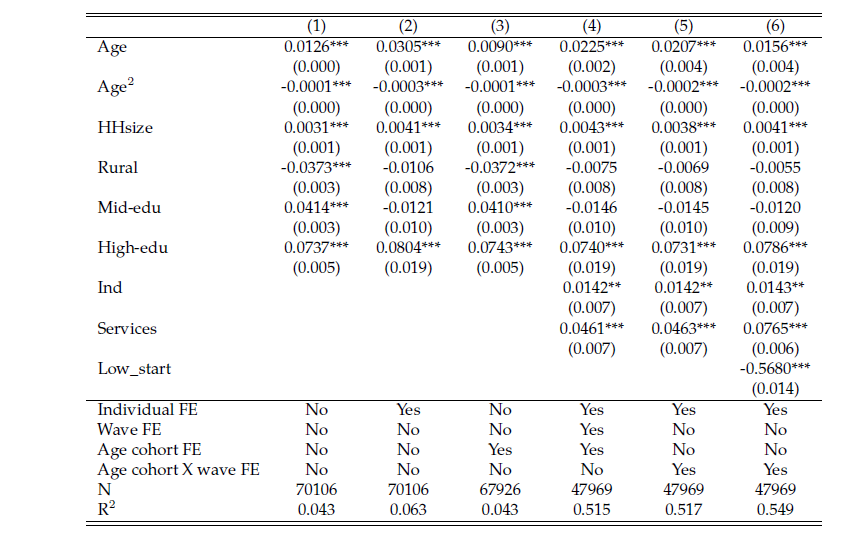
Notes: Clustered standard errors at the individual level are in parentheses. All columns control for province. *p < 0.1, ** p < 0.05, ***p < 0.01. Source: authors elaboration based on IFLS.
Table E.12: Indonesia: Occupation – stayers vs transitioners with cognitive and socioemotional skills
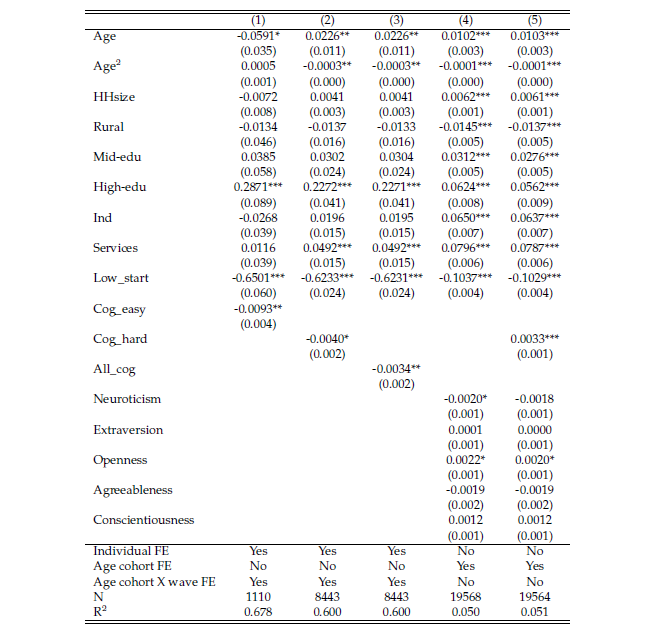
Notes: Clustered standard errors at the individual level are in parentheses. All columns control for province. *p < 0.1, **p < 0.05, ***p < 0.01. Source: authors elaboration based on IFLS.
Table E.13: Indonesia: Sector and status of employment - fractional polynomial estimations

Notes: All estimations are linear probability models. Clustered standard errors at the individual level are in parentheses. All columns control for province, as well as individual and age cohort X wave fixed effects. *p < 0.1, ** p < 0.05, ***p < 0.01. Source: authors elaboration based on IFLS.
E.1: Estimations by gender
Table E.14: South Africa stayers vs. transitioners: Occupation – Men

Notes: Clustered standard errors at the individual level are in parentheses. All columns control for province. *p < 0.1, ** p < 0.05, ***p < 0.01. Source: authors elaboration based on NIDS.
Table E.15: South Africa stayers vs. transitioners: Occupation – Women

Notes: Clustered standard errors at the individual level are in parentheses. All columns control for province. *p < 0.1, ** p < 0.05, ***p < 0.01. Source: authors elaboration based on NIDS.
Table E.16: South Africa stayers vs transitioners: Nature of employment – Men

Notes: Clustered standard errors at the individual level are in parentheses. All columns control for the province. *p < 0.1, ** p < 0.05, ***p < 0.01. Source: authors elaboration based on NIDS.
Table E.17: South Africa stayers vs transitioners: Nature of employment – Women

Notes: Clustered standard errors at the individual level are in parentheses. All columns control for the province. *p < 0.1, **p < 0.05, ***p < 0.01. Source: authors elaboration based on NIDS.
Table E.18: Indonesia stayers vs. transitioners: Status of employment – Women

Notes: Clustered standard errors at the individual level are in parentheses. All columns control for province. *p < 0.1, ** p < 0.05, ***p < 0.01. Source: authors elaboration based on IFLS.
Table E.19: Indonesia stayers vs. transitioners: Status of employment – Men

Notes: Clustered standard errors at the individual level are in parentheses. All columns control for province. *p < 0.1, **p < 0.05, ***p < 0.01. Source: authors elaboration based on IFLS.
Table E.20: Indonesia stayers vs transitioners: Sector – Women

Notes: Clustered standard errors at the individual level are in parentheses. All columns control for province. *p < 0.1, **p < 0.05, *** p < 0.01. Source: authors elaboration based on IFLS.
Table E.21: Indonesia stayers vs transitioners: Sector – Men

Notes: Clustered standard errors at the individual level are in parentheses. All columns control for province. *p < 0.1, * * p < 0.05, * * * p < 0.01. Source: authors elaboration based on IFLS.
References
Adhvaryu, N. K., Achyuta and Nyshadham, A. (forthcoming) Returns to on-the-job soft skills training, Journal of Political Economy.
Alderman, H., Behrman, J., Kohler, H.-P., Maluccio, J. A. and Watkins, S. (2001) Attrition in Longitudinal Household Survey Data: Some Tests for Three Developing-Country Samples, Demographic Research, 5, 79–124.
Allen, E. R. (2016) Analysis of Trends and Challenges in the Indonesian Labor Market, Tech. Rep. No. 16.
Almlund, M., Duckworth, A. L., Heckman, J. and Kautz, T. (2011) Personality psychology and economics, in Handbook of the Economics of Education, Elsevier, vol. 4, pp. 1–181.
Atkinson, A. B. and Micklewright, J. (1991) Unemployment Compensation and Labor Market Transitions: A Critical Review, Journal of Economic Literature, 29, 1679–1727, publisher: American Economic Association.
Banerjee, A., Galiani, S., Levinsohn, J., McLaren, Z. and Woolard, I. (2008) Why has unemployment risen in the New South Africa? 1, Economics of Transition, 16, 715–740.
Becketti, S., Gould, W., Lillard, L. and Welch, F. (1988) The Panel Study of Income Dynamics after Fourteen Years: An Evaluatio n, Journal of Labor Economics, 6, 472–92, publisher: University of Chicago Press.
Bennett, F., Escudero, V., Liepmann, H. and Podjanin, A. (2022) Using online vacancy and job applicants’ data to study skills dynamics, ILO Working Paper 75.
Bhorat, H., Cassim, A. and Yu, D. (2016) Temporary employment services in South Africa: Assessing the industry’s economic contribution, Tech. Rep. 28, Labour Market Intelligence Partnership, Pretoria.
Bhorat, H., Lilenstein, K., Oosthuizen, M. and Thornton, A. (2020a) The Evolution of Earnings and Employment in South Africa: Tasks, Occupations and Gender, 2000-2015, UNU WIDER ST Project Book Chapter, UN WIDER.
Bhorat, H., Lilenstein, K., Oosthuizen, M. and Thornton, A. (2020b) Structural transformation, inequality, and inclusive growth in South Africa, WIDER Working Paper 2020/50, UNU-WIDER, Helsinki.
Bhorat, H., Lilenstein, K., Oosthuizen, M. and Thornton, A. (2020c) Wage polarization in a high-inequality emerging economy: The case of South Africa, WIDER Working Paper 2020/55, UNU-WIDER, Helsinki.
Branson, N. and Leibbrandt, M. (2013) Educational Attainment and Labour Market Out- comes in South Africa, 1994-2010, publisher: OECD.
Branson, N. and Wittenberg, M. (2019) Longitudinal and Cross-Sectional Weights in the NIDS Data 1-5.
Byrne, D. and Strobl, E. (2004) Defining unemployment in developing countries: evidence from Trinidad and Tobago, Journal of Development Economics, 73, 465–476.
Calero, C. and Delautre, G. (forthcoming) Participation and employment in seven developing economies: an age-period-cohort analysis, Working paper, ILO, Geneva.
Chioda, D. C.-L. P. G., Laura and Carney, D. (2021) Making entrepreneurs: Returns to training youth in hard versus soft business skills, Working Paper 28845, National Bureau of Economic Research, series: Working Paper Series.
Cichello, P., Leibbrandt, M. and Woolard, I. (2014) Winners and losers: South African labour-market dynamics between 2008 and 2010, Development Southern Africa, 31, 65–84.
Comola, M. and Mello, L. D. (2011) How Does Decentralized Minimum Wage Setting Affect Employment and Informality? The Case of Indonesia, Review of Income and Wealth, 57, S79–S99, _eprint: https://onlinelibrary.wiley.com/doi/pdf/10.1111/j.1475- 4991.2011.00451.x.
Cunha, F., Heckman, J. J. and Schennach, S. M. (2010) Estimating the technology of cognitive and noncognitive skill formation, Econometrica, 78, 883–931.
Dartanto, T., Moeis, F. R. and Otsubo, S. (2020) Intragenerational Economic Mobility in Indonesia: A Transition from Poverty to the Middle Class in 1993–2014, Bulletin of Indonesian Economic Studies, 56, 193–224, publisher: Routledge _eprint: https://doi.org/10.1080/00074918.2019.1657795.
Deming, D. (2017) The growing importance of social skills in the labor market, Quarterly Journal of Economics, 132, 1593–1640.
Deming, D. J. (2022) Four facts about human capital, Journal of Economic Perspectives, 36, 75–102.
Dimitriadis, S. and Koning, R. (2022) Social skills improve business performance: Evidence from a randomized control trial with entrepreneurs in togo, Management Science.
Duryea, S., Lam, D. and Levison, D. (2007) Effects of economic shocks on children’s employment and schooling in Brazil, Journal of Development Economics, 84, 188–214.
Essers, D. (2016) South African Labour Market Transitions Since the Global Financial and Economic Crisis: Evidence from two Longitudinal Datasets, Journal of African Economies, 2.
Fitzgerald, J., Gottschalk, P. and Moffitt, R. (1998) An Analysis of Sample Attrition in Panel Data: The Michigan Panel Study of Income Dynamics, The Journal of Human Resources, 33, 251.
Fox, L., Haines, C., Munoz, J. H. and Thomas, A. H. (2013) Africa’s Got Work to Do: Employment Prospects in the New Century, IMF Working Papers, 13.
Glewwe, P., Huang, Q. and Park, A. (2017) Cognitive skills, noncognitive skills, and school- to-work transitions in rural China, Journal of Economic Behavior & Organization, 134, 141– 164.
Gutierrez, I. A., Kumar, K. B., Mahmud, M., Munshi, F. and Nataraj, S. (2019) Transitions between informal and formal employment: results from a worker survey in Bangladesh, IZA Journal of Development and Migration, 9, 3.
Hansen, T. R.-R. S., Stephen and Fuller, J. (2021) The demand for executive skills, Working Paper 28959, National Bureau of Economic Research, series: Working Paper Series.
Heckman, J., Pinto, R. and Savelyev, P. (2013) Understanding the mechanisms through which an influential early childhood program boosted adult outcomes, American Eco- nomic Review, 103, 2052–86.
Heckman, J. J., Jagelka, T. and Kautz, T. D. (2019) Some Contributions of Economics to the Study of Personality, Working Paper 26459, National Bureau of Economic Research, series: Working Paper Series.
Heckman, J. J., Stixrud, J. and Urzua, S. (2006) The effects of cognitive and noncognitive abilities on labor market outcomes and social behavior, Journal of Labor economics, 24, 411–482.
Hoffman, M. and Tadelis, S. (2021) People management skills, employee attrition, and manager rewards: An empirical analysis, Journal of Political Economy, 129, 243–285.
ILO (2003) Guidelines concerning a statistical definition of informal employment, Meeting document, Geneva.
ILO (2005) Working out of disaster: improving employment and livelihood in countries affected by the tsunami, International Labour Organization, Bangkok, oCLC: 71757259.
ILO (2012) International Standard Classification of Occupations 2008 (ISCO-08): structure, group definitions and correspondence tables, International Labour Office.
ILO (2015) Recommendation No. 204 concerning the Transition from the Informal to the Formal Economy, Meeting document, International Labour Office, Geneva.
ILO (2018) Informality and non-standard forms of employment, Report, International Labour Organization, Geneva.
Jones, S. R. G. and Riddell, W. C. (1995) The Measurement of Labor Force Dynamics with Longitudinal Data: The Labour Market Activity Survey Filter, Journal of Labor Economics, 13, 351–385, publisher: The University of Chicago Press.
Jones, S. R. G. and Riddell, W. C. (1999) The Measurement of Unemployment: An Empirical Approach, Econometrica, 67, 147–162, _eprint: https://onlinelibrary.wiley.com/doi/pdf/10.1111/1468-0262.00007.
Kingdon, G. and Knight, J. (2007) Unemployment in South Africa, 1995–2003: Causes, Problems and Policies, Journal of African Economies, 16, 813–848.
Kingdon, G. G. and Knight, J. (2004) Unemployment in South Africa: The Nature of the Beast, World Development, 32, 391–408.
Kirchberger, M. (2017) Natural disasters and labor markets, Journal of Development Eco- nomics, 125, 40–58.
Mani, S., Mitra, S. and Sambamoorthi, U. (2018) Dynamics in health and employment: Evidence from Indonesia, World Development, 104, 297–309.
Manning, C. and Pratomo, D. (2018) Labour Market Developments in the Jokowi Years,
Southeast Asian Economies, 35, 165–184.
McCaig, B. and Pavcnik, N. (2015) Informal Employment in a Growing and Globalizing Low-Income Country, American Economic Review, 105, 545–550.
Naidoo, D., Packard, T. and Auwalin, I. (2015) Mobility, Scarring and Job Quality in Indonesia’s Labor Market, Working Paper, The World Bank.
Osberg, L. (1993) Fishing in Different Pools: Job-Search Strategies and Job-Finding Success in Canada in the Early 1980s, Journal of Labor Economics, 11, 348–386, publisher: The University of Chicago Press.
O’Higgins, N., Viegelahn, C. et al. (2021) Informal employment in vietnam: Trends and determinants.
Pugatch, T. (2018) Bumpy Rides: School-to-work Transitions in South Africa, LABOUR, 32, 205–242.
Quintini, G. and Martin (2014) Same Same but Different: School-to-work Transitions in Emerging and Advanced Economies, OECD Social, Employment and Migration Working Papers 154, series: OECD Social, Employment and Migration Working Papers Volume: 154.
Rodrik, D. (2008) Understanding South Africa’s economic puzzles*, Eco- nomics of Transition and Institutional Change, 16, 769–797, _eprint: https://onlinelibrary.wiley.com/doi/pdf/10.1111/j.1468-0351.2008.00343.x.
Rothenberg, A. D., Gaduh, A., Burger, N. E., Chazali, C., Tjandraningsih, I., Radikun, R., Sutera, C. and Weilant, S. (2016) Rethinking Indonesia’s Informal Sector, World Develop- ment, 80, 96–113.
Sahin, H. and Kizilirmak, A. B. (2007) Determinants of duration of unemployment insurance benefits in Turkey, Applied Economics Letters, 14, 611–615.
Samaniego, B. and Viegelahn, C. (2021) Estimating labour market transitions from labour force surveys: The case of Viet Nam, Working paper 35, ILO, Geneva, iSBN: 9789220349991.
Setyonaluri, D. (2014) Women Interrupted: Determinants of Women’s Employment Exit and Return in Indonesia, Bulletin of Indonesian Economic Studies, 50, 485–486.
Strauss, J., Witoelar, F. and Sikoki, B. (2016) The fifth wave of the Indonesia family life survey: overview and field report, vol. 1, RAND Santa Monica, CA.
Tentua, M. N. and Winarko, E. (2020) Applying Data Mining to Analysis of Mismatch Between Education and Labor Market in Indonesia, IOP Conference Series: Materials Science and Engineering, 771, 012020, publisher: IOP Publishing.
Thomas, D., Witoelar, F., Frankenberg, E., Sikoki, B., Strauss, J., Sumantri, C. and Suriastini,
W. (2012) Cutting the costs of attrition: Results from the Indonesia Family Life Survey, Journal of Development Economics, 98, 108–123.
van den Berg, G. J. (1990) Search Behaviour, Transitions to Non-participation and the Duration of Unemployment, The Economic Journal, 100, 842–865, publisher: [Royal Economic Society, Wiley].
Vega Núñez, A. P. (2018) Analysis of formal-informal transitions in the Ecuadorian labour market, CEPAL Review, 2017, 78–95.
Wooldridge, J. M. (2010) Econometric Analysis of Cross Section and Panel Data, second edition, MIT Press, google-Books-ID: hSs3AgAAQBAJ.
Zizzamia, R. (2020) Is employment a panacea for poverty? A mixed-methods investigation of employment decisions in South Africa, World Development, 130, 104938
Acknowledgements
We thank Janine Berg, Jens Dyring Christensen, Guillaume Delautre, and Christian Viegelahn for their helpful comments and suggestions on various versions of the paper, and Hannah Liepmann and Willian Boschetti for valuable contributions. We thank as well Haroon Bhorat, Kazutoshi Chatani, Sara Elder, Joni Musabayana, Akiko Sakamoto, Ken Chamuva Shawa and Theodoor Sparreboom for their valuable input to the project design and country contextual insights. Lastly, we thank participants of the ILO-EU Regional Workshop on Changing Labour Market Transitions and Life Courses (2021), the ILERA conference (2021) and the BeNA Labor Economics Workshop (2022) for their feedback. The responsibility for opinions expressed in this article rests solely with its authors, and publication does not constitute an endorsement by the International Labour Office of the opinions expressed in it.

