Buffer or Bottleneck? Employment Exposure to Generative AI and the Digital Divide in Latin America
Abstract
Empirical evidence on the potential impacts of generative artificial intelligence (GenAI) is mostly focused on high-income countries. In contrast, little is known about the role of this technology on the future economic pathways of developing economies. This paper contributes to fill this gap by estimating the exposure of the Latin American labour market to GenAI. It provides detailed statistics of GenAI exposure between and within countries by leveraging a rich set of harmonized household and labour force surveys. To account for the slower pace of technology adoption in developing economies, it adjusts the measures of exposure to GenAI by using the likelihood of accessing digital technologies at work. This is then used to assess the extent to which the digital divide across and within countries will be a barrier to maximize the productivity gains among occupations that could otherwise be augmented by GenAI tools. The findings show that certain characteristics are consistently correlated with higher exposure. Specifically, urban-based jobs that require higher education, are situated in the formal sector, and are held by individuals with higher incomes are more likely to come into interaction with this technology. Moreover, there is a pronounced tilt toward younger workers facing greater exposure, including the risk of job automation, particularly in the finance, insurance, and public administration sectors. When adjusting for access to digital technologies, the findings show that the digital divide is a major barrier to realizing the positive effects of GenAI on jobs in the region. In particular, nearly half of the positions that could potentially benefit from augmentation are hampered by lack of use of digital technologies. This negative effect of the digital divide is more pronounced in poorer countries.
Introduction
Public attention to Generative AI (GenAI) has been on the rise since the introduction of the conversational models, such as ChatGPT, Bard or Gemini. The impressive abilities of the Large Language Models (LLM), followed by other neural network-based AI systems capable of generating image and even video from simple text prompts have raised a range of important ethical and security questions for national policy makers and international cooperation structures. However, the topic that captures most daily attention of regular citizens is the potential impact of these quickly advancing tools on jobs.
In the United States (US), over half of all adults are more worried than excited about AI in daily life, citing the “loss of human jobs” as their most important concern
Not surprisingly, the potential transformation that might result from the interaction of GenAI with labour markets has also attracted growing attention among scholars. Main research questions have cantered around the impact on employment, emerging occupations, productivity and job quality.2 A recent paper from the IMF provides a comprehensive overview of this literature, at the same time highlighting the scarcity of studies that go beyond high-income countries (HICs)
Bridging this research gap, our study provides new evidence on the potential impacts of GenAI across labour markets in the Latin America and the Caribbean (LAC) region. Building on the approach developed by Gmyrek, Berg and Bescond (2023) – GBB hereafter – we provide new evidence on AI exposure between and within countries by leveraging harmonized household and labour force surveys for LAC from the World Bank (WB) and the International Labour Organization (ILO). By building on the comparative strengths of the datasets from both institutions, we develop a complete regional overview, accompanied by country-level estimates of the potential occupational exposure, with further breakdowns by detailed demographic and labour market characteristics.
An important contribution of this study is to provide a first attempt at adapting measures of jobs’ exposure to GenAI to the context of developing countries, where even workers in occupations that are generally expected to benefit from GenAI may not be able to reap its benefits due to poor access to digital infrastructure. We implement this adjustment by estimating measures of computer use at work across ISCO 2-digit occupations, workers and country-level characteristics based on PIAAC data and by subsequently imputing them into individual observations in country-level surveys included in the SEDLAC database. We then use this measure to create two categories among workers who are expected to benefit from GenAI use because of the nature of their occupations: those who have access to digital technologies, and those who do not. The size of the latter is an indicator of the number of workers who will not be able to enjoy the productivity benefits of GenAI even though their jobs could theoretically benefit from the transformation. We also discuss the detailed demographics of the groups that are most likely to be negatively affected by these infrastructure limitations.
Our findings indicate that between 30 and 40 percent of employment in the LAC is exposed in some way to GenAI. This exposure is linked with the economic status of countries, suggesting that income levels are a strong correlate of GenAI’s impact on labour markets. This total level of exposure includes three categories: exposed to automation, augmentation, and “the big unknown”. The latter includes occupations, which – depending on the progress of technology and the use of adjacent technological applications, such as LLM-based agents – could fall closer to automation or augmentation.
Certain characteristics consistently correlate with higher overall GenAI exposure. Specifically, urban-based jobs that require higher education, are situated in the formal sector, and are held by individuals with higher relative incomes are more likely to come into interaction with this technology. The share of jobs exposed to automation is relatively small but nontrivial at about 2 to 5 percent of total employment. Younger and female workers tend to face greater automation exposure, particularly in the finance, insurance, and public administration sectors. At the same time, the shares of jobs that could benefit from a productive transformation with GenAI are consistently higher than those with automation risks across all LAC countries, ranging between 8 and 12 percent of employment across countries. This is particularly the case for the jobs in education, health and personal services. In addition, the sectors oriented towards customer service (retail, trade, hotels, restaurants, etc.) face an elevated exposure to "the big unknown". This category encompasses the largest (14-21 percent) share of employment in our estimates, demonstrating that, while the concept of occupational exposure is easier to establish, the precise effects on how many occupations might evolve are harder to predict for a large share of today’s labour markets.
Finally, we find that access to digital technologies is a critical determinant of the extent to which workers can harness the potential benefits of GenAI. Nearly half of the positions that could potentially benefit from augmentation are hampered by digital shortcomings that will prevent them from realizing that potential. Specifically, 6.24 percent of jobs held by women and 6.22 percent of those held by men are affected due to these gaps. Similar limitations apply to the jobs in the “big unknown” category: even though some of them could potentially pivot towards augmentation through increasing complementarity between GenAI and the human worker in these occupations, the digital gaps will prevent large shares of these jobs from such a scenario.
The rest of this study is structured as follows: section 2 provides a general overview of the LAC region and elaborates on the theoretical effects one could expect from the interaction of GenAI with its labour markets, section 3 discusses the data and methods applied to our analysis, section 4 provides a detailed breakdown of our findings, with the final discussion presented in section 5.
LAC region and the theoretical effects of GenAI
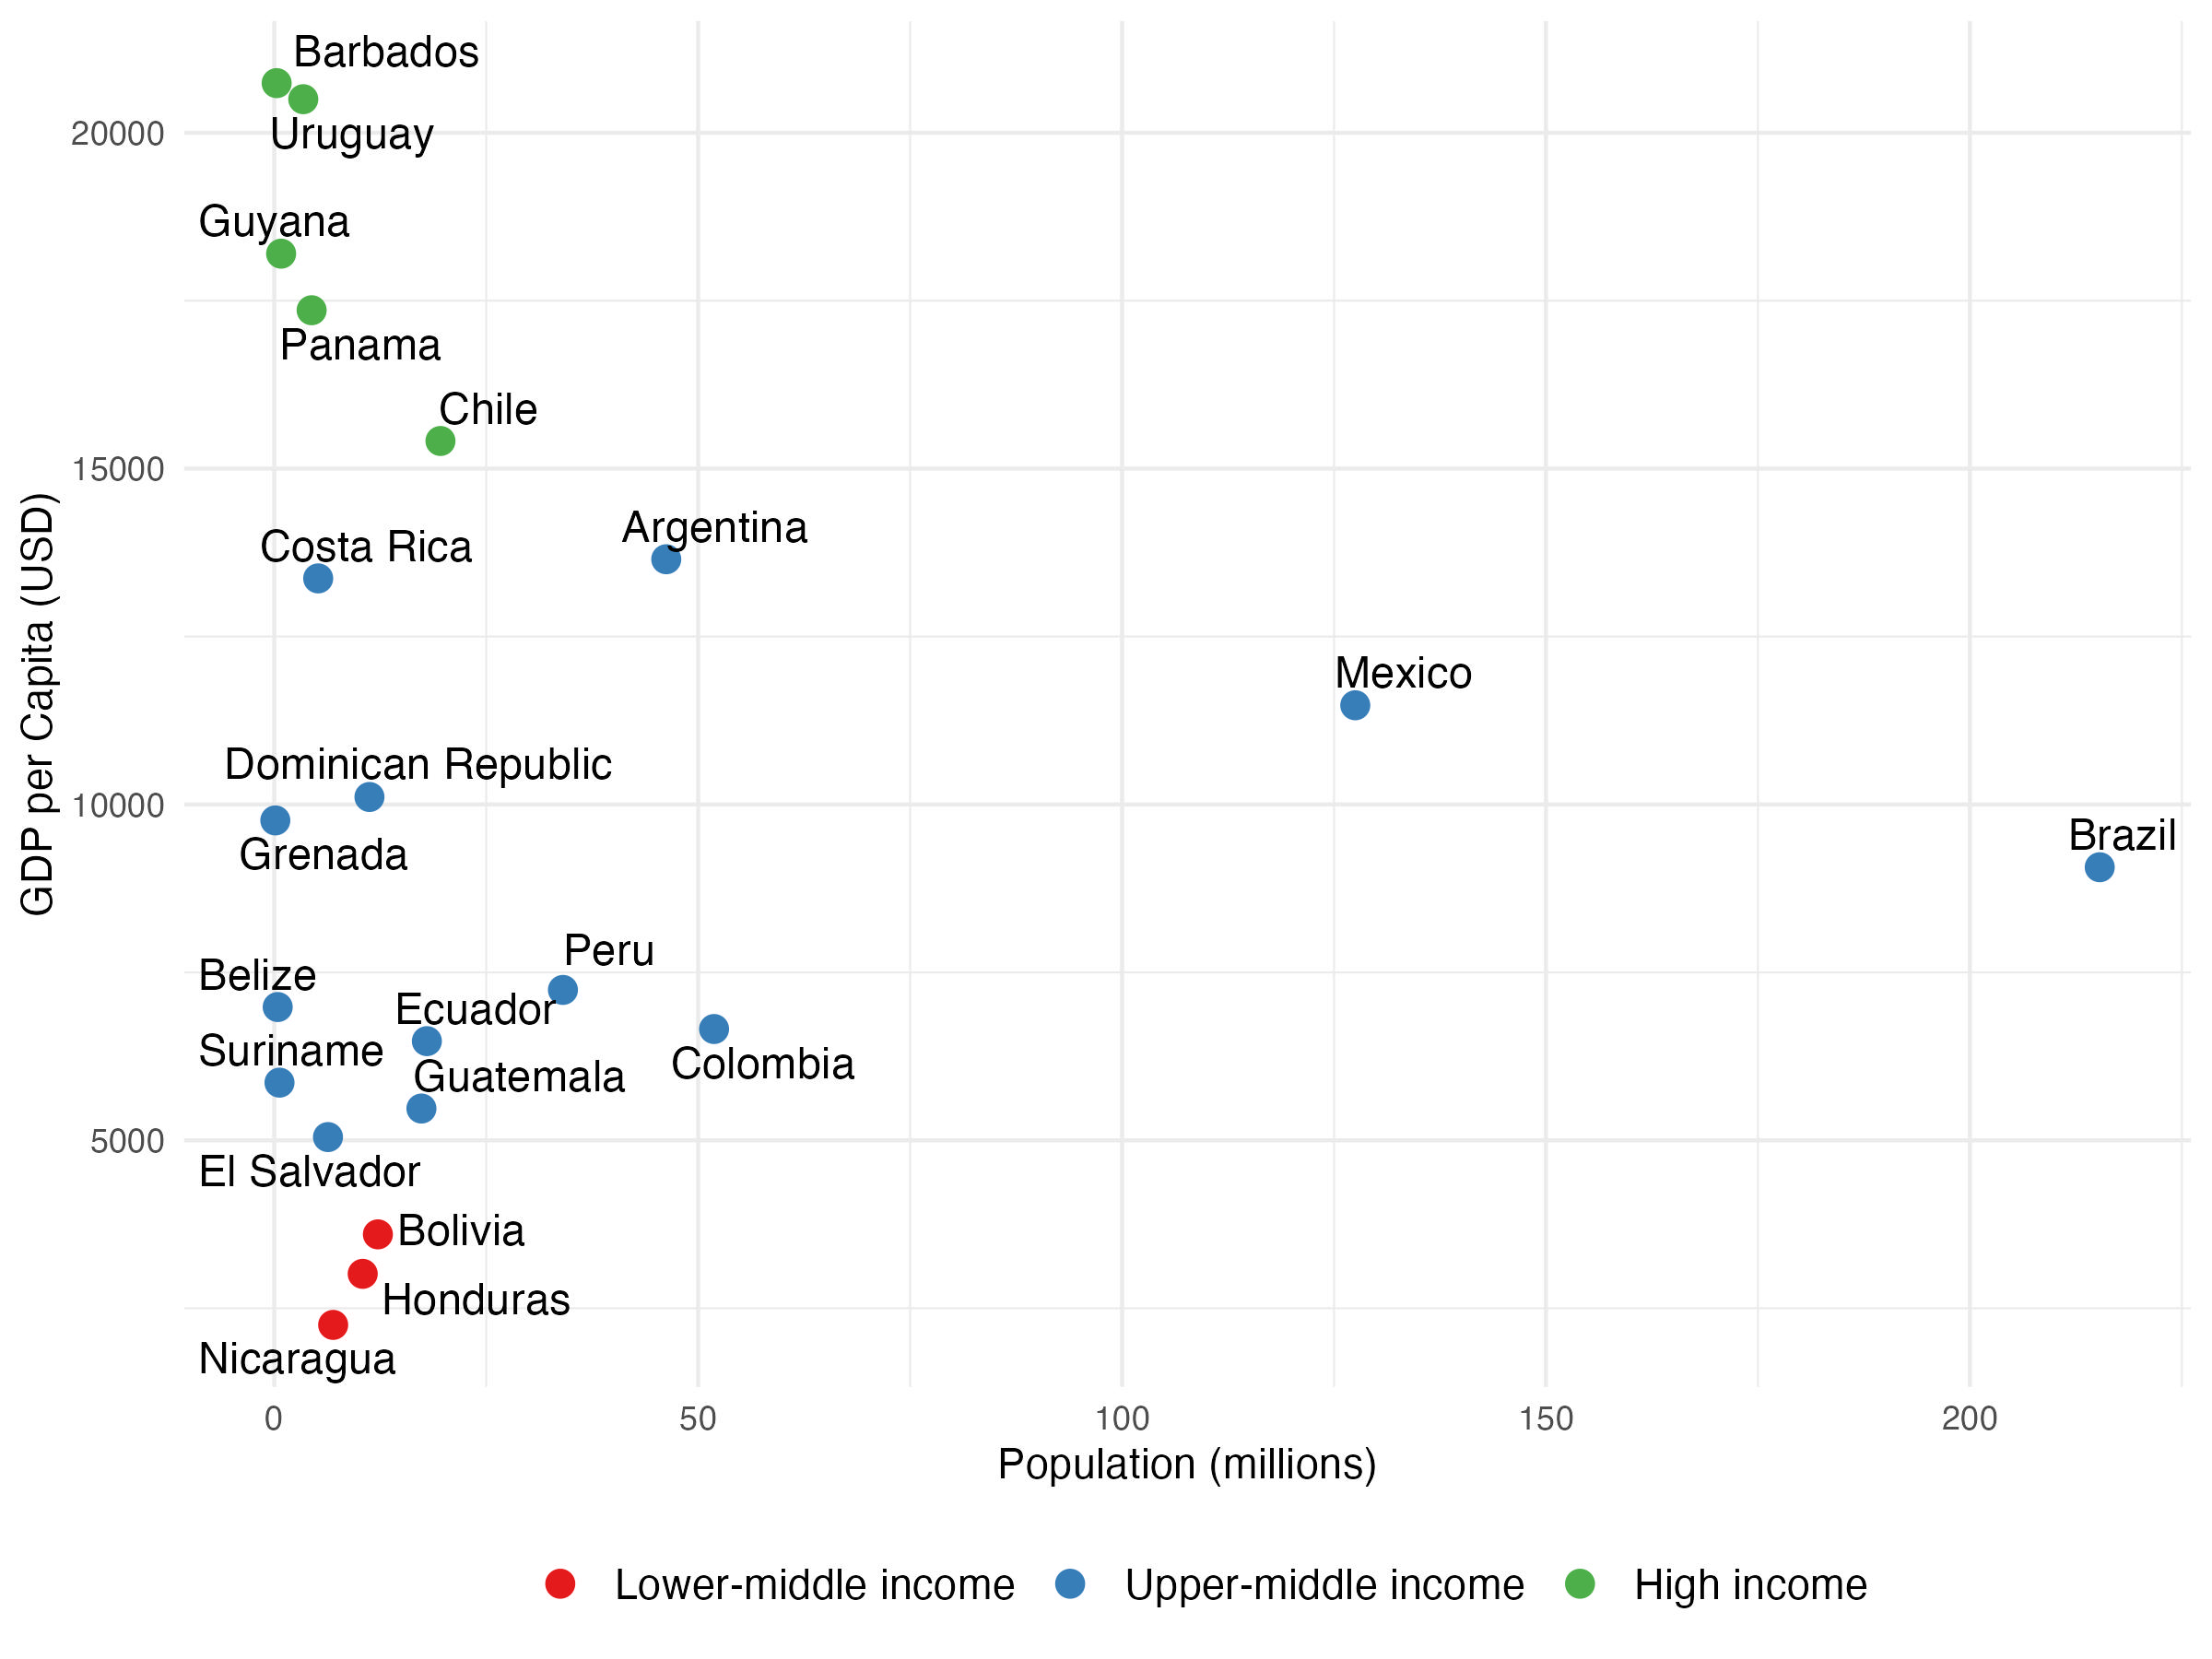
The definition of the region of Latin America and the Caribbean (LAC) can have a varying scope across different institutions. In the case of our study, we rely on a heuristic approach of including the maximum number of countries for which we can find data of sufficient quality in the databases of the WB, ILO and any other relevant sources. The final sample includes 22 countries, shown in Figure 1 according to their income-based grouping used by the WB in 2022, and total population. The region is very heterogeneous, from very small islands in the Caribbean with fewer than half a million inhabitants, to countries with large populations such as Brazil and Mexico. Accordingly, it ranges from high-income countries such as Uruguay and Panama to lower-income countries such as Nicaragua and Honduras.
Figure 1. GDP per capita, population and income status of LAC countries in the sample
While there is a large body of literature analysing the impacts of technological change on the labour market outcomes of LAC (for example, see Dutz et al. 2018), the expected incidence of GenAI is likely to be different from that of previous technological breakthroughs. Autor (2024) claims that the transformational impact of new technologies on labour is through the reshaping of human expertise, and he illustrates this hypothesis with two examples: the adoption of mass production in the 18th and 19th centuries, and the adoption of digital technologies since the 1960s. The emergence of mass production changed the complex work of artisans into self-contained and simple tasks carried out by production workers, using new machinery, and overseen by others with higher levels of education. The increased demand for this “mass expertise” was accompanied by an increasing number of high-school graduates, leading to the rise of a new middle class. Later, digital technologies allowed to carry out routine tasks by encoding them in deterministic rules. Non-routine tasks could not be replaced by this technology because they are not attained by learning rules, but through learning by doing. As a result, digital technologies gave rise to a new form of expertise by allowing professionals to obtain and process information more efficiently, and thereby having more time to interpret and apply it. The routine jobs replaced by this technology tended to be in the middle of the earnings distribution, while the non-routine jobs complemented by digitalization tended to be at the top, leading to a polarization of the labour market. AI, in contrast, can perform non-routine tasks that often require tacit knowledge. For example, it can allow non-elite workers (such as nurses) to engage in complex decision-making, and it can automate some of the tasks carried out by high-skill workers such as doctors, software engineers and lawyers. However, as described below, the final impacts on jobs will depend on other factors as well. For example, the direct automation impacts of GenAI on jobs may be offset by positive impacts on productivity, which would strengthen labour demand.
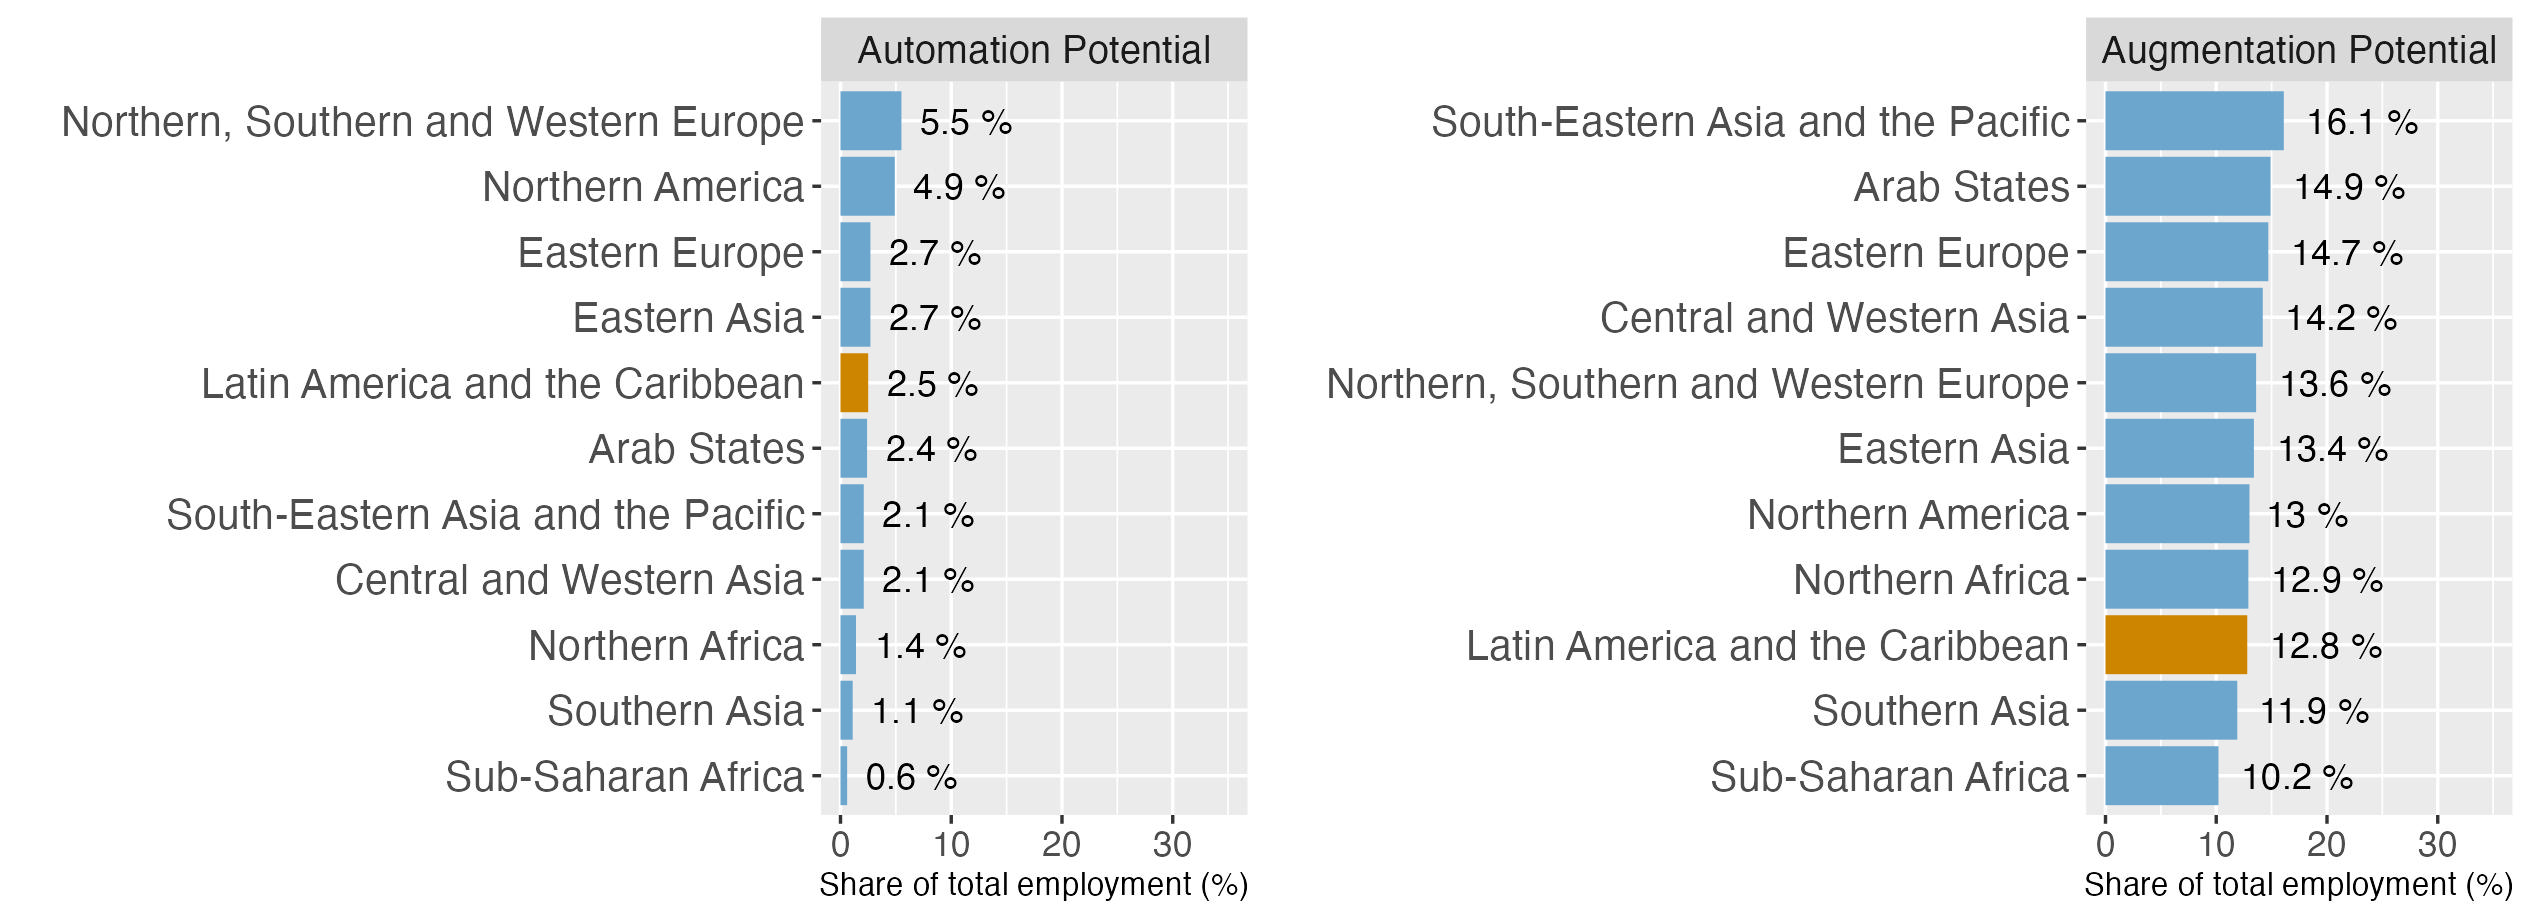
While no previous granular assessments of occupational exposure to GenAI exist for the LAC region, there have been comparisons to other regions made in broader studies. For example,
Figure 2. Automation and augmentation potential: LAC vs other regions
In theory, the rise of GenAI and its potential positive impacts on labour productivity could pose a significant opportunity for developing countries. Some recent private sector studies even suggest that aggregate impact of widespread AI adoption could add between 0.1 and 1.5pp of annual productivity growth in HICs, with slightly lower figures estimated for Emerging Markets (EM)
Could GenAI help unlock this productivity impasse? Recent empirical studies focused on the use of GenAI in particular occupational settings suggest that the positive impacts on productivity can be large. For example,
While the results of this literature suggest a promising role for GenAI to boost productivity, in the context of LAC and emerging economies more broadly, there are important reasons to be cautious.
First, there are good chances that such initial macroeconomic projections are too optimistic and based on oversimplified models. As shown by
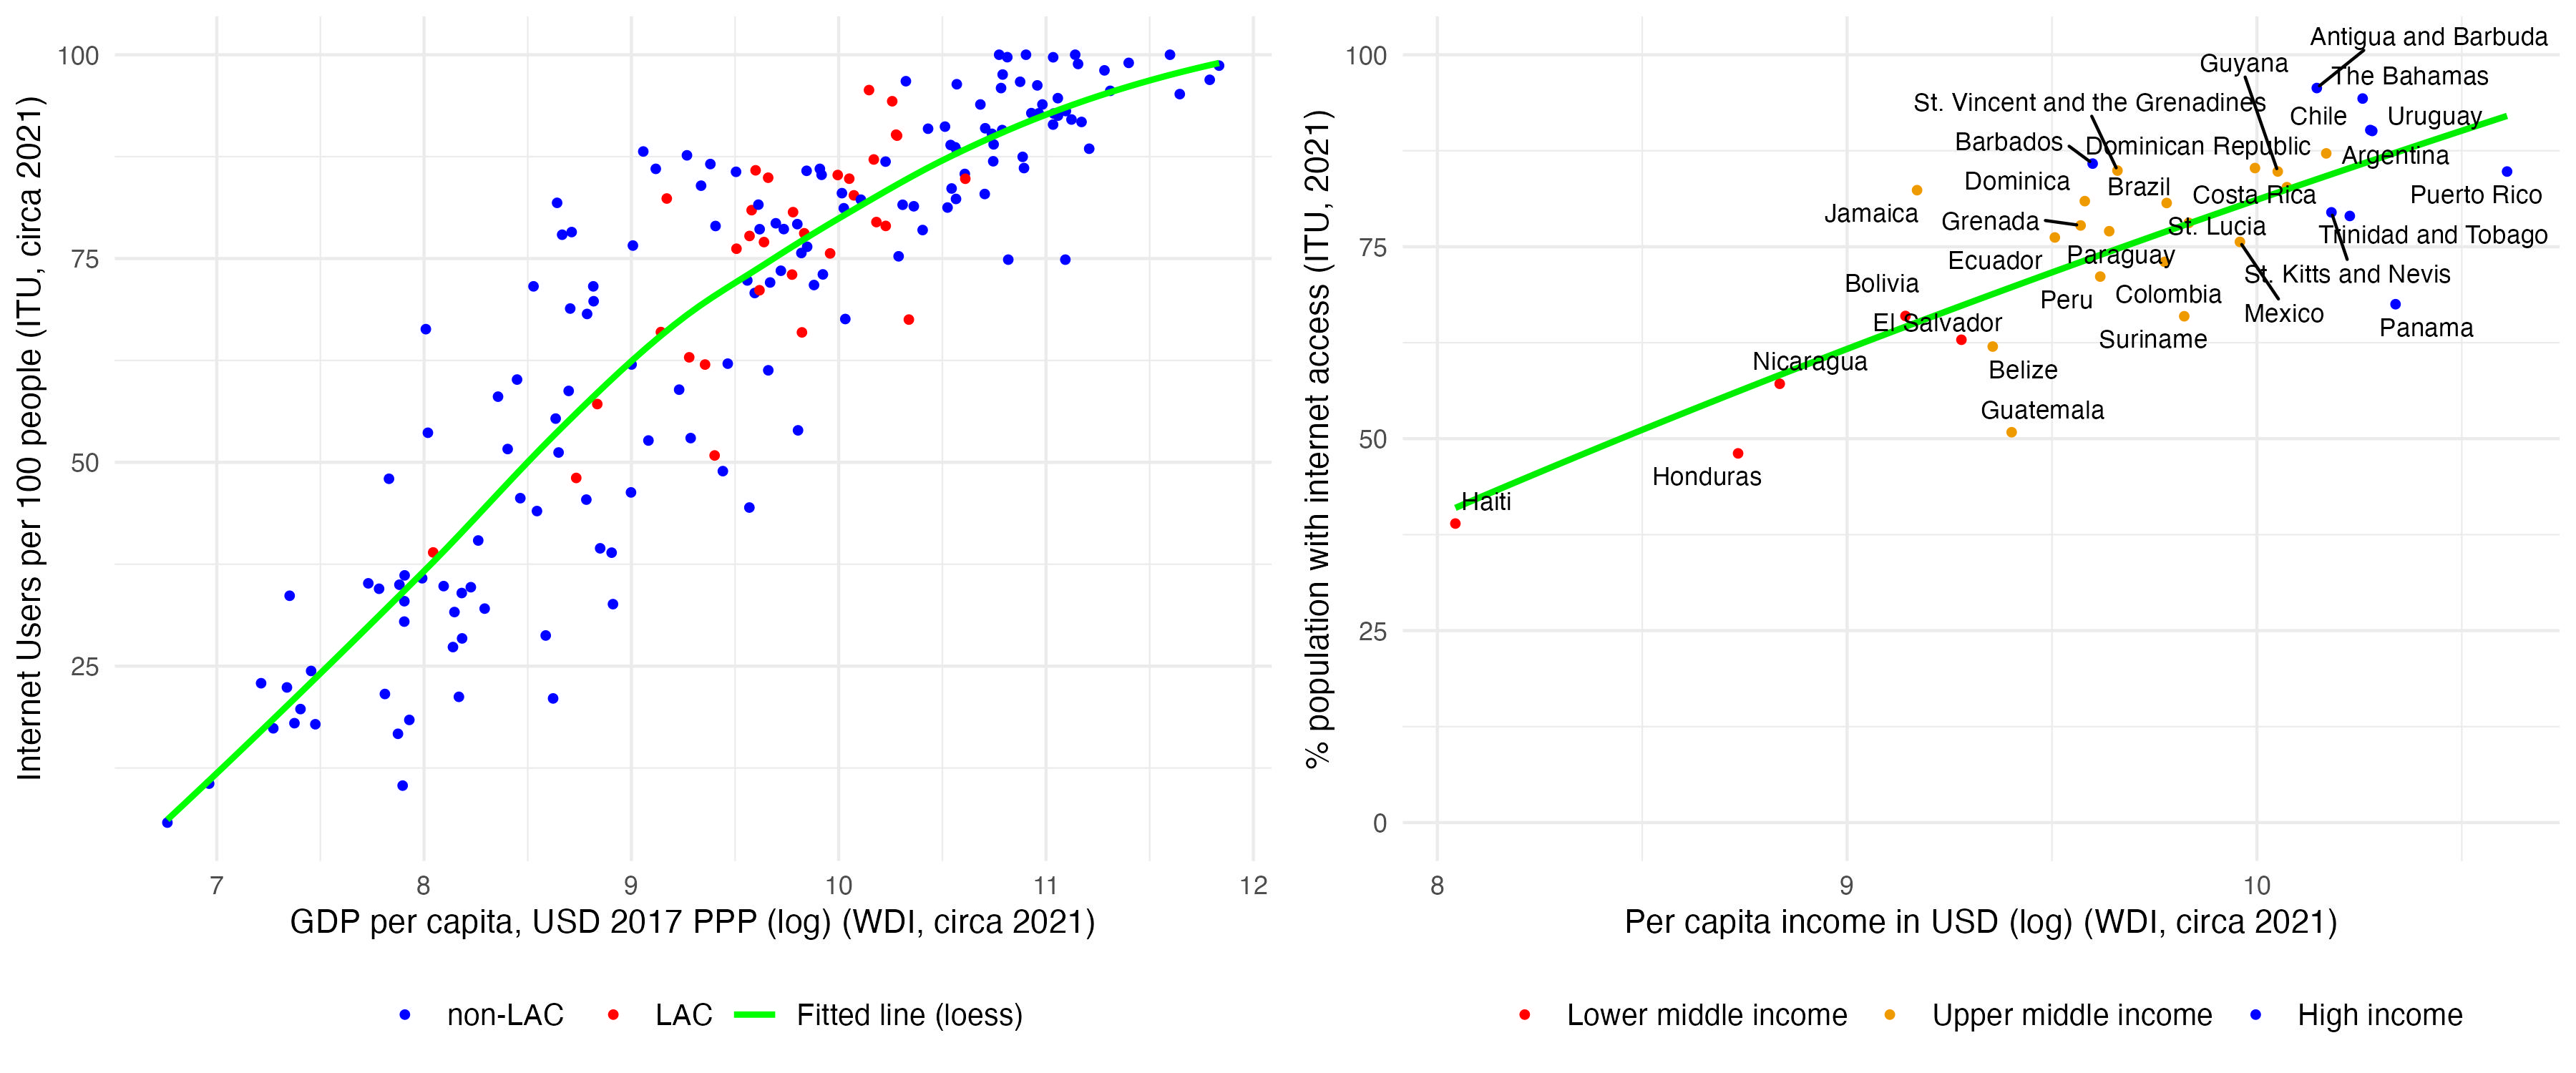
Second, the rate of adoption and exposure to GenAI is likely to be slower in developing countries where fewer workers are using digital technologies than in their richer counterparts. More specifically, two individuals with the same occupation could have very different levels of GenAI exposure if one of them uses a computer or internet at work, while the other one does not. As shown in Figure 3, internet access in LAC countries varies from anywhere below 50 percent to over 90 percent of the population, with the digital divide clearly correlated with income-based differentials among countries. One of the main objectives of our paper is to quantify the limiting effects of such digital gaps in the LAC region, which also provides a proxy for the challenges that regions with even lower levels of income and digital infrastructure are likely to face. The underlying assumption of our approach is that having access to a computer and internet at work is a minimum requirement for drawing productivity benefits from GenAI tools. Consequently, workers without such digital basics will simply be excluded from any form of productivity gains that GenAI could offer in the professional context.
Figure 3. Internet coverage vs per capita income: global and LAC
Third, beyond the hard infrastructure, software costs are likely to impact the economic viability of adoption in developing countries. Basic licensing of such products as ChatGPT or MS Co-pilot can range around 20-30 USD per user per month, which can be significant, especially if applied to a range of workers in one company. Costs of enterprise-level solutions, either based on simple API integration or more complex proprietary AI-systems can be significantly higher. In countries with high informality, including those of the LAC region, such costs are prohibitive for many small enterprises, which exist outside the reach of any public support schemes of rapid technological adoption. In the high-income context of the US,
Fourth, workers need a minimum level of foundational skills to fully reap the benefits of this technology
Fifth, the results of these recent experiments and macroeconomic models do not consider general equilibrium or second order effects on employment. For example, while increased productivity may bring employment and wage gains in sectors facing a consumer demand that is growing rapidly, that may not be the case for sectors facing a more stable consumer demand
Historically, together with Sub-Saharan Africa, LAC is one of the most unequal regions in the world
To further theorize the potential effects of GenAI diffusion on inequality in the region, Figure 4 presents the most recent breakdown of LAC occupations by the highest, 1-digit level of ISCO-08,7 revealing visible differences in the employment structures across genders.
Figure 4. Occupations in the LAC region, by ISCO 1-digit and gender
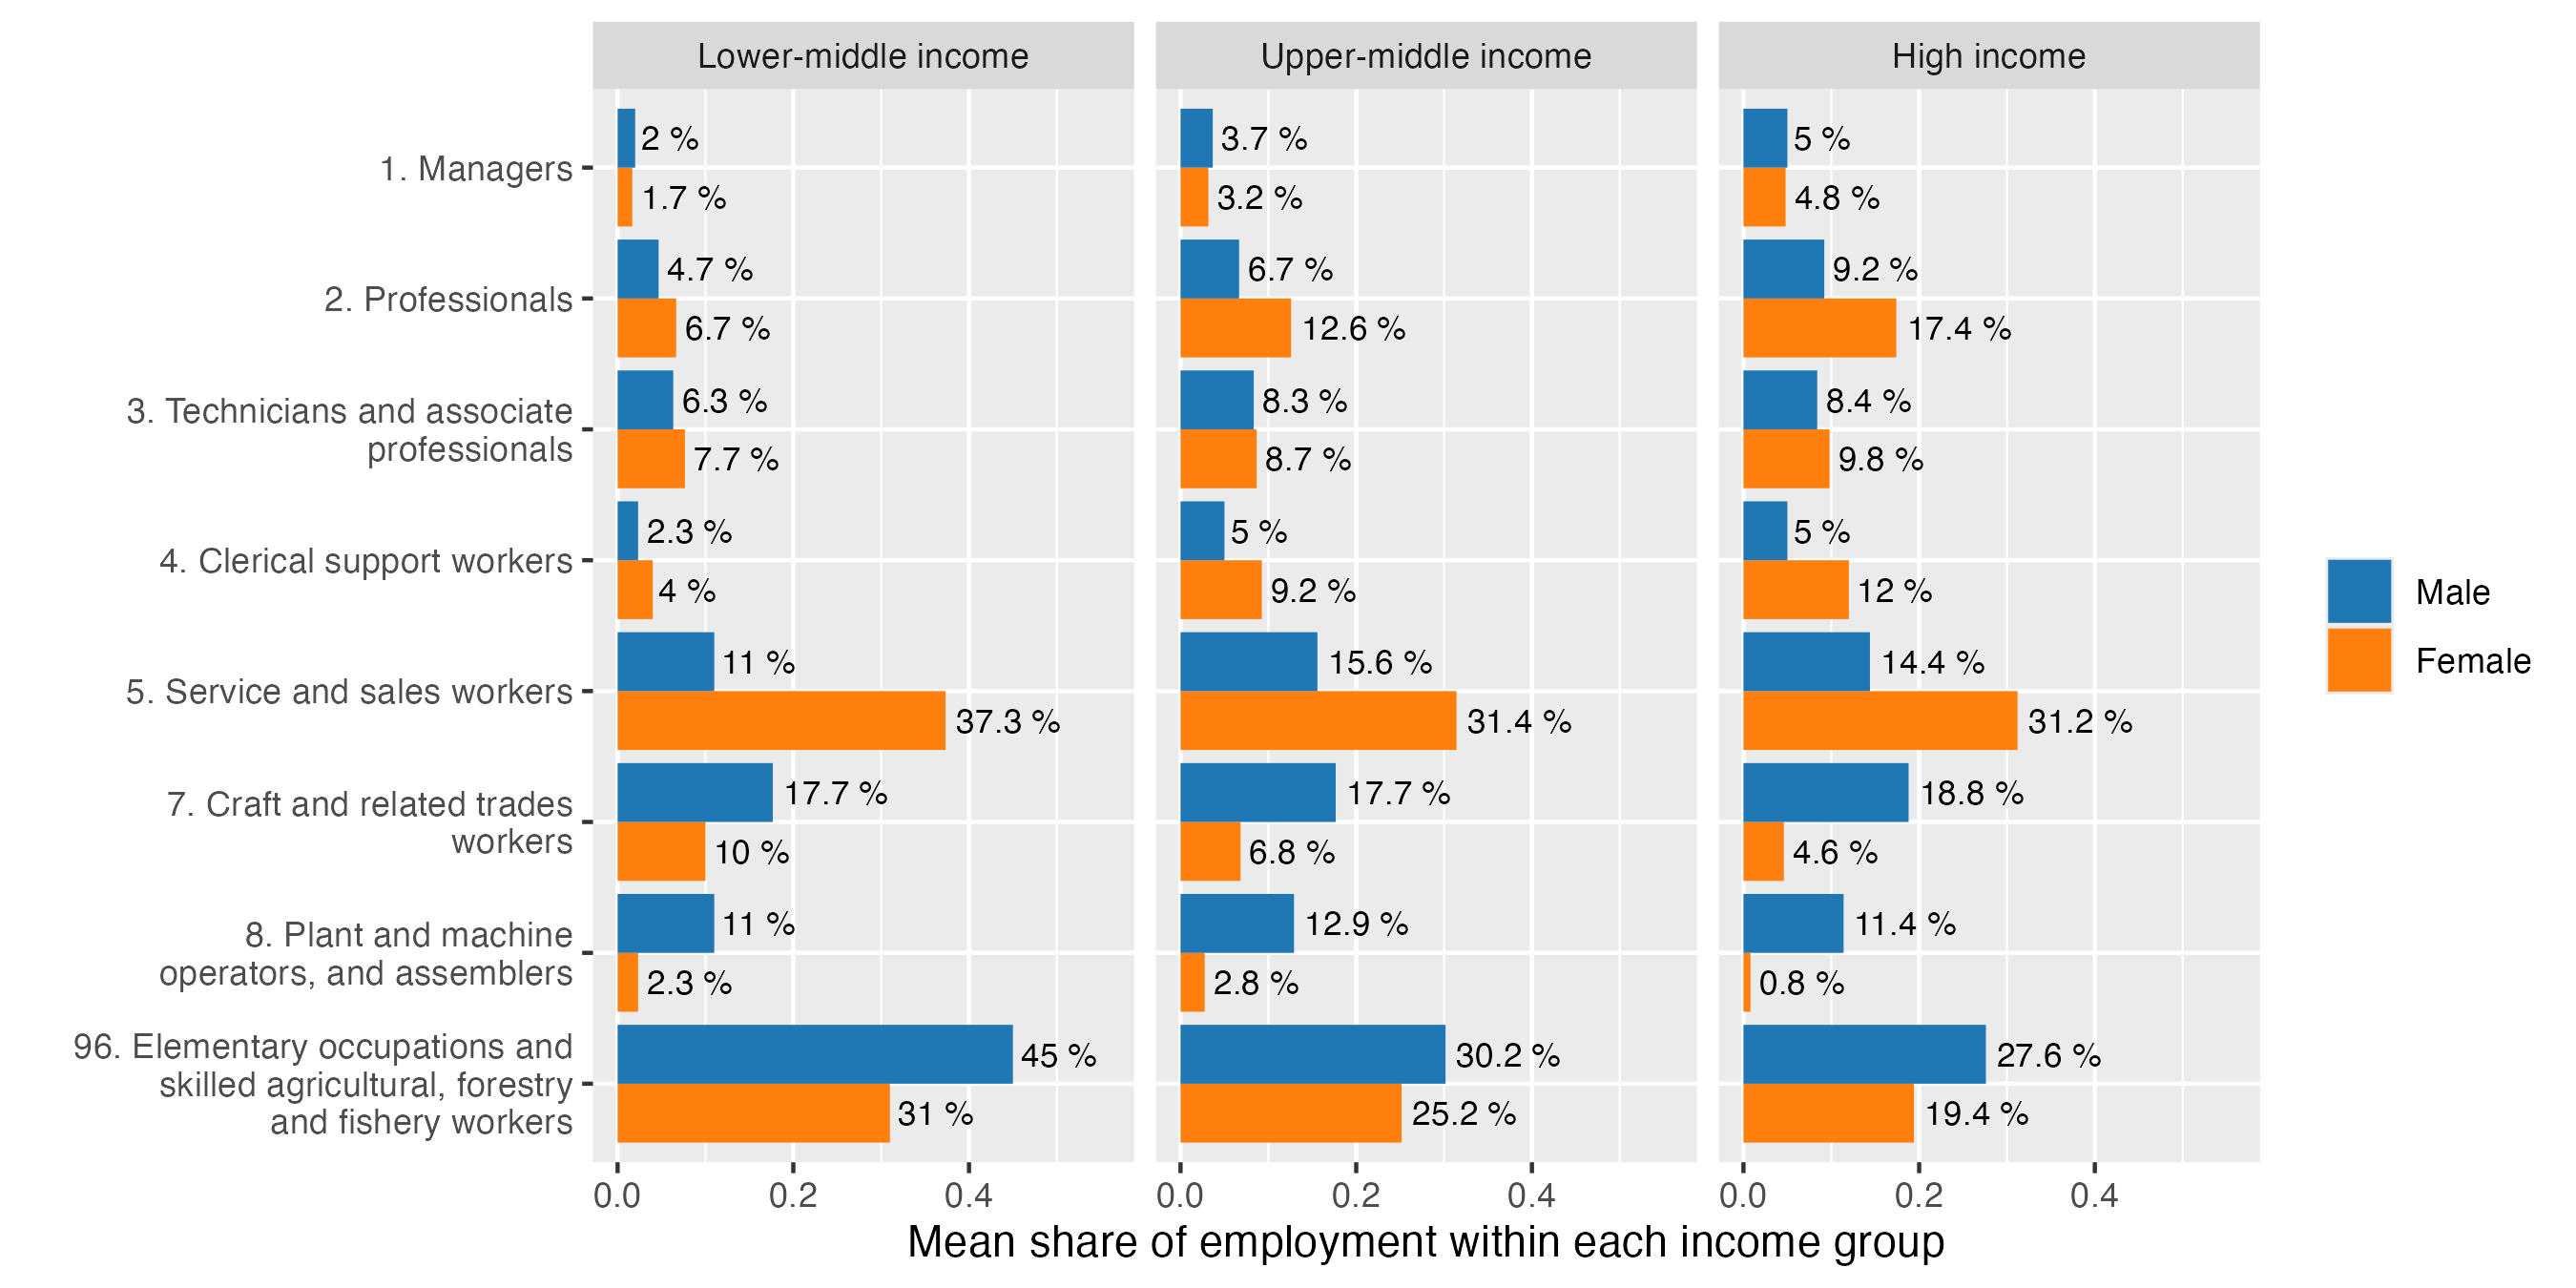
Note: The breakdowns are presented as a share of male and female employment separately and calculated as a mean share of employment across the countries in each income bracket, based on ILO modelled estimates
For men, the largest share of employment is in the elementary, agricultural, forestry and fishery work, followed by craft and related trade workers. For women, the largest employment categories concern service and sales work, followed by elementary jobs. Among the “Service and sales workers”, the pattern is very similar across country groups, with male employment dominant only in protective services, and female employment having much higher shares in personal care, sales and personal service work. A more detailed analysis at ISCO-08 2-digit level8 reveals that – excluding IT, science and engineering professions – women are significantly more represented across all professional categories, with particular prominence in teaching, health, business administration and legal, social and cultural occupations. This trend extends into clerical work and amplifies in line with countries’ income status. This warrants attention, since recent research has identified clerical and professional job categories as being more exposed to the risks of automation with GenAI
In accordance with the technical documentation of ISCO-08, such differences in the occupational structures also correspond to varying levels of skills and educational attainment, as clerical support workers, technicians and professionals are typically classified in the mid- to high-skill level brackets
Finally, we acknowledge that the final outcomes of the technological transition process will also be largely dependent on the existing and future policy frameworks in the region. While the analysis of country-level polices and legal frameworks is beyond the scope of this regional study, the detailed country-level statistics that we make publicly available alongside this publication can serve as useful inputs to the discussions underpinning such policy responses.9
Methods
Occupational exposure to GenAI
We combine multiple datasets to estimate occupational exposure to AI, leveraging the distinct advantages inherent in each dataset to ensure a comprehensive analysis.
We use the AI exposure scores at the 4-digit ISCO-08 level from AI scores from GBB (2023) as the principal indicator of occupational exposure to GenAI. We also consider alternative scores that could be used for this purpose, in particular the ability-based scores developed by
This choice is further reinforced by the arguments recently advanced by
In step 1, we tag occupations at 4-digit level in ISCO-08 into three categories established by GBB: “automation potential”, “augmentation potential” and “the big unknown”. We then rely on the ILO harmonized microdata collection11 to obtain the shares of employment at 4-digit level occupations for 18 countries for each of these three AI exposure categories (Figure 7). We also calculate the shares that such exposed occupations make up in the higher, 2-digit level of occupational classification. From this step, we switch to the harmonized household surveys from the Socio-Economic Database for Latin America and the Caribbean (SEDLAC) to calculate AI exposure across and within 16 Latin American countries.12 Our sample of SEDLAC data consists of about 900,000 individual survey observations, with details by country provided in the Appendix (Table A1).
Box 1. GBB Scores of occupational exposure to GenAI (Gmyrek et al., 2023)
GBB scores were developed based on the technical documentation of ISCO-08, which contains a list of typical tasks for each of the 436 detailed occupational groups at the most detailed, 4-digit level, and which forms the basis on which national statistical labour survey reports are linked to the internationally comparably ISCO-08 standard at the ILO. GBB build on the findings of Eloundou et al. (2023), who demonstrate a close alignment of GPT-4 predictions with a survey of 70 AI experts on the potential of automating occupational tasks with LLMs, and more broadly on Bubeck et al. (2023), who provide extensive tests of the model’s capabilities and demonstrate its capacity for elaborating logical links between items, resolving complex tasks and providing justifications for its decisions. Using the Application Programming Interface (API) of GPT-4, the authors designed a sequential call that loops over each of 3,123 tasks in that documentation and requested the model to assess the technical feasibility of performing a given task with GPT-4 or LLM technology of similar capabilities. The model is asked to rate tasks on a scale of 0 to 1, with 1 representing the possibility of performing a given task by the LLM in full autonomy form a human operator, and to elaborate a written justification of each score (no task received a score of 1). The scores and justifications are then reviewed for consistency and stability of predictions over time, with the written justifications reviewed by humans. Tasks with scores above 0.8 (high possibility of automation) are transformed into embeddings, with a semantic clustering algorithm applied to identify the major groups of such tasks, which are subsequently reviewed by humans.
Task-level scores for each occupation are used to calculate the mean score and the standard deviation (SD) for each occupation. These two moments of distribution are subsequently used to elaborate a theoretical framework for further classification of scores. Occupations (i) with a high mean (µi > 0.6) and a high difference between the mean and SD (µi - σi > 0.5) are classified as jobs with a high automation potential. Occupations with a low mean score (µi < 0.4) and a high sum of the mean and SD (µi + σi > 0.6) are considered to have a high potential for augmentation, meaning that while some of their tasks could be automated, the human role remains crucial for the majority of their tasks. Occupations between these two categories are classified as “the big unknown”, since, depending on the progress of technology and the use of adjacent technological applications (e.g. LLM-based agents), they could fall closer to automation or augmentation. Remaining occupations are classified as not affected, with the understanding that GenAI in its current form would have minimal or no impact on their tasks. The scores and individual task distributions are visualized by the authors through a publicly available interactive app:
https://pgmyrek.shinyapps.io/AI_Data_Portal_Research/ .
While GBB calculate separate scores for high- and low-income countries, the results are very similar and thereby only the high-income ones are used for all countries regardless of their income levels. See Appendix for a comparison of GBB scores to Felten et al. (2023) and Prytkova et al. (2024). See Gmyrek et al. (2023) for a detailed description of the score generating process.
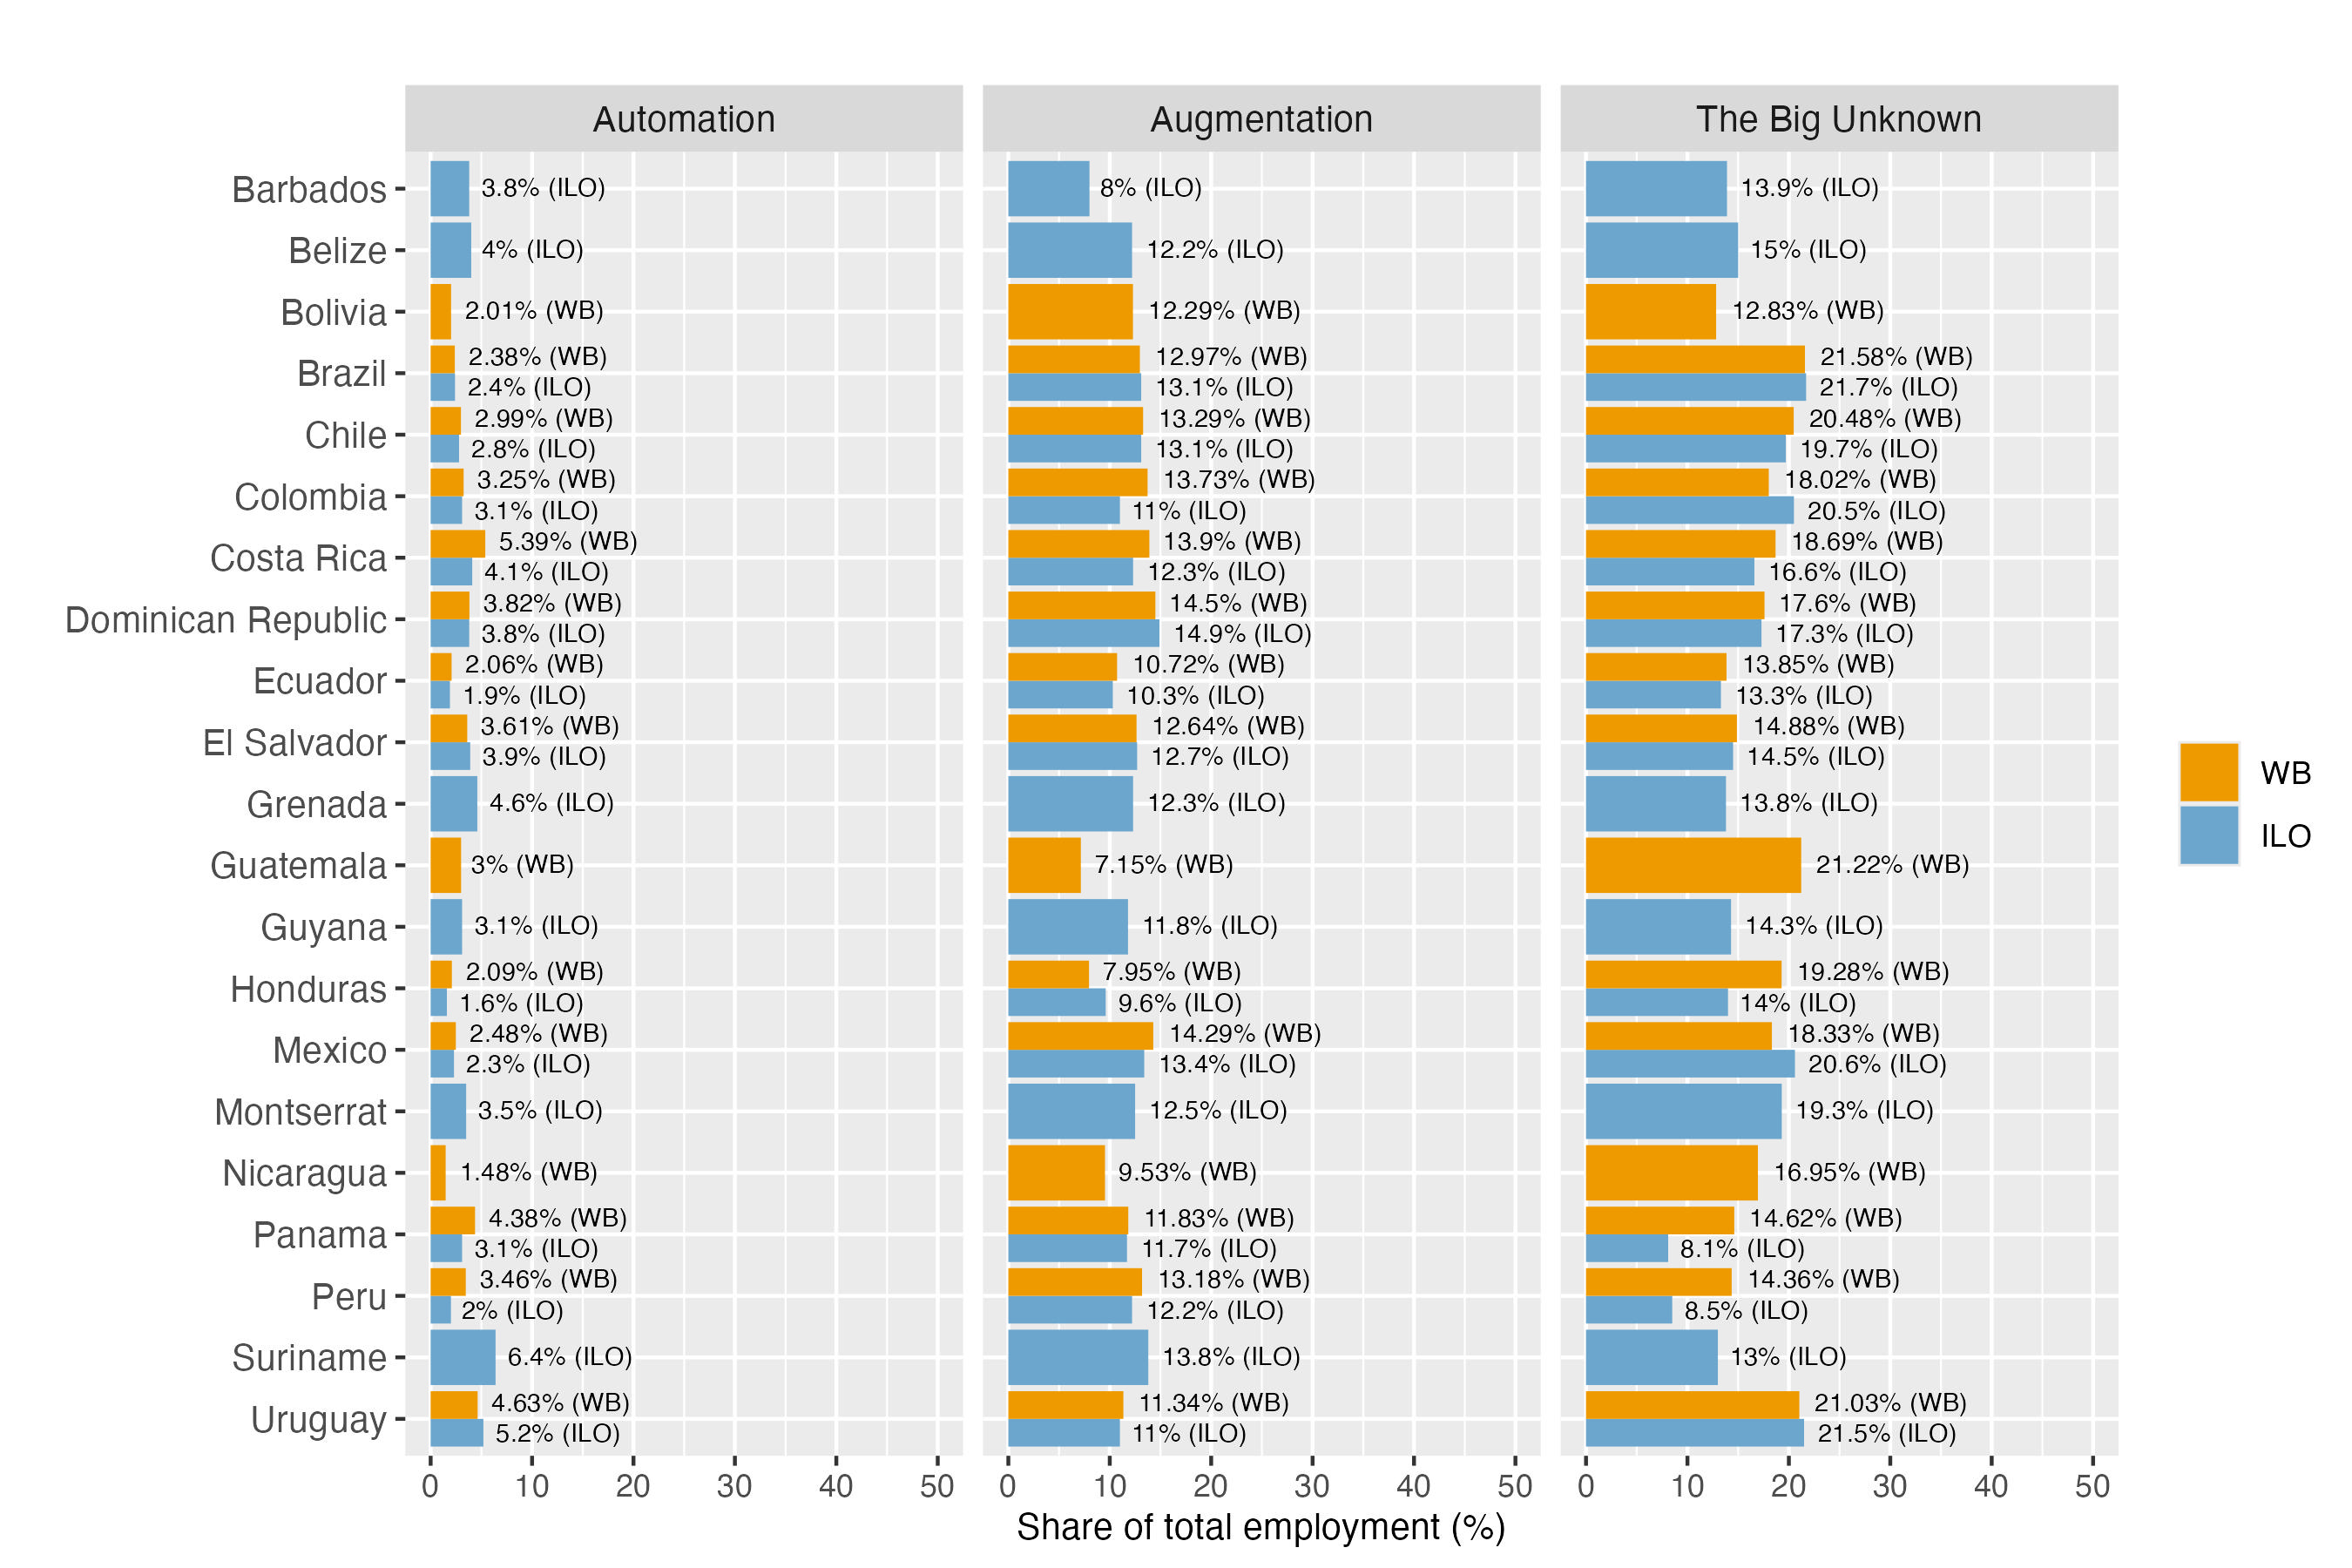
The advantage of SEDLAC database is that it contains a host of harmonized variables at the individual level, including the income aggregates used to measure poverty, as well as demographic characteristics and labour market outcomes. In step 2, we impute the AI exposure scores from GBB to individual respondent data in SEDLAC, using the ISCO-08 occupation reported in the household survey. Such imputation is straightforward for the 8 countries with 4-digit ISCO-08 occupations in SEDLAC, and for which we can directly compare the calculations to the estimates from the ILO as an additional validation measure (Figure 5). In contrast, there are 8 countries in SEDLAC with 2-digit ISCO-08 scores where the imputation is less obvious and depends on other circumstances. We have two types of such cases.
Figure 5. Coverage of ISCO-08 4-digit microdata in SEDLAC (WB) and ILO harmonized microdata collection
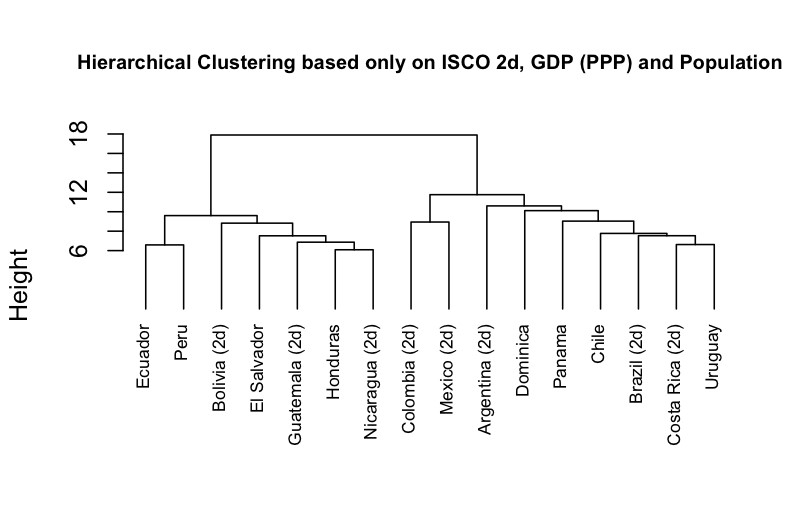
When we have the 4-digit ISCO-08 employment structure from ILO for the same country, we use the estimates of the shares of exposure at the 2-digit level calculated in step 2 above.13 When we do not have the 4-digit employment structure from a different source for the same country, we use that of a “similar” country.14 These country similarities are defined in step 3, by applying a hierarchical clustering algorithm to several country-level characteristics including the full breakdown of 2-digit ISCO-08 employment shares, GDP per capita (PPP) and total population (Figure 6).
Figure 6. Hierarchical clustering based on ISCO 2-digit shares, GDP(PPP) and total population
In step 4, we impute the estimated shares of automation, augmentation and the big unknown to individual responses at the 2-digit ISCO-08 occupation level in SEDLAC. Having a data frame with 2-digit level shares enables aggregation of individual responses by main categories of interest captured in SEDLAC microdata. We focus on gender (male, female), area (rural, urban), age (15-14, 25-34, 35-44, 45-54, 55-64), education (low, medium, high), poverty status (non-poor, poor), income quintiles (Q1 through Q5), formality (legal, productive), labour relationships (employer, salaried employee, self-employed, family worker without salary) and sector of economic activity. The shares of exposure are calculated in such a way that automation, augmentation, big unknown and other occupations add to 100 percent within each category. This means that we can interpret such results as a share of employment in each type of AI exposure within each grouping category (for example, shares of automation, augmentation, big unknown and other occupations among people with low education or among those belonging to the age bracket of 35-44). Table 1 describes these variables in more detail.
Table 1. Distribution of AI Exposure by Demographic and Socioeconomic Categories in SEDLAC Data15
|
Variable name |
Description |
|---|---|
|
Education |
Low: fewer than 9 years of education Middle: 9 to 13 years of education High: 14 or more years of education |
|
Poverty |
An individual is considered poor (non-poor) if they live in a household whose income per capita is below (above) the poverty line for upper middle-income countries (US$ 6.85-a-day in purchasing power parity terms) |
|
Income quintiles |
Q1 through Q5, by whether the individual’s household income per capita is in said quintile. |
|
Formality (legal) |
A salaried worker is informal if they do not have the right to a pension linked to employment when retired |
|
Formality (productive) |
An individual is considered an informal worker if they belong to any of the following categories: (i) unskilled self-employed, (ii) salaried worker in a small private firm, (iii) zero-income worker. Unskilled workers are all individuals without a tertiary or superior education degree. Small firms are those with 5 or fewer employees. These criteria and definitions refer to individuals’ main job. |
|
Sector of economic activity |
Primary sector Low-tech manufacturing (food, beverages, tobacco, textiles and clothing) Other manufacturing Construction Retail, restaurants, hotels and repairs Utilities, transport and communications Banking, finance, insurance, professional services Public administration Education, health and personals services Domestic service |
Use of a computer at work
The method applied so far enables detailed insights into country-level data on exposure of occupations to GenAI, with further breakdowns by demographic and socioeconomic characteristics of the affected groups (Table 1). At the same time, the variation in AI exposure across and within countries is only driven by the variation in the occupational structures, because the same occupation in different countries uses the same score of GenAI exposure. To address this limitation, in the next step we introduce cross-country variation of occupation-level scores, by accounting for the variability in the use of computer equipment in the same
We first proceed by imputing the GenAI exposure measures at the 4-digit ISCO08 to the microdata from the Programme for the International Assessment of Adult Competencies (PIAAC) collected by the OECD. These surveys include rich information on detailed tasks carried out by people at work, such as whether workers use a computer (and internet)16 at work. Using this binary indicator, we split each group of GenAI exposure into those who use a computer at work, and those who do not. Not using a computer at work means that even if the worker is in an occupation that is exposed to GenAI augmentation, such potential productivity gains are unlikely to realize given the lack of access to digital infrastructure. We first implement this exercise for the four countries in the LAC region (Chile, Ecuador, Mexico and Peru) and two developed economies (Slovenia and New Zealand) included in the PIAAC dataset.17
Since there are only four Latin American countries in PIAAC, we extrapolate the measures of computer use at work from PIAAC to the full set of countries in the SEDLAC database. In particular, we estimate a predictive model for the probability of computer use at the individual level using the full set of countries in PIAAC18 and independent variables that are available both in the PIAAC and SEDLAC databases.19 We then use the estimated model and the set of independent variables to predict the probability of computer use in the SEDLAC database. More specifically, we first estimate the following Logit model in PIAAC:
(1)
Where is a binary variable equal to 1 if individual in country uses a computer at work; is a vector of 39 dummy variables for each 2-digit ISCO08 occupation20; is a vector of 4 dummy variables indicating age groups; is a dummy variable equal to one for High School graduates; is the log of GDP per capita in 2017 US$ PPP; is the rate of internet users per 100 people, and; is the number of fixed broadband subscriptions per 100 people. Since the reference year of the PIAAC surveys varies by country, we use the corresponding year of the country-level variables (i.e. GDP, internet and broadband). These country-level variables are helpful to capture the link between the economy-wide level of digital and economic development with the level of computer use at work.
In the next step, we use the estimated equation (1) to predict the probability of using a computer at work at the individual level in the SEDLAC database.21 The probability of not using a computer at work is simply 1-Pr(computer=1). When choosing the reference years of the country-level variables of the model, we use the reference year of the SEDLAC surveys. Then, the probability of an individual being exposed to AI and of using a computer at work will be the multiplication of both individual probabilities. For example, take the case of a group of workers (e.g. workers with high education) that, on average, has a 0.23 GenAI augmentation exposure probability (i.e. the average of the binary exposure measure at the 4-digit level). Then let’s assume that, based on the individual predictions from the Logit model, on average, individuals in such group have a 0.7 (0.3) likelihood of using (not using) a computer at work. As a result, we conclude that workers in such group have a 0.161 (=0.7 x 0.23) probability of being exposed to GenAI augmentation and of using a computer at work, while they have a 0.069 (0.3 x 0.23) probability of being exposed to GenAI augmentation and of not using a computer at work.22
In the final step, we calculate measures of AI exposure across the same socio-demographic characteristics as summarized in Table 1, this time with a simultaneous breakdown by computer use at the workplace for each of these characteristics.
Findings
Cross-country comparisons of the levels of exposure
Since we apply the same conceptual framework of exposure as proposed by GBB (automation, augmentation and “the big unknown”) we can calculate the total share of employment exposed to GenAI by adding those three categories in each country. Figure 7 presents the ranking of individual countries, with total exposure ranging between 26-27 percent in Barbados, Ecuador and Bolivia, up to 37-38 percent in Uruguay and Costa Rica respectively.23
We strongly emphasize that this way of presenting results should not be equated with a statement that “up to 40 percent of employment in LAC is exposed to automation”. Quite to the contrary, among these fairly large shares of potential exposure, only a small portion of occupations – between 2 to 5 percent, depending on country context – falls into the potential of full automation. Augmentation figures are consistently higher, ranging between 8 and 14 percent across countries. In addition, the category of the big unknown is rather large, suggesting that in the medium-term, these estimated shares could change quite significantly, as occupations from the big unknown might move into the automation and augmentation categories, depending on whether the technology is applied in a more task-automating manner, or whether it generates new complementary tasks
Figure 7. Total exposure to GenAI by country25
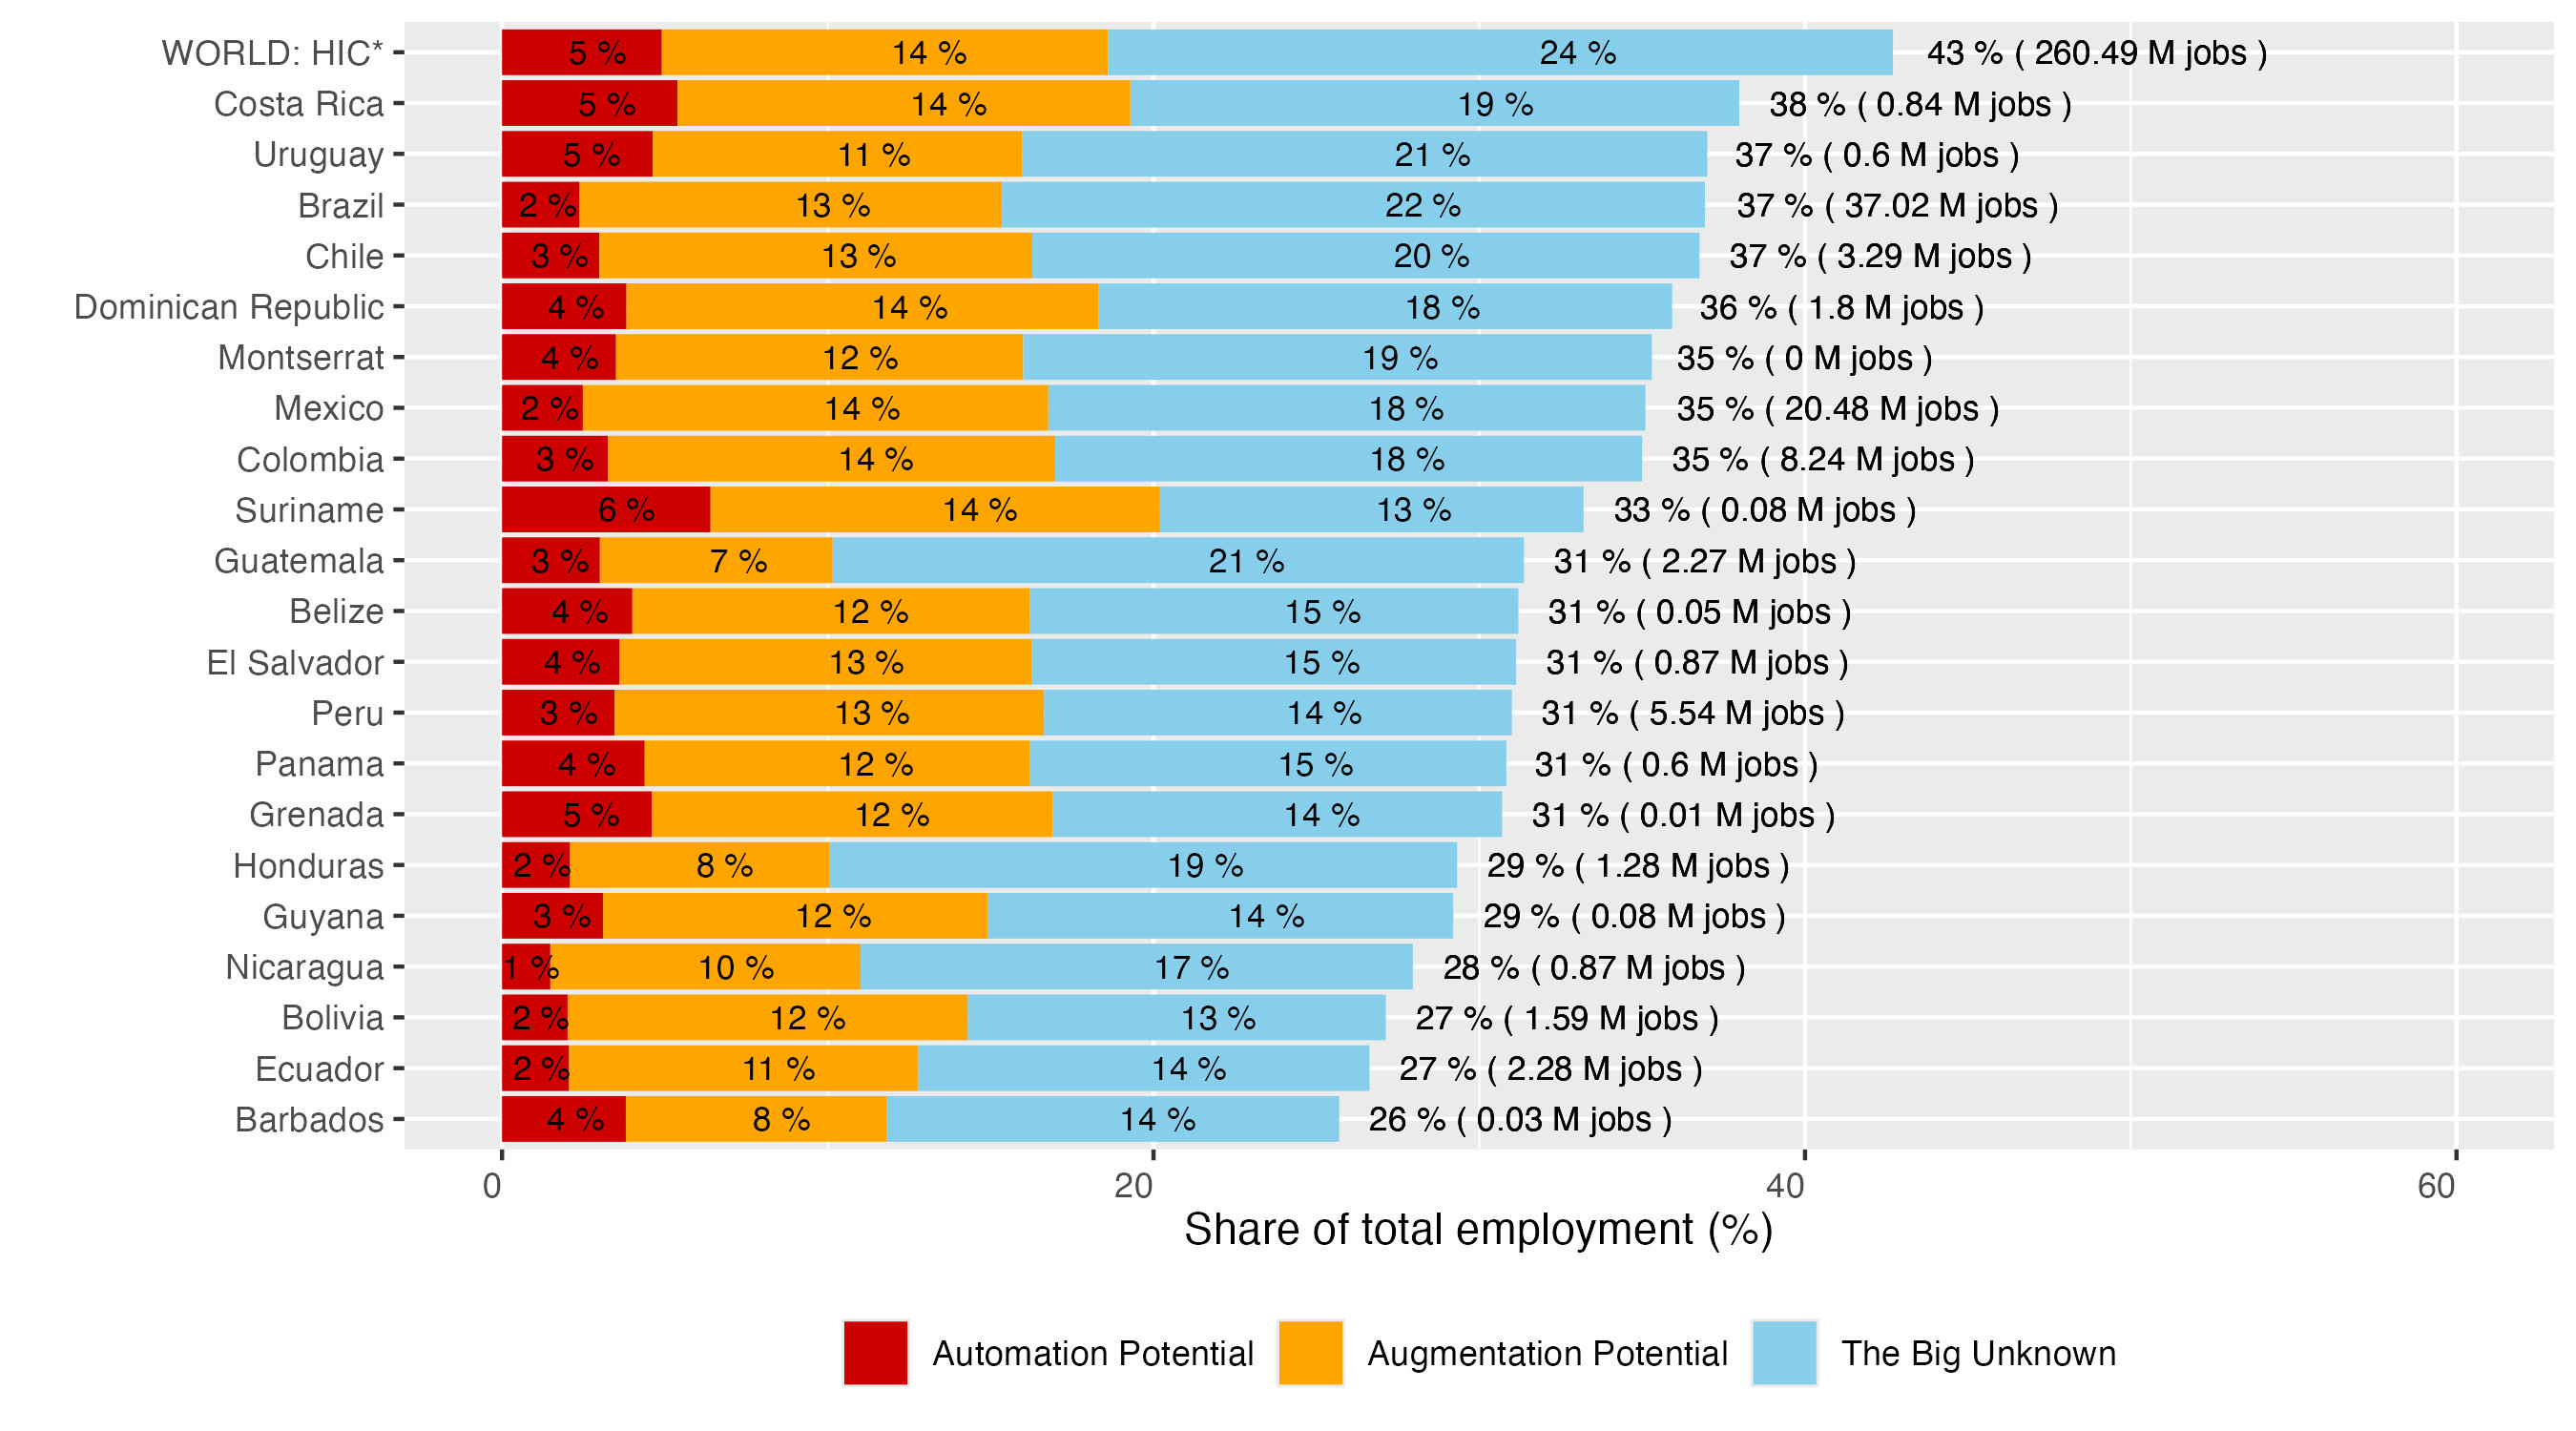
For reference, we conduct the same estimation for all HICs, calculating the mean level of exposure in the three categories (Figure 7).26 In line with the theoretical arguments considered in section 2, the variation in LAC countries’ overall exposure is strongly related with the income levels, since labour market structures in higher-income countries tend to contain proportionally more occupations that are likely to come into direct interaction with GenAI technology. Accordingly, wealthier countries of the LAC region come closest to the HIC reference category, where total exposure reaches 43 percent. Beyond this general income effect, important variability can be observed in each category of exposure, as shown in greater detail in the sections that follow.27 To explore these differences, we examine the cross-country variation in the shares of occupations within the two opposed categories of “automation potential” and “augmentation potential”, with further breakdowns by demographic and labour market characteristics.
Figure 8. Automation potential - detailed breakdown of socio-economic characteristics
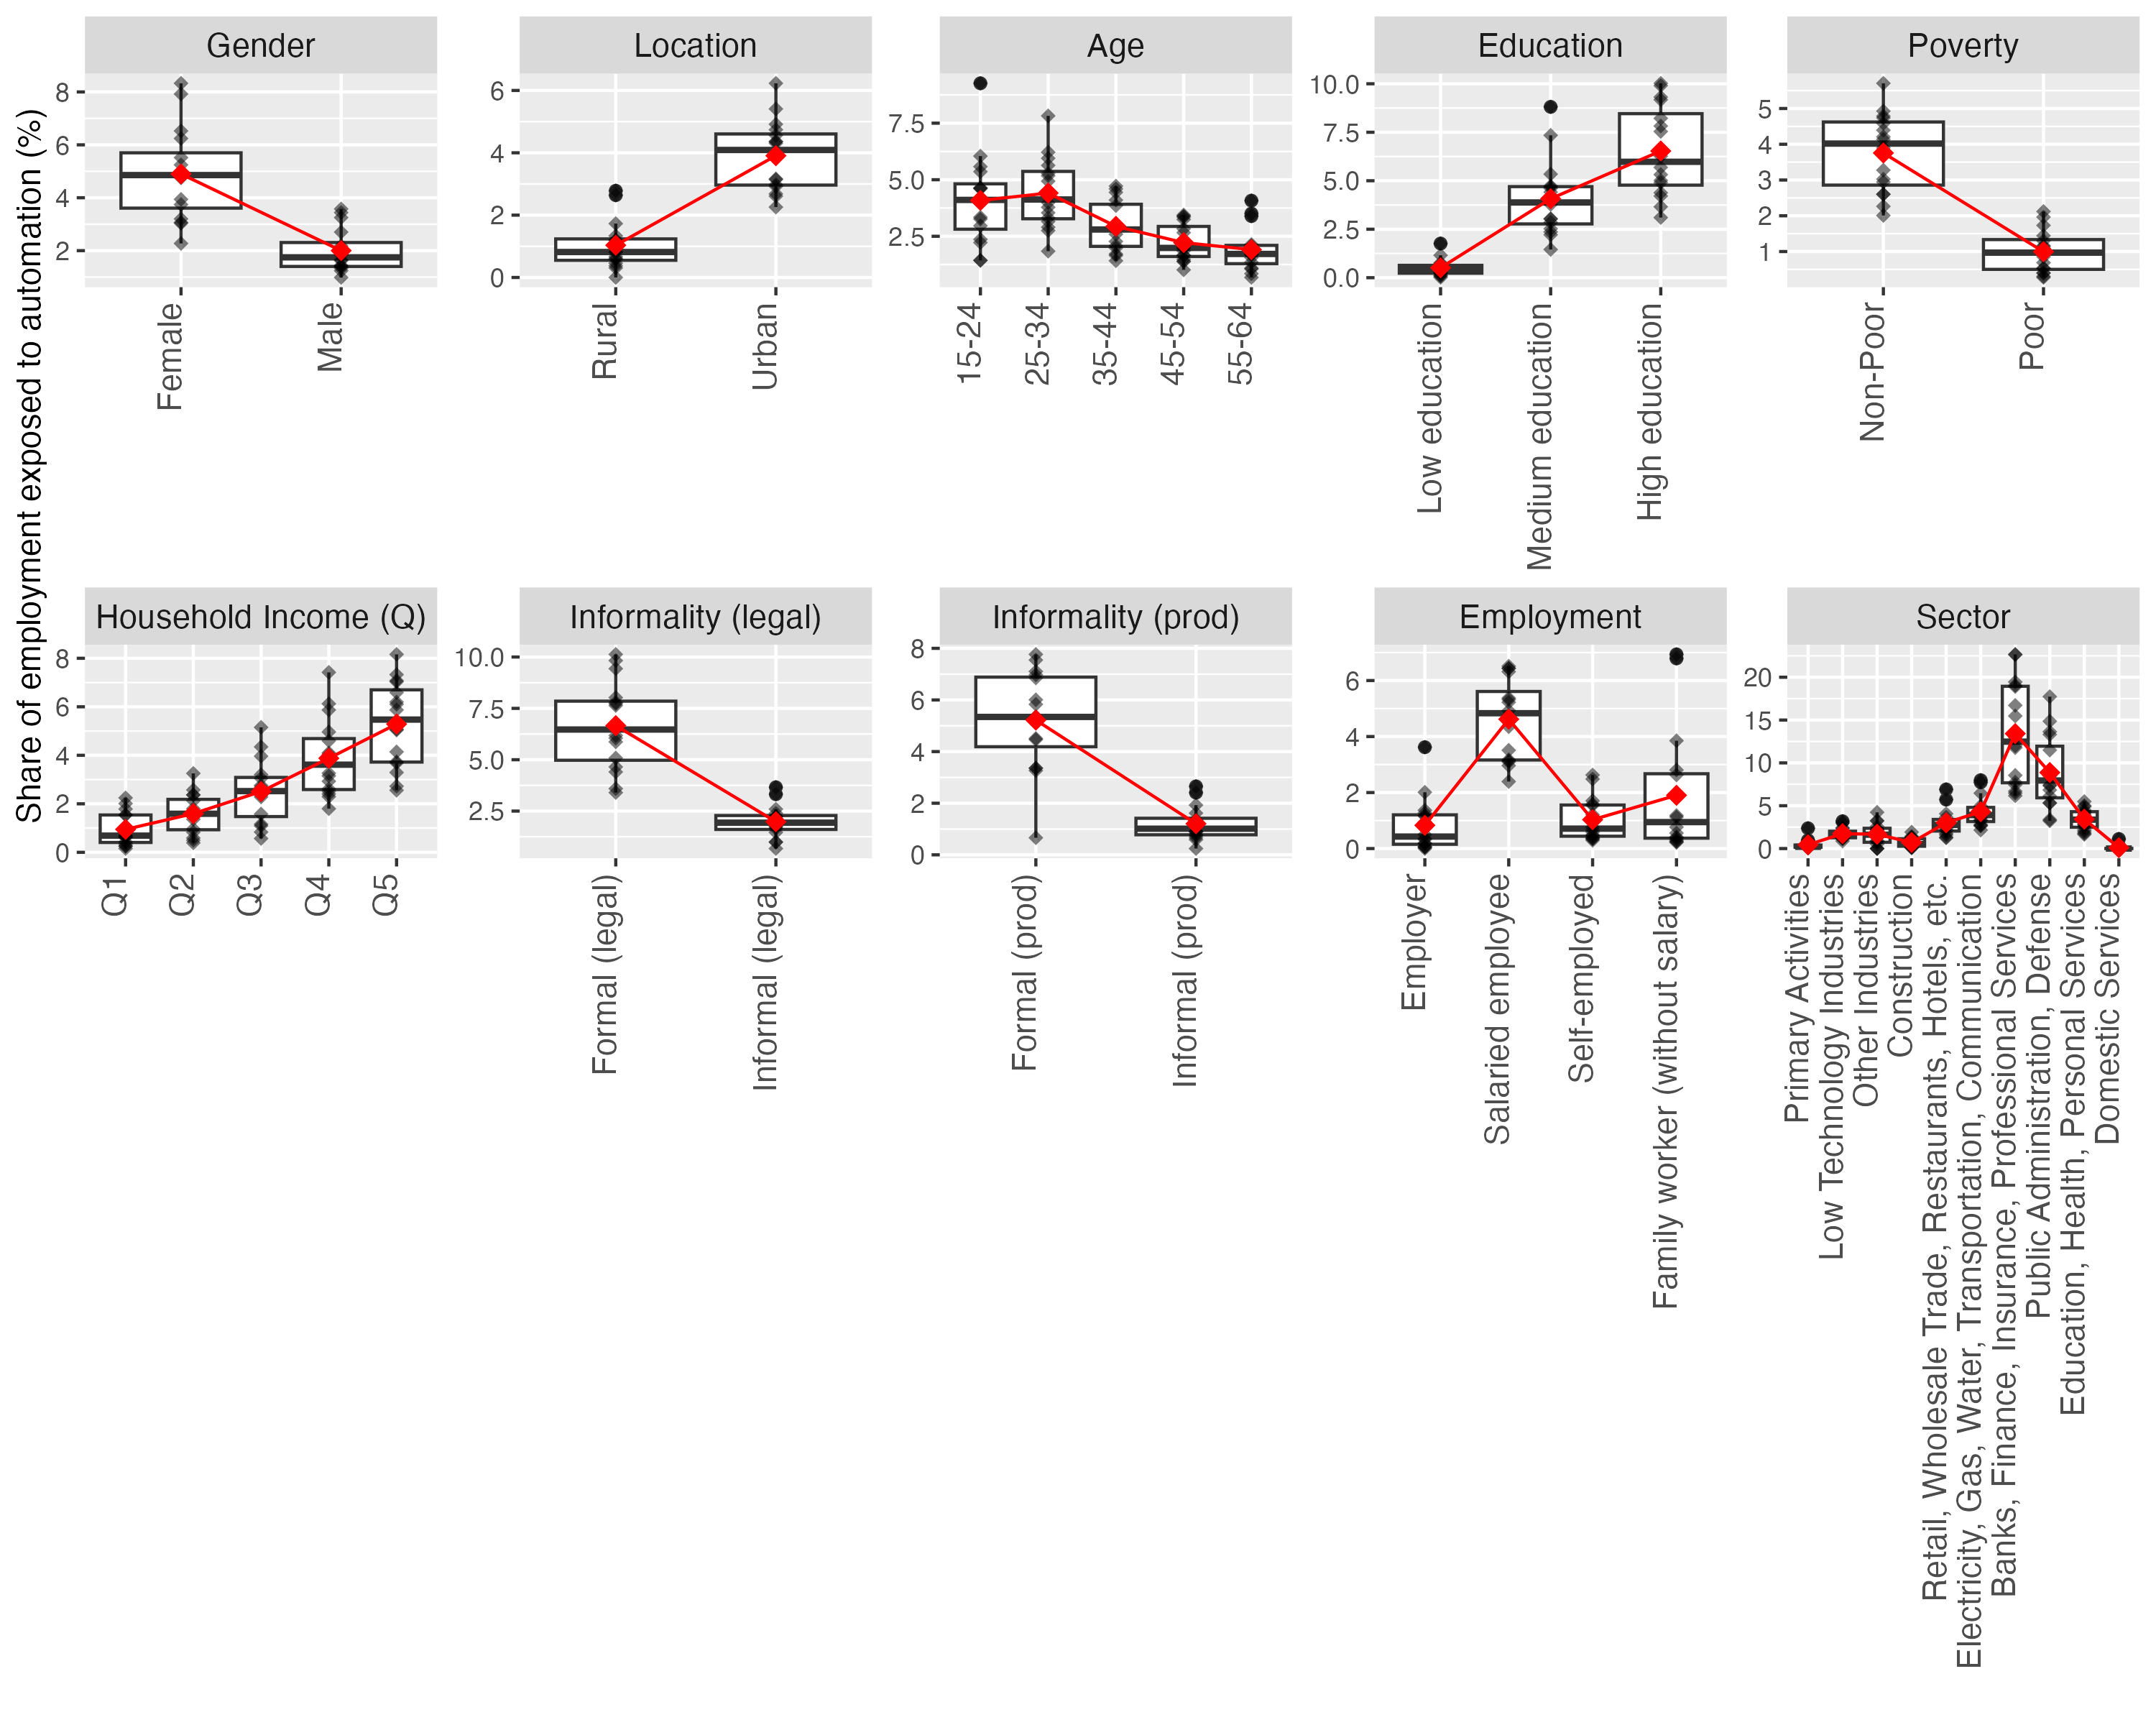
Note: Black dots in the chart represent the country-level exposure measures for each corresponding socio-economic group. The red dots indicate the average level of exposure.
Figure 8 presents these breakdowns for the category of automation, with the means of country-level shares marked in red. On average, the share of female-held jobs exposed to automation is double of the share of jobs held by men. The dispersion of country-level points is higher among female-held jobs, with some important outliers representing an even larger difference between the (lower) exposure of men to automation and the (higher) exposure of women. Figure 8 also reveals a difference in terms of job location, with a significantly higher share of jobs potentially exposed to automation located in the urban areas. Furthermore, the shares of such occupations are highest among young workers (15-24 and 25-34) and those with medium and, especially, high education. The average shares of employment in this category are high among the non-poor and increase with household income levels in a somewhat linear pattern, and that the exposure to automation is highest among workers with formal jobs and with salaried employment contracts. Finally, disaggregation by sector shows that the highest shares of jobs with exposure to automation are found in banking, finance and insurance services, followed by public administration and defence. In other words, if one was to describe a person exposed to the potential of automation in the LAC region, the defining features of that average profile would be: “female, urban, young, medium-to-high level educated, non-poor, with a relatively high income and a formal employee job in banking, finance and insurance businesses, or in the public sector”.
Figure 9. Augmentation potential - detailed breakdown of socio-economic characteristics
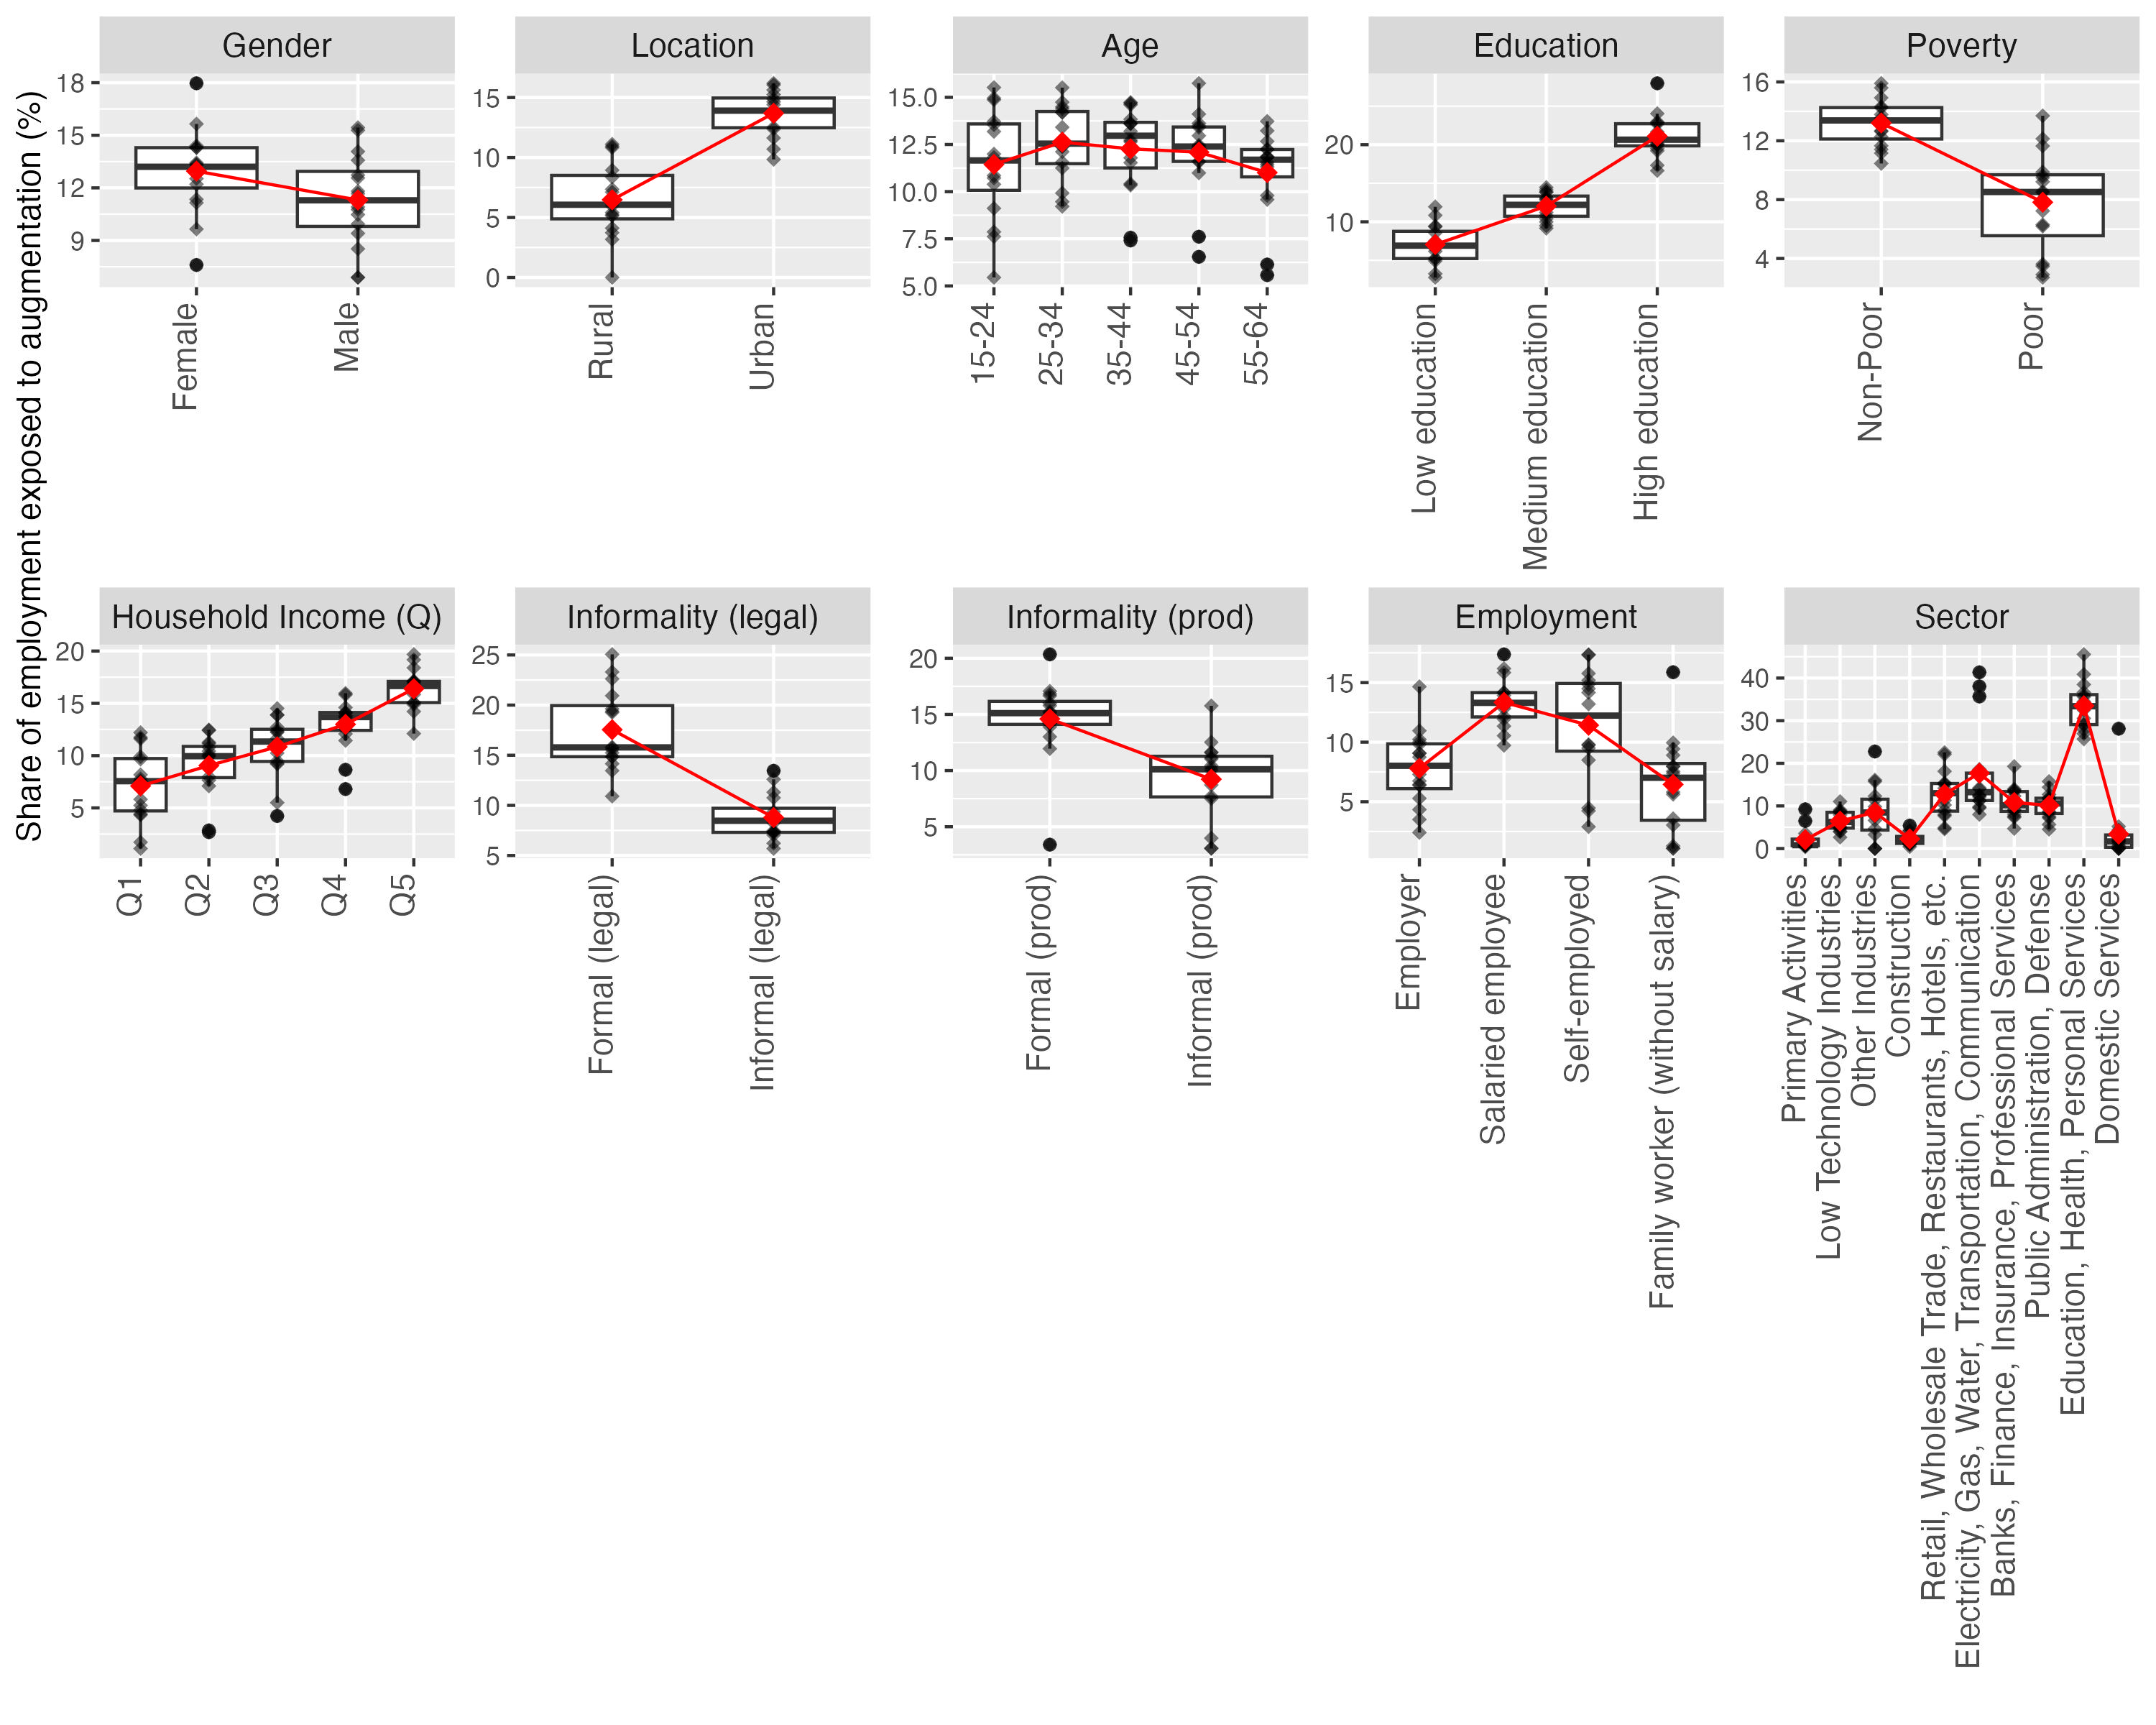
Note: the chart shows the country-level exposure measures for the corresponding socio-economic group. The red dots indicate the average level of exposure.
Figure 9 mirrors the analysis, with a focus on the exposure to augmentation. While several trends are similar to the automation exposure, important differences also emerge. First, the exposure to augmentation shows significantly less gendered effects: while the share of exposed female employment is higher than male employment across all countries, these differences are significantly smaller and, in some cases, negligible, with a higher cross-country variation. The same applies to the variables of age, with a slightly higher mean share of jobs in the 25-34 and 35-44 bracket, but no dominant pattern is observed across countries.28 In other words, when it comes to gender and age, the benefits of potential transformation are more equally distributed across these dimensions than the exposure to the risk of automation. The trends across several other characteristics are similar to the automation exposure, with urban, higher-educated, non-poor, formal occupations and higher income brackets corresponding to relatively higher augmentation potential. An important difference, however, concerns the employment relationships and sectors. Whereas automation was most prevalent among employees, the potential of augmentation is relatively higher among employees and the self-employed, with significantly higher shares of employment observed in education, health and personal services. The exposed self-employed occupations with the largest share of jobs cover a wide range of the skill spectrum: low (e.g. elementary workers not classified elsewhere), middle (e.g. hairdressers, market salespersons, motorcycle drivers) and high (e.g. architects, real estate agents, photographers, musicians).
In summary, having compared the trends across countries and socioeconomic groups, we observe some common patterns regarding overall exposure to GenAI, with important variability across types of exposure. People with higher education and incomes, in urban areas, with jobs in the formal sector, and younger tend to have higher levels of exposure to GenAI, regardless of the type of exposure. The strongest differences in the type of exposure appear across gender, employment status and sectors, with women and salaried employees in banking, finance, insurance services and public administration showing higher exposure to automation, while augmentation exposure is most dominant among salaried and self-employed and in the sector of education, health and personal services.29
Impact of digital infrastructure on the potential of transformation
The previous section provided a detailed analysis based on the assumption of equal exposure among all countries within a given ISCO-08 2-digit category. In this section, we apply the calculations that predict the use of a computer at work and therefore introduce variation at the level of individual occupations within countries.30 Since access to a computer is a crucial starting point for the use of GenAI technologies, by applying this additional criterion, we separate the theoretical exposure of occupations to GenAI from the practical feasibility of such a transformation in a given country context, as a function of available digital infrastructure. We focus this part of analysis on three principal dimensions: country-specific digital characteristics, exposure type and gender. This worker-level approach suggests that the workers’ skills are crucial to determine the digital divide and the effective exposure to GenAI. But it is worth noting this gap could also be determined by firm characteristics or AI investment decisions. Although there is no clear agreement on the effects of AI technologies on employment
We start by examining the estimates based on PIAAC surveys, which features four LAC countries that we compare to Slovenia and New Zealand. This helps us assess the results based on the same survey method and corresponding years of data collection across several countries before we proceed with more complex probabilistic modelling between the PIAAC and SEDLAC datasets.
Figure 10. Jobs with augmentation potential and access to computer at work, based on PIAAC data

Figure 10 shows that the four LAC countries in the sample have a similar share of employment representing jobs with augmentation potential as Slovenia and New Zealand, with Chile’s total share being the largest in this sample. However, when it comes to the use of a computer among workers with these jobs, all four LAC countries take the lower end of the scale. In fact, in the case of Mexico and Peru, the proportions are nearly inverse of those in Slovenia, as jobs with the potential to be transformed by GenAI and using a computer at the workplace represent 5.1-5.4 percent of employment, compared to 8.5-8.7 percent of employment in the jobs that could be transformed but do not have a computer connection. In the case of New Zealand, there proportions are more than inverse, with 11.8 percent of employment in jobs with a computer and augmentation potential and only 2.3 percent of employment in such jobs without a computer. While the overall degree of digitalization has increased across countries over the past years,32 PIAAC data seems to provide one of the best available tools to capture the relative gaps between the highly digitalized and less technologically advanced contexts.33
As the next step, we proceed with the probabilistic model, imputing probabilities predicted based on PIAAC data to our SEDLAC dataset. In the main analysis, we focus on the use of computer at work, with an expanded analysis on the simultaneous use of a computer and internet presented in the Appendix. In that sense, we focus on the lower threshold of the digital gap, as simultaneous use of a computer and internet represents a more stringent criterion, which results in larger digital gaps. Figure 11 presents a detailed breakdown of our aggregate calculations, with the share of occupations in each country and exposure categories marked in orange in the case of jobs with an available computer, and light blue for the jobs where a computer is not available at the workplace.
Figure 11. Exposure by country, exposure type and access to digital infrastructure
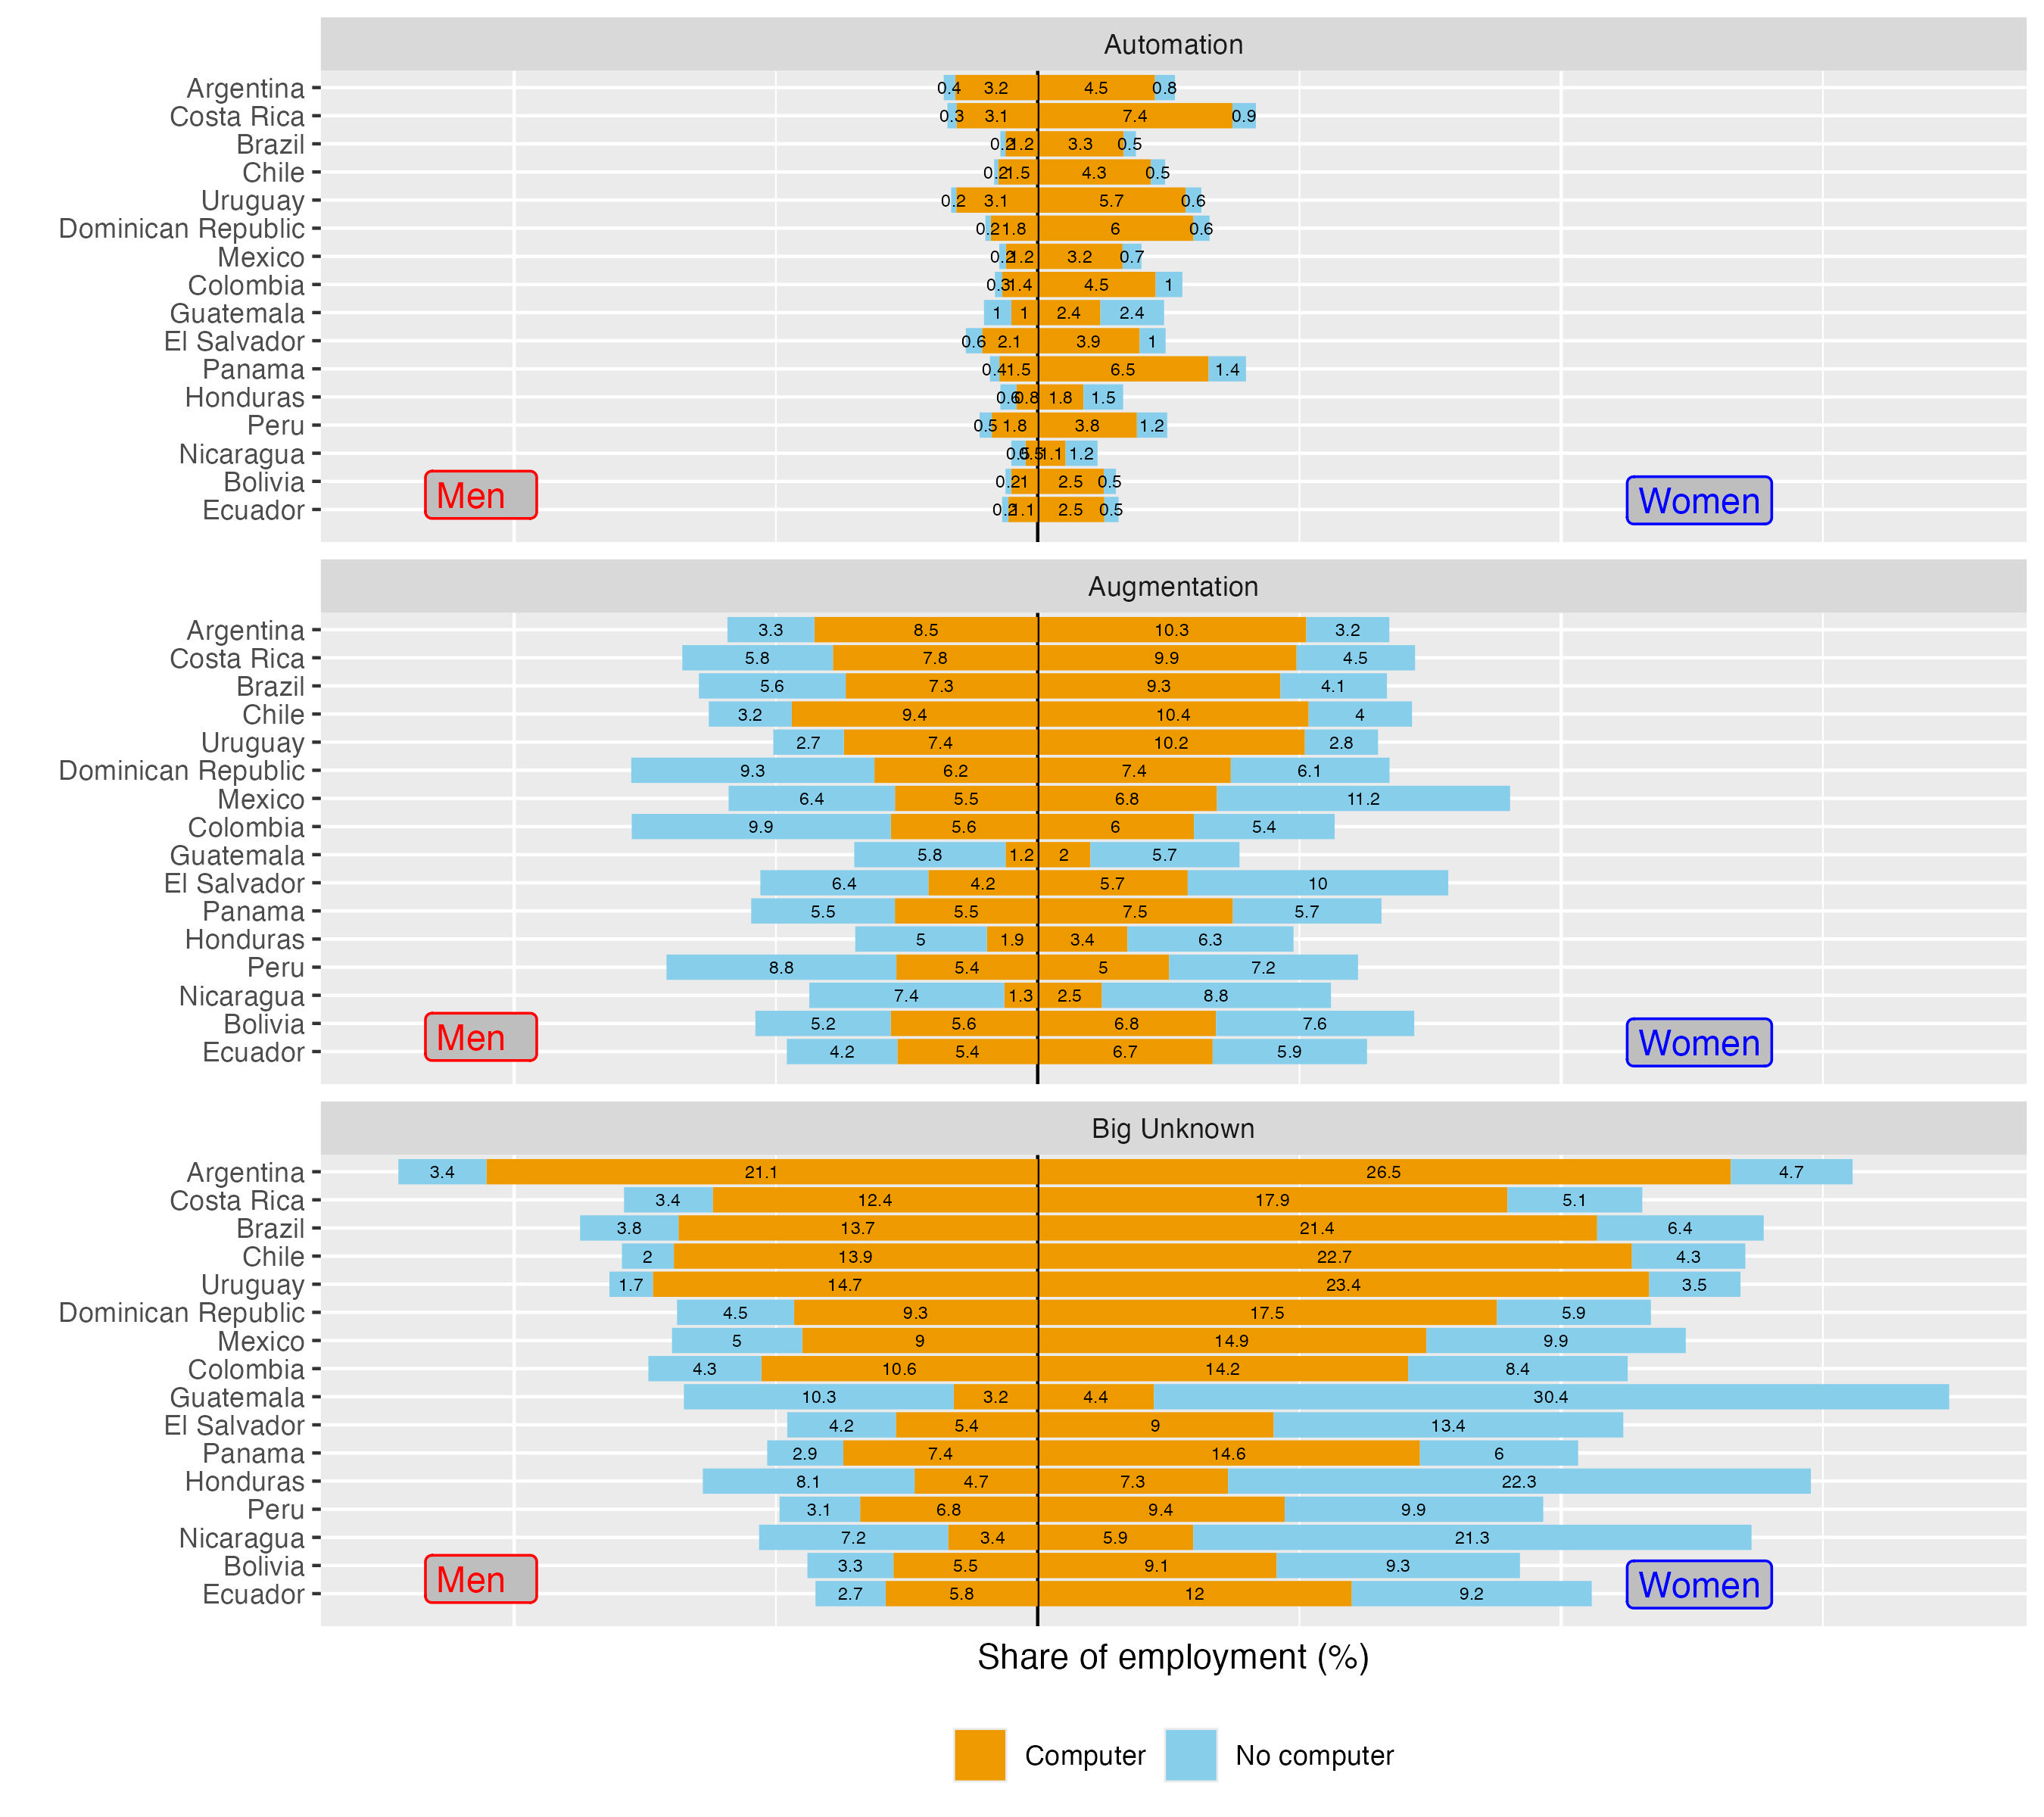
We can observe that, in the case of jobs exposed to potential automation, the shares of such jobs that do not use a computer are generally very low across countries. In other words, most of such occupations are already digitized. A notable exception applies to countries with lower income, such as Nicaragua, Guatemala and Honduras, where around half of the jobs exposed to potential automation are predicted to not use a computer. One way to think about this pattern is that, in poorer countries, the lack of digital infrastructure might offer a temporary buffer from the risk of imminent automation to some occupations in this category – a trend that likely extends to countries with relatively lower incomes outside Latin America. The plot also re-confirms that such automation-exposed jobs are disproportionately held by women.
The situation is visibly different in the case of occupations with augmentation potential. First, the distribution of such jobs is more equal among women and men. In addition, the shares of jobs that do not use a computer at work are also more evenly distributed across men and women. An intuitive way of thinking about this part of Figure 11 is that the light blue zones (no computer) represent the transformation potential that cannot be attained due to digital infrastructure limitations. If one was to assume that such a transformation could translate into productivity gains in those occupations, the zones without a computer can be seen as an unattainable potential productivity gains.34
Taking this analysis one step further, we can quantify these effects. For example, if we calculate the unattained augmentation potential as an average value across the LAC countries (weighted by total employment of each country), it corresponds to 6.24 percent of female employment and 6.22 percent of male employment. If we think of this gap as an average share of jobs within all jobs with augmentation potential, it corresponds to a non-negligible 44 percent of such jobs held by women and 50 percent of such jobs held by men. Applying these calculations to the 2023 ILO modelled estimates of total employment in each country, we estimate that there are some 17 million jobs among the 16 LAC countries in our SEDLAC sample that could, in theory, experience additional productivity from the technological transformation with GenAI, but which will not be in position to do so due to the lack of digital infrastructure. Some 7 million such jobs are held by women and nearly 10 million are held by men (see Figure A6 in Appendix for country-level breakdowns).
Within-country patterns
In this section, we present a sample of within-country analysis, using the example of Colombia and Costa Rica (Figure 12). Detailed breakdowns by country are provided in the Appendix and made available in a dynamic way on our online portal.35
Within each country, the plot can be read as a detailed breakdown of a given category on the vertical axis into the shares of employment represented in horizonal separations. For example, in the case of Colombia, among women, 5.5 percent of employment is exposed to the risk of automation, 11.3 percent of employment is in the augmentation category, and 22.5 percent in the big unknown. The remainder, not presented in the graph, contains all other female-held occupations that do not fall into any of those three exposure categories. The dark shaded areas represent jobs with a computer at work, while the light shading represent the jobs in each exposure type that do not use a computer. We can observe that among the female-held jobs exposed to potential automation, very few jobs do not use a computer, whereas among those with a transformation potential, this digital constraint applies to about half of such jobs.
Figure 12. Exposure by country, type and detailed country-level characteristics
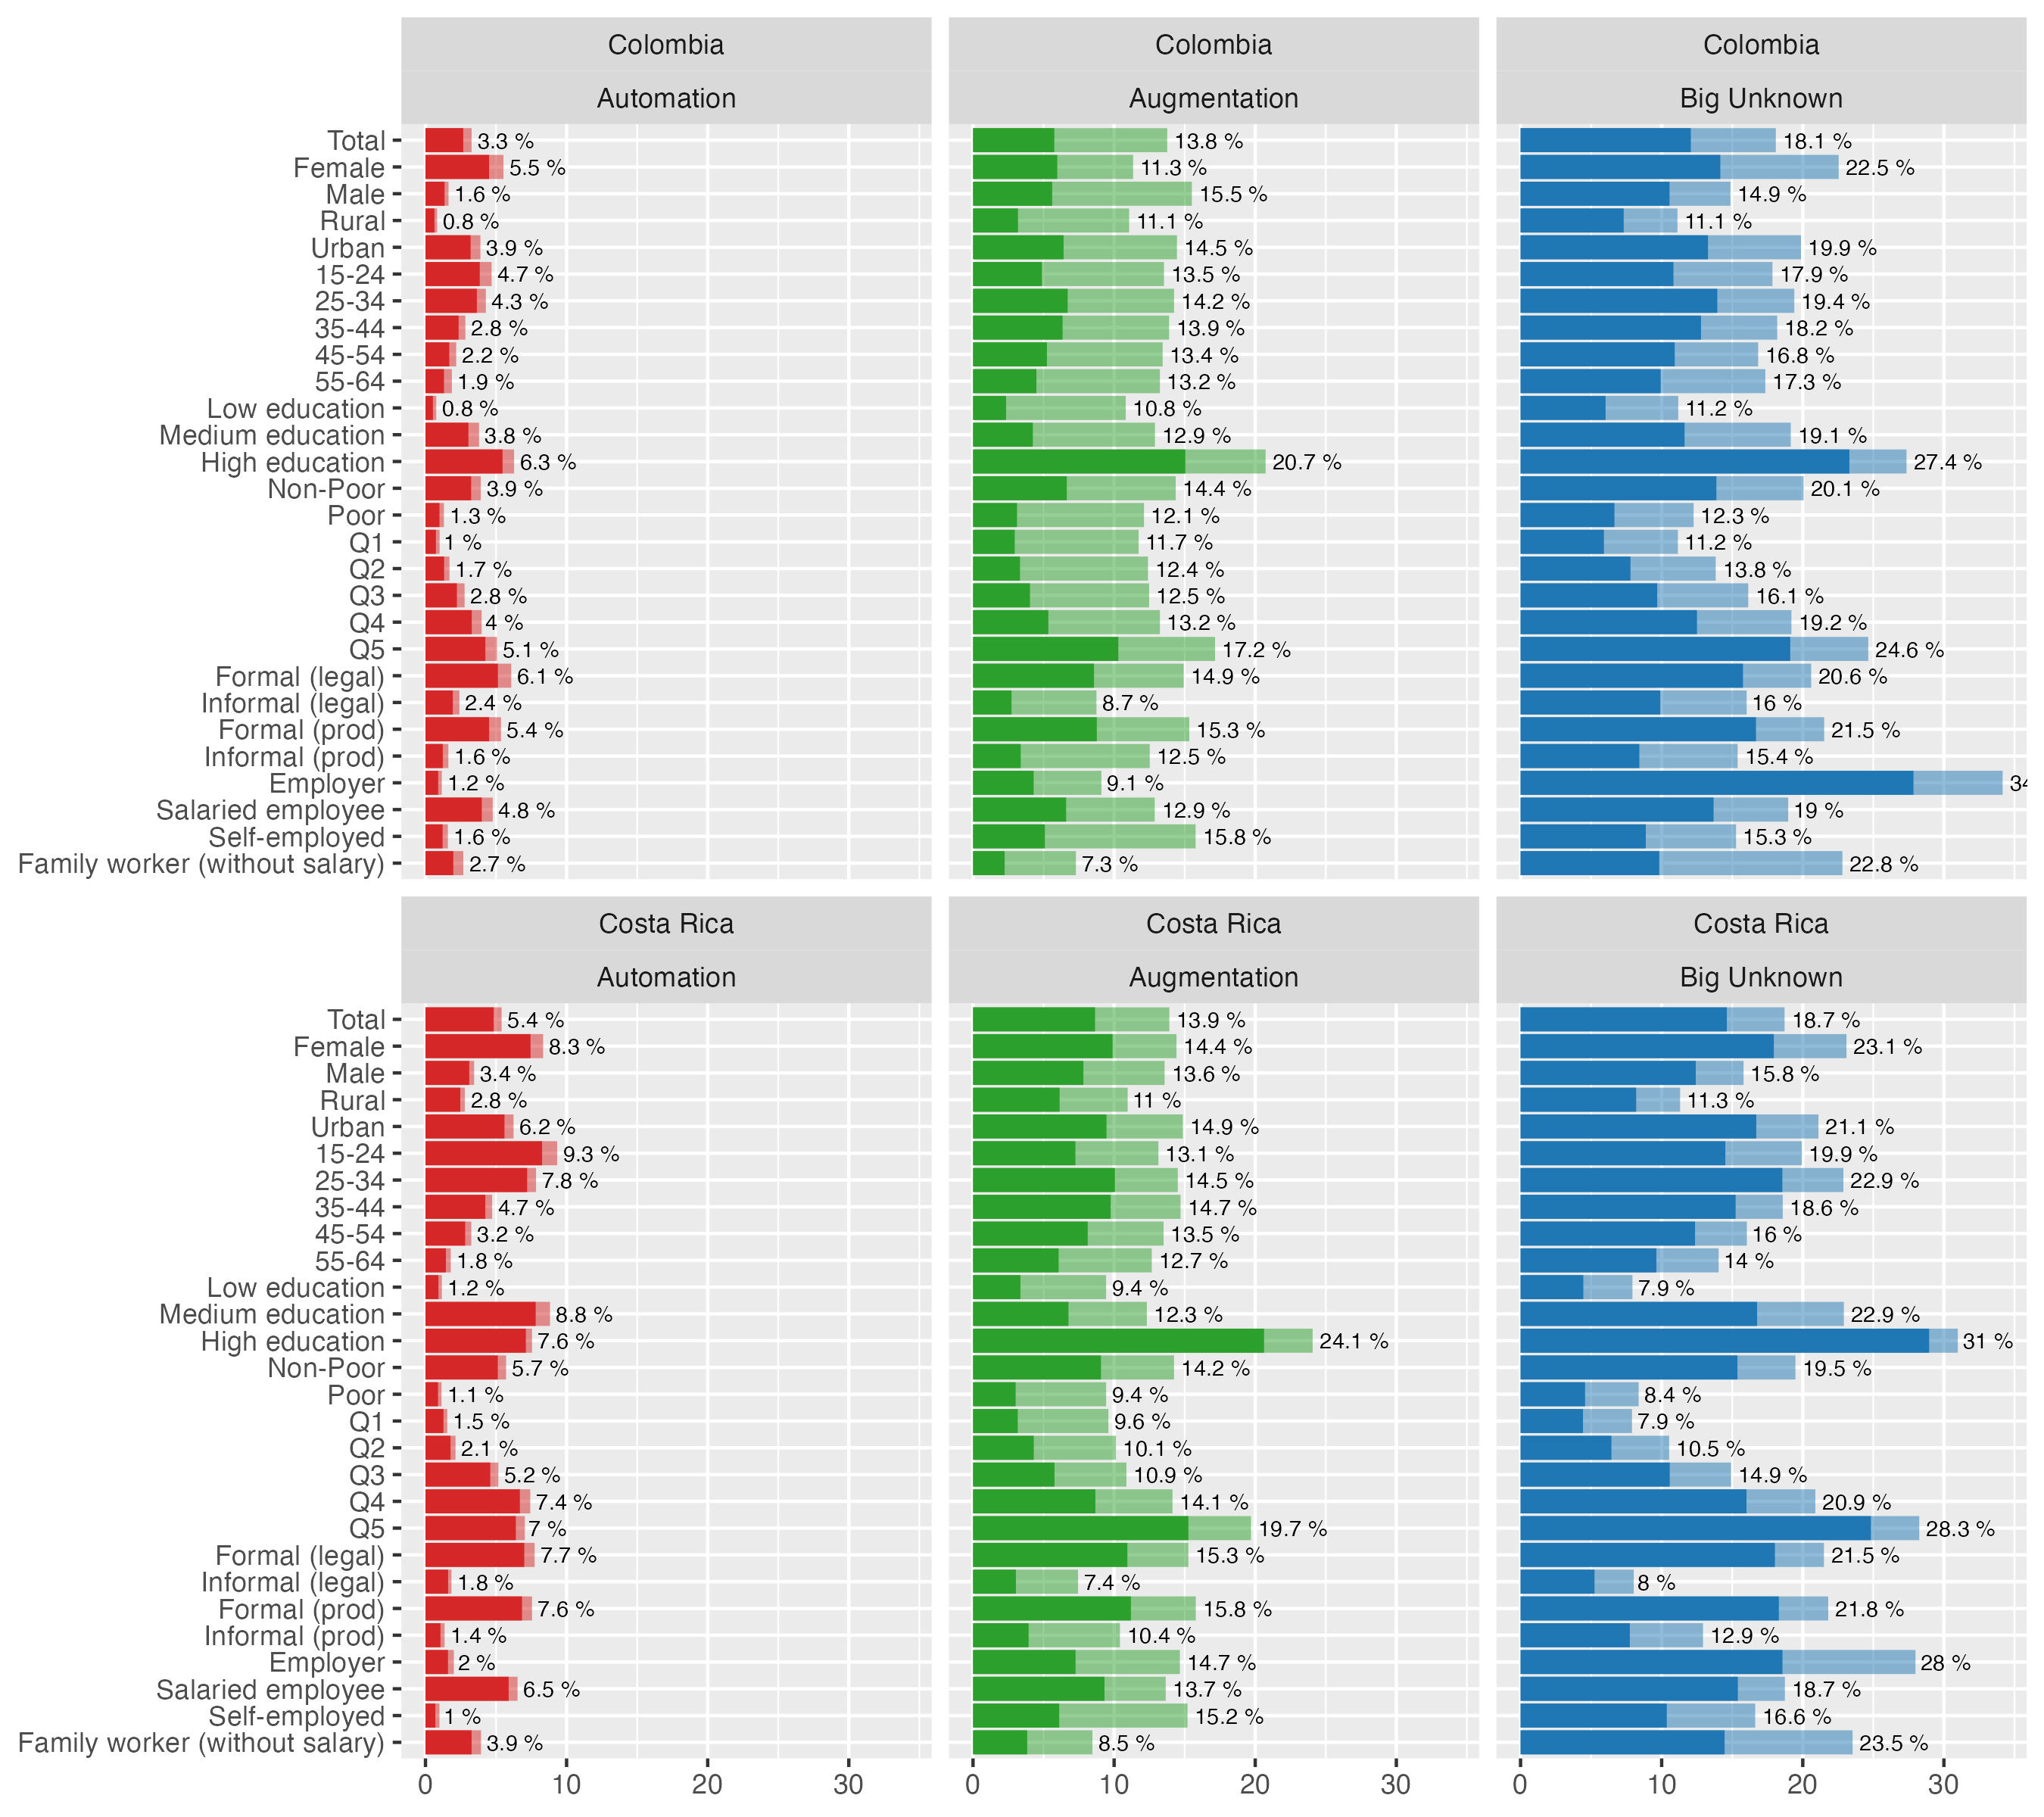
Figure 12 can also be read vertically, allowing for within-country analysis across characteristics of both the worker and the job. Continuing with the example of Colombia, we can observe that the share of jobs with high automation potential is higher among women (5.5 percent) than men (1.6 percent), and among urban (3.9 percent) than rural jobs (0.8 percent). The share of such occupations is also highest among young people and decreases with age brackets, while it increases with education levels and household income brackets. While these general trends have already been discussed in the preceding section, the detailed breakdowns enable country-specific insights, necessary for a broader reflection on adequate policy responses. In order to support such processes, in addition to our paper, we make this detailed country-level data publicly available online.
Which occupations drive the effects?
To understand what drives these effects, in Figure 13 we focus only on occupations where at least a quarter of all individual observations under a given ISCO 2-digit category falls into one of the exposure groups. For example, taking “augmentation & computer”, we can observe that, in many countries, over 50 percent of teaching professionals can be found in this category. The exceptions concern lower income countries, such as Guatemala, Honduras and Nicaragua, where the majority of teaching professionals are in the category of potential augmentation, but without access to a computer at work. This suggests that the differences in digital development might impose important limitations on the benefits of GenAI for the education systems in poorer countries.
Figure 13. ISCO 2-digit occupations by type of exposure and country (share of exposure > 25%)
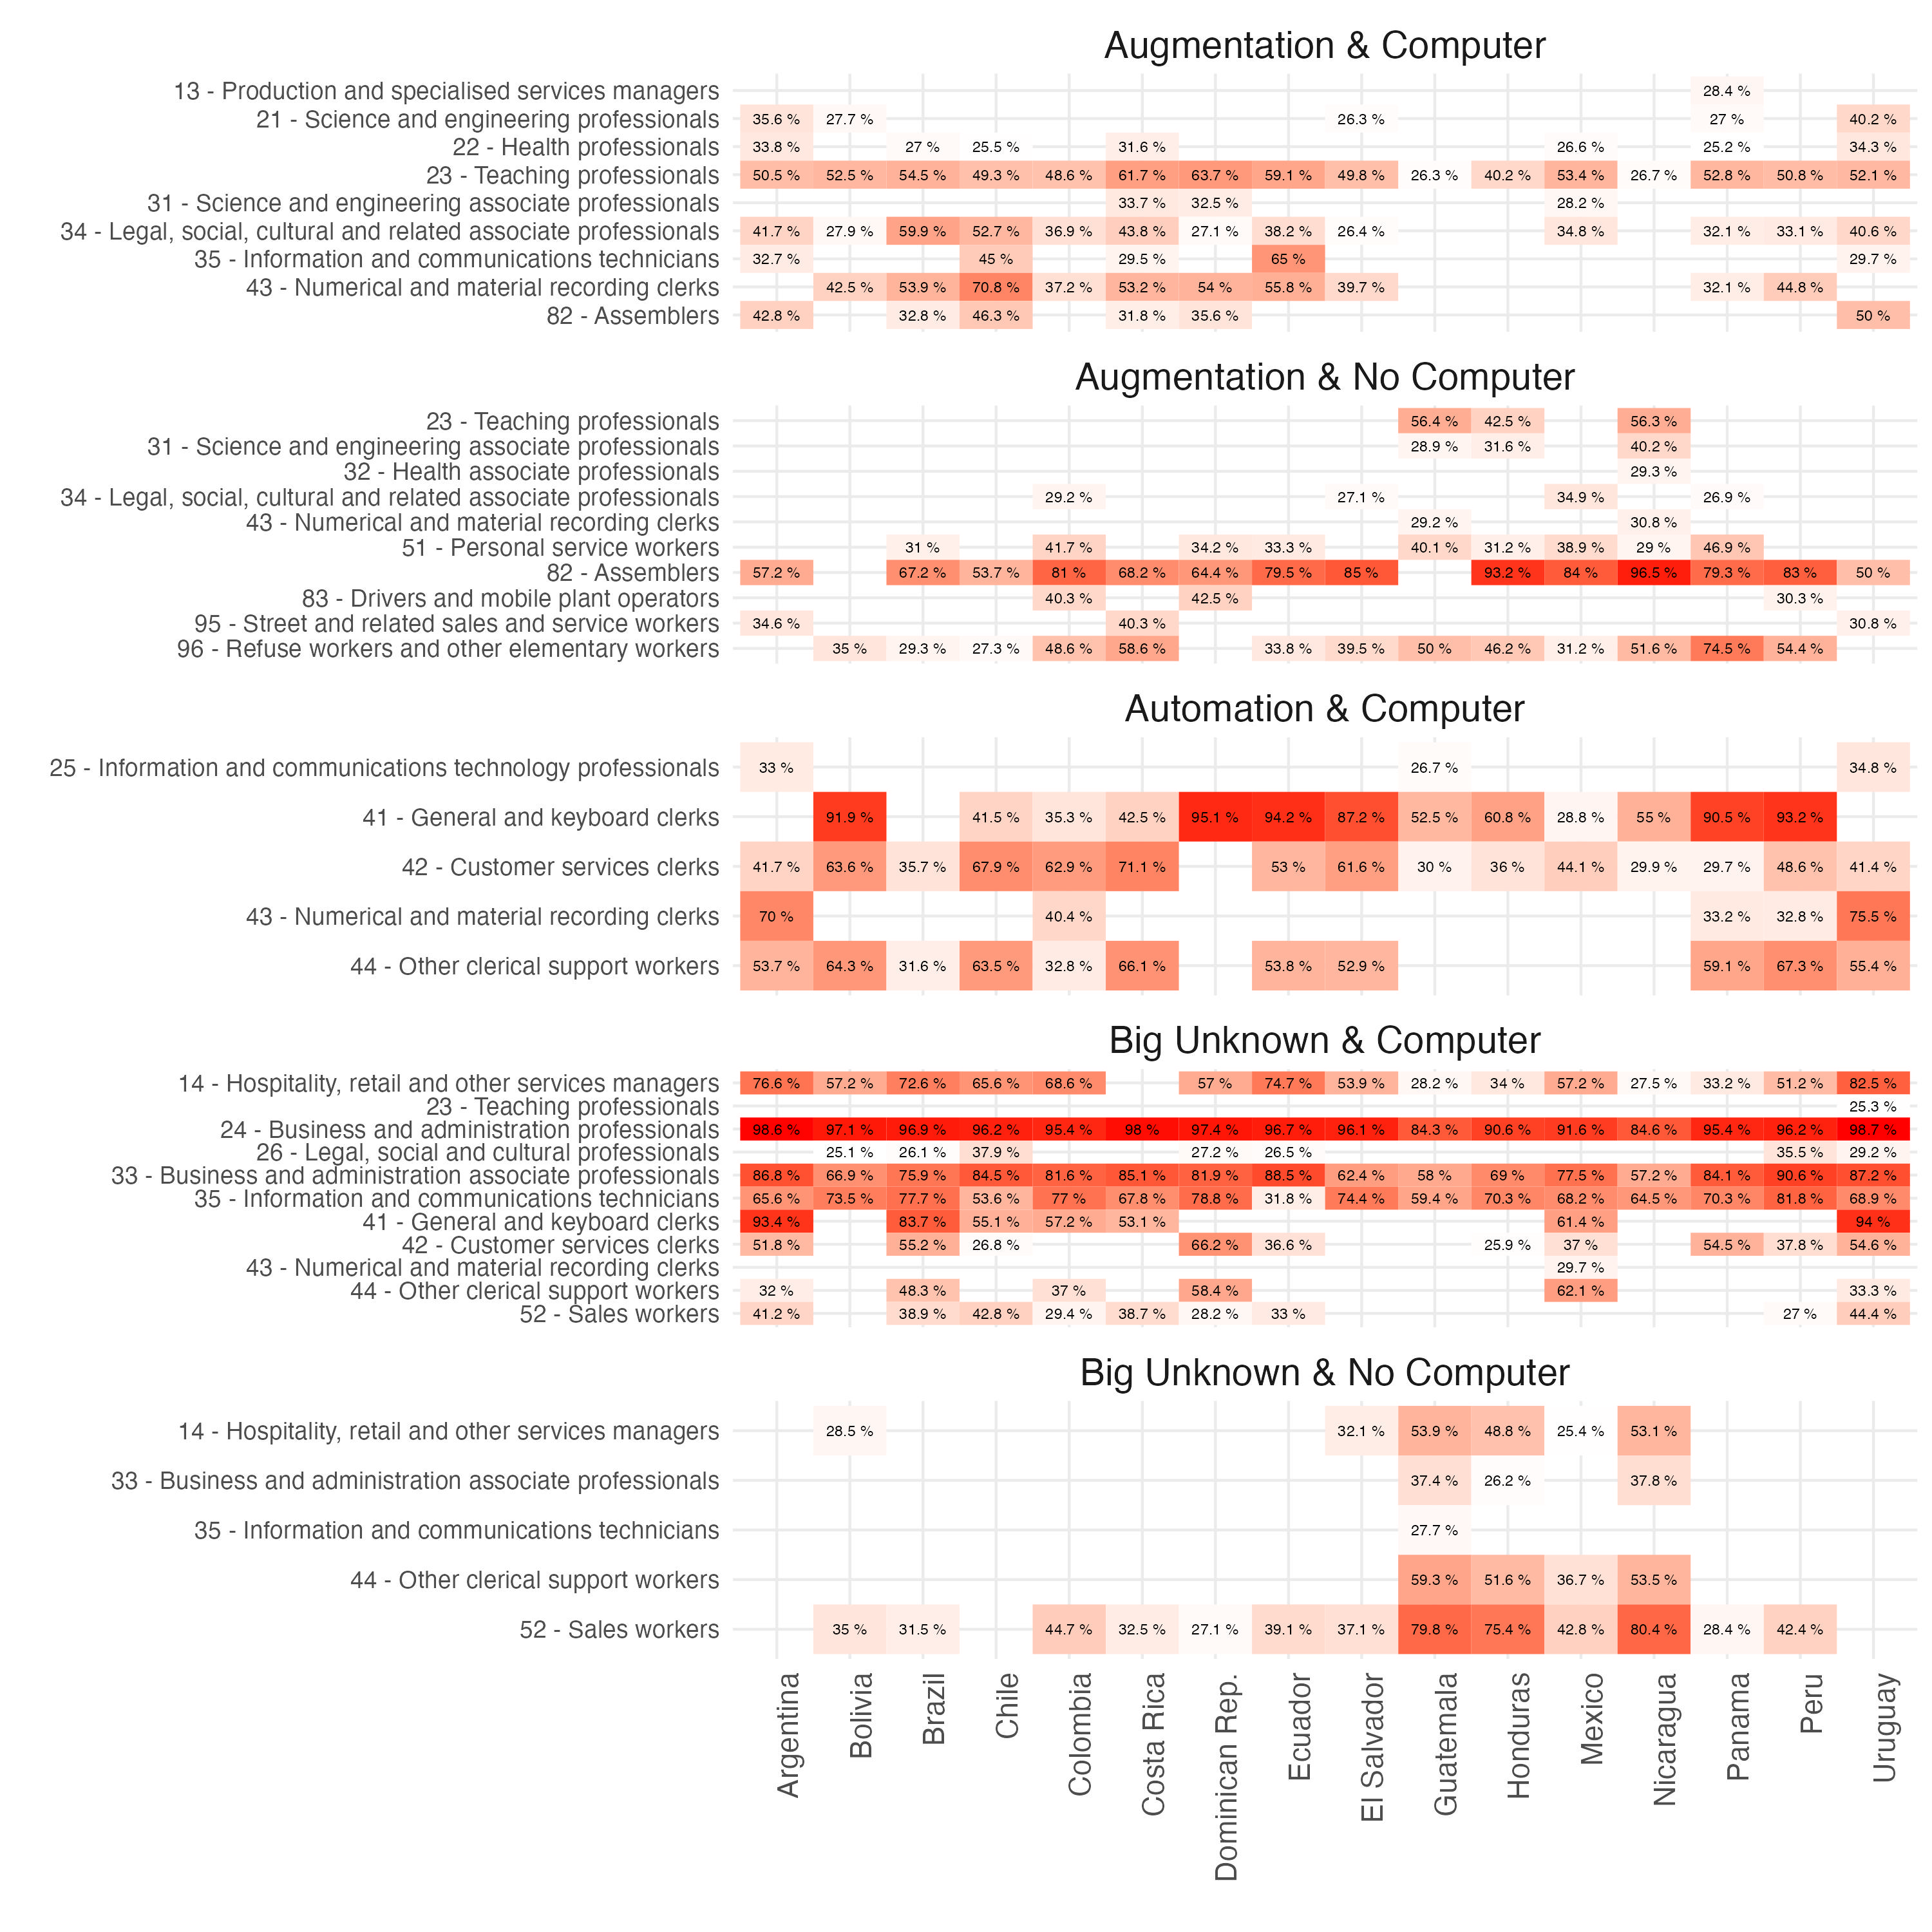
Other occupations that could benefit from augmentation and already use a computer at work concern legal, social and cultural professionals, and numerical and material recording clerks in most countries, as well as health professionals, information and communication technicians and some of the assemblers in countries with relatively higher incomes. In elaborating on these categories, examples could include legal professionals like tax lawyers using GenAI for case analysis, social workers employing case management software, and cultural professionals such as digital archivists. Assemblers with a computer can include skilled workers like electricians who may utilize GenAI-based diagnostic or instructional tools in higher-income countries.
Nevertheless, a larger share of the assemblers’ jobs falls into the category with augmentation potential but no computer at work, alongside personal service and refuse workers. While such jobs retain a central human component, in settings with a computer and internet access, some of their tasks could benefit from the AI transformation. For example, personal service workers, such as home health aides, could use a scheduling and client management software to enhance service coordination, while companies hiring refuse workers could implement waste tracking systems and route optimization software to improve efficiency and reduce environmental impact.36 However, due to the lack of digital infrastructure in LAC countries, such potential benefits would simply remain out of reach to those job categories.
Figure 13 also demonstrates a variety of occupations falling into the “big unknown” category, with a vast majority of such jobs already using a computer at work. This concerns business and administration professionals and associate professionals, information and communication technicians, customer service clerks, general and keyboard clerks as well as hospitality, retail and other services managers. Decomposing these groups into more detailed occupations, it is easy to illustrate why this category represents the zone between the potential of full job automation and augmentation with generative AI. For example, business and administration professionals could see GenAI software streamline complex data analysis, associate professionals might use it to manage logistics more efficiently, while customer service clerks might rely on GenAI for support with query resolution. As the technology evolves, the balance between augmentation and automation of tasks might shift, potentially redefining some of the jobs in customer query roles significantly faster and exposing them to a higher risk of full automation than other occupations in this category. It should also be noted that a large share of customer query clerks is already found in the category of high automation potential, alongside other groups of clerical occupations. The fact that, in most cases, such jobs already use a computer at work further shortens the distance to the potential full automation of these occupations, making potential shifts between the “big unknown” and full automation more fluid.
Differential exposure across earnings levels
As the final step of the analysis, we look deeper in the relationship between labour earnings and the degree of occupational exposure to GenAI, focusing exclusively on the occupations that report already using a computer. To do that, we use the latest available micro data for each country and focus separately on income of employees and self-employed. To ensure comparability across countries, we show the median income of each ISCO-08 2-digit level occupation as a percentage of the median income of wage employees across all observations in each survey sample.37
Figure
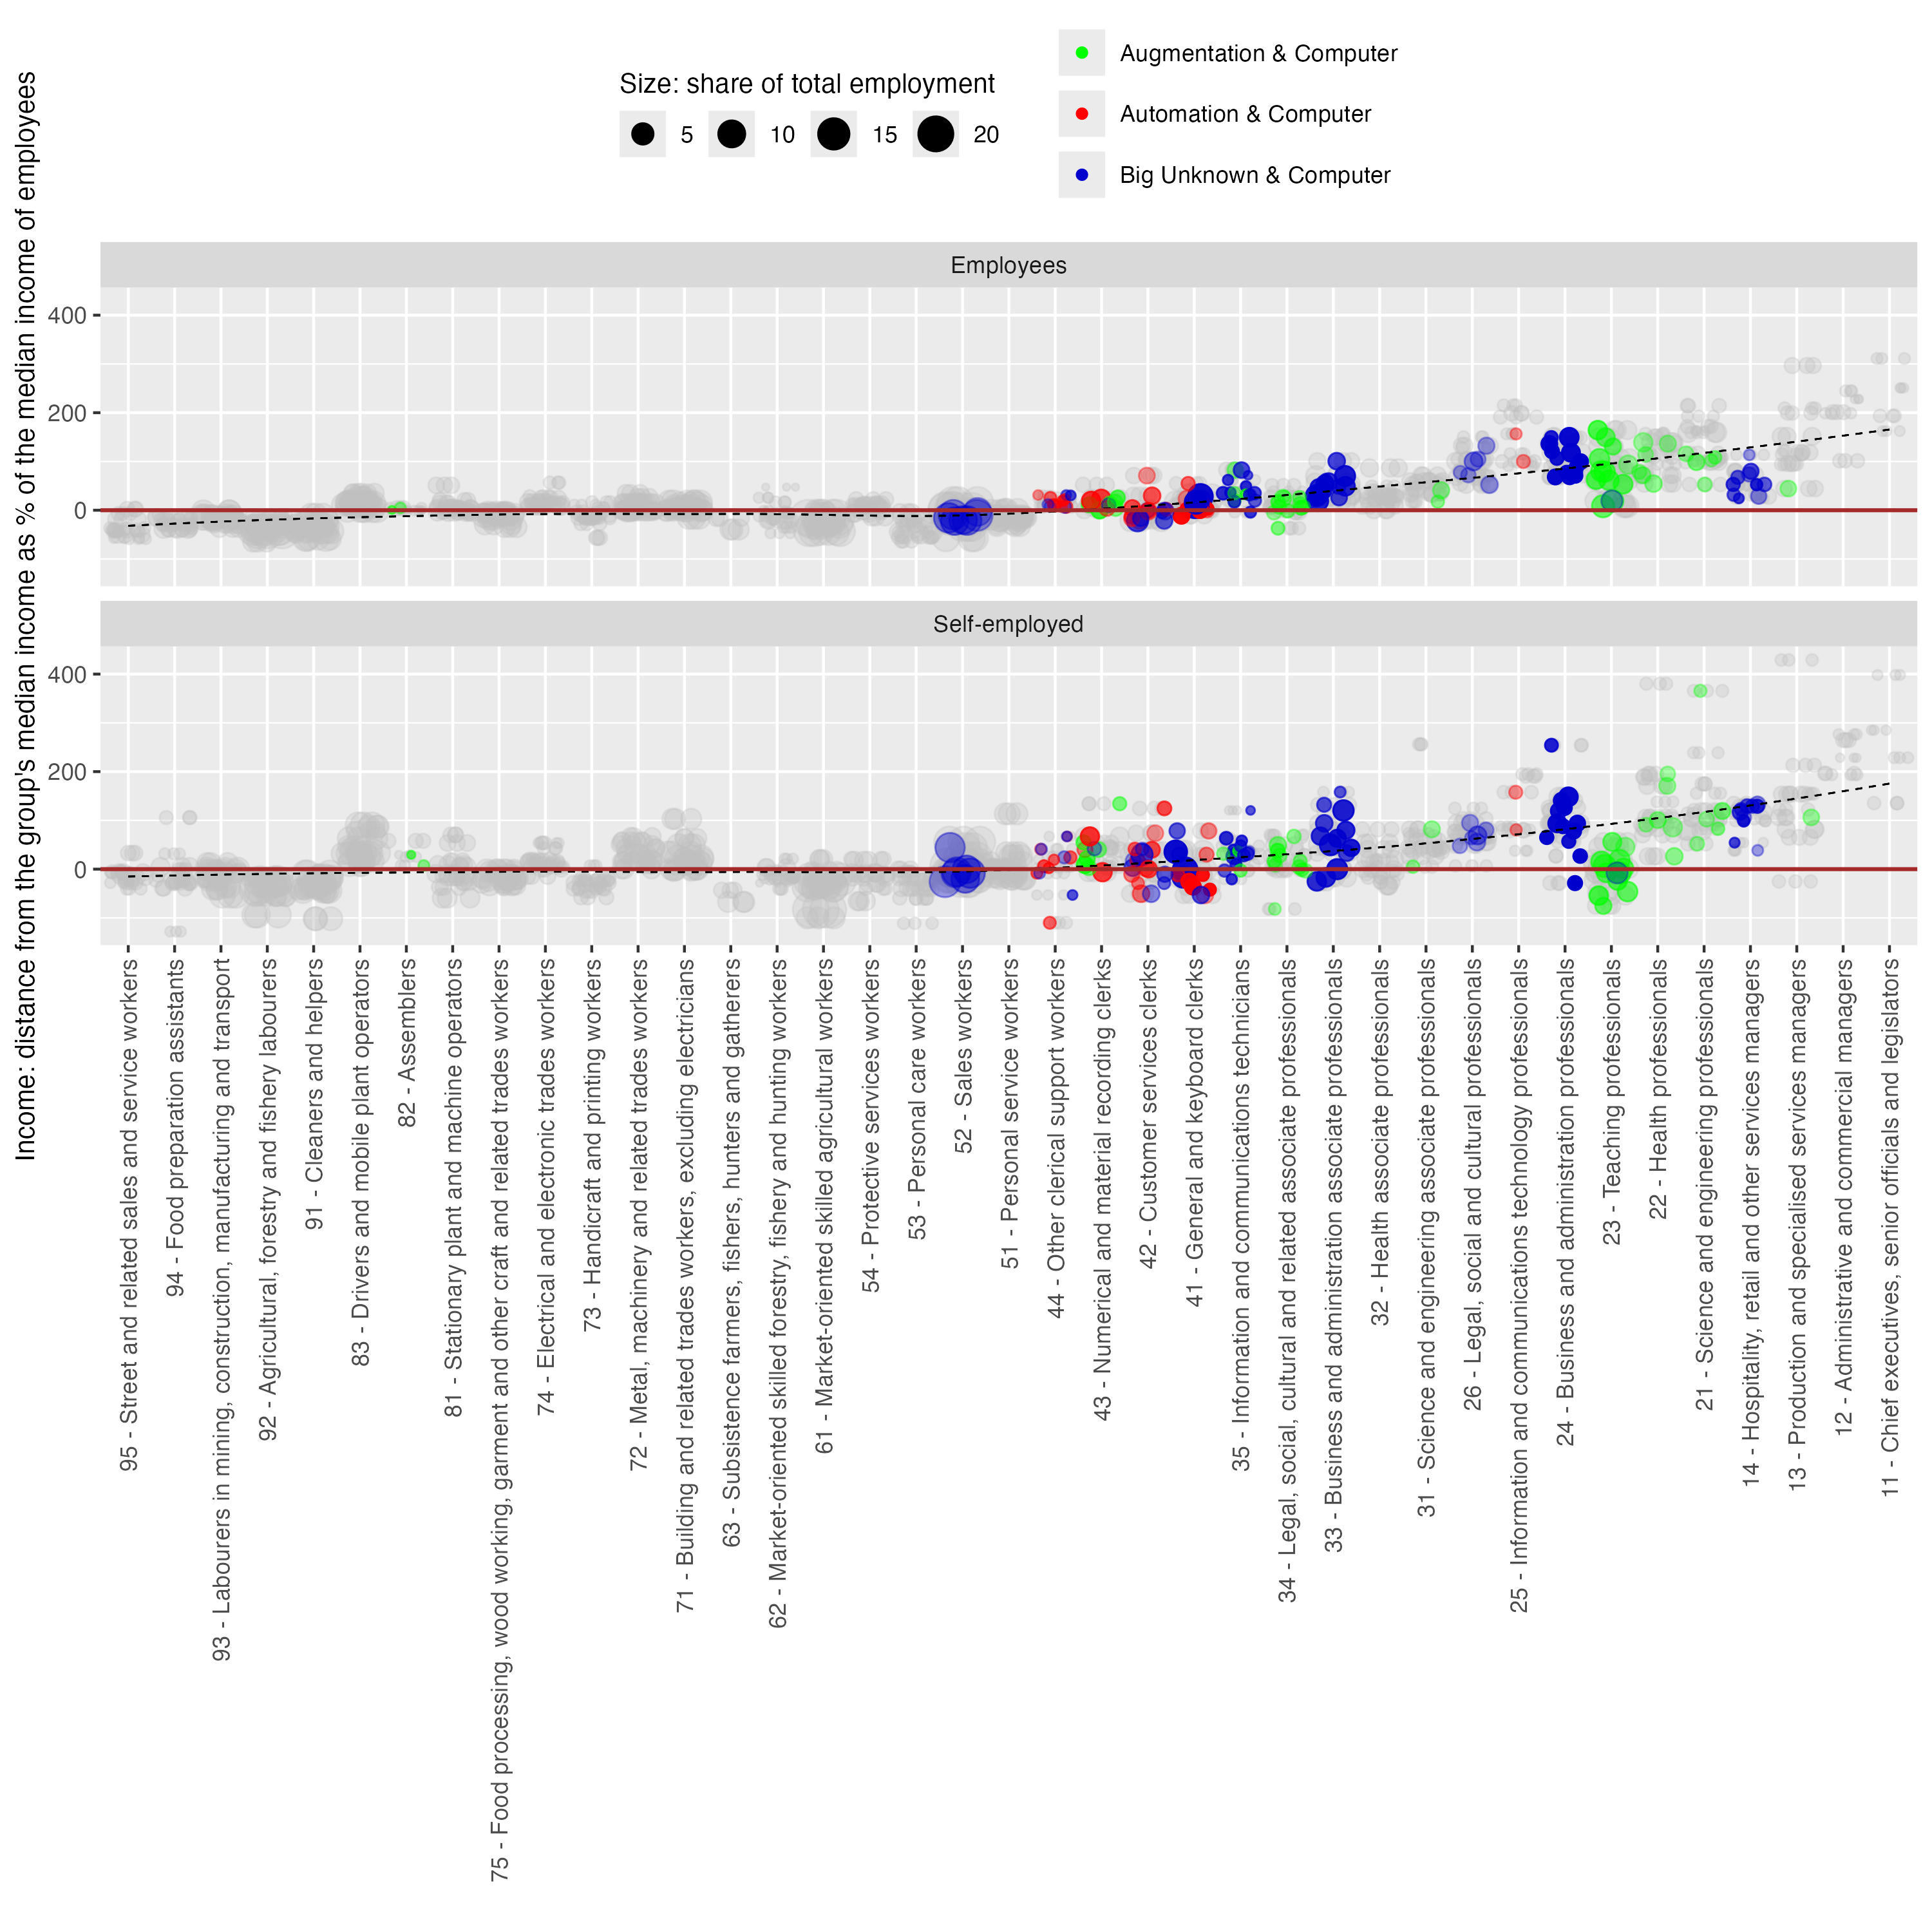
Note: Incomes were calculated as the median income in local currency of each ISCO-08 occupation, based on the latest available survey data for each country. They were then recalculated as a distance from each group’s (employees/self-employed) median income and normalized as a share of the median income of employees in each country, which provides a common reference point. Grey dots represent all occupations for which the sample size and existing data allow for calculation of the median income. Coloured dots represent only these ISCO-08 2-digit occupations where at least 25 percent of occupations in a country within a given 2-digit category are estimated as exposed to automation, augmentation or the big unknown and have a computer at work (theoretical readiness for GenAI-driven transformation).
In Figure 14, we first plot all country-level data points for LAC (grey dots), with the size of each dot representing the employment shares. The dots below the horizontal reference line at zero represent occupations with an income below the median income of wage employees in each country. Conversely, dots above that line refer to jobs with income above the median income of wage employees, with the lack dotted line representing the overall trend of higher incomes accruing to jobs with a lower number in the ISCO-08 structure, that is, professional and managerial positions.
Subsequently, we mark the jobs that are exposed to an immediate interaction with GenAI, that is, occupations within the categories of automation, augmentation and the big unknown, which report already using a computer at work. We highlight only these occupations in each country where at least a quarter of jobs in a 2-digit category falls into one type of exposure, with exposure types marked in colours and the share of employment reflected in the size of each marker.
We can observe that, in the case of wage employees, nearly all exposed occupations are either around or above the median income, whereas for self-employed we see more occupations with below-median incomes. The exposure to automation is generally grouped around occupations with an income between the median and an equivalent of two median incomes, with only some of the information and communication jobs exceeding that threshold. Occupations with a high augmentation potential are generally grouped around the higher income bracket of somewhere between 1.5 to 3 values of the median income of wage employees. The category of big unknown is more spread across the income distribution, with some self-employed sales workers below the median level and the top earners around three median incomes.
In the bigger picture, Figure 14 shows that most of the exposed categories concern jobs around what could be defined as middle- and upper-middle income jobs, with hardly any occupations showing significant exposure among the low-income occupations. In other words, the main thrust of the first order effects of GenAI technologies can be expected among the people who already have high incomes and who are in jobs requiring relatively higher skill levels, while the jobs of the poor are quite likely to remain outside the immediate effects of this technological transition.
Final discussion
This study examines the exposure to GenAI within the labour markets of the LAC region, revealing both widespread potential impacts and significant variability across different demographics and sectors. Our findings indicate that a substantial proportion – between 30 and 40 percent of employment in LAC – is exposed in some way to GenAI. This exposure is linked with the economic status of countries, suggesting that income levels are a strong correlate of GenAI’s impact on labour markets. However, it is crucial to note that such exposure does not imply automation, and that for the vast majority of these jobs, the potential lies in transforming the tasks that these occupations perform. Our estimates for the potential effects of automation in LAC amount to 2 to 5 percent of employment depending on the country. These figures, while seemingly modest, should not be trivialized as they represent individuals’ livelihoods that are at stake. In addition, some of the jobs from the large category of “the big unknown” might move closer to automation over time, as the technology and its applications to workplace tasks develop further.
Comparisons of our results to other studies are complicated, due to the significant differences in the concepts applied, occasional lack of detailed data that would enable a more precise assessment, diverging methods of presenting the findings, and the general scarcity of studies that cover non-HIC countries
Within this context, irrespective of country-specific differences, our estimations show that certain characteristics consistently correlate with higher GenAI exposure. Specifically, urban-based jobs that require higher education, are situated in the formal sector, and are held by individuals with higher relative incomes are more likely to come into interaction with this technology. Moreover, there is a pronounced tilt towards younger workers facing greater exposure, including the risk of job automation, in particular in the finance, insurance, and public administration sectors. While these groups might also be better positioned to reap the benefits of new technologies
These findings suggest an important role for government interventions, aimed at minimizing disruptions resulting from sudden job losses through job protection measures, and maximizing the productive benefits of the transition, for example through equipping workers with foundational skills that can help them keep up with the changing character of jobs and drive the productive character of such changes, rather than see their skills become obsolete. The fact that some vulnerable groups, such as women and youth, face greater exposure to automation highlights the importance of life-long learning so that that workers have the skills to adapt to changes in the world of work. In the short-term, as shown in numerous ILO studies, social protection systems can play an important role as macroeconomic shock stabilizers, and reduce the impact of transitions for the affected workers and their households at the microeconomic level
At the same time, our findings show that the shares of jobs that could benefit from a productive transformation with GenAI are consistently higher than those with automation risks across all LAC countries, ranging between 8 and 12 percent of employment across countries. This is particularly the case for the jobs in education, health and personal services. In addition, the sectors oriented towards customer service (retail, trade, hotels, restaurants, etc.) face an elevated exposure to "the big unknown", which means that a productive augmentation could also be sought in these jobs with the right policies and incentives in place. Therefore, a tempting narrative that can be constructed based on these statistics is that, in the big picture, more can be gained than lost as a net job and economic effect of the transformation.
This is where our analysis provides new information to assess whether the lack of digital infrastructure could be a buffer or a bottleneck to reap the economic benefits of GenAI. On the one hand, our findings show that most workers exposed to GenAI automation are using digital technologies, which suggests that the potential negative effects may not take long to materialize. On the other hand, we find that inadequate digital infrastructure is a major bottleneck to realizing the positive effects of augmentation, thereby impacting a significant segment of the labour force in the LAC region. Nearly half of the occupations that could potentially benefit from augmentation are hampered by digital shortcomings that will prevent them from realizing that potential. Specifically, 6.24 percent of jobs held by women and 6.22 percent of those held by men are affected due to these gaps. Similar limitations apply to the jobs in the “big unknown” category: even though some of them could potentially pivot towards augmentation through increasing complementarity between GenAI and the worker in these occupations, the digital gaps will prevent large shares of these jobs from benefitting from such a scenario.
The extension of our finding is that the influence of digital divides would likely be even more stark in regions of lower economic development than LAC, which underlines the need for equalizing digital access in developing countries. Policies to achieve such goal should include not only those related to digital infrastructure, but also those that aim to strengthen the incentives to adopt digital technologies for a productive use
Finally, while this study provides a detailed overview of the LAC region, it is not without limitations, some of which can be considered as open avenues for future inquiry. The first of those concerns data on the use of computers and internet at work, for which the imputation from PIACC was the best available strategy in our case. Obtaining new survey data for at least the most exposed occupations would surely offer more precision to future estimates in that regard. In the absence of such data, imputation based on the second cycle of OECD’s PIAAC, covering 2022-23, might be a viable option, as soon as such data become publicly available. Second, more could be done to understand how the task content of occupations varies across countries and in systematizing such differences according to income groups and possibly regional characteristics beyond LAC. Third, future studies could try to obtain more fine-grained characteristics of individuals’ internet access, since network latency, reliability or type of devices used may affect the adoption and impacts of GenAI by workers.41 Accordingly, we will continue our efforts to collect data on firms’ and workers’ adoption of GenAI in developing countries, in order to validate the exposure measures developed in this study and to adapt our policy responses to more detailed findings. In that regard, we would welcome collaboration with institutions, including national administrations, that might be able to assist us in the collection of such data for future research.
Appendix
Figure A
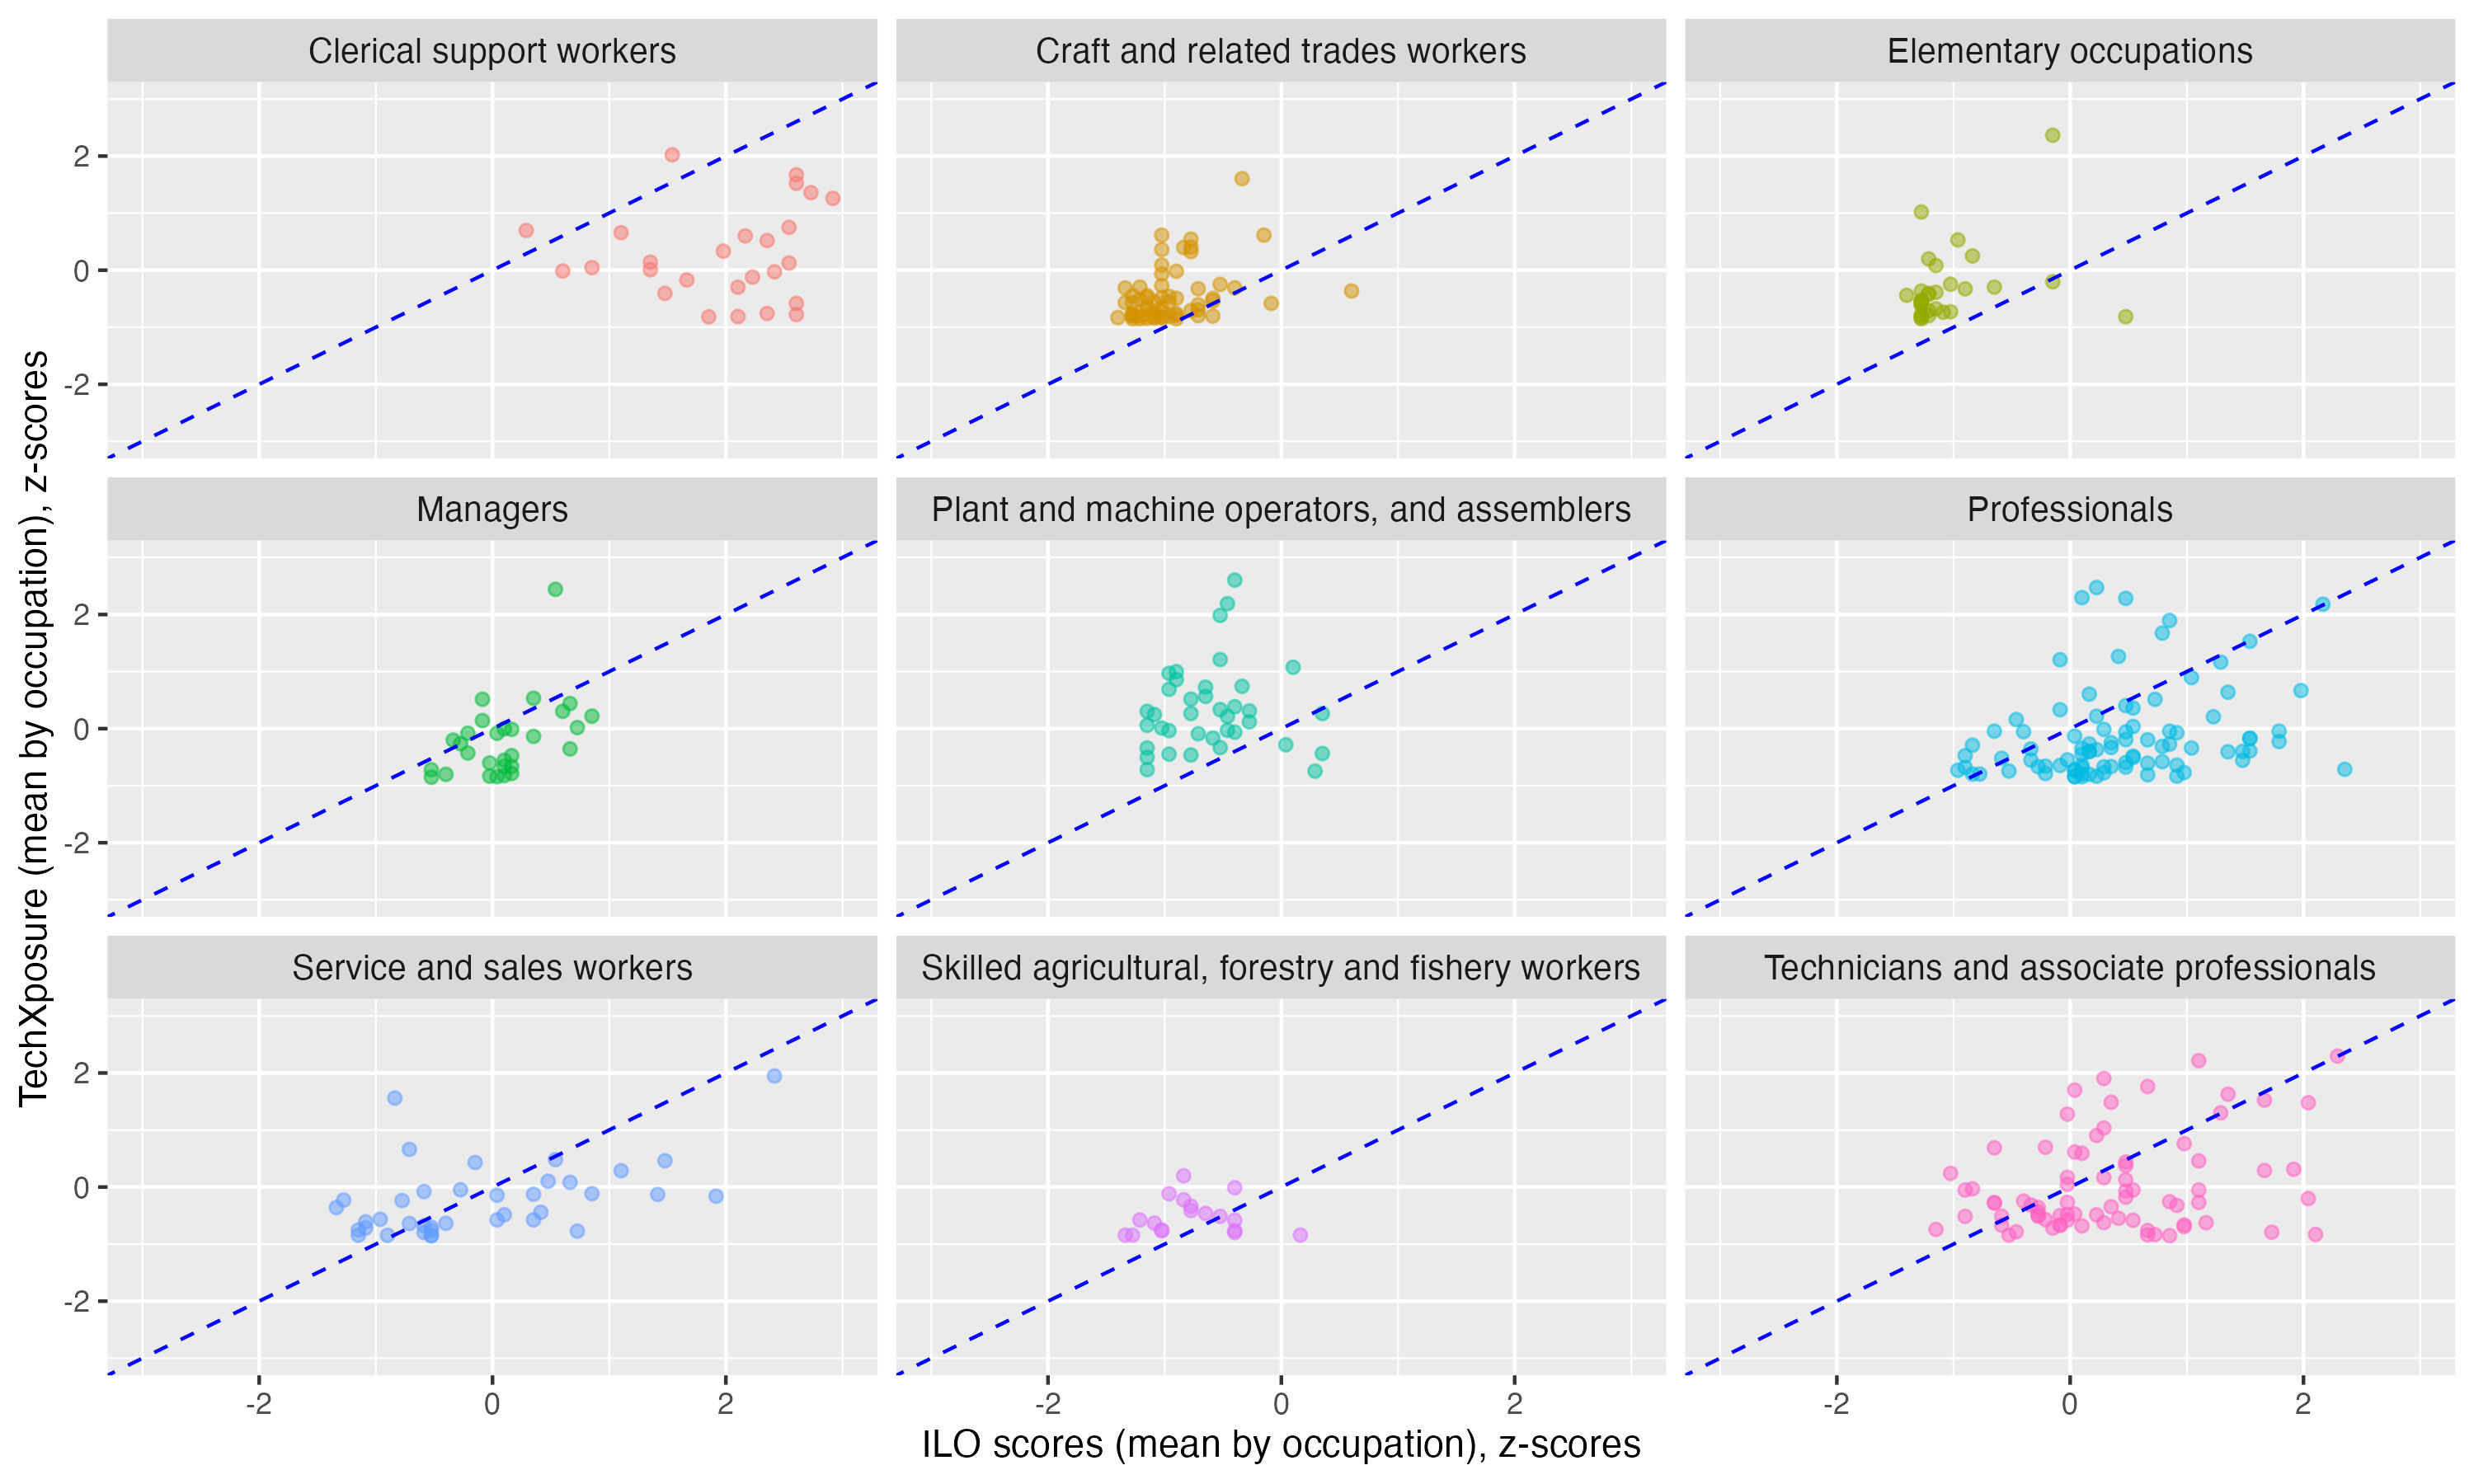
Figure A 2. Comparison of Felten et al. (2023) ML scores vs GBB scores (z-scores)
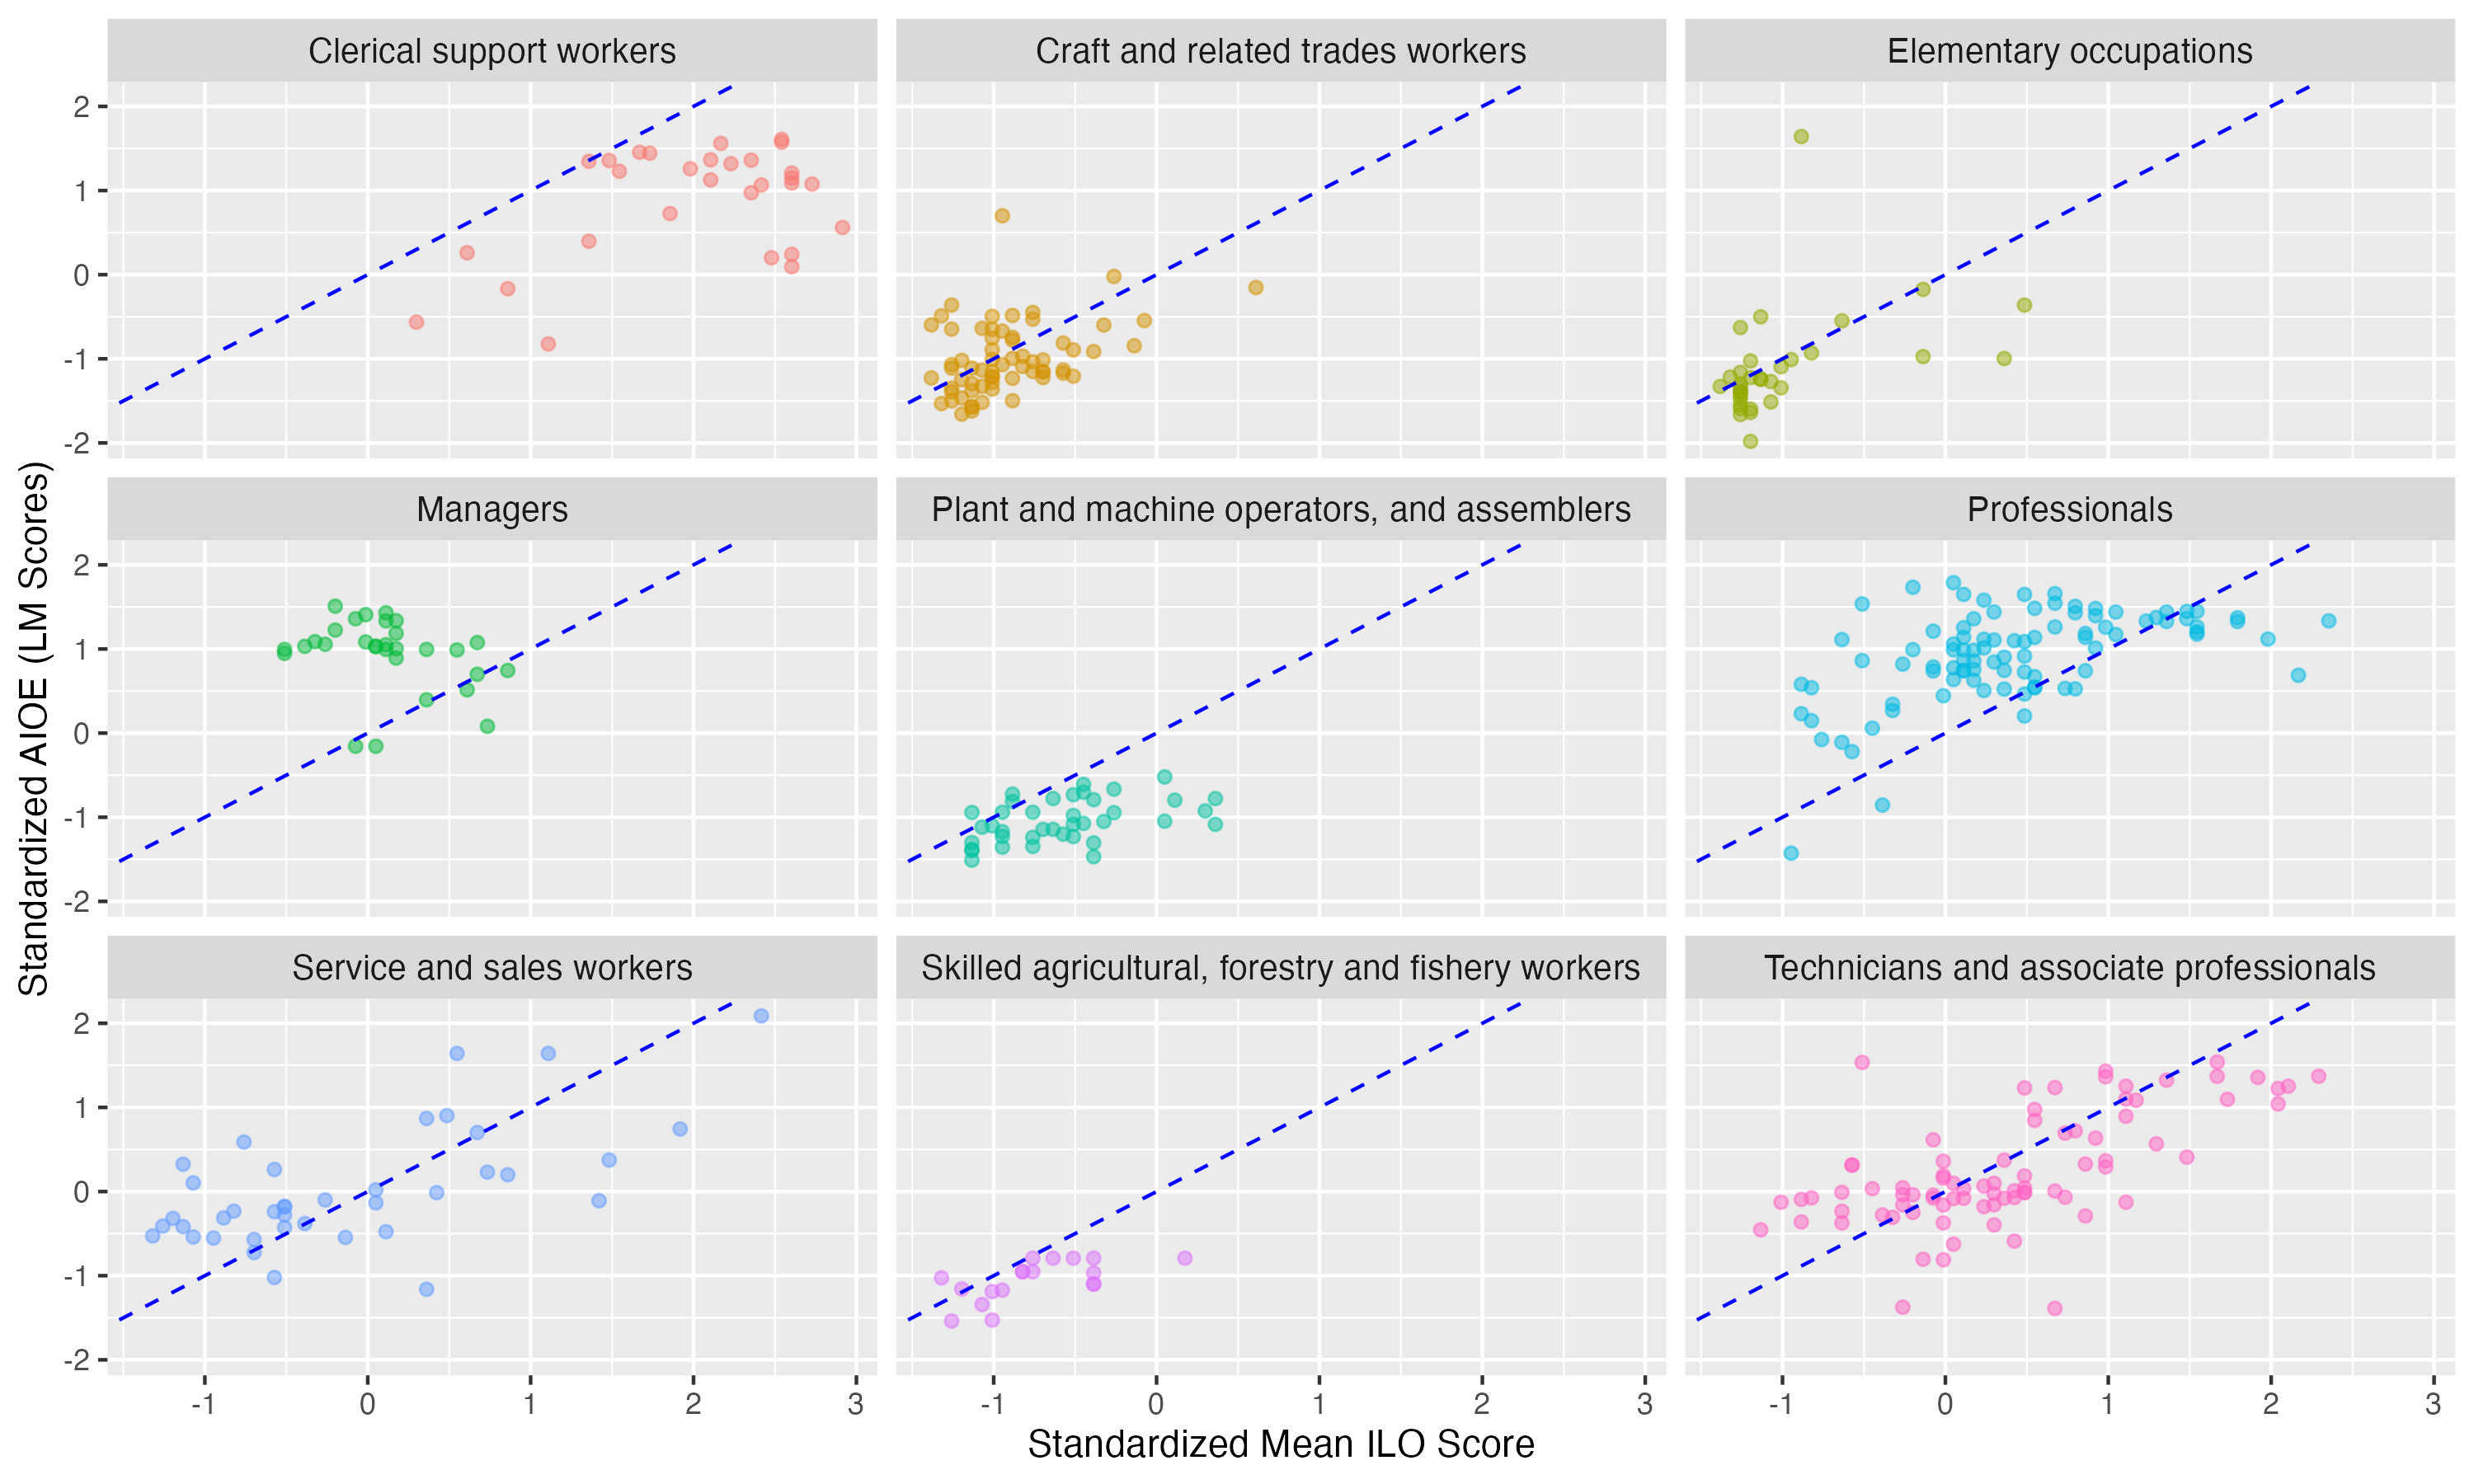
Figure A 3. Labour market distribution in LAC countries by ISCO-08 2-digit occupations and sex
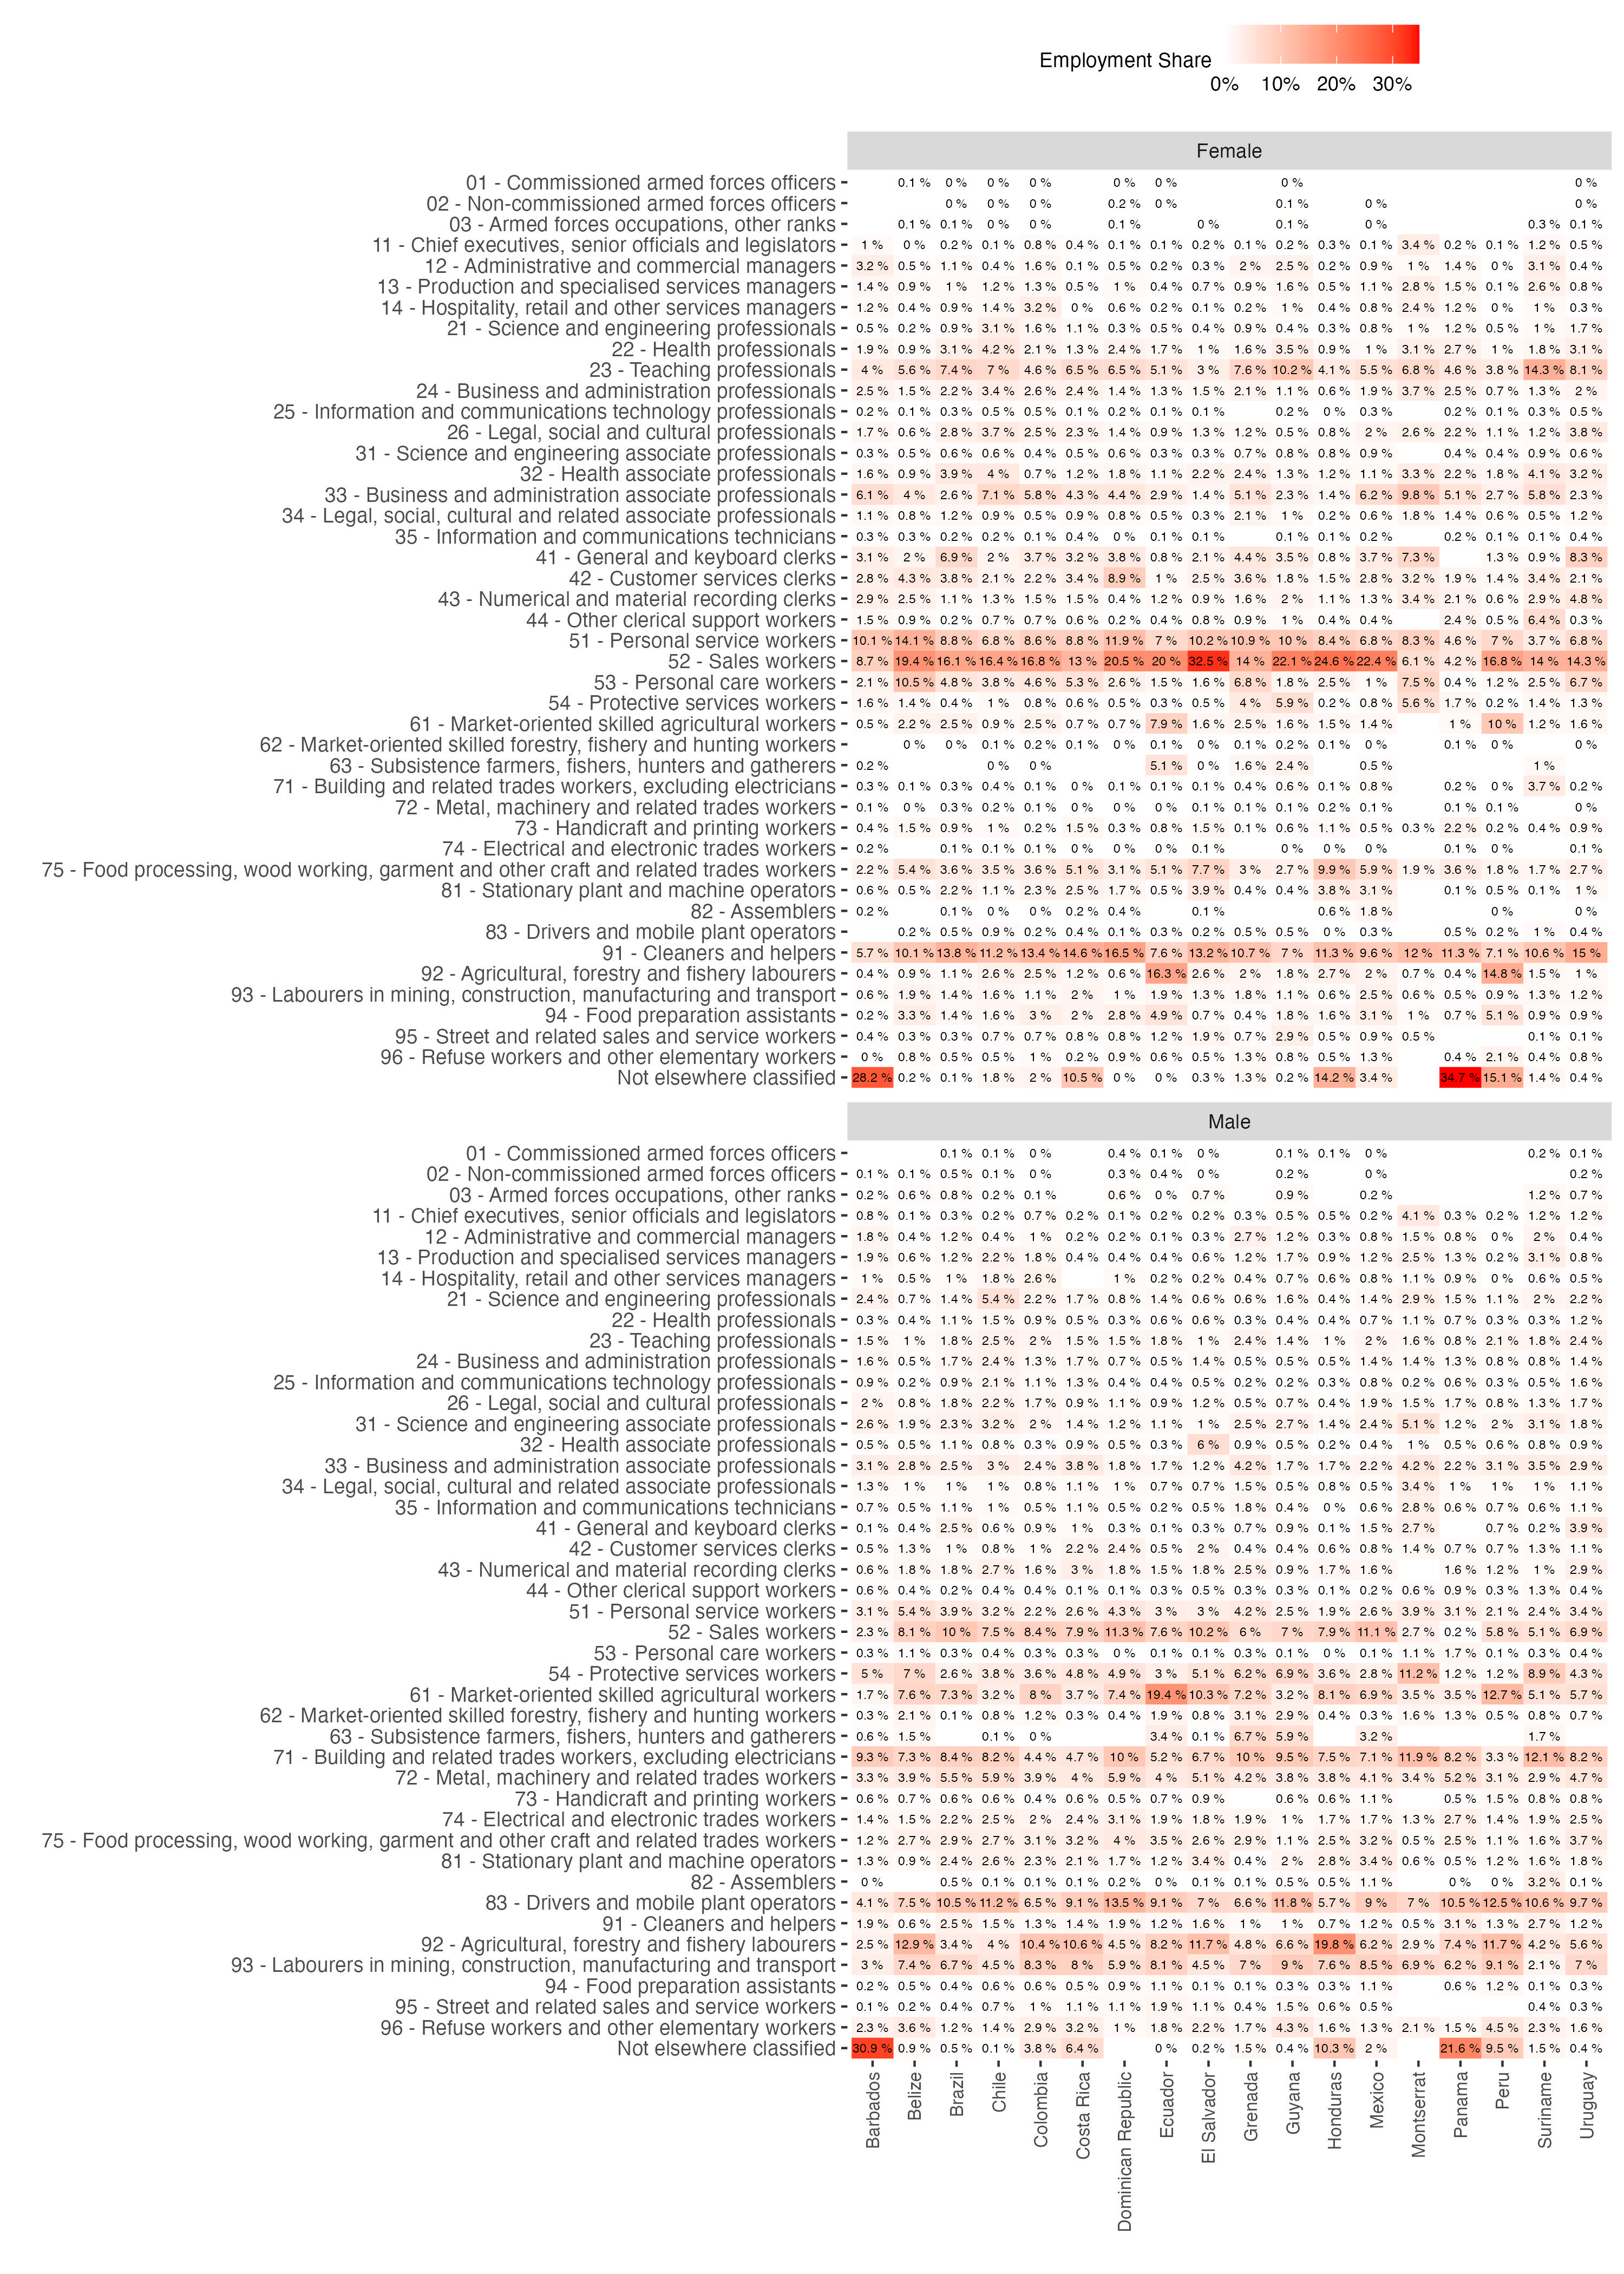
Figure A 4. Ranking of countries by the type of GenAI exposure
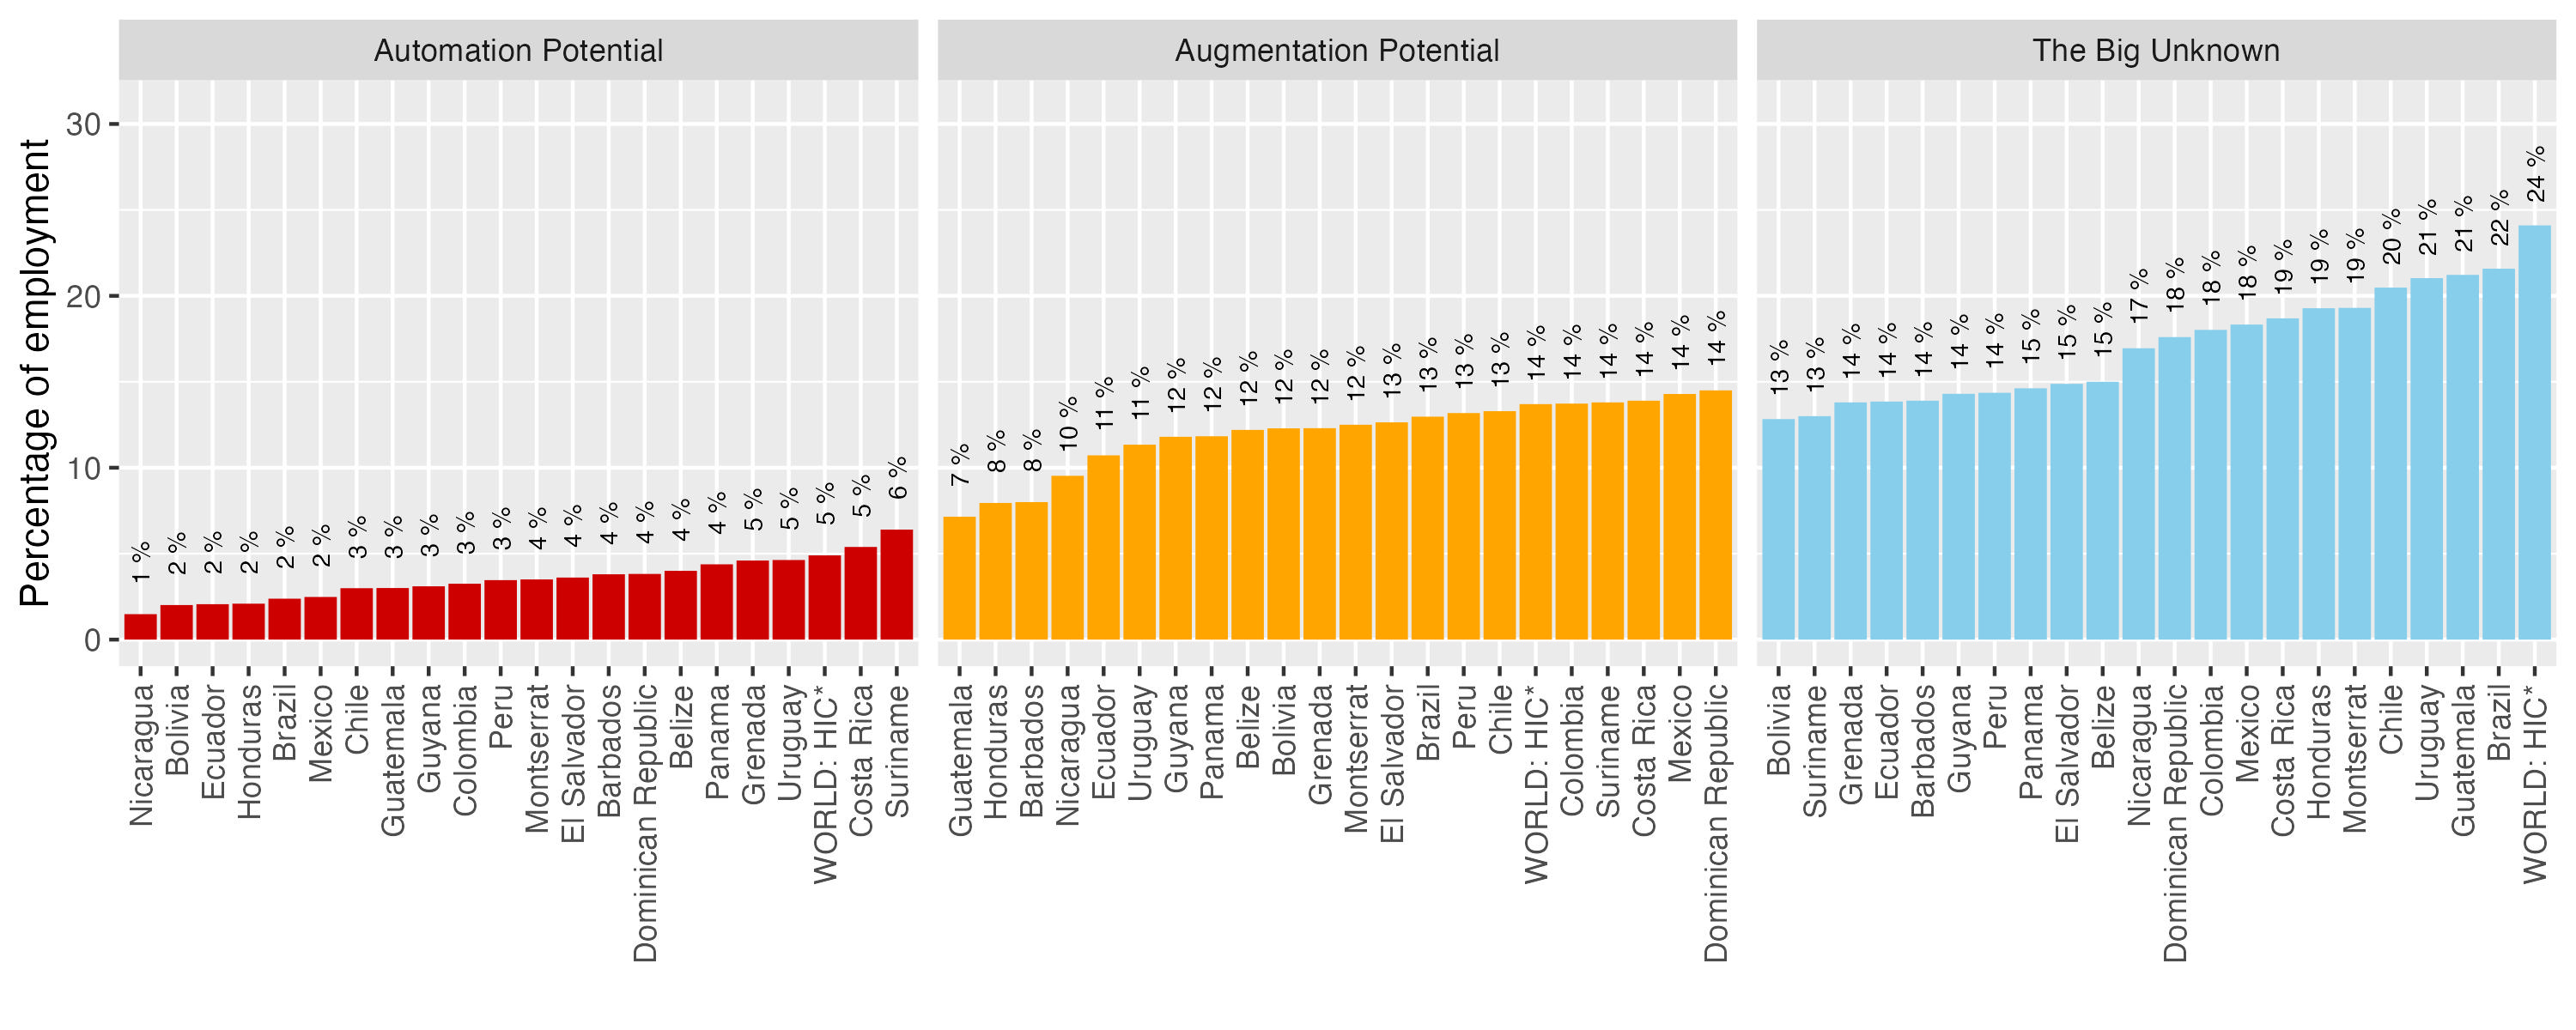
Figure A 5. Comparison of results on computer use between PIAAC (at work) and SEDLAC (at home) - augmentation category
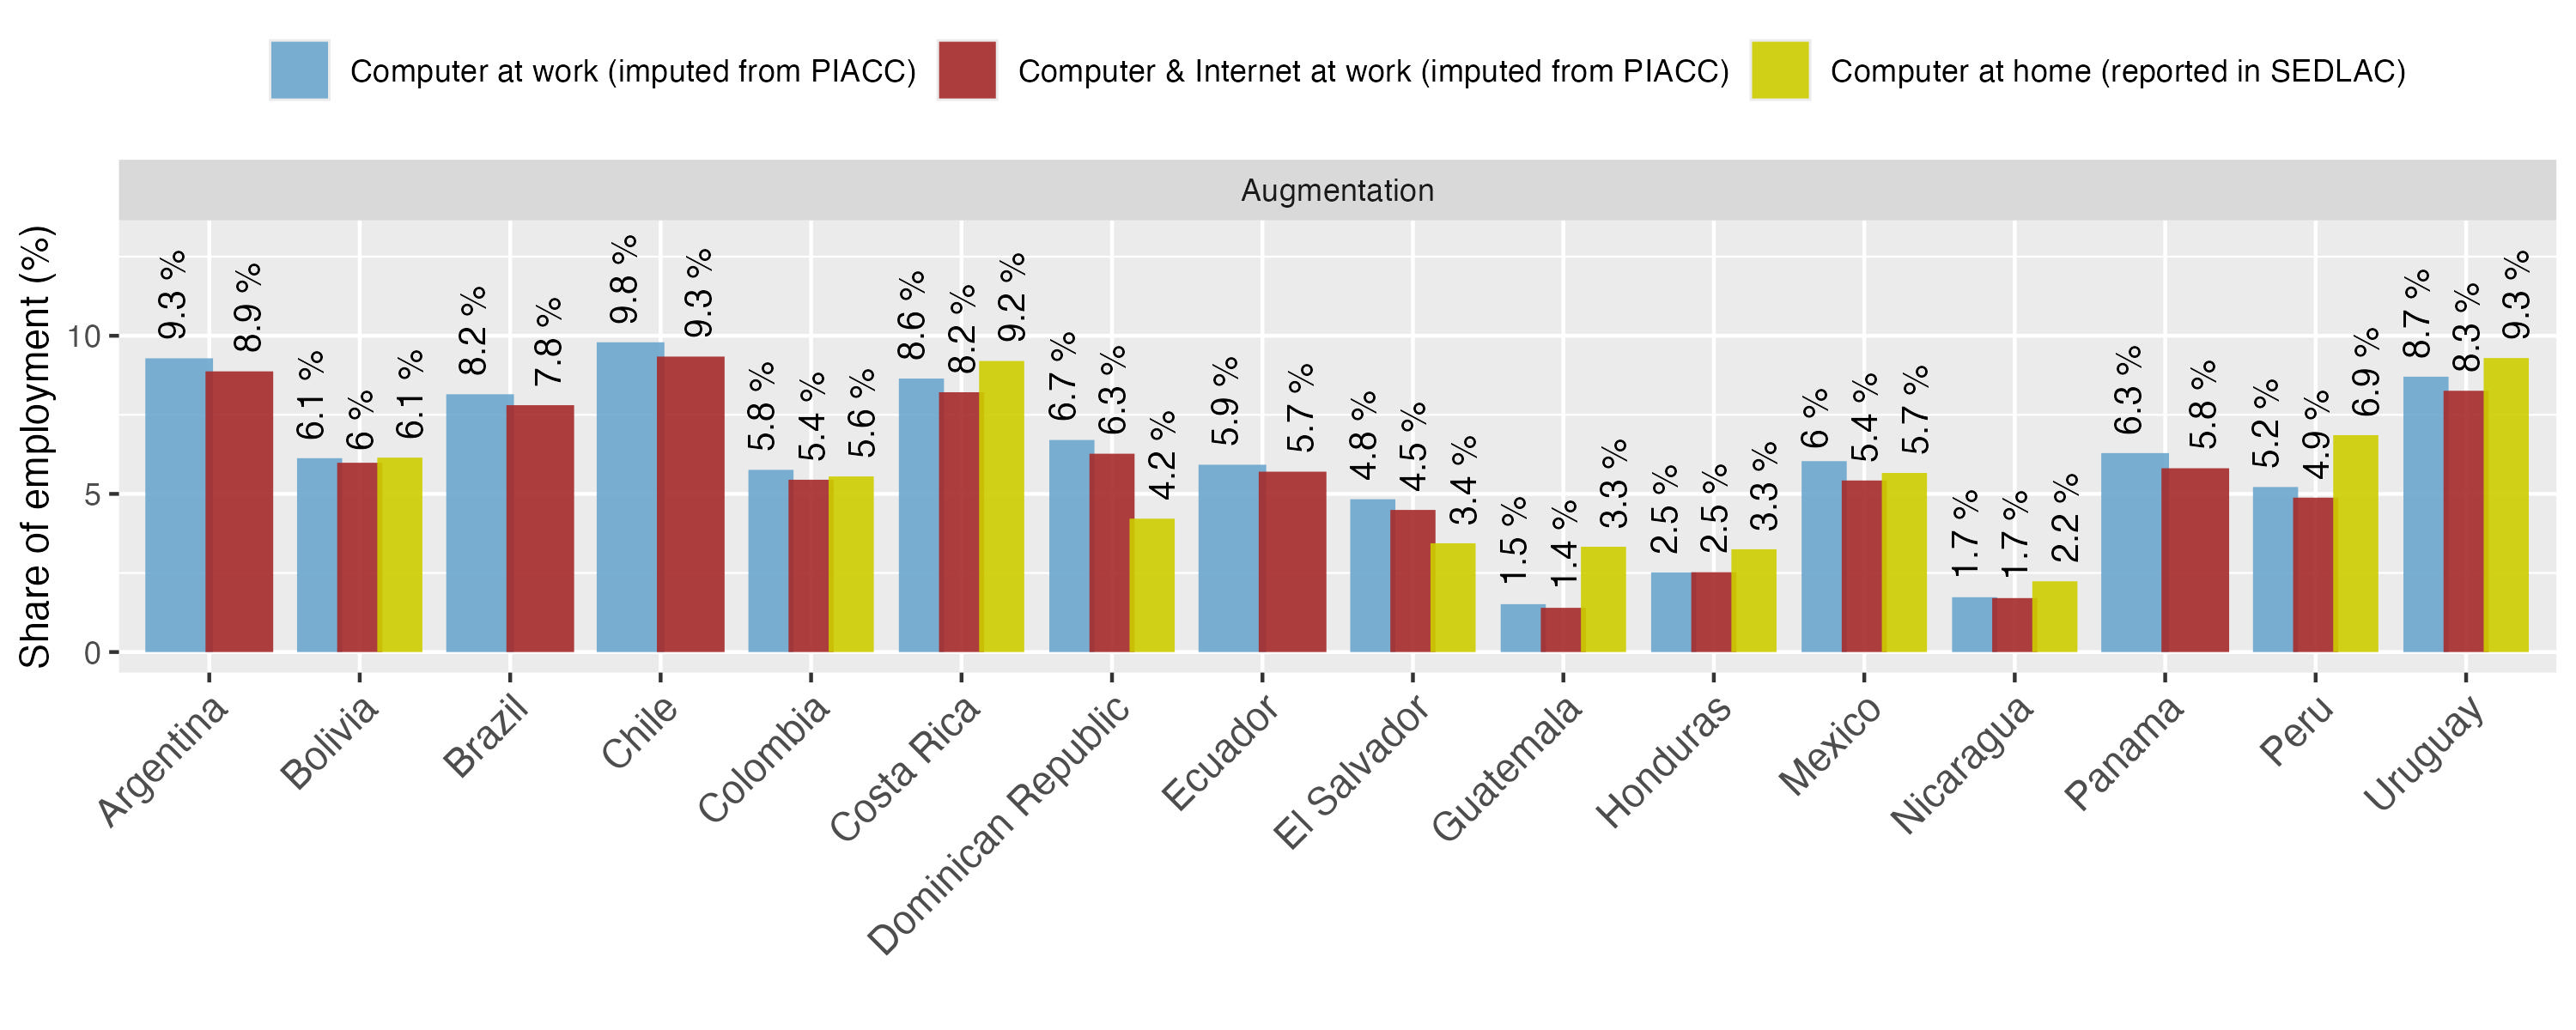
Figure A 6. Jobs in augmentation category that do not use a computed at work: totals by country
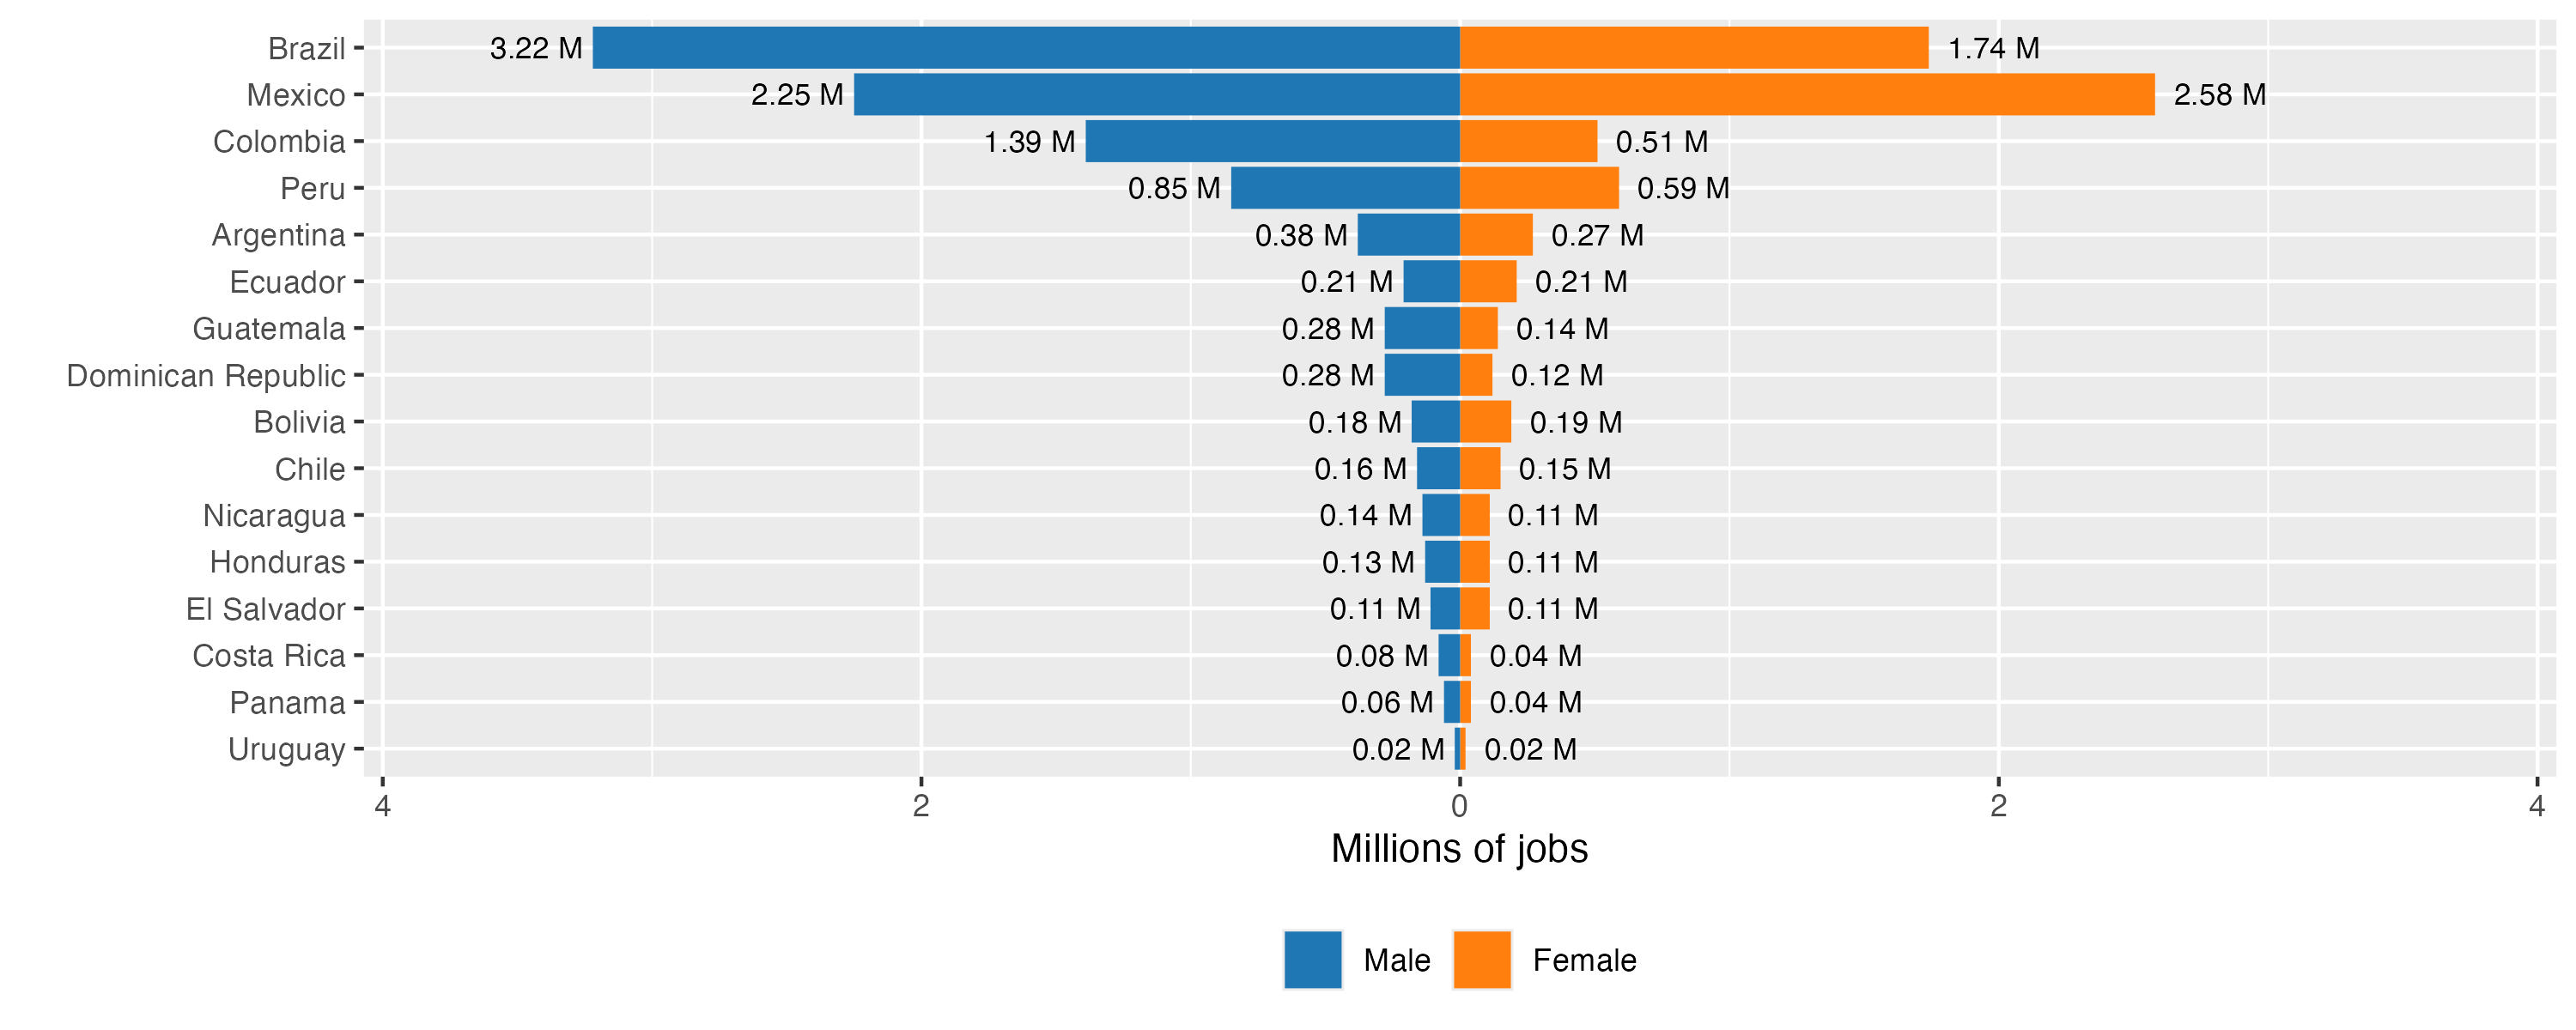
Table A
|
Country |
Year |
Observations (Total) |
Observations (for AI Exposure) |
|---|---|---|---|
|
Argentina |
2021 |
98,822 |
37,640 |
|
Bolivia |
2021 |
42,090 |
17,721 |
|
Brazil |
2021 |
335,100 |
128,907 |
|
Chile |
2022 |
202,231 |
75,936 |
|
Colombia |
2019 |
756,063 |
316,870 |
|
Costa Rica |
2019 |
34,863 |
13,690 |
|
Dominican Republic |
2021 |
76,071 |
30,816 |
|
Ecuador |
2021 |
30,026 |
13,480 |
|
Guatemala |
2014 |
54,837 |
18,798 |
|
Honduras |
2019 |
24,094 |
8,903 |
|
Mexico |
2018 |
269,206 |
116,312 |
|
Nicaragua |
2014 |
29,443 |
11,870 |
|
Panama |
2018 |
39,218 |
16,395 |
|
Peru |
2021 |
114,239 |
55,524 |
|
El Salvador |
2021 |
64,937 |
26,036 |
|
Uruguay |
2021 |
28,312 |
12,034 |
|
Total |
|
2,199,552 |
900,932 |
Table A
|
Dependent Variable |
||
|
Computer at work |
Computer & Internet at work |
|
|
isco_2d_c12 |
0.926*** |
0.991*** |
|
isco_2d_c13 |
0.0273 |
0.0875 |
|
isco_2d_c14 |
-0.705*** |
-0.654*** |
|
isco_2d_c21 |
0.517** |
0.383** |
|
isco_2d_c22 |
-0.548*** |
-0.822*** |
|
isco_2d_c23 |
-0.686*** |
-0.686*** |
|
isco_2d_c24 |
1.690*** |
1.669*** |
|
isco_2d_c25 |
3.406*** |
2.387*** |
|
isco_2d_c26 |
-0.279 |
-0.292* |
|
isco_2d_c31 |
-0.966*** |
-1.118*** |
|
isco_2d_c32 |
-0.873*** |
-1.155*** |
|
isco_2d_c33 |
0.674*** |
0.614*** |
|
isco_2d_c34 |
-1.426*** |
-1.320*** |
|
isco_2d_c35 |
1.162*** |
1.083*** |
|
isco_2d_c41 |
0.916*** |
0.413** |
|
isco_2d_c42 |
0.211 |
-0.247 |
|
isco_2d_c43 |
-0.419** |
-0.661*** |
|
isco_2d_c44 |
-0.819*** |
-1.076*** |
|
isco_2d_c51 |
-2.765*** |
-2.843*** |
|
isco_2d_c52 |
-1.804*** |
-2.059*** |
|
isco_2d_c53 |
-2.494*** |
-2.487*** |
|
isco_2d_c54 |
-1.903*** |
-2.143*** |
|
isco_2d_c61 |
-3.177*** |
-3.091*** |
|
isco_2d_c62 |
-3.201*** |
-3.169*** |
|
isco_2d_c63 |
-4.218*** |
-4.145*** |
|
isco_2d_c71 |
-3.570*** |
-3.525*** |
|
isco_2d_c72 |
-2.480*** |
-2.735*** |
|
isco_2d_c73 |
-2.011*** |
-2.246*** |
|
isco_2d_c74 |
-1.969*** |
-1.945*** |
|
isco_2d_c75 |
-2.967*** |
-3.098*** |
|
isco_2d_c81 |
-2.734*** |
-3.351*** |
|
isco_2d_c82 |
-2.796*** |
-3.458*** |
|
isco_2d_c83 |
-3.276*** |
-3.530*** |
|
isco_2d_c91 |
-4.347*** |
-4.434*** |
|
isco_2d_c92 |
-4.291*** |
-4.386*** |
|
isco_2d_c93 |
-3.234*** |
-3.657*** |
|
isco_2d_c94 |
-3.887*** |
-3.966*** |
|
isco_2d_c95 |
-3.527*** |
-3.669*** |
|
isco_2d_c96 |
-3.303*** |
-3.538*** |
|
Age 25-34 |
0.225*** |
0.316*** |
|
Age 35-44 |
0.134*** |
0.272*** |
|
Age 45-54 |
-0.162*** |
-0.00339 |
|
Age 55-64 |
-0.493*** |
-0.333*** |
|
Female |
-0.231*** |
-0.298*** |
|
High Education |
0.893*** |
0.948*** |
|
log_gdp |
0.240*** |
0.0915** |
|
internet_users_rate |
2.811*** |
2.995*** |
|
broadband_rate |
3.404*** |
2.993*** |
|
Constant |
-3.377*** |
-2.172*** |
|
Observations |
112,112 |
112,112 |
|
Note: SE not reported to preserve presentation space – available upon request. |
||
Table A
|
|
Dependent Variable: AI Exposure |
||
|
|
Augmentation |
Automation |
Big Unknown |
|
|
|
|
|
|
Female |
-0.0313*** |
0.0362*** |
0.0770*** |
|
|
(0.00139) |
(0.000949) |
(0.00181) |
|
Urban |
2.81e-05 |
0.00615*** |
-0.00636*** |
|
|
(0.00165) |
(0.000717) |
(0.00185) |
|
Age 25-34 |
-0.0105*** |
-0.00617*** |
0.00144 |
|
|
(0.00187) |
(0.00122) |
(0.00231) |
|
Age 35-44 |
-0.0104*** |
-0.0160*** |
0.00173 |
|
|
(0.00189) |
(0.00122) |
(0.00235) |
|
Age 45-54 |
-0.00920*** |
-0.0191*** |
-0.00332 |
|
|
(0.00204) |
(0.00123) |
(0.00244) |
|
Age 55-64 |
-0.0129*** |
-0.0159*** |
-0.00331 |
|
|
(0.00227) |
(0.00130) |
(0.00271) |
|
Medium Education |
0.0110*** |
0.0184*** |
0.0406*** |
|
|
(0.00141) |
(0.000623) |
(0.00167) |
|
High Education |
0.0497*** |
0.0203*** |
0.129*** |
|
|
(0.00211) |
(0.00131) |
(0.00263) |
|
Q2 income quintile |
6.84e-05 |
-0.00187*** |
0.0119*** |
|
|
(0.00157) |
(0.000717) |
(0.00187) |
|
Q3 income quintile |
0.00306* |
0.00289*** |
0.0251*** |
|
|
(0.00165) |
(0.000860) |
(0.00204) |
|
Q4 income quintile |
0.00826*** |
0.00768*** |
0.0410*** |
|
|
(0.00183) |
(0.000997) |
(0.00225) |
|
Q5 income quintile |
0.00768*** |
0.00692*** |
0.0640*** |
|
|
(0.00208) |
(0.00128) |
(0.00259) |
|
Informal (legal definition) |
-0.0138*** |
-0.0187*** |
-0.0186*** |
|
|
(0.00149) |
(0.000874) |
(0.00172) |
|
Employer |
-0.0223*** |
0.00580*** |
0.0205*** |
|
|
(0.00309) |
(0.00134) |
(0.00524) |
|
Salaried Workers |
0.0130*** |
0.0314*** |
-0.0409*** |
|
|
(0.00216) |
(0.00107) |
(0.00348) |
|
Self-employed |
0.0168*** |
0.00915*** |
-0.0325*** |
|
|
(0.00225) |
(0.00104) |
(0.00357) |
|
Low tech. Industries |
0.0459*** |
-0.0157*** |
0.0392*** |
|
|
(0.00215) |
(0.00129) |
(0.00261) |
|
Other industries |
0.0846*** |
-0.00724*** |
0.0405*** |
|
|
(0.00327) |
(0.00146) |
(0.00341) |
|
Construction |
-0.00372** |
-0.00328*** |
0.0222*** |
|
|
(0.00159) |
(0.000812) |
(0.00192) |
|
Retail, wholesale trade, restaurants, hotels, etc. |
0.111*** |
-0.00104 |
0.329*** |
|
|
(0.00187) |
(0.000840) |
(0.00257) |
|
Elect., gas, water, transp., communication |
0.147*** |
0.0227*** |
0.0721*** |
|
|
(0.00288) |
(0.00153) |
(0.00274) |
|
Banks, finance, insurance, professional ss. |
0.0693*** |
0.0856*** |
0.191*** |
|
|
(0.00260) |
(0.00250) |
(0.00353) |
|
Public Adm., defence |
0.0571*** |
0.0339*** |
0.145*** |
|
|
(0.00301) |
(0.00257) |
(0.00424) |
|
Education, Health, personal services |
0.295*** |
-0.0161*** |
0.0155*** |
|
|
(0.00298) |
(0.00127) |
(0.00259) |
|
Domestic ss. |
0.0467*** |
-0.0422*** |
-0.0632*** |
|
|
(0.00217) |
(0.00116) |
(0.00230) |
|
Constant |
0.0193*** |
-0.0118*** |
0.0297*** |
|
|
(0.00304) |
(0.00150) |
(0.00431) |
|
|
|
|
|
|
Country and year fixed effects |
Yes |
Yes |
Yes |
|
Mean of dependent variable |
0.1203 |
0.0323 |
0.1821 |
|
Observations |
888,685 |
888,685 |
888,685 |
|
R2 |
0.139 |
0.076 |
0.228 |
References
Acemoglu, D., 2024. The Simple Macroeconomics of AI. Mass. Inst. Technol.
Acemoglu, D., Anderson, G., Beede, D., Buffington, C., Childress, E., Dinlersoz, E., Foster, L., Goldschlag, N., Haltiwanger, J., Kroff, Z., Restrepo, P., Zolas, N., 2023. Advanced Technology Adoption: Selection or Causal Effects? AEA Pap. Proc. 113, 210–214. https://doi.org/10.1257/pandp.20231037
Acemoglu, D., Anderson, G.W., Beede, D.N., Buffington, C., Childress, E.E., Dinlersoz, E., Foster, L.S., Goldschlag, N., Haltiwanger, J.C., Kroff, Z., Restrepo, P., Zolas, N., 2024. Automation and the Workforce: A Firm-Level View from the 2019 Annual Business Survey. NBER Chapters.
Acemoglu, D., Restrepo, P., 2022. Tasks, Automation, and the Rise in U.S. Wage Inequality. Econometrica 90, 1973–2016. https://doi.org/10.3982/ECTA19815
Acemoglu, D., Restrepo, P., 2018. Artificial Intelligence, Automation and Work (No. w24196). National Bureau of Economic Research. https://doi.org/10.3386/w24196
Adams-Prassl, J., Abraha, H., Kelly-Lyth, A., Silberman, M. ‘Six’, Rakshita, S., 2023. Regulating algorithmic management: A blueprint. Eur. Labour Law J. 14, 124–151. https://doi.org/10.1177/20319525231167299
Ananian, S., Aubert, P., Behaghel, L., 2006. Travailleurs âgés, nouvelles technologies et changements organisationnels : un réexamen à partir de l’enquête « Reponse ». Suivi d’un commentaire de Luc Behaghel : emploi des seniors - Des effets du changement technologique aux recommandations. Econ. Stat. 397, 21–49. https://doi.org/10.3406/estat.2006.7125
Aubert, P., Caroli, E., Roger, M., 2006. New technologies, organisation and age: firm-level evidence*. Econ. J. 116, F73–F93. https://doi.org/10.1111/j.1468-0297.2006.01065.x
Autor, D., 2024. Applying AI to Rebuild Middle Class Jobs. Working Paper Series. https://doi.org/10.3386/w32140
Autor, D., Dorn, D., Katz, L., Patterson, C., van Reenen, J., 2020. The Fall of the Labor Share and the Rise of Superstar Firms*. Q. J. Econ. 135, 645–709.
Autor, D.H., 2015. Why Are There Still So Many Jobs? The History and Future of Workplace Automation. J. Econ. Perspect. 29, 3–30. https://doi.org/10.1257/jep.29.3.3
Autor, D.H., Katz, L.F., Kearney, M.S., 2008. Trends in U.S. Wage Inequality: Revising the Revisionists. Rev. Econ. Stat. 90, 300–323.
Azevedo, J.P.W.D., Inchauste Comboni, M.G., Sanfelice, V., 2013. Decomposing the recent inequality decline in Latin America. World Bank.
Babina, T., Fedyk, A., He, A., Hodson, J., 2024. Artificial intelligence, firm growth, and product innovation. J. Financ. Econ. 151.
Bakker, B.B., Ghazanchyan, M., Emmerling, J., Vibha, V., 2020. The Lack of Convergence of Latin-America Compared with CESEE: Is Low Investment to Blame? [WWW Document]. IMF. URL https://www.imf.org/en/Publications/WP/Issues/2020/06/19/The-Lack-of-Convergence-of-Latin-America-Compared-with-CESEE-Is-Low-Investment-to-Blame-49519 (accessed 3.26.24).
Brambilla, I., César, A., Falcone, G., Gasparini, L., Lombardo, C., 2023. Routinization and Employment: Evidence for Latin America. Rev. Desarro. Soc. 131–176. https://doi.org/10.13043/DYS.95.4
Brynjolfsson, E., Li, D., Raymond, L.R., 2023. Generative AI at Work. Working Paper Series. https://doi.org/10.3386/w31161
Brynjolfsson, E., Rock, D., Syverson, C., 2021. The Productivity J-Curve: How Intangibles Complement General Purpose Technologies. Am. Econ. J. Macroecon. 13, 333–372. https://doi.org/10.1257/mac.20180386
Carranza, E., Das, S., Kotikula, A., 2023. Gender-Based Employment Segregation: Understanding Causes And Policy Interventions.
Caunedo, J., Keller, E., Shin, Y., 2023. Technology and the Task Content of Jobs across the Development Spectrum. World Bank Econ. Rev. 37, 479–493. https://doi.org/10.1093/wber/lhad015
Cazzaniga, M., Jaumotte, F., Li, L., Melina, G., Augustus J., P., Carlo, P., Emma J., R., Mendes, M., 2024. Gen-AI: Artificial Intelligence and the Future of Work [WWW Document]. IMF. URL https://www.imf.org/en/Publications/Staff-Discussion-Notes/Issues/2024/01/14/Gen-AI-Artificial-Intelligence-and-the-Future-of-Work-542379 (accessed 2.19.24).
Chacaltana Janampa, J., de Mattos, F.B., García, J.M., 2024. New technologies, e-government and informality | International Labour Organization. ILO Work. Pap. 112, ILO Working Papers, Geneva.
Comunale, M., Manera, A., 2024. The Economic Impacts and the Regulation of AI: A Review of the Academic Literature and Policy Actions [WWW Document]. IMF. URL https://www.imf.org/en/Publications/WP/Issues/2024/03/22/The-Economic-Impacts-and-the-Regulation-of-AI-A-Review-of-the-Academic-Literature-and-546645 (accessed 3.26.24).
Das, M., Hilgenstock, B., 2022. The exposure to routinization: Labor market implications for developed and developing economies. Struct. Change Econ. Dyn. 60, 99–113.
Dieppe, A., 2021. Global Productivity: Trends, Drivers, and Policies.
Doellgast, V., O’Brady, S., Kim, J., Walters, D., 2023. AI in Contact Centers: Artificial Intelligence and Algorithmic Management in Frontline Service Workplaces.
Donovan, K., Lu, W.J., Schoellman, T., 2023. Labor Market Dynamics and Development*. Q. J. Econ. 138, 2287–2325. https://doi.org/10.1093/qje/qjad019
Egana-delSol, P., Bustelo, M., Ripani, L., Soler, N., Viollaz, M., 2022. Automation in Latin America: Are Women at Higher Risk of Losing Their Jobs? Technol. Forecast. Soc. Change 175, 121333. https://doi.org/10.1016/j.techfore.2021.121333
Eloundou, T., Manning, S., Mishkin, P., Rock, D., 2023. GPTs are GPTs: An Early Look at the Labor Market Impact Potential of Large Language Models.
Erumban, A., Samaan, D., Van Ark, B., 2024. Latin America’s Productivity Puzzle: Insights into diversification and structural change. Preseatation at the CEPAL conference: https://www.cepal.org/sites/default/files/events/files/daniel_samaan_presentation.pdf.
Faverio, M., Tyson, A., 2022. What the data says about Americans’ views of artificial intelligence. Pew Res. Cent. URL https://www.pewresearch.org/short-reads/2023/11/21/what-the-data-says-about-americans-views-of-artificial-intelligence/ (accessed 3.14.24).
Felten, E., Raj, M., Seamans, R., 2021. Occupational, industry, and geographic exposure to artificial intelligence: A novel dataset and its potential uses. Strateg. Manag. J. 42, 2195–2217. https://doi.org/10.1002/smj.3286
Felten, E.W., Raj, M., Seamans, R., 2023a. Occupational Heterogeneity in Exposure to Generative AI. https://doi.org/10.2139/ssrn.4414065
Felten, E.W., Raj, M., Seamans, R., 2023b. How will Language Modelers like ChatGPT Affect Occupations and Industries? SSRN Electron. J. https://doi.org/10.2139/ssrn.4375268
Felten, E.W., Raj, M., Seamans, R., 2018. A Method to Link Advances in Artificial Intelligence to Occupational Abilities. AEA Pap. Proc. 108, 54–57. https://doi.org/10.1257/pandp.20181021
Frey, C.B., Osborne, M.A., 2017. The future of employment: How susceptible are jobs to computerisation? Technol. Forecast. Soc. Change 114, 254–280. https://doi.org/10.1016/j.techfore.2016.08.019
Garrote, S.D., Gomez, P.N., Ozden, C., Rijkers, B., Viollaz, M., Winkler, H., 2021. Who on Earth Can Work from Home? World Bank Res. Obs.
Gmyrek, P., Berg, J., Bescond, D., 2023. Generative AI and Jobs: A global analysis of potential effects on job quantity and quality (Working paper).
Goldman Sachs, 2023. Global Economics Analyst The Potentially Large Effects of Artificial Intelligence on Economic Growth (BriggsKodnani), Global Economics Analyst.
Grampp, M., Brandes, D., Laude, D., 2023. Generative AI’s fast and furious entry into Switzerland (Delloite).
Gutiérrez, G., Philippon, T., 2017. Declining Competition and Investment in the U.S. NBER Work. Pap., NBER Working Papers.
Hui, X., Reshef, O., Zhou, L., 2023. The Short-Term Effects of Generative Artificial Intelligence on Employment: Evidence from an Online Labor Market. https://doi.org/10.2139/ssrn.4527336
ILO, 2023a. ILO Modelled Estimates (ILOEST database) [WWW Document]. ILOSTAT. URL https://ilostat.ilo.org/resources/concepts-and-definitions/ilo-modelled-estimates/ (accessed 6.20.23).
ILO, 2023b. ISCO documentation: part III. Definitions of major groups, sub-major groups, minor groups and unit groups. [WWW Document]. URL https://www.ilo.org/public/english/bureau/stat/isco/docs/groupdefn08.pdf (accessed 6.20.23).
ILO, 2023c. World Employment and Social Outlook 2023: The value of essential work [WWW Document]. URL https://www.ilo.org/digitalguides/en-gb/story/weso2023-key-workers (accessed 7.31.23).
ILO, 2023d. World Social Protection Report 2020–22: Social protection at the crossroads – in pursuit of a better future. ILO Flaghip Report.
ILO, 2023e. The ILO strategy on skills and lifelong learning 2030 | International Labour Organization.
IMF, 2022. Productivity in Latin America and the Caribbean: Recent Trends and the COVID-19 Shock.
Lane, M., Williams, M., Broecke, S., 2023. The impact of AI on the workplace: Main findings from the OECD AI surveys of employers and workers. OECD, Paris. https://doi.org/10.1787/ea0a0fe1-en
Lewandowski, P., Park, A., Hardy, W., Du, Y., 2019. Technology, Skills, and Globalization: Explaining International Differences in Routine and Nonroutine Work Using Survey Data.
Lo Bello, S., Sanchez Puerta, M.L., Winkler, H.J., 2019. From Ghana to America : The Skill Content of Jobs and Economic Development. Policy Res. Work. Pap. Ser., Policy Research Working Paper Series.
Maloney, W.F., Molina, C.A., 2016. Are automation and trade polarizing developing country labor markets, too ? Policy Res. Work. Pap. Ser., Policy Research Working Paper Series.
McKinsey, 2023. Economic potential of generative AI | McKinsey.
Messina, J., Pica, G., Oviedo, A., 2016. Job Polarization in Latin America. Inter-American Development Bank, Washington, DC.
Messina, J., Silva, J., 2018. Wage Inequality in Latin America. World Bank Publ. - Books.
Noy, S., Zhang, W., 2023. Experimental evidence on the productivity effects of generative artificial intelligence. Science 381, 187–192. https://doi.org/10.1126/science.adh2586
Nurski, L., Ruer, N., 2024. Exposure to generative AI in the European labour market: distributional implications.
OECD, 2023. The impact of AI on the workplace: Main findings from the OECD AI surveys of employers and workers (No. 288), OECD Artificial Intelligence Papers. https://doi.org/10.1787/ea0a0fe1-en
OECD/PIAAC, 2019. Skills Matter: Additional Results from the Survey of Adult Skills. Organisation for Economic Co-operation and Development, Paris.
Ozdeneron, Hakki, 2023. AI-Exposed Jobs Employ More Women. URL https://www.reveliolabs.com/news/macro/ai-exposed-jobs-employ-more-women/ (accessed 6.26.23).
Peng, S., Kalliamvakou, E., Cihon, P., Demirer, M., 2023. The Impact of AI on Developer Productivity: Evidence from GitHub Copilot. https://doi.org/10.48550/arXiv.2302.06590
Pew Research Center, 2023. Americans explain in their own words what makes them either more concerned or more excited about the increased presence of AI in daily life. Internet Sci. Tech. URL https://www.pewresearch.org/internet/2022/03/17/ai-and-human-enhancement-americans-openness-is-tempered-by-a-range-of-concerns/ps_2022-03-17_ai-he_01-02/ (accessed 3.14.24).
Prytkova, E., Petit, F., Deyu, L., Sugat, C., Tommaso, C., 2024. The Employment Impact of Emerging Digital Technologies.
Restrepo, P., 2023. Automation: Theory, Evidence, and Outlook. Working Paper Series. https://doi.org/10.3386/w31910
Rutgers, 2024. U.S. Workers Assess the Impacts of Artificial Intelligence on Jobs: Topline Survey Results, Heldrich Center for Workforce Development.
Schady, N., Holla, A., Sabarwal, S., Silva, J., Yi, C., 2023. Collapse and Recovery: How the COVID-19 Pandemic Eroded Human Capital and What to Do about It.
Svanberg, M., Li, W., Fleming, M., Goehring, B., Thompson, N., 2024. Beyond AI Exposure: Which Tasks are Cost-Effective to Automate with Computer Vision? https://doi.org/10.2139/ssrn.4700751
Webb, M., 2020. The Impact of Artificial Intelligence on the Labor Market.
WEF, 2023. The Future of Jobs Report 2023.
World Bank, 2016a. Poverty and Shared Prosperity 2016: Taking on Inequality, Poverty and Shared Prosperity. The World Bank. https://doi.org/10.1596/978-1-4648-0958-3
World Bank, 2016b. World Development Report 2016: Digital Dividends (Text/HTML).
Acknowledgements
We would like to thank Richard Samans, Sergei Suarez Dillon Soares, Janine Berg, Leonardo Iacovone, Paulo Bastos, Carlos Rodriguez Castelan, William F. Maloney and staff from ILO Research and from the World Bank Poverty team for valuable comments. We also thank ILO STATISTICS team for data contribution, particularly David Bescond, who produced several inputs to our estimates based on ILO micro data repository, as acknowledged in detail in the paper.

