


Directed Search, Wages, and Non-Wage Amenities:
Evidence from an Online Job Board
Abstract
We leverage rich data from a prominent online job board in Uruguay to assess directed search patterns in job applications, focusing on posted wages and advertised non-wage amenities. We find robust evidence of directed search based on posted wages in the cross-section, with stark heterogeneity by occupation: the wage-application correlation is driven by vacancies attached to lower-skill occupations, with applications to vacancies attached to higher-skill occupations showing no responsiveness to posted wages. By applying text analysis to the job ads, we elicit advertised non-wage amenities and find evidence of directed search based on non-wage amenities. Applications to vacancies attached to lower-skill occupations are consistent with lexicographic application preferences: amenities predict applications to these vacancies only when wages are not posted. Finally, we exploit industry-by-occupation minimum wage variation to demonstrate that the observed occupational heterogeneity in directed search patterns is supported by quasi-experimental difference-in-differences estimates of the impact of wages on job applications.
JEL codes: E24, J31, J32, J62, J63
Keywords: Directed Search, Vacancies, Wages, Non-Wage Amenities, Minimum Wages
Introduction
How responsive are job seekers to the characteristics of vacancies? Unpacking the “black box” of job applications informs about the presence of labor market frictions and helps to assess key assumptions in related theoretical work, for example, about random versus directed search, wage posting versus wage bargaining, or the role of non-wage amenities. Understanding the job application process is particularly relevant given recent documentation of imperfect information and beliefs in the labor market, from both workers and employers (Cullen, 2024; Jäger et al., 2024). Moreover, as argued by Holzer et al. (1991), job queuing behavior suggests the existence of ex-ante rents in the labor market. Hence, job seekers’ responses to changes in the characteristics of posted vacancies can shed light on the degree to which the documented industry- and firm-level wage premia constitute evidence of rents in the labor market.
Despite its importance, the empirical study of job applications is challenging because most datasets record equilibrium outcomes which, by definition, are only observed once the job application process is completed. To overcome this challenge, researchers have switched gears to gather direct information on the application process. Hall and Krueger (2012) and Krueger and Mueller (2016) pioneered using survey data on workers and job seekers. More recently, economists have started using vacancy-level data from private online job boards to better understand how firms advertise jobs and recruit workers and how job seekers search and make application decisions (e.g., Banfi and Villena-Roldan, 2019; Marinescu and Wolthoff, 2020; Skoda, 2022; Arnold et al., 2023; Batra et al., 2023).
This paper builds on this latter literature and uses data from a large online job board in Uruguay to study directed search patterns in job applications (that is, the extent to which job seekers direct their search toward vacancies with specific attributes), focusing on the role of posted wages and advertised non-wage amenities. The data comes from BuscoJobs (BJ), a prominent online job search platform that operates in more than 30 countries. In Uruguay, BJ covers a broad set of industries and occupations and is estimated to contain around 60% of total online private sector vacancies in the country (Escudero et al., Forthcoming). We have access to data on vacancies, applicants, and applications for the period 2011-2020, which we link using unique identifiers of applicant profiles and vacancies. On top of the complete application portfolio, applicant profiles contain information on gender, age, employment status, employment histories, education, and training. Vacancies contain information on the number of positions they seek to fill, formal requirements, and firm and industry identifiers. Also, 20% of vacancies post a monthly wage. Important for our analysis, we have access to the full job ad text, which is processed using Natural Language Processing (NLP) techniques to elicit the following additional variables: the skills required by vacancies and the occupations vacancies seek to recruit (Escudero et al., Forthcoming); and the non-wage amenities advertised in the job post (Adamczyk et al., Forthcoming).
The analysis proceeds in two parts. The first part develops a cross-sectional analysis that confirms and extends the main findings of Banfi and Villena-Roldan (2019) and Marinescu and Wolthoff (2020). The analysis shows that vacancies attached to lower-skill occupations receive more applications when they post higher wages or advertise non-wage amenities, however, there is a lexicographic application pattern as the effect of amenities on applications vanishes in the subset of vacancies that post a wage. On the contrary, applications to vacancies attached to higher-skill occupations do not react to posted wages but increase when non-wage amenities are advertised. The second part of the analysis leverages the fact that Uruguay implements Collective Bargaining Agreements (CBAs) that dictate and frequently adjust minimum wages, which vary at the industry-by-occupation level. We exploit this feature to complement the cross-sectional analysis with causal differences-in-differences estimates of wage effects on job applications. We find that minimum wage hikes increase applications to vacancies attached to lower-skill occupations, with no effect on vacancies attached to higher-skill occupations. Hence, the occupational heterogeneity documented in the cross-section is corroborated in the quasi-experimental exercise.
To preview our analysis in more detail, the cross-sectional analysis is structured in three exercises. First, we characterize application portfolios at the applicant level and explore whether they are diversified or concentrated in a few industries or occupations. We find substantial heterogeneity in the number of applications per job search spell across applicants. We also document that application portfolios are diversified. Job seekers who submit multiple applications in a given quarter rarely concentrate their applications within a specific industry and/or occupation. Instead, workers tend to apply for vacancies that span a wide range of industries and occupations. For example, when applicants submit 5 applications in a given quarter, their applications span, on average, 4.2 2-digit industries, 3.5 1-digit industries, and 2.8 1-digit occupations. This qualitative pattern remains consistent regardless of the number of applications made. This set of findings suggests that workers do not exhibit strong attachments to an occupation and, especially, an industry at the time of application, implying that they possibly consider other job attributes when choosing the vacancies they apply for, making directed search patterns feasible.
The second cross-sectional exercise explicitly explores directed search based on posted wages. We first replicate Banfi and Villena-Roldan (2019) and Marinescu and Wolthoff (2020) main finding of a positive and significant correlation between posted wages and vacancy-level applications once appropriate skill controls (in our case, occupations) are included. The main contribution of this section, however, is to document a stark heterogeneity by occupation in the wage-application elasticity. We find that for vacancies attached to a subset of occupations, which we label as lower-skill occupations (clerical support, services and sales, plant and machine operators, and elementary occupations), the elasticity of applications to posted wages is large, significant, and highly robust to the inclusion of controls and sample selections. On the contrary, for the vacancies attached to the remaining occupations, which we label as higher-skill occupations (managers, professionals, technicians and associate professionals, and craft workers), the relationship between applications and posted wages is completely absent. This finding is consistent with wage posting being more prevalent in lower-skill occupations and wage bargaining and individual offer tailoring being more prevalent in higher-skill occupations (e.g., Hall and Krueger, 2012; Caldwell and Harmon, 2019; Lachowska et al., 2022; Caldwell et al., 2024) since posted wages may provide different information for applicants depending on their occupation, thus mediating the application responsiveness. The documented heterogeneity is also consistent with recent evidence on employers being more likely to use aggregate information to set wages (that is, engage in “salary benchmarking”) when positions are attached to low-skill occupations (Cullen et al., 2024).
In this exercise, we also take advantage of the applicant-level data and explore whether the responsiveness of applications to posted wages varies with applicant characteristics. Both a vacancy-level analysis and an application-level analysis show that applications made by male, employed, older, college-educated, and skilled job seekers are significantly more responsive to wages than applications made by female, unemployed, young, non-college-educated, and unskilled job seekers, respectively. We also find that applicants with presumably worse labor market prospects (female, unemployed, young, non-educated, and unskilled) display negative wage elasticities when applying to vacancies attached to higher-skill occupations. This finding is consistent with models of directed search where workers trade-off wages with job search spell length (e.g., Moen, 1997) and models with on-the-job search where worse outside options may encourage workers to apply to low-wage jobs to climb the job ladder in future job transitions (e.g., Burdett and Mortensen, 1998; Postel-Vinay and Robin, 2002a,b).
Finally, the third cross-sectional exercise assesses the role of non-wage amenities in the job application process. We provide a battery of correlational exercises that consistently show that advertised amenities matter for job seekers. Our analysis builds on five elicited non-wage amenities (bonuses and commissions, schedule flexibility, good work environment, working in teams, and possibilities for human capital development). We test for the effects of advertising at least one amenity and also explore multivariate regressions that include each amenity separately. We find that, on average, advertising amenities increase the volume of applications; however, the effect is very heterogeneous in size and sign across amenities, occupations (conditional on amenity), and applicant characteristics. In general, the relevance of non-wage amenities for job applications echoes the findings in Banfi and Villena-Roldan (2019), who show that applicants rely on job ad descriptions when no wages are posted.
One novel result that emanates from this exercise is that we find robust evidence of lexicographic preferences for vacancies attached to lower-skill occupations. Amenities only increase applications to vacancies attached to lower-skill occupations when vacancies do not offer a posted wage, but the effect of amenities on applications vanishes when these vacancies post a wage. On the contrary, vacancies attached to higher-skill occupations show a positive effect of amenities on applications regardless of the wage-posting status. These findings can also be thought of as a consequence of the heterogeneous incidence of wage posting versus wage bargaining across skill levels. Under wage posting, the wage may be interpreted as a “sufficient statistic” for job attributes, giving job ads a secondary role conditional on the wage. This result is consistent with Belot et al. (2022), who show that applicants predict non-wage attributes based on the posted wage even when job ads are equal. For higher-skill occupations, however, the lack of information implicit in posted wages may provide a greater role to the advertised amenities.
While informative, the cross-sectional analysis may be biased by omitted variables and selection on unobservables. The correlations between applications, wages, and amenities could be driven by vacancy (or firm) characteristics that are valued by workers but are unobserved by the econometrician. Moreover, as suggested by Skoda (2022), Arnold et al. (2023), and Batra et al. (2023), the sample of vacancies that decide to post a wage is possibly selected. In our setting, the distribution of industries and occupations is similar between vacancies that post and do not post wages. Still, the extent to which wage posting correlates with latent wages can affect the interpretation of the cross-sectional elasticities.
In this context, the second part of the paper provides causal estimates of the effect of wages on applications by leveraging plausibly exogenous variation in minimum wages at the industry-by-occupation level. The objective of this exercise is to test whether the occupational heterogeneity in directed search documented in the cross-section is confirmed in a quasi-experimental framework, thus providing stronger grounds for its causal interpretation. In response to an economic crisis that deteriorated real wages, Uruguay implemented a set of labor market institutions in 2005, including wage councils that carried out periodic tripartite bargaining rounds (between workers, employers, and the government) at the industry level to define a range of minimum wages attached to different occupations specified in sectoral CBAs.1 These CBAs were gradually expanded, yielding almost complete industry coverage by 2010, and played an economically significant role across the different occupational groups we study.
CBAs are heterogeneous across industries, both in terms of the minimum wage levels and the number of occupations that they cover. This diversity results in variation in minimum wages across industries within specific occupations. While we cannot match each vacancy to the exact minimum wage set by the CBAs (as these agreements encompass occupations and industries that do not align directly with the classifications observed in our data), we exploit the heterogeneity in minimum wages by measuring exposure to minimum wage increases at the industry-by-occupation level after collapsing the variation present in the CBAs at the occupation and industry categories observed in the vacancy data. The variation in exposure to minimum wage increases, combined with the regularity of bargaining rounds (resulting in several minimum wage adjustments every 6 months), offers a natural source of variation to estimate the causal (intent-to-treat) effects of wages on applications. We implement a stacked difference-in-differences (DID) design that compares, within each minimum wage adjustment window, the applications to vacancies in industry-by-occupation cells that are exposed to minimum wage increases to vacancies in industry-by-occupation cells that are not. This latter situation may arise either because the specific cell does not adjust the wage in a given semester or because certain occupations are not covered in certain contracts.
We find that vacancies attached to lower-skill occupations in industry-by-occupation cells exposed to minimum wage increases face an increase in applications, while exposed vacancies attached to higher-skill occupations show no response to the policy change. That is, the quasi-experimental DID results confirm our cross-sectional finding of occupational heterogenitiy in directed search. The implied wage-application elasticity in vacancies attached to lower-skill occupations is around 1.5, which aligns with the empirical literature on labor supply elasticities (Sokolova and Sorensen, 2021). We also provide evidence that suggests that minimum wage increases generated no change in vacancies, openings, advertised non-wage amenities, or vacancy requirements. In the spirit of Holzer et al. (1991), the documented queuing for high-paying jobs in lower-skill occupations paired with the absence of changes in other margins suggests the presence of rents in the Uruguayan lower-skill labor market.
Related literature
This paper contributes to the growing empirical literature that uses online job board data to characterize empirical patterns in job applications, in particular, related to directed search behavior.2 The closest papers to ours are Banfi and Villena-Roldan (2019) and Marinescu and Wolthoff (2020) who use data from Chile and the United States, respectively, to document that, conditional on appropriate vacancy-level skill controls, vacancies that post higher wages receive more applications. We replicate this finding in the cross-section, document novel heterogeneities by vacancies’ occupation and applicants’ characteristics, and confirm the directed search pattern using quasi-experimental variation in minimum wages. Both papers also document that applicants use the information displayed in job titles and job ads to direct their search. We provide an interpretation of that behavior by eliciting advertised non-wage amenities from job ad texts and showing directed search based on amenities. While the aforementioned papers exclusively rely on cross-sectional variation in wages, another strand of literature has causally established directed search patterns using experimental variation in controlled settings (Dal Bó et al., 2013; Belot et al., 2022; He et al., 2023). Our quasi-experimental results based on minimum wage variation add to the causal estimates of directed search behavior.3
This paper also contributes to the literature on non-wage amenities and compensating differentials. Recent structural analyses of the role of non-wage amenities in wage determination proceed by adding structure to a wage residual, usually giving form to an “amenity index” estimated from equilibrium data (e.g., Sorkin, 2018; Taber and Vejlin, 2020; Lamadon et al., 2022, 2024; Morchio and Moser, 2023; Roussille and Scuderi, 2024). To open the “black box” of amenities, different papers have tried to explicitly elicit willingness to pay for specific non-wage job attributes, either using survey data, quasi-experimental designs, structural work, or controlled experiments (e.g., Bonhomme and Jolivet, 2009; Mas and Pallais, 2017, 2019; Wiswall and Zafar, 2018; Le Barbanchon et al., 2021; Dube et al., 2022; Lindenlaub and PostelVinay, 2022; Maestas et al., 2023; Sockin, 2024). We add to this literature by providing estimates of advertised amenities from job ad texts using the methodology outlined in Adamczyk et al. (Forthcoming). Our estimated effects of advertised amenities on applications are consistent with estimates of willingness to pay for non-wage job attributes. Importantly, our analysis also suggests that the role of amenities masks substantial heterogeneity by vacancy occupation, applicant characteristics, and type of amenity.
Finally, this paper contributes to the vast empirical literature on minimum wages, which has mostly focused on the employment and wage effects of minimum wage increases, usually finding significant wage effects on exposed workers with small disemployment consequences (Manning, 2021a). Our estimated null effects on posted vacancies are consistent with the absence of significant disemployment effects. To rationalize limited employment effects, papers have studied the effects of minimum wages on other margins of adjustment including, for example, prices (Allegretto and Reich, 2018; Harasztosi and Lindner, 2019; Leung, 2021; Ashenfelter and Jurajda, 2022; Renkin et al., 2022), productivity (Riley and Bondibene, 2017; Mayneris et al., 2018; Coviello et al., 2022; Dustmann et al., 2022; Emanuel and Harrington, 2022; Ku, 2022; Ruffini, Forthcoming), and profits (Draca et al., 2011; Harasztosi and Lindner, 2019; Drucker et al., 2021; Vergara, 2023). We provide evidence on a complementary margin that can help firms buffer minimum wage shocks: the effect on job applications (Holzer et al., 1991; Vergara, 2023). This margin is consistent with the dynamic effects on employment flows and turnover estimated by Dube et al. (2016), Gittings and Schmutte (2016), and Wiltshire et al. (2023), and with recent evidence on positive effects of minimum wages on search effort (Piqueras, 2023). Contrary to the discussion in Clemens (2021), we estimate null effects on advertised amenities. Finally, the fact that the estimated additional applicants are relatively unskilled together with the lack of estimated effects on vacancy requirements does not align with previous findings on skill upgrading (Butschek, 2021; Clemens et al., 2021).4
Structure of the paper
Section 1 describes the institutional setting and the data. Section 2 provides cross-sectional (descriptive) evidence on application patterns. Section 3 presents the results of the causal analysis that exploits variation in minimum wages. Finally, Section 4 concludes.
General Context, Data, and Descriptive Statistics
This section describes the institutional setting studied in this paper and the data used in the empirical analysis. It also provides descriptive statistics of our sample of interest.
1.1 General context
Uruguay is located in South America and its population reached 3.5 million in 2020. The country performs above the Latin American average for a range of socio-economic indicators (UNDP, 2022) and has been classified since 2012 as a high-income country according to the World Bank (World Bank, 2022). A large majority of the Uruguayan population lives in urban areas. In 2020, 73.5% of employment took place in the services sector, followed by manufacturing (18.2%) and agriculture (8.3%). The public sector represents around 15% of employment. Informal employment in Uruguay is comparatively low relative to the Latin American region, and the share of the population covered by at least one type of social protection benefit is 93.8% (ILO, 2022). Since 2005, Uruguay’s labor market has been characterized by strong labor market institutions, including wage councils that set industry-by-occupation minimum wages in tripartite collective bargaining agreements (CBAs). We provide a detailed description of the CBAs in Section 3 when discussing our quasi-experimental framework based on this minimum wage variation.
1.2 Data
We use data on vacancies, applicants, and applications from BuscoJobs (BJ), a private online job board that contains detailed information on vacancies posted by firms, applicants searching for jobs, and the applications job seekers made to those vacancies during the period 2010 to 2020. BJ operates in more than 30 countries around the world and is a leading online job board in Uruguay. Its effective coverage is estimated to capture around 60% of total online vacancies in the country (Escudero et al., Forthcoming).
To post vacancies in BJ, firms have to register and pay a fee. Subscribed firms provide information on their characteristics, including their name and industry. For each vacancy posted, they provide a job title, a detailed open-text description of the vacancy, dates when the job ad will be open, and, in some cases, a salary range. Vacancies may also include information on application requirements related to the applicant’s age, gender, education, experience, or language skills. Job seekers have to register on the portal to search and apply for vacancies, but they can do so for free. Once they register, they need to include in their profile their personal information, employment histories, employment status, educational attainment (including degrees and certifications), and languages spoken. To build their employment histories, applicants must provide dates of entry and exit for each job spell and details about the previous positions, including an open-text description of the duties carried out.
In addition to the information that is directly reported on the BJ platform, we use additional variables derived through NLP models as described by Adamczyk et al. (Forthcoming) and Escudero et al. (Forthcoming). These procedures leverage the rich open-text descriptions available in the platform’s raw data entries. In what follows, we provide a high-level description of these procedures; a detailed description is available in Appendix A and the corresponding references.
First, we estimate whether job ads advertise non-wage amenities by looking at keywords and expressions that are unique to specific amenity categories. We predefine a list of categories by adapting the definitions of Maestas et al. (2023) and Sockin (2024) to vacancy data and the Uruguayan context. We start with a list of 16 amenities but, throughout the paper, we focus on the 5 amenities that are estimated to be advertised on at least 5% of the vacancies in our sample5 : “bonuses and commissions” (including various forms of financial incentives and rewards aimed at compensating employees based on their achievements), “schedule flexibility” (including arrangements that allow for telecommuting, remote work, part-time employment, and flexible hours, as well as practices that support a better work-life balance), “work environment/impact on society” (aspects that provide insights into the firms’ commitment to creating a positive workplace environment and contributing positively to the community and society as a whole), “working in teams” (providing insights into the collaborative aspects of the job and team oriented nature of the work environment), and “human capital development” (including opportunities for personal and professional growth and development within the firm). The NLP procedure requires job ads’ texts to have at least 15 words (Atalay et al., 2020). Only 1.1% of the vacancies in our sample have descriptions that do not meet this requirement. We code these vacancies as not advertising any amenity. For the remaining 98.9% of vacancies in our sample, we can properly implement the text analysis.
In addition to standard robustness checks (e.g., verifying the inclusion of words in between, testing various methods for reducing words to their root form, and identifying reverse forms of expressions), this process underwent multiple rounds of manual verification to ensure contextual accuracy of words and expressions. Beyond the fact that keywords were carefully selected and contextualized within broader sentences to minimize classification errors, manual verification was feasible as few dominant keywords typically account for the majority of matches in each subcategory, with other terms making smaller contributions (see the word clouds displayed in Figure A.1 of Appendix A). This verification also involved manual checks for a random sample of vacancies for each amenity group.
We additionally use measures of applicants’ skills beyond formal educational attainment. These variables, also developed using NLP methods and similar robustness checks and verification procedures by Escudero et al. (Forthcoming), are derived from applicants’ descriptions of duties performed in current or previous employment spells. The taxonomy focuses on three categories of skills (cognitive, socio-emotional, and manual) which are further divided into 14 subcategories. “Cognitive skills” include general cognitive skills, general computer skills, software skills and technical support, machine learning and AI, financial skills, writing skills, and project management skills. “Socio-emotional skills” include character skills, social skills, people management, and customer service skills. “Manual skills” include finger-dexterity, hand-foot-eye coordination, and physical skills. The same procedures are applied to vacancies’ descriptions to identify skills requirements that extend beyond formal educational degrees.
Finally, the NLP procedures combined with additional machine learning techniques such as Gradient Boosting models were also used to identify the vacancy-level and applicant-job-spell level occupation according to ISCO-08 (Escudero et al., Forthcoming). Vacancy-level occupations were recovered using both job ads and job titles of the posted vacancy, while applicant-job-spell-level occupations were recovered from analog entries reported in the applicant-level employment status and employment histories.
1.3 Descriptive statistics
In the remaining of the section, we provide descriptive statistics to depict a more comprehensive picture of the BJ platform and the vacancy and applicants’ samples used in the subsequent empirical exercises.
Vacancies
For the period 2010-2020, 87,030 vacancies were posted in BJ. We drop 134 vacancies for which we cannot identify the applicants, which have miscoded opening dates, are for jobs outside Uruguay, and/or for which it is not possible to identify the 2-digit industry code and/or the 1-digit occupation code. Figure B.1 of Appendix B shows that the number of applicants and vacancies grew steadily during 2010 but stabilized during the second half of 2011. Hence, our empirical strategy only considers the period from October 2011 to September 2020.6 This restriction leads us to drop 8,916 additional vacancies.
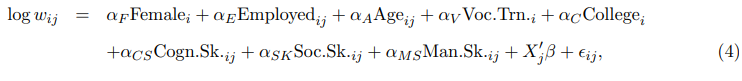
Figure 1 plots the industry and occupation distributions of the vacancies. Panel (a) shows that the five industries with the majority of posted vacancies are administrative and support service activities; wholesale and retail trade; professional, scientific, and technical activities; information and communication; and manufacturing. When comparing these figures to the national employment distribution, the five mentioned industries - with the exception of manufacturing, which closely matches the national share - are overrepresented in the BJ platform (Escudero et al., Forthcoming). On the contrary, primary sectors (agriculture, mining, and quarrying), energy and water management services, and public services and defense are severely underrepresented. Therefore, we drop the posted vacancies in these industries in all subsequent analyses (106 vacancies, leaving a final sample of 77,874 vacancies). Panel (b) shows that posted vacancies are not concentrated in a few occupations. The BJ platform encompasses a variety of occupations with different implied skills and formal qualification levels, spanning from managers and professionals to clerical support and elementary occupations. Panels (c) and (d) show that the distributions of industries and occupations are similar between vacancies that post and do not post wages.
Panel (a) of Table 1 presents additional descriptive statistics of the final sample of posted vacancies. The modal number of openings per vacancy (i.e., the number of jobs the vacancy is expected to fill) is 1, although there are a few vacancies that are looking to hire several workers, with a mean number of openings of 1.7. The median vacancy receives 97 applications per opening, but there is substantial variation, again, with a few vacancies receiving large numbers of applications (the mean number of applications per opening is 179). 78% of vacancies are open for exactly 31 days, 19% are open for less than 31 days – with 8% being open for 8 days and 9.25% for 16 days – and only 3.5% of vacancies are open for exactly 2 months. Finally, 20% of vacancies post a wage. This number is computed as follows. Vacancies are allowed to advertise a monthly wage range. Throughout the paper, we define the posted wage as the minimum of the range posted, since 8.6% of vacancies that provide a lower bound do not provide an upper bound. We also note that some vacancies attach a minimum value that is essentially non-informative (i.e., close to zero), so we impute the wage reference as missing whenever the advertised wage is lower than 1,000 Uruguayan pesos (as of 2020).7
Panel (a) of Table 1 also shows the shares of vacancies that specify requirements for applicants. 14% of vacancies require a vocational training certificate, while 21% require a college degree, and 19% of vacancies require knowledge of a language other than Spanish (in most cases, English). These requirements are directly specified by firms in related entries when posting a vacancy. Meanwhile, other requirements are specified in the open text of job ads, which are elicited using NLP techniques as described in Section 1.2. We observe that 80% of vacancies require at least one cognitive skill. Likewise, 83% of vacancies require at least one socio-emotional skill, and 38% require at least one manual skill.
Applicants
Panel (b) of Table 1 presents descriptive statistics of the applicants registered in the BJ platform. We identify 698,880 profiles in the 2010-2020 period, of which 410,955 are denoted as “active” profiles, i.e., individuals who made at least one application in the period October 2011 to September 2020.8 To get a sense of the order of magnitude, the total population in Uruguay was estimated to be 3,530,912 in 2020, of which 2,067,384 (59%) was between 20 and 64 years old (INE, 2021). This implies that the total number of profiles created between 2010 and 2020 represents approximately 34% of the working-age population in Uruguay in 2020.9 Among the active profiles, the mean number of applications made between October 2011 and September 2020 is 39.7 and the corresponding median is 11. Among active applicants, 55% are female. 11% report having a vocational training degree, and 16% have completed a college degree. The median applicant was born in 1990. While the overall educational structure resembles that of the national labor force, BJ applicants are slightly more likely to be college graduates.10 They also include a disproportionate number of younger workers (Escudero et al., Forthcoming).
Applications
We identify 16,320,466 applications for vacancies made between October 2011 and September 2020. Panel (c) of Table 1 shows that 42% of applications are made by individuals who report being employed at the time of the application. The average age at the time of application is relatively young at 27.7 years with moderate dispersion. Finally, based on the open-text descriptions of current and previous jobs, we estimate that 31% report having performed cognitive tasks, 45% report having performed socio-emotional tasks, and 13% report having performed manual tasks.
Amenities
Table 2 shows descriptive statistics for the amenities advertised in our sample of vacancies. 45% of the vacancies in our sample advertise at least one of the 5 amenities described in Section 2.2. The average number of amenities advertised is 0.7, which can be decomposed as 55% of vacancies advertising zero amenities, 27% advertising one, 12% advertising two, 4% advertising three, and less than 2% advertising four or five amenities. The share of vacancies advertising amenities is larger among vacancies that do not post wages (46% versus 39%). Table 2 also shows that the three most commonly advertised amenities are “human capital development”, “working in teams”, and “work environment/impact on society”, which are featured in 23%, 19%, and 16% of vacancies, respectively. “Bonuses and commissions” and “schedule flexibility” are advertised in 7% and 5% of the vacancies, respectively.
Cross-Sectional Facts on Job Applications
Having described the setting and the data, we proceed with the cross-sectional analysis. We perform three exercises. First, we explore how diverse application portfolios are in terms of industries and occupations. Second, we explore whether posted wages affect applications. Third, we explore the role of advertised non-wage amenities in the application process. We pay particular attention to heterogeneity analyses at the applicant, vacancy, and amenity levels during the analysis.
2.1 How diverse are application portfolios?
To study application portfolios, we analyze the universe of applications made to the vacancies considered in our analysis. To proxy groups of applications made in the same job search spell (applicants may search for jobs at multiple stages in their careers, thus applying to jobs in different job search spells), we consider an applicant ID-by-quarter-by-year as a unit of observation and focus on “active spells”, i.e., applicant ID-by-quarter-by-year combinations where job seekers make at least one application. If actual application spells are longer than a quarter, our measure will underestimate the number of applications by search spell. This strategy leads to 1,668,348 applicant-by-spell observations with at least one application. On average, an active profile makes applications in 4.1 different quarters between 2011 and 2020. There is, however, substantial heterogeneity. 34.4% of the applicant profiles are active only in one quarter, 37.4% between 2 and 4 different quarters, 16.0% between 5 and 8 quarters, 6.4% between 9 and 12 quarters, and 5.8% in 13 or more different quarters.11
Number of applications
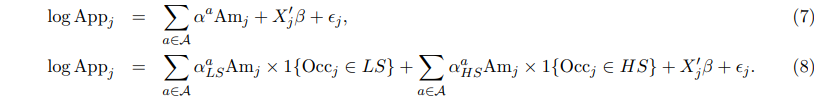
Figure 2 shows the distribution of the number of applications at the applicant-by-spell level, again considering active applicant-by-spell combinations with a positive number of applications. Panel (a) shows wide variation in the number of applications across applicants. While 23% of applicants with positive applications make a unique application, 51% of applicants submit between 2 and 10 applications in a given spell, and 13% submit between 11 and 20 applications. Only 3% of applicants submit more than 50 applications in a given spell (not shown in the histogram). Panels (b), (c), and (d) show the distributions separately by employment status, gender, and educational attainment. Distributions look remarkably similar across demographic groups, especially with respect to gender. While employed and college-educated applicants tend to make fewer applications on average than unemployed and non-college-educated applicants, they still show wide dispersion in the number of applications.
Diversity in applications
Having established that applicants are heterogeneous in the number of applications made by active spell, we then explore whether applications made by a given applicant in a given quarter tend to target vacancies in specific industries or occupations or if, instead, their applications are diversified across industries and occupations. This analysis can inform about the extent of directed search in the labor market: if workers are strongly attached to particular industries and occupations and, therefore, their behavior is less responsive to wage differentials across industries and occupations, we would expect to see their job applications concentrated within narrow categories of vacancies.
We explore diversification in application portfolios using the following statistic. Let i index observations (active applicant ID-spell combinations) with Ni the total applications made by the applicant in the spell. Each application goes to a vacancy attached to a group g ∈ G, with #G the number of different possible groups. For example, G may be the set of 2-digit industry codes, g a particular 2-digit industry, and #G the number of different 2-digit industries. Let #gi ∈ {1, ..., min{#G, Ni}} be the number of groups spanned by the Ni applications of applicant i.12 For example, if Ni = 10, #gi = 5 means that the 10 applications span 5 different 2-digit industries. When Ni = 1, #gi is mechanically 1. When Ni > 1, the upper bound of gi is given by min{#G, Ni}. We measure diversification with the quantity:

When D(N) = 1, applications are not diversified: all are made to the same group of vacancies. When D(N) = N, applications are completely diversified: all are made to vacancies that belong to different groups. This implies that the distance between (N, D(N)) and the 45-degree line can be used to visually diagnose the extent of diversification in application portfolios, taking into account the heterogeneity in the number of applications documented above.
We study diversification focusing on four different groups of vacancies. We first consider a narrow definition of vacancy groups that share their 2-digit industry code and their 1-digit occupation code, thus employing a stricter definition of a possibly relevant labor market.13 If industry-by-occupation cells constitute an accurate definition of the relevant local labor market of the applicant, we should expect job seekers to make the majority of their applications to vacancies in the same industry-by-occupation cell.14 We also consider broader group definitions of relevant labor markets: 2-digit industry codes alone, 1-digit industry codes alone, and 1-digit occupation codes alone.
Figure 3 shows the results. We focus on applicant-spell observations making 10 or fewer applications (Ni ∈ {1, ..., 10}). The black dotted curve is the 45-degree line. Figure B.3 of Appendix B shows results for Ni ∈ {1, ..., 50}, which displays a similar pattern.15 Two aspects of the figure are worth highlighting. First, when considering the narrower group definition (blue curve, 2-digit industry by 1-digit occupation cell), the levels of diversification are substantial. For example, D(2) = 1.96, which means that almost everyone who applies to 2 vacancies applies to vacancies in 2 different industry-by-occupation cells. While D(N)/N decreases with the number of applications, it remains large across the distribution of N. Individuals making 5 and 10 applications span 4.6 and 8.7 industry-by-occupation cells, respectively. This result implies that job seekers rarely target industry-by-occupation cells when making applications. Second, while mechanically smaller, diversification remains large when considering broader groups (2-digit industries, 1-digit industries, and 1-digit occupations alone). Applicants who make 2 applications span, on average, 1.90 2-digit industries, 1.79 1-digit industries, and 1.66 1-digit occupations. Applicants who make 5 applications span, on average, 4.2 2-digit industries, 3.5 1-digit industries, and 2.8 1-digit occupations. Applicants who make 10 applications span, on average, 7.1 2-digit industries, 5.1 1-digit industries, and 3.8 1-digit occupations.16
The fact that industries seem to be more diversified than occupations is worth highlighting. It implies that it is more accurate to think that, when applying, workers fix occupations and arbitrage industries than the other way around, suggesting that directed search is plausible. For the very least, the analysis rejects the hypothesis that applicants target labor markets defined by narrow industry-by-occupation cells, which would limit their sensitivity to wage differentials across industries. In that spirit, the analysis suggests that industry-wage differentials (Krueger and Summers, 1988; Card et al., 2024) cannot be rationalized by workers having strong attachment to particular industries. On the contrary, it suggests that industry wage differentials may give form to a job ladder.
A possible caveat of these results is that, conditional on making several applications, the vacancy offer distribution at a given point in time may be limited, thus preventing job seekers from implementing “non-diversified” application portfolios. For example, at a given point in time, there may be few vacancies (maybe one or none) associated with a particular industry-by-occupation cell. In that sense, the spike at 1 in Figure 2 may partially reflect an aversion to diversification for a subset of applicants. However, the fact that we observe a non-trivial share of job seekers making multiple applications and that, conditional on making multiple applications, job seekers apply to a wide range of vacancies in terms of industries and occupations, shows that significant numbers of applicants are, in fact, diversifying their applications. Diversification seems indeed substantial even conditional on only making 2 applications. Then, if this concern is driving the results, we should observe all applicants making a unique application, a pattern that is strongly rejected in Figure 2.17
As a final test for “willingness to diversify,” we leverage the fact that, for the majority of employed job seekers, we observe the 1-digit occupation of their current job and the occupation attached to the vacancies they apply to. Then, we can observe the share of on-the-job applications that are made to vacancies attached to the same occupation as the current job. Figure 4 shows the results split by occupation of the current job and number of applications made in the job search spell. As a benchmark, if applications were made randomly, the share of applications targeted to vacancies attached to the same occupation would match the distribution of posted vacancies displayed in Panel (b) of Figure 1. Figure 4 shows that job seekers in all occupations display shares larger than the benchmark suggested by Figure 1, which implies that workers apply more often to vacancies attached to their current occupations. However, the figure reveals that job seekers who apply for jobs while employed are also willing to apply to vacancies attached to other occupations, suggesting that diversification is plausible. This pattern is observed even for applicants who make only 1 application in a given job search spell. This result is consistent with recent findings in Altmann et al. (2024) and Fluchtmann et al. (Forthcoming).
2.2 Cross-sectional patterns of directed search
The fact that job seekers have diversified application portfolios suggests they may direct their search based on characteristics other than occupation and industry. This subsection explores directed search patterns based on posted wages. As mentioned previously, among our sample of 77,874 vacancies, 15,835 (20.3%) include a salary range in the posted ad. On average, vacancies that post a wage receive 21% more applications (with a median of 29%) relative to those that do not include wage information. While the distribution of industries and occupations is similar between vacancies that post and do not post wages (see Figure 1), the difference in applications suggests that the decision to post a wage may be endogenous. In Section 3, we therefore complement the cross-sectional analysis with quasi-experimental results to provide further ground for a causal interpretation of the effects of wages on applications.
Applications and wages
We start by non-parametrically exploring the relationship between log applications and log posted wages, pooling all vacancies that post a wage in our dataset. Figure 5 shows different binscatter plots that vary in the controls considered. Panel (a) shows the raw relationship between log applications and log posted wages. The plot shows a noisy and inverse U-shaped relationship: vacancies that post very low or very high wages tend to receive fewer applications. Panel (b) shows that the same relationship is observed when excluding the 3% of outlier vacancies that received more than 1,000 applications and controlling for 2-digit industry fixed effects, year fixed effects, and the advertised non-wage amenities in the vacancy. As stressed by Banfi and Villena-Roldan (2019) and Marinescu and Wolthoff (2020), the cross-sectional relationship may be spurious when not properly controlling for the skills associated with the job tasks. Panels (c) and (d) add 1-digit and 2-digit occupation fixed effects, respectively, and suggest that, with the exception of the vacancies at the very top of the posted wage distribution, the relationship between applications and posted wages becomes positive, suggesting the presence of a within-occupation directed search pattern in a wide range of the posted wage distribution.
To summarize these patterns in terms of cross-sectional wage-application elasticities, we run OLS regressions of the following type:

where Appj is the number of applications per opening for vacancy j, wj is the posted wage of vacancy j, and Xj are vacancy-level controls. We cluster standard errors at the 2-digit industry level.
Panel (a) of Table 3 shows the estimate of under different sets of controls, resembling the analysis in Figure 5. Column (1) shows the raw correlation, which is positive but small and not statistically significant. Column (2) excludes outliers, includes industry and year fixed effects, and controls for the advertised amenities. Including this set of controls has a small effect on the coefficient but slightly increases precision. Columns (3) and (4) add 1-digit and 2-digit occupation fixed effects, respectively, generating an increase in the estimated coefficient that is statistically significant at conventional levels. The cross-sectional application-wage elasticity in these columns is 0.17 and 0.19, respectively. Column (5) excludes the vacancies at the top 5% of the posted wage distribution. Consistent with Figure 5, omitting the upper tail increases the elasticity to 0.33. Finally, as a robustness check, Column (6) leverages the fact that several firms in the platform post multiple vacancies and, therefore, considers only vacancies posted by firms with 10 or more posted vacancies and includes firm fixed effects. While it is not clear whether firm fixed effects are good controls (directed search may reflect job ladders between firms), it is reassuring that the elasticity remains positive and significant, with a value of 0.21.18 We note that our analysis replicates the main conclusions in Banfi and Villena-Roldan (2019) and Marinescu and Wolthoff (2020): directed search arises after including appropriate controls for the skill attached to the vacancy, which we approximate with occupation codes. Our estimated elasticities are smaller than the ones estimated in the aforementioned papers, possibly because they use job titles as the skill control which are substantially narrower than 1-digit or 2-digit occupational codes. The sensibility of the estimated elasticity to the included controls, however, provides a similar narrative in qualitative terms.19,20
In most of the exercises that follow, we report results for the same sets of controls and sample refinements. Given the lessons from related literature and the results of Panel (a) in Table 3, however, we designate the specification of Column (3) (no outliers, 2-digit industry fixed effects, year fixed effects, advertised amenities, and 1-digit occupation fixed effects) as our preferred specification. The choice of 1-digit over 2-digit occupation codes rests solely on the fact that 2-digit codes are not available for all vacancies and, therefore, using 1-digit codes increases the sample size.
Occupational heterogeneity
One caveat of the analysis above is that it pools all vacancies when estimating the cross-sectional wage-application relationship. It could be the case, however, that different occupations react differently to posted wages. For example, findings in Hall and Krueger (2012), Caldwell and Harmon (2019), Lachowska et al. (2022), and Caldwell et al. (2024) suggest that wage bargaining is more prevalent in higher-skilled occupations, a feature that could mediate how job seekers attached to different occupations interpret and react to posted wages in online job ads. To explore for occupational heterogeneities, we replicate the analysis separately by 1-digit occupation categories.
Figure 6 presents binscatter plots for the relationship between applications and posted wages by occupation. These figures exclude outliers and include industry fixed effects, year fixed effects, and controls for advertised amenities. The data reveals the existence of two groups of occupations that display opposite patterns. Panel (a) shows results for vacancies attached to clerical support, services and sales, plant and machine operators, and elementary occupations. We denote this group of occupations as lower-skill and refer to vacancies attached to these occupations as “lower-skill vacancies”. Vacancies in this group exhibit a monotone and positive relationship between applications and posted wages. Panel (b) shows results for vacancies attached to managers, professionals, technicians and associate professionals, and craft workers. We denote this group of occupations as higher-skill and refer to vacancies attached to these occupations as “higher-skill vacancies”. The relationship between applications and posted wages is essentially flat for this group of occupations. Panel (c) reproduces the analysis after grouping lower- and higher-skill occupations into the two broad groups. The lower-skill group exhibits a clear positive correlation between applications and posted wages, whereas the higher-skill group displays no such relationship.21
Table B.4 in Appendix B presents estimates of equation (2) separate by 1-digit occupation group, confirming the patterns displayed in Figure 6. Panel (b) of Table 3 summarizes the results by replicating Panel (a) of Table 3 using a model with interactions:

where LS and HS account for lower- and higher-skill occupation, respectively. When Xj does not include 1-digit or 2-digit occupation fixed effects (Columns (1) and (2)), the regression controls for 1{Occj ∈ LS}. The results are remarkably stable across columns and confirm the pattern documented in Figure 6. Vacancies attached to lower-skill occupations consistently display a positive and significant elasticity of applications to posted wages, with larger magnitudes closer to the values reported in Banfi and Villena-Roldan (2019) and Marinescu and Wolthoff (2020). On the contrary, vacancies attached to higher-skill occupations show no significant relationship between posted wages and applications. In our preferred specification (Column (3)), the point estimates are LS= 0.41 and HS = -0.07, compared to the estimated = 0.17 from the regression with no interactions.
One possible explanation for this pattern is that higher-skill vacancies impose more requirements on applicants in terms of formal qualifications or skills, which could prevent job seekers from applying to high-wage higher-skill vacancies. In fact, Table B.5 of Appendix B shows that requirements are more prevalent in higher-skill vacancies. Table B.6 of Appendix B, however, shows that the absence of directed search in higher-skill vacancies holds whether we restrict the sample to vacancies that post or do not post requirements. This is true in terms of formal requirements (see Panels (a) and (c), which focus on vocational training, college degrees, and/or language requirements) and skill requirements (see Panels (b) and (d), which pertain to cognitive, socio-emotional, and/or manual skills). Conversely, we continue to find evidence of directed search among vacancies attached to lower-skill occupations independent of vacancy requirements. Yet, for vacancies attached to these occupations, the responsiveness to posted wages is stronger when no formal requirements are posted (Panels (a) and (c)).22
Applicant-level heterogeneity
Finally, we leverage our applicant-level data and test whether directed search patterns are heterogeneous by applicant characteristics. We proceed in two ways. First, we estimate equation (3) using applications from particular groups of applicants as dependent variables. Table 4 presents the results. Regressions exclude outliers and include 2-digit industry fixed effects, year fixed effects, amenity controls, and 1-digit occupation fixed effects. While the larger responsiveness in vacancies attached to lower-skill occupations relative to higher-skill occupations is seen across all groups of applicants, point estimates reveal substantial heterogeneity by group of applicants. Columns (1) and (2) of Panel (a) show results for female and male applicants, respectively. Male applicants are substantially more responsive to posted wages than female applicants. While the lower-skill elasticity is 0.63 for male applicants, female applicants reveal a non-significant lower-skill elasticity of 0.14 and a negative higher-skill elasticity of -0.27. Columns (3) and (4) of Panel (a) provide a similar comparison between employed and unemployed applicants, with employed applicants showing a much larger responsiveness to posted wages in lower-skilled vacancies (= 0.61) than unemployed applicants ( = 0.28). The latter group also reveals a negative higher-skill elasticity of -0.22. Columns (5) and (6) of Panel (a) compare applications from job seekers aged 25 or less with applications from job seekers older than 25. Younger applicants show a precisely estimated zero lower-skill elasticity and a large negative higher-skill elasticity of -0.50. On the contrary, the estimated elasticities for older applicants resemble the findings for male and employed applicants (= 0.74 and = 0.20). Panel (b) shows heterogeneities by applicants’ education and skill level. Columns (1) to (3) of Panel (b) reveals larger responsiveness for applicants with tertiary education, especially for job seekers with a college degree in lower-skilled occupations (= 0.83). Columns (4) to (6) show that applicants with cognitive, socio-emotional, and manual skills, are also more responsive to posted wages, both in lower- and higher-skill vacancies.23
It is noteworthy that the groups of applicants with presumably worse labor market prospects exhibit negative higher-skill elasticities. The finding for these groups is consistent both with models of directed search where workers trade-off wages with job search spell length (e.g., Moen, 1997) and with models with on-the-job search where the lack of outside employment options may encourage workers to apply to low-wage jobs with the aim of climbing the job ladder in future job transitions (e.g., Burdett and Mortensen, 1998; Postel-Vinay and Robin, 2002a,b). The particularly negative response observed for the younger applicants may also reflect that these workers internalize in their application choices the importance of labor market experience to access higher-paying jobs.
As a second exploration for applicant-level heterogeneity in directed search behavior, we use application-level data to test whether applicant demographics predict the log posted wage of the vacancy they are applying to conditional on being a vacancy that posts wage. Let i index applicants and j index vacancies. Then, for all applications made to vacancies that post a wage, we estimate:
where Ageij is applicant i’s age when applying to vacancy j; and Femalei , Employedij , Voc.Trn.i , Collegei , Cogn.Sk.ij , Soc.Sk.ij , and Man.Sk.ij are indicator variables taking the value of 1 if applicant i is, respectively, female, employed when applying to the vacancy, has a vocational training degree, has a college degree, and reports having cognitive, socio-emotional, and manual skills when applying.24 As above, Xj contains vacancy-level controls which may include industry fixed effects, year fixed effects, advertised amenities, and occupation fixed effects. Standard errors are clustered at the applicant level. One advantage of this approach relative to the vacancy-level exercise reported in Table 4 is that, by controlling simultaneously for all applicant characteristics, it can better isolate the partial correlation of a specific attribute. If applicant characteristics are correlated with each other, the exercise above may be picking similar variation across columns, spuriously attributing results to particular characteristics.
Table B.8 of Appendix B shows the results. The analysis is consistent with the results of the vacancy-level analysis of Table 4. Estimates are all significant and remarkably stable across specifications, suggesting that applicant-level heterogeneity is not driven by differential sorting to vacancies. The preferred specification (Column (3)) suggests the following point estimates, with little variation across columns. Relative to male job seekers, female job seekers apply to vacancies that post 5.7% lower wages. Relative to the unemployed, employed applicants apply to vacancies that post 5.2% higher wages. Being one year older predicts a 0.6% higher posted wage. Relative to applicants with no tertiary education, applicants with vocational training and a college degree apply to vacancies that post, on average, 3.9% and 10.8% higher wages, respectively. Likewise, applicants with cognitive skills, socio-emotional skills, and manual skills, apply to vacancies with 5.3%, 0.7%, and 1.5% higher posted wages, respectively.
2.3 The role of non-wage amenities
The analysis above focused on the relationship between applications and wages, in some cases controlling for the amenities advertised in the vacancy. It does not, however, explore the concrete role amenities play for job seekers, which may yield a deeper understanding of the previously shown heterogeneities in the results on wages. Then, in this third exercise, we explore correlations that inform the role of non-wage amenities in the application process. We start by exploring correlations between posted wages and amenities. We then analyze how amenities correlate with applications and show heterogeneities by amenity, vacancy characteristics, and applicants’ characteristics.
Posted wages and amenities
To document correlations between advertised amenities and posted wages, we estimate OLS regressions of the form:

where A includes bonuses and commissions, schedule flexibility, work environment/impact on society, working in teams, and human capital development, and = 1{Vacancy j advertises amenity a}. We also consider regressions that only include Amj = 1{Vacancy j advertises at least 1 of the 5 amenities}. The potential set of controls is the same as in the previous subsection, and we keep clustering standard errors at the 2-digit industry level. We also consider the natural extension of equation (3) where we test whether the correlation vary with occupational group:

Table 5 presents the estimates of equation (5). Panel (a) shows that advertising at least one amenity is negatively correlated with posted wages. In our preferred specification, vacancies that advertise at least one amenity post, on average, 4% lower wages. If the amenities considered are valued by job seekers, this result suggests that amenities play a role in rationalizing wage dispersion, as suggested by Sorkin (2018), Lamadon et al. (2022), and Morchio and Moser (2023). A quantitative assessment of the degree of compensating differentials, however, is beyond the scope of this paper since it would require estimating willingness to pay for amenities to interpret the magnitude of the coefficients in terms of job utility (Maestas et al., 2023). By looking at Column (6), we note that the inclusion of firm fixed effects tend to both substantially attenuate the estimated elasticity and increase the R2, suggesting that an important part of the variation in the wage-amenity bundle (conditional on occupation) is between firms.
Panel (b) of Table 5 shows that there is important heterogeneity by amenity in its correlation with posted wages, both in terms of signs and magnitudes. Advertising bonuses and commissions is associated with lower posted wages (= -0.093 in our preferred specification). Advertising schedule flexibility exhibits a more sizable relationship with posted wages ( = -0.299). Work environment/impact on society also shows a negative semi-elasticity ( = -0.065). Conversely, working in teams is positively associated with posted wages ( = 0.055). The same pattern is true, albeit noisier, for human capital development ( = 0.027).25 The heterogeneity in sign and magnitude across amenities makes even more difficult the translation from these cross-sectional correlations to their implications for inequality in job rents, as different amenities may be valued differently (Maestas et al., 2023; Sockin, 2024).
Table 6 presents the estimates of equation (6) using the “at least one amenity” indicator, where we test whether these correlations vary between lower- and higher-skill vacancies. We find that the negative correlation is concentrated in lower-skill vacancies, with a semi-elasticity of -5.7% in our preferred specification. For higher-skill vacancies, the correlation between advertising at least one amenity and the posted wage is a precisely estimated zero. Table B.9 of Appendix B, however, shows that this average effect masks substantial heterogeneity by amenity. When compared to the results of Panel (b) in Table 5, the zero average effect on higher-skill vacancies seems to be driven by a more negative correlation between posted wages and bonuses and commissions and work environment/impact on society, and especially by a much larger positive correlation with working in teams and human capital development. Semi-elasticities for lower-skill vacancies are generally more nuanced and aligned with the aggregate results displayed in Table 5. Interestingly, and in contrast to what is observed for higher-skill vacancies, lower-skill vacancies show no relationship between posted wages and advertised possibilities of human capital development.
Applications and amenities
While providing estimates of willingness to pay for each amenity is beyond the scope of this paper, the following exercise indirectly explores, through a revealed preference logic, the value workers put on amenities by assessing their effect on job seekers’ applications. To document correlations between amenities and applications, we estimate analogs of equations (2) and (3) but using the amenity indicators as the main right-hand-side variables of interest:
We also explore whether the relationship between amenities and applications is mediated by the wage-posting status of the vacancy, by estimating the following modified version of equation (3):

where Postj = 1{Vacancy j posts a wage}. Finally, we provide estimates of a “saturated model” where we explore all the cross-interactions between lower- and higher-skill occupation indicators and Postj . All regressions that allow for heterogeneous effects of amenities by wage-posting status control for Postj.
Table 7 shows the estimates of equation (7). Panel (a) shows that vacancies that advertise at least one amenity receive more applications. Our preferred specification suggests a semi-elasticity of 6.9%. Panel (b) shows that the application effect vary with amenity, although estimates become smaller, noisier, and sensitive to the inclusion of controls. The only amenity that systematically exhibits a positive and significant semi-elasticity is working in teams, with a semi-elasticity of 7% in the preferred specification. The attenuation observed after the introduction of industry and, especially, occupation fixed effects may be explained by either amenities being idiosyncratic to industry-occupation cells, thus experiencing little variation within cell, or by substantial heterogeneity across vacancies in the role of specific amenities that, if working in opposite directions, may lead to small and noisy average effects.
To explore the latter hypothesis, we proceed with the estimation of equations (8), (9), and the saturated model. Estimates for the indicator of advertising at least one amenity are shown in Table 8. Separate estimates by amenity are reported in Tables B.10, B.11, and B.12 of Appendix B.
We first discuss heterogeneities by occupational group. Panel (a) of Table 8 shows that advertising at least one amenity has a positive effect on applications in both occupational groups, however, the effect seems larger for higher-skill vacancies ( = 0.047 and = 0.093 in the preferred specification). Table B.10 of Appendix B shows starker differences between lower- and higher-skill vacancies when looking at individual amenities. Bonuses and commissions negatively affect applications to lower-skill vacancies ( = -0.051), while having a large positive relationship with applications to higher-skill vacancies ( = 0.25). A similar pattern is observed regarding schedule flexibility (negative effect on lower-skill vacancies and vice versa), although the semi-elasticities are small in magnitude and non-statistically significant in most of the specifications. These results suggest that variable pay and flexibility may have different implications for utility depending on the occupation. For example, in lower-skill occupations, bonuses and commissions may constitute the primary source of earnings, potentially introducing income volatility and uncertainty. On the contrary, in higher-skill occupations, bonuses and commissions often form part of incentive schemes that supplement (rather than replace) base salary. Similarly, schedule flexibility in lower-skill occupations may reflect the ability of supervisors to determine working schedules while leaving less autonomy for the employees. In contrast, for higher-skill occupations, schedule flexibility may represent allowances to accommodate family responsibilities and remote work opportunities. On the contrary, work environment/impact on society shows a large and significant positive effect on lower-skill vacancies (= 0.105) and a small, unstable, and non-significant effect on higher-skill vacancies. Working in teams shows a stable positive effect on applications for both groups ( = 0.071 and = 0.074). The same pattern is observed for human capital development, although the estimated effects are small and non-significant.
We turn next to explore heterogeneities by wage-posting status. Panel (b) of Table 8 shows that the application effect of posting at least one amenity is driven by vacancies that do not post a wage. When posting a wage, the estimated semi-elasticity is a precisely estimated zero. On the contrary, the estimated semi-elasticity is 8.7% for vacancies that do not post a wage. This result suggests that job seekers implement a lexicographic application strategy: they base their application on posted wages and, when absent, they predict job characteristics based on the vacancy description. There are two pieces of evidence that are consistent with this pattern. First, Banfi and Villena-Roldan (2019) show that applicants direct their search to high-wage jobs even when wages are not posted in the job ad. They interpret that result as applicants predicting the wage based on the job ad description. Second, Belot et al. (2022) provide survey evidence that suggests that, when asked to compare two vacancies with different posted wages but equal non-wage attributes (including job description), job seekers systematically perceive the high-wage vacancy to have better non-wage attributes. Then, information contained in job ads may be secondary to the posted wage, which could rationalize lexicographic job search preferences. In Panel (c) of Table 8 we show that the lexicographic pattern is driven by lower-skill vacancies. Advertising at least one amenity has a negative and significant effect on applications in lower-skill vacancies with posted wage (-7.2%), while the effect of amenities is positive in lower-skill vacancies with no posted wage (8.5%) and higher-skill vacancies regardless of the wage posting status (14.5% and 8.9%).
Tables B.11 and B.12 of Appendix B report results for the individual amenities. Similar patterns emerge. Bonuses and commissions are negatively related with applications to lower-skill vacancies with posted wages, do not affect applications to lower-skill vacancies with no posted wage, and increase applications to higher-skill vacancies regardless of the wage-posting status. Schedule flexibility also exhibits negative effects for lower-skill vacancies with posted wage but positive effects for the rest of the groups, especially for higher-skill vacancies with posted wage. Working environment/impact on society does not affect applications to vacancies with posted wages, but positively affect applications to lower-skill vacancies with no posted wage. Working in teams significantly affects applications in all groups of vacancies, and the effect of human capital development seems positive but small and usually non-significant.
Applicant-level heterogeneity
Finally, as in the previous subsection, we explore for heterogeneities by applicants’ characteristics using both the vacancy-level strategy previously illustrated in Table 4 and the application-level strategy previously illustrated in Table B.8 of Appendix B, but using the amenity indicators as the main variables of interest.
Table 9 shows the results of the vacancy-level analysis focusing on the indicator of advertising at least one amenity, where we estimate equation (7) using applications from specific groups of applicants as the dependent variable. There is little heterogeneity across applicants on the relationship between applications and advertising at least one amenity. The notable exception is age, where young workers show large responsiveness (semi-elasticity of 9.5%), contrary to older workers who exhibit no response.26 This result mirrors the findings related to posted wages, where older workers were more responsive, thus suggesting a life-cycle evolution of the relative valuation of wages and amenities. Alternatively, this result may reflect cohort effects, with recent cohorts caring more about amenities. Workers with cognitive and socio-emotional skills also display larger effects relative to the aggregate effect displayed in Table 7.
Table 10, however, shows that different groups of applicants react differently to specific amenities. Columns (1) and (2) of Panel (a) report substantial gender differences. Female applicants are more responsive to vacancies that advertise bonuses and commissions and schedule flexibility, while male applicants are more responsive to vacancies that advertise working in teams and human capital development. This finding aligns with recent studies that highlight gender differences in the valuation of flexibility. Specifically, women disproportionately apply for jobs with flexible work arrangements and tend to avoid jobs requiring particular hours, even at the expense of lower wages (Goldin, 2014; Mas and Pallais, 2017; Wiswall and Zafar, 2018; Fluchtmann et al., 2024). Columns (3) and (4) on Panel (a) show differences by employment status. Unemployed applicants exhibit a noisy positive response to all amenities except human capital development, while employed applicants mostly respond to working in teams and human capital development. Columns (5) and (6) of Panel (a) show that young applicants positively respond to all amenities, especially schedule flexibility and work environment/impact on society. On the contrary, older workers respond negatively to schedule flexibility and tend to react positively to the advertising of working in teams. Columns (1) to (3) of Panel (b) show that applicants without tertiary education respond positively to all amenities except human capital development, while more educated applicants, especially the ones with a college degree, apply less to vacancies with bonuses and commissions and schedule flexibility and apply more often to vacancies that advertise working in teams and human capital development. This finding is in line with Maestas et al. (2023) who find that, the higher the level of education, the more workers are willing to pay for training opportunities. Finally, Columns (4) to (6) of Panel (b) show that skilled applicants resemble the patterns of applicants with tertiary education.
Finally, Table B.13 of Appendix B provides application-level estimates of applicant-level heterogeneity in the relationship between applications and amenities. Regressions are analogs of equation (4) that use different indicators of advertised amenities as dependent variables, thus testing whether applicant demographics predict the amenities of the vacancy they are applying to. This exercise confirms the result discussed above. Relative to male, female applications are more frequently targeting vacancies that advertise bonuses and commissions, schedule flexibility, and work environment/impact on society, and less frequently vacancies that advertise working in teams and human capital development. Similarly, relative to the unemployed, applications from employed job seekers are more likely to target vacancies that advertise working in teams and human capital development, and less likely to target vacancies that advertise bonuses and commissions, schedule flexibility, and work environment/impact on society. Tertiary education and cognitive skills yield a similar prediction, with particularly large point estimates for job seekers with a college degree. Job seekers with socio-emotional skills positively predict all amenities (except schedule flexibility), while job seekers with manual skills negatively predict all amenities. Finally, age at the time of application has a negative effect on all amenities.
2.4 Summary of findings and discussion
In this section, we documented several cross-sectional facts on job applications that suggest heterogeneous patterns of directed search across applicants and jobs.
First, we reject that applicants concentrate applications in narrow groups of vacancies and, instead, show that some job seekers apply to several vacancies and generally diversify applications in terms of occupations and, especially, industries. This descriptive fact suggests that job seekers consider a broad set of jobs when making applications, thus possibly directing their search based on job attributes that go beyond the industry-occupation tag.
Building from that finding, and consistent with previous literature (Banfi and Villena-Roldan, 2019; Marinescu and Wolthoff, 2020), we show that applications react to posted wages once we condition on the occupation of the vacancy. Novel to the literature, we find a stark and robust heterogeneity in directed search patterns between lower-skill (clerical support, services and sales, plant and machine operators, and elementary occupations) and higher-skill (managers, professionals, technicians, and craft workers) vacancies. Within lower-skill vacancies, applicants systematically direct their search toward vacancies that pay higher wages. The contrary is observed for higher-skill vacancies, where no relationship is found between posted wages and applications. This heterogeneity is consistent with recent evidence of heterogeneous incidence of wage posting and wage bargaining across occupations if those findings imply that posted wages in higher-skill occupations provide less information to applicants than posted wages in lower-skill occupations. Also novel to the literature, we find that the directed search pattern for lower-skill occupations is stronger for male, employed, older, educated, and skilled applicants.
Finally, when looking at the role of non-wage amenities, we also find evidence supporting directed search behavior based on advertised amenities. We present a battery of novel correlations that give form to two main high-level takeaways that deserve further exploration.
First, we find that application patterns in lower-skill vacancies are consistent with lexicographic preferences for jobs, where workers prioritize wages over non-wage amenities. That is, while amenities tend to systematically attract applicants in higher-skill vacancies, they only attract applicants in lower-skill vacancies when the vacancy does not post a wage. This finding is also consistent with the incidence of wage posting in lower-skill occupations, where the posted wage is more likely to be interpreted as a “sufficient statistic” for the job attributes relative to higher-skill occupations. Second, we provide evidence of substantial heterogeneity in the role of non-wage amenities for rationalizing posted wages and applications across amenities, occupations, wage posting status, and applicant characteristics.
The Causal Effect of Wages on Applications
The results presented in the previous section support the existence of directed search patterns within the labor market for vacancies associated with lower-skill occupations. The cross-sectional nature of the analysis, however, prevents us from ruling out alternative narratives related to selection bias into posting and unobserved heterogeneity. This section validates our central finding of occupational heterogeneity in directed search by estimating the causal effect of wages on applications using exogenous variation in minimum wages.
3.1 Setting and data
Collective Bargaining Agreements
Uruguay has a long tradition of strong unions that set industry-by-occupation minimum wages in collective bargaining agreements (CBAs) that coexist with a uniform national minimum wage (NMW).27 The first law of wage councils in Uruguay dates back to 1943. The institution was eliminated in 1973 by the rising dictatorship and then restored in 1985 with the return to democracy, but in a much weaker version – de facto non-binding – than the pre-dictatorship scheme, especially after 1992. An economic crisis between 2000 and 2005, mainly driven by the economic downturn in Argentina and the exchange rate devaluation in Brazil, generated a substantial decrease in real wages in Uruguay. In 2005, a new government took office that aimed at strengthening the existing labor market institutions to facilitate the recovery of real wages. As a result, the NMW increased considerably between 2005 and 2010, and the role of wage councils in wage determination was restored, especially after Law 18566 was sanctioned in 2009, which expanded the coverage of the CBAs and established concrete rubrics for the bargaining rounds. Consequently, the collective bargaining coverage rate in Uruguay is very high, reaching 94.7% of all employees in 2018 (ILO, 2022). Minimum wage non-compliance plays a comparatively small role, estimated at 9.4% for all private-sector wage employees and 6.7% for those in urban areas (Marinakis, 2016).
The NMW is determined by the central government, applies to all private-sector employees aged 18 and older, and sets a general wage floor. In addition, wage councils determine sectoral CBAs through bargaining rounds, which give rise to industry-by-occupation minimum wages above the NMW. These negotiations are tripartite, as the wage councils involve representatives of the National Workers’ Association (PIT-CNT), employers’ organizations, and members of the central government. The mandate of the wage councils is to set wage floors and to negotiate working conditions considering expectations of future inflation, adjustments for past inflation not accounted for in previous negotiations, and additional increases aimed at restoring pre-crisis real wages, particularly for occupations with a large share of low-wage workers. From 2005 onwards, CBA bargaining rounds shifted from annual to biennial or triennial cycles, depending on the sector. In practice, however, almost all minimum wage adjustments take place once or twice per year on either January 1st and/or July 1st since each bargaining round sets a biannual sequence of wage adjustments (see Figure 7 below). Importantly, the minimum wages specified in the CBAs automatically affect all workers and firms, as there is no affiliation requirement.
CBAs are negotiated at the group level. Groups correspond to broad economic industries. Each group bargains over one or more CBAs, depending on the number of subgroups considered. The objective of having different contracts within a group is to accommodate economic differences between sub-industries, although all CBAs within a group are jointly bargained and, in some cases, exhibit little within-group heterogeneity. Each group has discretion to define the occupations (i.e., categories) that will be subject to specific minimum wages in the bargained CBA.
Figure 7 provides additional information about the CBAs. Panel (a) displays the number of groups and CBAs (subgroups) by year. In 2005, CBAs were negotiated in 20 groups. This increased to 24 groups in 2008 when CBAs became available for economic activities that were historically excluded from the wage councils, such as the domestic workers group and three groups representing activities of the rural economy. Within each group, there are the above-mentioned subgroups that negotiate different CBAs. There were 172 subgroups negotiating CBAs in 2005, which reached 221 with the incorporation of the previously excluded groups in 2008, covering virtually all private sector employees. Since then, the increase in the number of subgroups is explained by a reorganization within groups rather than an increase in coverage. Panel (b) shows the distribution and evolution of the number of wage floors defined within CBAs. As explained before, groups have autonomy to define the categories that will be affected by the sectoral minimum wages defined in the CBAs. The number of categories corresponds to the number of occupations with a fixed minimum wage in the CBA. There is substantial dispersion in the number of categories considered. In a typical year, a CBA in the 25th percentile defined 6 different minimum wages, while a CBA in the 75th percentile defined between 25 and 30 different minimum wages. Some groups defined more than a hundred categories, which explains the distance between the median and the average. The number of categories within CBAs is very stable over time. Finally, Panel (c) shows that, among the 96,598 minimum wage changes that we identify in the raw CBA data, more than 90% happened either in January or July. This feature will be important for our empirical strategy below.
CBAs data
We rely on information of the industry-by-occupation minimum wages defined in each tripartite negotiation and recorded in the CBAs. After each bargaining round, each group defines nominal wages and biannual adjustments that are valid until the next bargaining round. CBAs and the corresponding list of industry-by-occupation minimum wages are public information. Therefore, we use digitized minimum wage data collected from each round’s contract.
One caveat when merging the CBAs data with the BJ data is that groups and categories that define industry-by-occupation minimum wages do not map one-to-one to the standardized codes available in the BJ data. Therefore, we manually assign 2-digit ISIC codes to each subgroup, and 1-digit ISCO occupation codes to each category within the contract. One problem with this approach is that the imputed codes can be broader or narrower than the standardized codes. For example, within the group “Commerce”, there is a CBA for the subgroup “Stores”, for which several 2-digit ISIC codes apply. Likewise, within the group “Food and beverages manufacturing”, there are different CBAs for “Wheat Mills” and “Rice Mills”, which can be associated to the same 2-digit industry code. A similar issue occurs with the categories within each CBA. One minimum wage can be associated with several 1-digit occupation codes, and several minimum wages can be associated with the same 1-digit occupation code.
Since it is not possible to precisely attach specific minimum wages to vacancies because of this multiplicity problem, we build measures of exposure to minimum wage changes at the vacancy level by computing summary statistics of all minimum wages that can be associated to a specific industry-occupation combination. Then, we code whether, on a given date, there is a change in the computed statistic.28 Under this strategy, non-exposed vacancies are vacancies whose industry-occupation combination either cannot be associated with a minimum wage in any CBA, or vacancies for which we can associate a minimum wage but it is not changing in the specific period. The resulting cells are defined at the 2-digit industry level and the 1-digit occupational level.
Economic significance of the minimum wage across occupations
Our causal analysis aims to assess whether we can replicate the occupational heterogeneity in directed search patterns we found earlier in the cross-section. This exercise requires occupation-specific minimum wages to bind in all occupations. To validate this assumption, we use survey data to explore whether minimum wages are differentially binding across occupations. Table B.14 of Appendix B shows that higher-skill occupations exhibit higher average wages than lower-skill occupations but also higher minimum wages. The ratio between average hourly minimum wages and median hourly wages compares well across the different occupations, ranging from 6% to 18%. This suggests that the economic significance of the minimum wage is indeed comparable for the two occupational groups.
3.2 Empirical strategy
Our empirical strategy exploits the frequent variation in minimum wages at the industry-by-occupation level provided by the CBAs. Each July and January, several industry-by-occupation cells (and, therefore, the vacancies within those cells) see their bargained wage floor adjusted (see Panel (c) of Figure 7). Other industry-by-occupation cells (and thus vacancies) see no change in their minimum wage, either because the contract is not adjusting wages in that adjustment window, or because some occupations do not have assigned minimum wages in certain sectoral contracts. This pattern of adjustments gives rise to natural treatment and control groups for which we can estimate DID models around the time of adjustment. The empirical strategy uses an industry-by-occupation cell as the unit of observation, for which we build a balanced panel to estimate standard event-study specifications. As a robustness check, we also estimate models using a within-vacancy design where the units of observation are vacancies that experience a minimum wage increase while being active (see Section 3.3).
Our strategy may be interpreted as conservative for two reasons. First, as discussed above, we do not observe the exact minimum wage that is attached to each vacancy. Since we use the industry and occupation attached to the vacancy to measure exposure to minimum wage changes, which do not match one-to-one with the definitions in the CBAs, our estimates should be interpreted as reduced-form intend-to-treat (ITT) estimations, possibly inducing attenuation bias. Second, we assume that job applicants are aware of the timing of the minimum wage adjustments and, therefore, can update their applications after minimum wages are increased. Inattention to minimum wages should work against finding application effects and, therefore, should also exert downward bias in our estimations.29
Estimating equations
In what follows, xit denotes the variable x of cell in calendar time (month) , where a cell is a 2-digit industry-by-1-digit occupation combination. Cells included in the balanced panel are cells for which we observe at least one posted vacancy during the whole period. In the data, we observe vacancies spanning 70 2-digit industries and 8 1-digit occupations. In terms of our unit of observation, we observe vacancies in 506 different cells (of a potential of 560). Our period consists on 108 months between October 2011 to September 2020, giving form to a total sample size of 54,648.
Since treated cells potentially increase the minimum wage every six months, we implement a stacked event study as follows (Cengiz et al., 2019; Gardner, 2021; Baker et al., 2022; Dube et al., 2023). We define event periods ranging from three months before a minimum wage increase to two months after. This modeling decision means that event periods run either from October to March, or from April to September, such that pre- and post-event indicators are defined relative to January or July. Each event is indexed by e. We consider data from October 2011 to September 2020, which translates into 18 different event windows where a subset of the cells experiences a minimum wage increase. In each event, the subset of control cells is composed of cells with no minimum wage increase. Then, we estimate standard event specifications by allowing the cell fixed effects to vary by event. Since event periods do not overlap, time fixed effects automatically vary by event, and events are uniquely determined by calendar time, e(t). To add more flexibility, we also allow time fixed effects to vary by 1-digit industries.
Formally, the estimating equation is given by:

is an outcome of interest for cell in time . Diτe(t) are event indicators, where τ denotes the distance from the event (in months) meaning that Diτe(t) is equal to one if cell was treated τ months ago in event e(t). αie(t) are cell-by-event fixed effects. Yj(i)t are month-by-1-digit industry fixed effects. are controls for the small share of minimum wage changes that occur in months different from January or July (see Panel (c) of Figure 7), whose effect is allowed to vary by event.30 Under the parallel trends assumption, βτ identifies causal effects from the minimum wage increase on . As it is standard in event studies, β−1 is normalized to 0. Since minimum wage changes may be correlated within CBA across occupations, we cluster standard errors at the 2-digit industry level.
To provide a quasi-experimental test for the cross-sectional directed search patterns documented in Section 3, we define Yit, our main outcome of interest, as the median number of applications received by vacancies of cell posted in month t. We also consider a variation of equation (10) that interacts the event indicators with lower- and higher-skill occupation indicators. The sparsity of the balanced panel implies that Yit = 0 is a frequent outcome, so we estimate the equation in levels and then compute back-of-the-envelope estimates of the implied elasticity using external data on average minimum wage increases. As a complement to our directed search test, we also estimate effects of other outcomes at the cell-by-time level such as number of posted vacancies, openings, share of vacancies advertising non-wage amenities, and share of vacancies posting job requirements.
To provide summary results, we also report estimates from standard pooled DID regressions:

where Tie(t) is an indicator variable that takes value 1 if cell is treated in event e(t), Postt is an indicator variable that takes value 1 if month is equal to or larger than the treatment month (that is, if corresponds to either January, February, March, July, August, or September), and all other variables are defined as in equation (10). The coefficient of interest in this specification is β.
Table 11 presents descriptive statistics of the estimation sample. 47% of the observations exhibit at least one vacancy opening. The mean number of openings, including the zeros, is 4.62. The median and mean number of applications per opening is 35.33 and 43.89, respectively. 51% of the observations correspond to treated cell-by-event groups. Panels (b) and (c) break the statistics by low- and higher-skill occupations. The share of observations with at least one opening is remarkably similar across groups, although lower-skill vacancies usually exhibit more openings and more applications. Not surprisingly, lower-skill occupations are more likely to be treated than higher-skill occupations (60% versus 43%).
3.3 Application effects of the minimum wage
Our main results use the median number of applications per opening at the cell-level as dependent variable. Figure 8 shows the estimated βτ coefficients of equation (10) with their corresponding 95% confidence intervals. Panel (a) shows the event study that pools all vacancies. The plot suggests that applications to vacancies in exposed cells increase after the minimum wage adjustments, although the increase is small and non-statistically significant at conventional levels. However, as shown in Panel (b), when interacting the event indicators with the low- and higher-skill occupation dummies, minimum wage increases tend to generate a significant increase in applications to exposed lower-skill vacancies with no effect on exposed higher-skill vacancies. Panel (c) plots the results from an analog triple difference regression, showing that the difference between lower- and higher-skill occupations is statistically significant, especially in the first month after the minimum wage adjustment. Table 12 shows the results of the pooled DID. Panel (a) shows results for the specification with no interactions, which estimates a noisy increase in 2.6 applications at the treated occupation-by-industry cell level, with an implied elasticity of 1.15 (Column (1)). Panel (b) shows the results for the specification with interactions for the occupational groups. The estimated effect for lower-skill vacancies is a significant average increase of 4.5 applications per cell, with an implied elasticity of 1.59. For higher-skill vacancies, the implied elasticity is only 0.02 (Column (1)).
Two aspects of this result are worth discussing. First, the quasi-experimental exercise mirrors the cross-sectional finding of heterogeneous patterns of directed search across occupations. This is especially remarkable given the differences between the used variation, design, and set of vacancies. Second, the magnitude of the implied wage-applications elasticity in lower-skill vacancies is similar in magnitude, albeit on the lower end of the distribution, to the labor supply elasticity estimates documented in the empirical monopsony literature (Sokolova and Sorensen, 2021). This benchmark is reassuring given the reasons for which we expect attenuation bias in our regressions.
Robustness checks and within-vacancy design
Table 12 provides some robustness checks to our main estimates. For the sake of brevity, we focus the discussion on the specification including interactions by occupational group (Panel (b)). We also discuss below results from an alternative within-vacancy research design that yields similar results.
Column (2) of Panel (b) shows that using mean instead of median applications per cell-by-time generates similar, albeit slightly smaller, estimates. Yet, the fact that the panel is sparse and the distribution of applications per vacancy is skewed suggests that the median may be a better-behaved measure at the occupation-by-industry-by-month level. Since the equation is estimated in levels, outliers may play a significant role in driving the results. Columns (5) and (6) show that excluding the event window-by-cell units for which the median number of applications per opening per cell in at least one month exceeded 750 attenuates the results, but the qualitative conclusions do not change. Finally, Columns (9) and (10) show that restricting the event window-by-cell units for which the cell had openings in at least two months barely changes the point estimates, although it decreases precision.31
As an additional robustness check, we estimate the application effects of the minimum wage using a different research design that exploits within-vacancy variation. We consider the sample of vacancies that are open when a minimum wage change potentially occurs (that is, either between June and July or between December and January) and estimate DID regressions at the vacancy level, comparing exposed and non-exposed vacancies before and after the policy change. This design allows us to refine the previous analysis as it controls for vacancy fixed effects and thereby captures time-invariant unobserved heterogeneity at the vacancy level. At the same time, since vacancies are usually open during only one month or less (see Table 1), we are not able to transparently assess the parallel trends assumption. The sample size, moreover, decreases because vacancies posted in other months are not included in the sample and because most applications to vacancies are made in the first few days of the vacancy period (see Figure B.8 of Appendix B).32 This pattern implies that we need to restrict to vacancies that have been open for a few days when the minimum wage change kicks in. Given these advantages and limitations, we see the within-vacancy design as a complement to the previous analysis, where we are interested in whether the main conclusions hold across the two empirical strategies.
Our baseline sample of vacancies used in the within-vacancy design consists of the 2,129 vacancies (2.7% of the total sample) that were posted between June 25 and June 30 or between December 26 and December 31 in any of the years considered. Since we estimate the regression in levels, we exclude vacancies that receive more than 1,000 applications. Table B.15 of Appendix B shows descriptive statistics. With this sample, we estimate the following regression:

where Yjt are the applications per opening to vacancy j in month t, Tj is an indicator that takes value 1 if the vacancy j is treated, Postt is an indicator if month is either January or July, αj are vacancy fixed effects, and γt are months (calendar time) fixed effects. As above, treatment status is determined based on the industry-by-occupation-by-adjustment window attached to the vacancy.
Table B.16 of Appendix B shows the results. We estimate regression (12) for different sub-samples based on the days the vacancy was open before the potential policy change. Columns (1), (2), (3), and (4) show results for vacancies that were open for 3 days or less, 4 days or less, 5 days or less, and 6 days or less, respectively. We note two findings. First, while they are noisy, results imply that treated lower-skill vacancies receive an increase in applications after the minimum wage increase, with no corresponding effect in higher-skill vacancies. That is, the within-vacancy exercise supports the patterns documented so far. Second, the magnitude of the effect is decreasing in the days open before the policy change. The implied elasticity for lower-skill vacancies is 5.1, 2.6, 1.4, and 0.4 in the corresponding columns. This is consistent with vacancies being more salient when they are recently posted.
Heterogeneity by applicant characteristics
Table 13 presents results of equation (11) with occupation interactions but using applications from particular groups of applicants as the dependent variable. All groups exhibit larger responses for lower-skill vacancies relative to higher-skill vacancies. Consistent with the cross-sectional analysis, we find larger and more significant application responses to wages for male and older applicants. The implied wage-application elasticity to lower-skill vacancies is 2.3 for male applicants, relative to a non-significant estimate of 1 for female applicants. Likewise, the lower-skill elasticity for older applicants is 1.7, compared to a 1.4 estimate for younger applicants. The implied elasticities, however, are not different between employed and unemployed applicants, and are stronger for job seekers with no tertiary education, which contrasts from what was found in the cross-sectional analysis. This difference may be driven by the fact that, within occupation and industry, less educated applicants may be more attached to minimum wage jobs than highly educated applicants.
3.4 Additional results
In the remainder of the section, we discuss results for complementary dependent variables.
Vacancies and openings
The positive effect of minimum wages on applications may come at the expense of a contraction in labor demand in terms of vacancies or openings. We test this hypothesis by estimating similar models as above using the total number of vacancies and openings per cell as the dependent variable. Figure 9 and Table 12 show that we do not find any detectable effect on vacancies and openings. This result suggests that the increase in applications may help firms buffer the increase in labor costs and/or that firms are adjusting other margins to pay for the increased minimum wage.
Advertised non-wage amenities
If providing amenities is costly for firms, advertised non-wage amenities could decrease after the minimum wage increase (Clemens, 2021). We test this hypothesis by estimating similar models as above using the share of vacancies that advertise non-wage amenities as the dependent variable. Figure B.6 and Table B.17 of Appendix B suggest the absence of negative responses on advertised amenities. The only advertised amenity that exhibits a non trivial negative implied elasticity is bonuses and commissions, however, the event studies suggest that the negative effect is possibly driven by differential pre-trends.
Vacancy requirements
Finally, firms could react to increased labor costs by becoming more selective in terms of education and skills requirements. Evidence of this narrative has been presented by Butschek (2021) and Clemens et al. (2021). We test for this hypothesis by estimating similar models as above using the share of vacancies that impose requirements as the dependent variable. Figure B.7 and Table B.18 of Appendix B suggest the absence of increases in education and skill requirements, although estimates are imprecise enough to make strong claims about these results. The only slightly significant positive estimate is an estimated increase in the share of higher-skill vacancies that require a college degree.
Conclusions
In this paper, we assess patterns of directed search in job applications, focusing on the role of posted wages and advertised non-wage amenities. Using rich data from a prominent online job board in Uruguay, we are able to provide a series of cross-sectional facts on job applications, which we then corroborate causally using plausibly exogenous minimum wage variation.
First, we document substantial heterogeneity across applicants in the number of applications they send within an application spell, and find a large degree of diversification in terms of the occupations and industries of the vacancies they apply to within job seekers that send multiple applications. Second, we find robust evidence of directed search based on posted wages that is driven by vacancies attached to lower-skill occupations, with applications to vacancies attached to higher-skill occupations showing no responsiveness to posted wages. The directed search pattern is found to be stronger for male, employed, older, college-educated, and skilled job applicants. Finally, by applying text analysis to the job ads, we elicit advertised non-wage amenities and find that they play a key role in the application process. We find evidence of directed search based on amenities and show that applications to lower-skill vacancies are consistent with lexicographic job preferences where amenities affect applications only when wages are not posted. We also find substantial heterogeneity on the role of non-wage amenities by amenity, occupation, and applicant characteristics. The occupational heterogeneity in directed search is supported by a quasi-experimental exercise that uses minimum wage variation at the industry-by-occupation level to document positive application effects of minimum wage increases in lower-skill occupations. This exercise also suggests the absence of responses in the number of vacancies, openings, advertised amenities, or vacancy requirements after minimum wage increases.
Our findings help inform several mechanisms behind the search-and-matching process in the labor market. They are consistent with models of directed search and suggest that industry- and firm-wage differentials can be rationalized by the existence of rents rather than strong worker attachment to industries. They moreover unveil important occupational heterogeneities, which are consistent with the larger incidence of wage posting (rather than bargaining) in lower-skill occupations that has been documented in related literature.
Based on our findings, several avenues of future research may be worth pursuing. First, it seems promising to explore the fundamental differences between occupations more deeply. While we conjecture that the differential incidence in wage posting and bargaining can explain these differences, further research is needed to depict a clearer picture of that pattern. Second, we have been able to exploit plausibly exogenous variation in wages, but additional causal analyses that rely on exogenous variation in amenities would further enhance the understanding of the job application process. Beyond their potential for informing economic theory, such analyses have practical value in that they shed light on how certain governmental interventions and firms’ recruitment strategies affect the applicant pool.
Figures and Tables
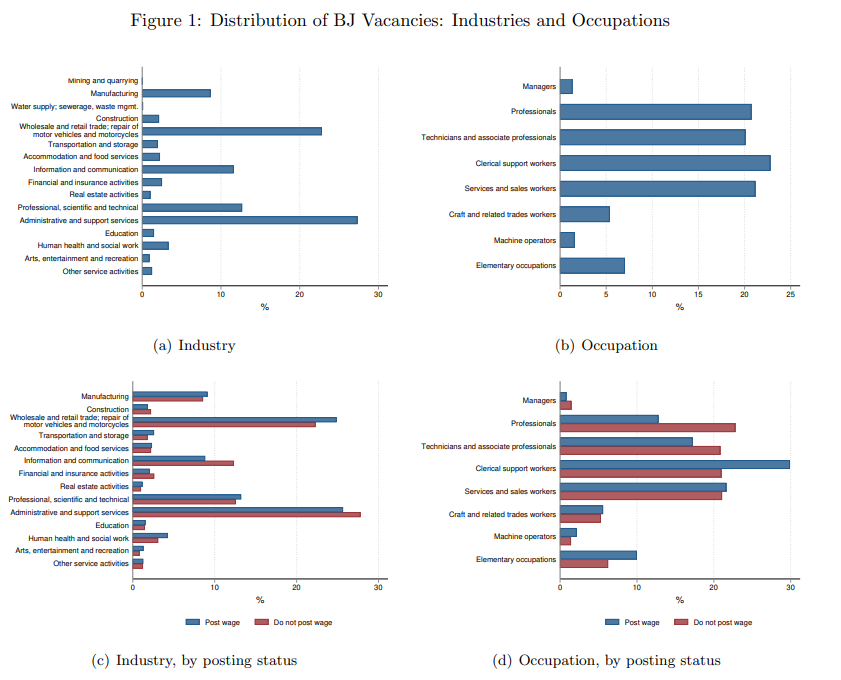
Notes: This figure plots the distribution of industries and occupations of our sample of vacancies. Panel (a) shows the distribution of vacancies over one-digit industries (ISIC Rev. 4). Panel (b) shows the distribution of vacancies over one-digit occupations (ISCO-08). Panels (c) and (d) replicate Panels (a) and (b) by showing these distributions separately for vacancies that post and do not post a wage. Industries and occupations for which there are no vacancies in the BJ data are omitted from the figures.
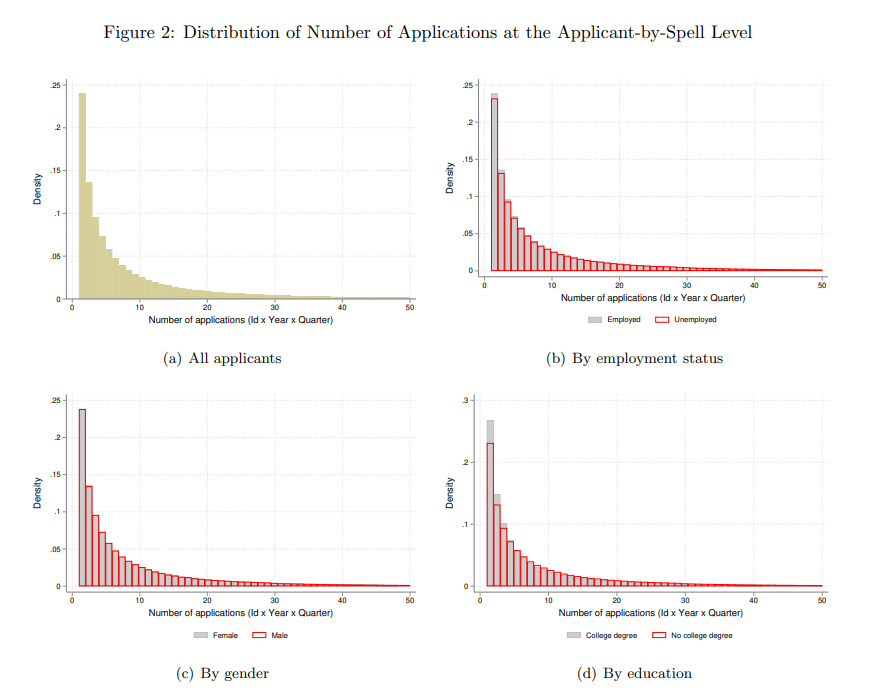
Notes: This figure shows histograms for the number of applications made by applicants in a quarter-by-year to our final sample of posted vacancies (see Section 1 for details on the sample restrictions). Panel (a) considers all applicants. Panel (b) distinguishes applicants by employment status. Panel (c) distinguishes applicants by gender. Panel (d) distinguishes applicants by educational attainment. These plots only consider applicant-quarter-year combinations with a positive number of applications. For readability, we censor the histograms at 50 applications.
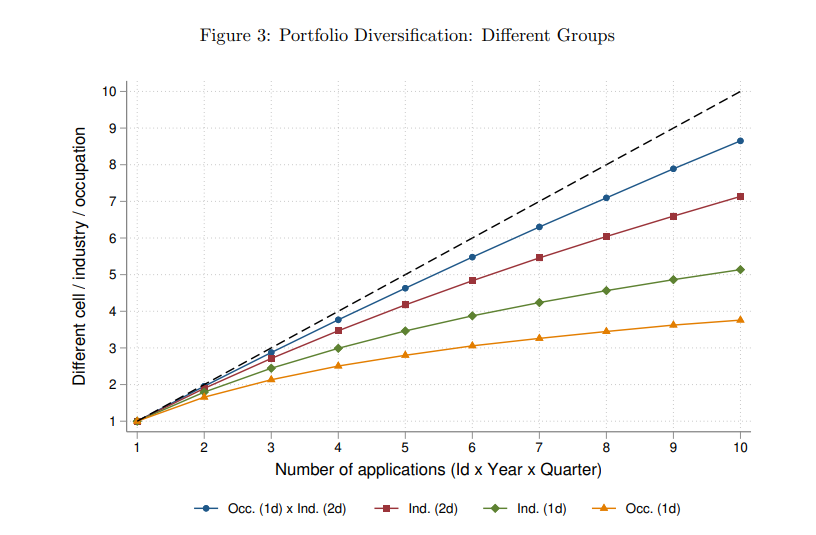
Notes: This figure plots the statistic described in equation (1), the average number of “groups” individuals apply to in each quarter-by-year, as a function of the total number of applications made in the quarter-by-year to our final sample of posted vacancies (see Section 1 for details on the sample restrictions). “Groups” refer to 2-digit industries by 1-digit occupation cells (blue curve, which considers 504 categories), 2-digit industries (red curve, 70 categories), 1-digit industries (green curve, 14 categories), and 1-digit occupations (yellow curve, 8 categories). For readability, we censor the figure at 10 applications.
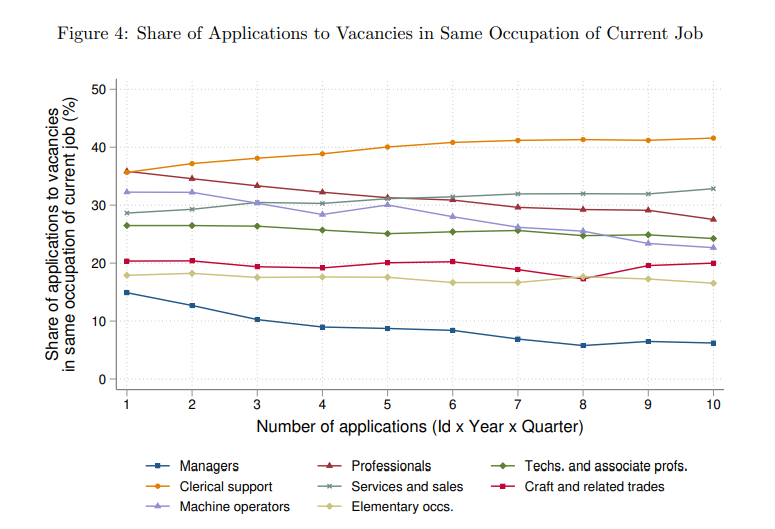
Notes: This figure plots the share of applications made to vacancies attached to the same 1-digit occupation of the current employment as a function of the total number of applications made in the quarter-by-year to our final sample of posted vacancies (see Section 1 for details on the sample restrictions). By construction, this figure only considers applicants who are employed in the quarter-year of the application. As an example, around 15% of applications from job seekers employed as managers, who make 1 application in a given quarter-by-year, target managerial jobs (with the remaining applications targeting jobs in other 1-digit occupations); and around 8% of applications from job seekers employed as managers, who make 10 applications in a given quarter-by-year, target managerial jobs.
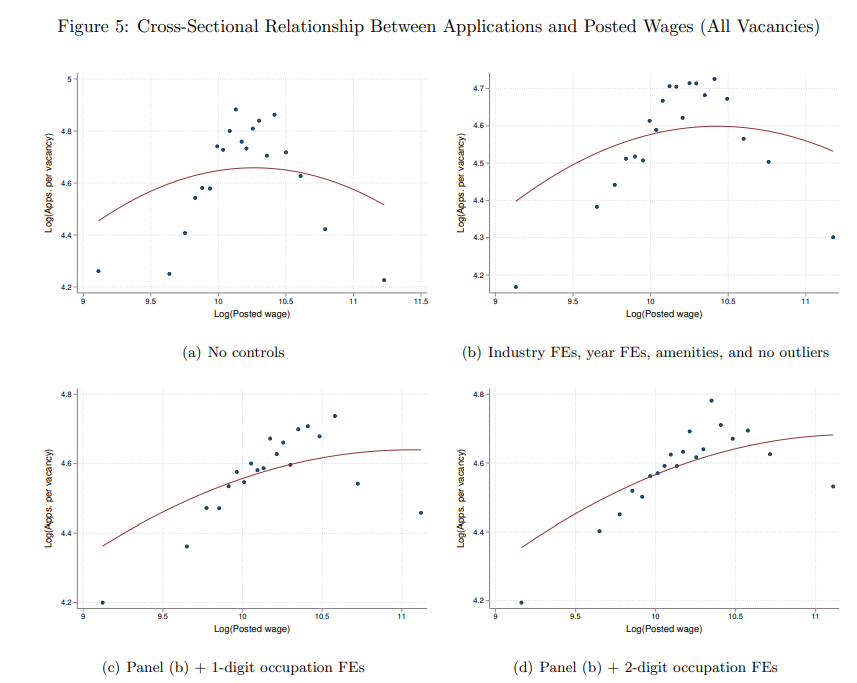
Notes: This figure shows binned scatterplots and corresponding quadratic fits for the relationship between the log number of applications per vacancy and the log posted wage. The analysis considers all vacancies in our final sample that post a wage (see Section 1 for details on the sample restrictions). Panel (a) does not include controls. Panel (b) excludes vacancies receiving more than 1,000 applications and includes 2-digit industry fixed effects, year fixed effects, and controls for advertised amenities (indicators for bonuses and commissions, schedule flexibility, work environment/impact on society, working in teams, and human capital development). Panels (c) and (d) augment Panel (b) specification by including 1-digit and 2-digit occupational fixed effects, respectively.
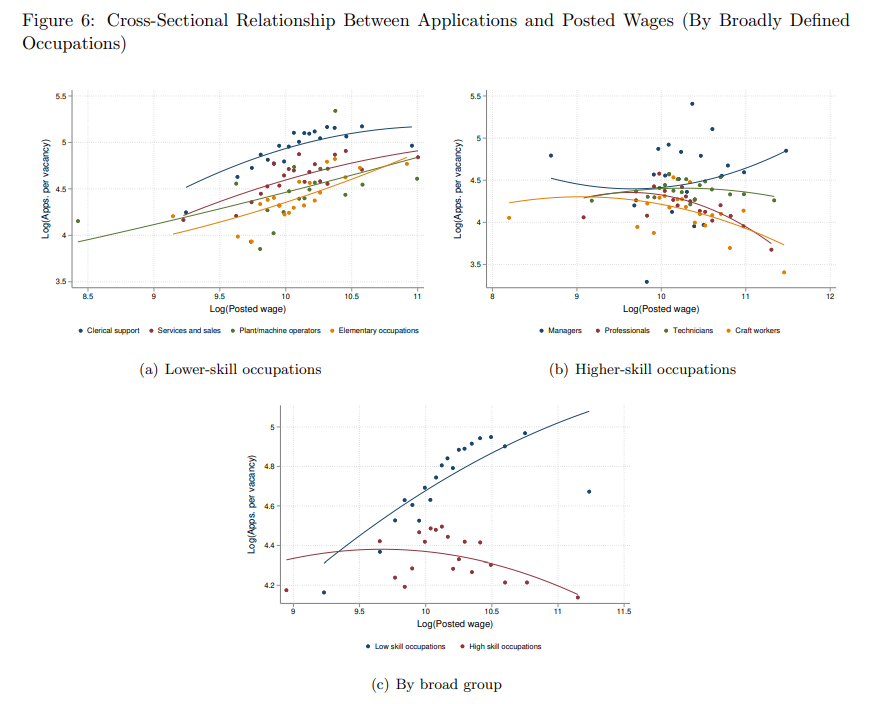
Notes: This figure shows binned scatterplots and corresponding quadratic fits for the relationship between the log number of applications per vacancy and the log posted wage separately by occupation. The analysis considers all vacancies in our final sample that post a wage (see Section 1 for details on the sample restrictions). All plots exclude vacancies receiving more than 1,000 applications and include 2-digit industry fixed effects, year fixed effects, and controls for advertised amenities (indicators for bonuses and commissions, schedule flexibility, work environment/impact on society, working in teams, and human capital development). Panel (a) plots the aforementioned relationship for lower-skilled occupations (clerical support, services and sales, plant and machine operators, and elementary occupations). Panel (b) plots the aforementioned relationship for higher-skilled occupations (managers, professionals, technicians and associate professionals, and craft workers). Panel (c) plots the aforementioned relationship separately for the two aggregate occupational groups.
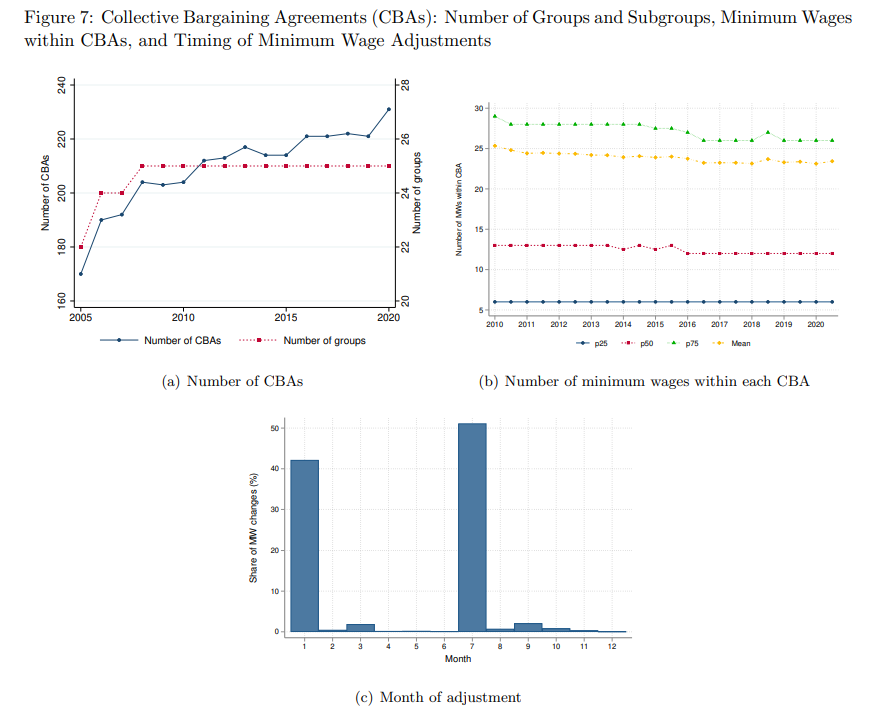
Notes: This figure presents descriptive facts on the scheme of CBAs. Panel (a) shows the number of sectoral groups and related subgroups that determine the CBAs by year. Panel (b) shows the distribution of the number of minimum wages that are specified within each CBA by year. Panel (c) shows the monthly distribution of minimum wage adjustments, pooling all changes observed in our period.
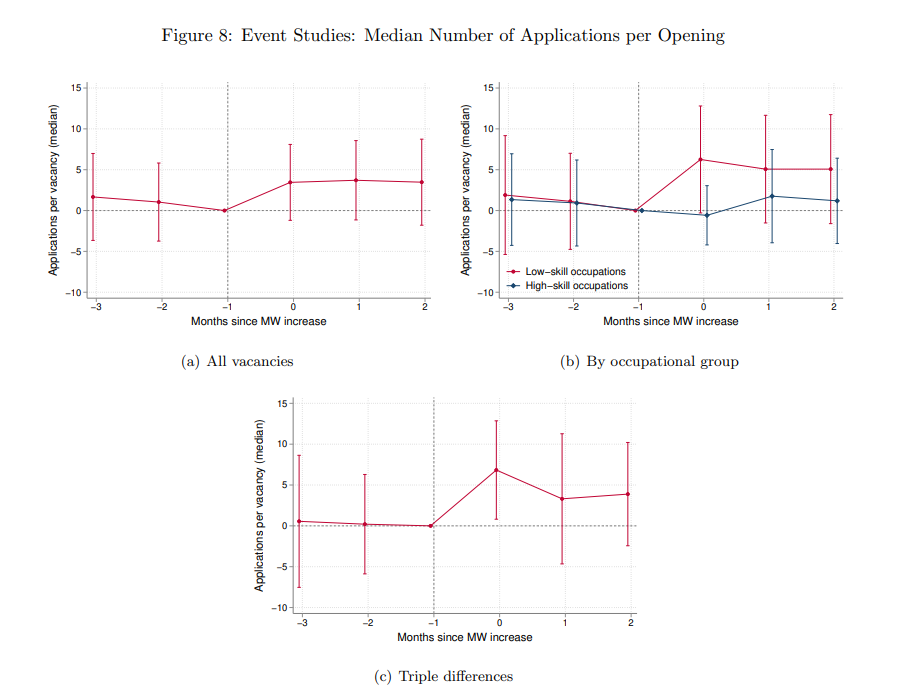
Notes: These figures plot the estimated βτ coefficients of equation (10) with their corresponding 95% confidence intervals using the median number of applications per vacancy within the sample of vacancies attached to the corresponding industry-by-occupation cell. Panel (a) pools all vacancies. Panel (b) considers interactions with indicators for lower- and higher-skill occupational groups. Panel (c) plots the corresponding triple difference, where the coefficient is interpreted as the difference between lower- and higher-skill vacancies. Regressions control for cell-by-event fixed effects, calendar month-by-1 digit-industry fixed effects, and minimum wage changes not occurring in January or July (see Panel (c) of Figure 7). Standard errors are clustered at the 2-digit industry level.
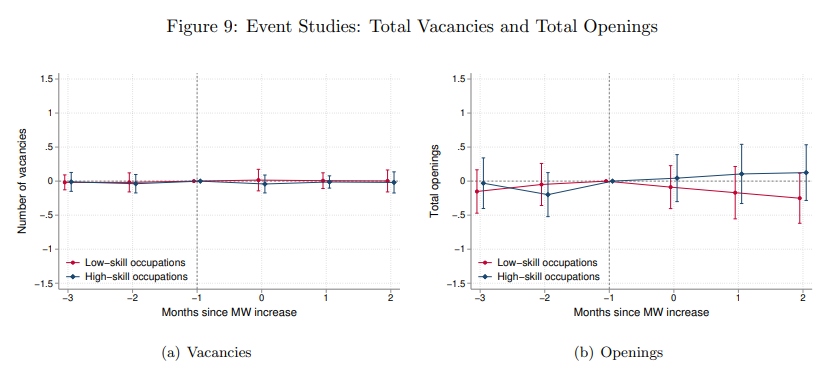
Notes: These figures plot the estimated βτ coefficients of equation (10) with their corresponding 95% confidence intervals using different dependent variables. Coefficients are interacted with indicators for lower- and higher-skill occupational groups. Panel (a) uses the total number of posted vacancies as a dependent variable. Panel (b) uses the total number of openings as the dependent variable. Regressions control for cell-by-event fixed effects, calendar month-by-1 digit-industry fixed effects, and minimum wage changes not occurring in January or July (see Panel (c) of Figure 7). Standard errors are clustered at the 2-digit industry level.
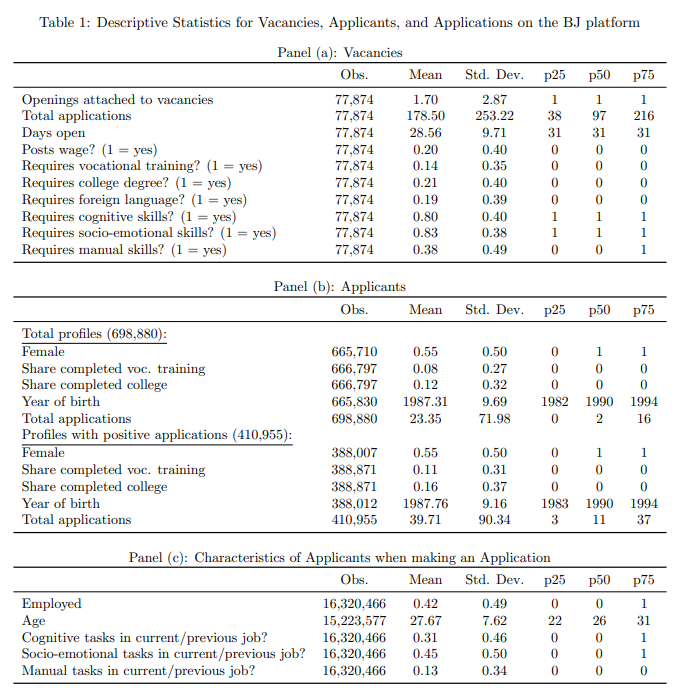
Notes: This table shows summary statistics. Panel (a) shows statistics for vacancies in our final sample (see Section 1 for details on the sample restrictions). Panel (b) shows statistics for applicants registered in the BJ platform. Panel (c) shows statistics for applicants at the time of application, only considering applications to our final sample of vacancies. In Panel (a), “vocational training” is defined as tertiary-level training, whereas the variable additionally captures lower levels of vocational training in Panel (b).
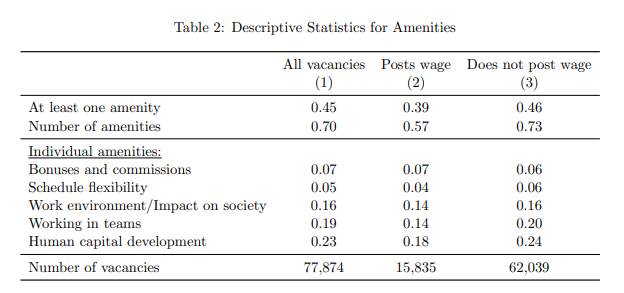
Notes: This table shows summary statistics for the amenities advertised in our final sample of vacancies (see Section 1 for details on the sample restrictions). Advertised amenities were elicited following Adamczyk et al. (Forthcoming). The table details whereas vacancies advertise at least one amenity, the number of amenities advertised per vacancy, and provides information for each of the five individual amenities. Statistics are also shown separately between vacancies that post a wage and vacancies that do not post a wage.
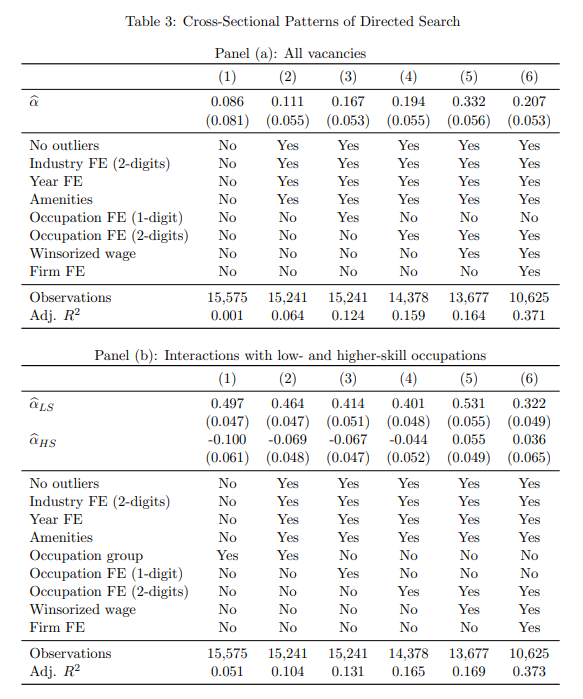
Notes: Panel (a) presents the estimated α coefficient of equation (2). Panel (b) presents the estimated (αLS, αHS) coefficients of equation (3). The dependent variable is the log number of applications, and the key regressor is the log posted wage, so coefficients are interpreted as cross-sectional elasticities. Column (1) shows results with no controls in Panel (a) and includes a control for the occupational group in Panel (b). Column (2) excludes vacancies receiving more than 1,000 applications and includes 2-digit industry fixed effects, year fixed effects, and controls for advertised amenities (indicators for bonuses and commissions, schedule flexibility, work environment/impact on society, working in teams, and human capital development). Columns (3) and (4) add 1-digit and 2-digit occupation fixed effects, respectively. Column (5) excludes the vacancies at the top 5% of the posted wage distribution. Column (6) only considers vacancies that are posted by firms that post at least 10 vacancies in the BJ platform and includes firm fixed effects. Compared to Column (2) of Table 2, the sample size for the specificiation without controls is marginally smaller due to a few vacancies receiving zero applications; results are robust to using a Poisson model (see Appendix Table B.2). Standard errors (reported in parentheses) are clustered at the 2-digit industry level.
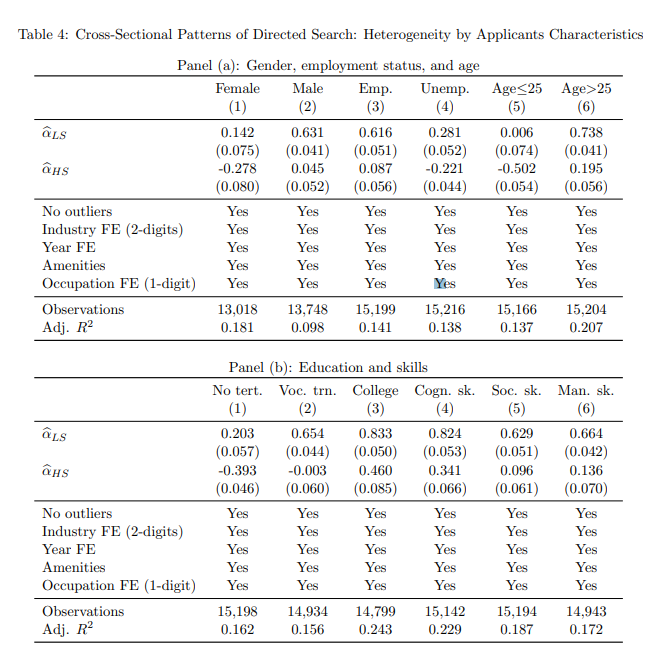
Notes: This table presents the estimated (αLS, αHS) coefficients of equation (3). The dependent variable is the log number of applications made by applicants with the characteristic depicted in the column title, and the key regressor is the log posted wage, so coefficients are interpreted as cross-sectional elasticities. Panel (a) presents results by gender, employment status, and age. Panel (b) presents results by educational attainment (without tertiary education, vocational training, and college degree) and three categories of skills (cognitive, socio-emotional, and manual skills). Regressions exclude vacancies receiving more than 1,000 applications and include 2-digit industry fixed effects, year fixed effects, controls for advertised amenities (indicators for bonuses and commissions, schedule flexibility, work environment/impact on society, working in teams, and human capital development), and 1-digit occupation fixed effects. Compared with Tables 2 and 3, discrepancies in sample sizes stem from vacancies receiving zero applications from the various groups; results are robust to using a Poisson model (see Appendix Table B.7). Standard errors (reported in parentheses) are clustered at the 2-digit industry level.
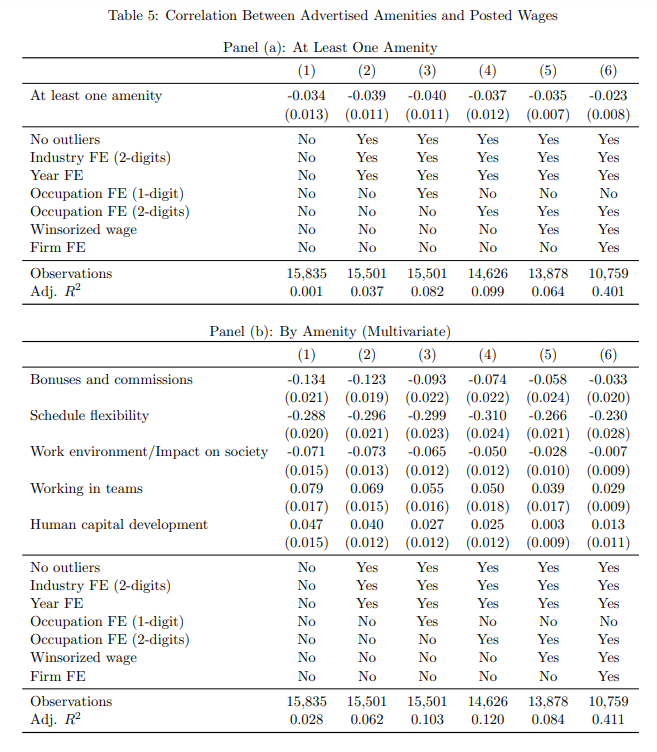
Notes: This table presents the estimated αa coefficients of equation (5). The dependent variable is the log posted wage, and the key regressors are indicators for advertised amenities, so coefficients are interpreted as cross-sectional semi-elasticities. Panel (a) presents results from regressions that include an indicator variable of advertising at least one amenity. Panel (b) presents results from regressions that include five indicators associated with individual amenities (bonuses and commissions, schedule flexibility, work environment/impact on society, working in teams, and human capital development). Column (1) shows results with no controls. Column (2) excludes vacancies receiving more than 1,000 applications and includes 2-digit industry fixed effects, year fixed effects, and controls for advertised amenities (indicators for bonuses and commissions, schedule flexibility, work environment/impact on society, working in teams, and human capital development). Columns (3) and (4) add 1-digit and 2-digit occupation fixed effects, respectively. Column (5) excludes the vacancies at the top 5% of the posted wage distribution. Column (6) only considers vacancies that are posted by firms that post at least 10 vacancies in the BJ platform and includes firm fixed effects. Standard errors (reported in parentheses) are clustered at the 2-digit industry level.
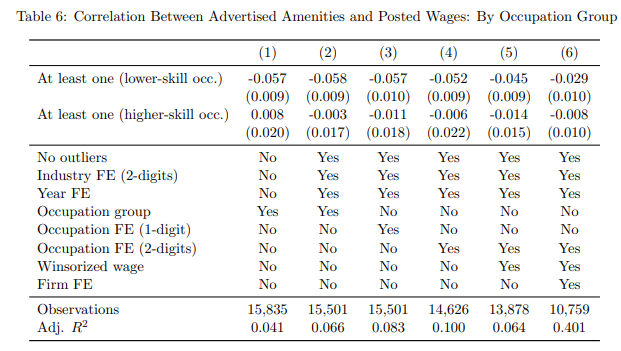
Notes: This table presents the estimated (, ) coefficients of equation (6). The dependent variable is the log posted wage, and the key regressor is an indicator of advertising at least one amenity, so coefficients are interpreted as cross-sectional semi-elasticities. Column (1) includes a control for the occupational group. Column (2) excludes vacancies receiving more than 1,000 applications and includes 2-digit industry fixed effects, year fixed effects, and controls for advertised amenities (indicators for bonuses and commissions, schedule flexibility, work environment/impact on society, working in teams, and human capital development). Columns (3) and (4) add 1-digit and 2-digit occupation fixed effects, respectively, in exchange for the occupational group indicator. Column (5) excludes the vacancies at the top 5% of the posted wage distribution. Column (6) only considers vacancies that are posted by firms that post at least 10 vacancies in the BJ platform and includes firm fixed effects. Standard errors (reported in parentheses) are clustered at the 2-digit industry level.
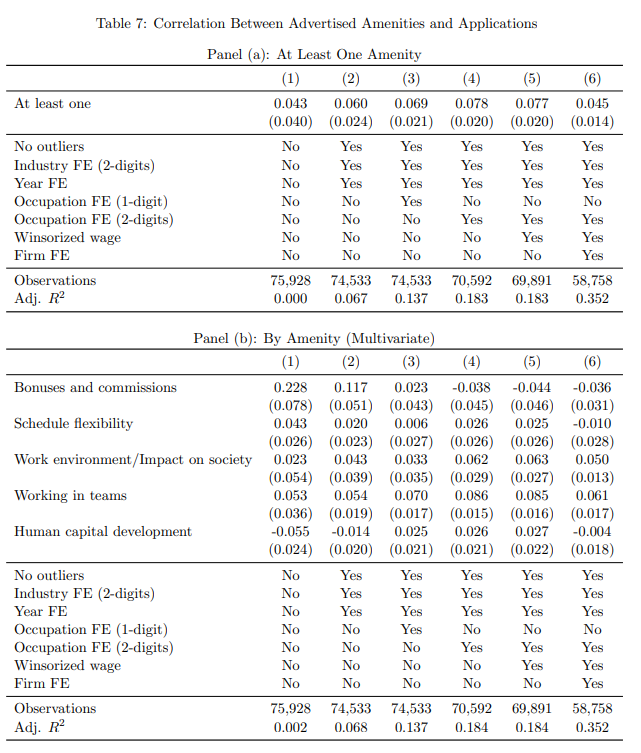
Notes: This table presents the estimated coefficients of equation (7). The dependent variable is the log number of applications, and the key regressors are indicators for advertised amenities, so coefficients are interpreted as cross-sectional semi-elasticities. Panel (a) presents results from regressions that include an indicator variable of advertising at least one amenity. Panel (b) presents results from regressions that include five indicators associated with individual amenities (bonuses and commissions, schedule flexibility, work environment/impact on society, working in teams, and human capital development). Column (1) shows results with no controls. Column (2) excludes vacancies receiving more than 1,000 applications and includes 2-digit industry fixed effects, year fixed effects, and controls for advertised amenities (indicators for bonuses and commissions, schedule flexibility, work environment/impact on society, working in teams, and human capital development). Columns (3) and (4) add 1-digit and 2-digit occupation fixed effects, respectively. Column (5) excludes the vacancies at the top 5% of the posted wage distribution. Column (6) only considers vacancies that are posted by firms that post at least 10 vacancies in the BJ platform and includes firm fixed effects. Standard errors (reported in parentheses) are clustered at the 2-digit industry level.
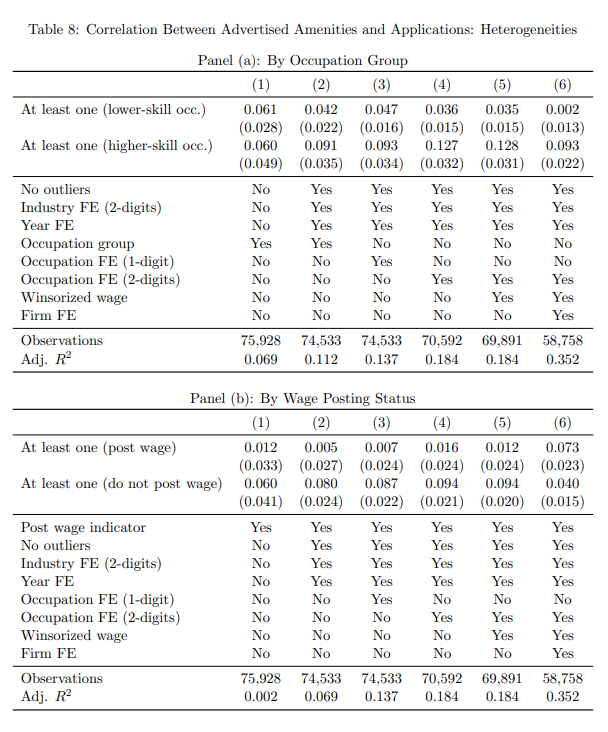
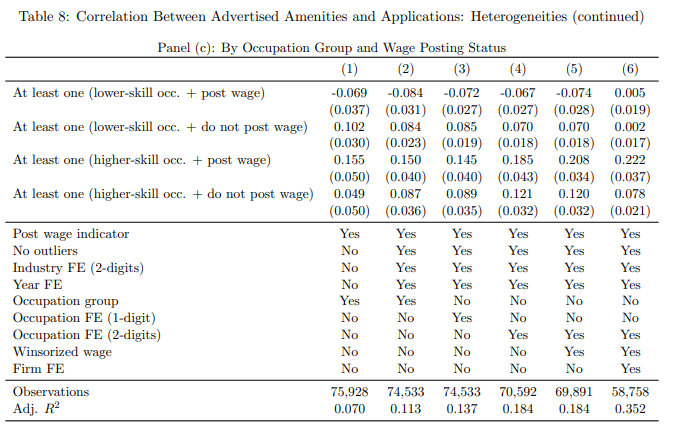
Notes: Panel (a) presents the estimated (, ) coefficients of equation (8). Panel (b) presents the estimated (, ) coefficients of equation (9). Panel (c) presents the analog estimated coefficients for the saturated model with the four interactions. The dependent variable is the log posted wage, and the key regressor is an indicator of advertising at least one amenity, so coefficients are interpreted as cross-sectional semi-elasticities. Column (1) includes a control for the occupational group in Panel (a), a control for wage posting status in Panel (b), and both indicators in Panel (c). Column (2) excludes vacancies receiving more than 1,000 applications and includes 2-digit industry fixed effects, year fixed effects, and controls for advertised amenities (indicators for bonuses and commissions, schedule flexibility, work environment/impact on society, working in teams, and human capital development). Columns (3) and (4) add 1-digit and 2-digit occupation fixed effects, respectively, in exchange for the occupational group indicator. Column (5) excludes the vacancies at the top 5% of the posted wage distribution. Column (6) only considers vacancies that are posted by firms that post at least 10 vacancies in the BJ platform and includes firm fixed effects. Standard errors (reported in parentheses) are clustered at the 2-digit industry level.
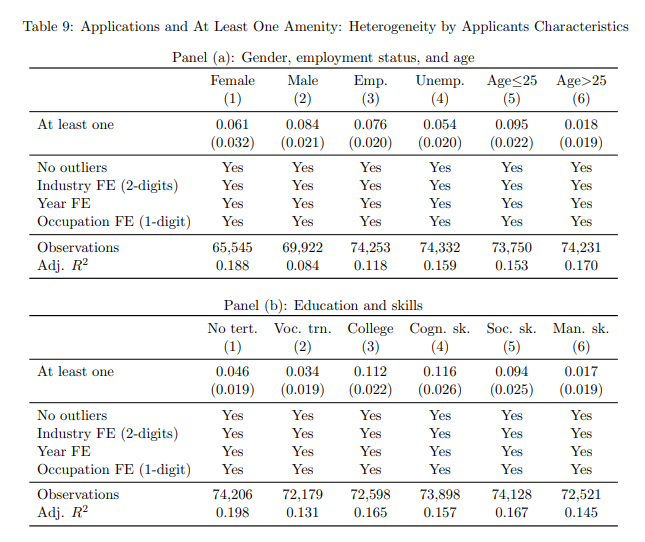
Notes: This table presents the estimated coefficients of equation (7). The dependent variable is the log number of applications made by applicants with the characteristic depicted in the column title, and the key regressor is an indicator of advertising at least one amenity, so coefficients are interpreted as cross-sectional semi-elasticities. Panel (a) presents results by gender, employment status, and age. Panel (b) presents results by educational attainment (without tertiary education, vocational training, and college degree) and three categories of skills (cognitive, socio-emotional, and manual skills). Regressions exclude vacancies receiving more than 1,000 applications and include 2-digit industry fixed effects, year fixed effects, and 1-digit occupation fixed effects. Standard errors (reported in parentheses) are clustered at the 2-digit industry level.
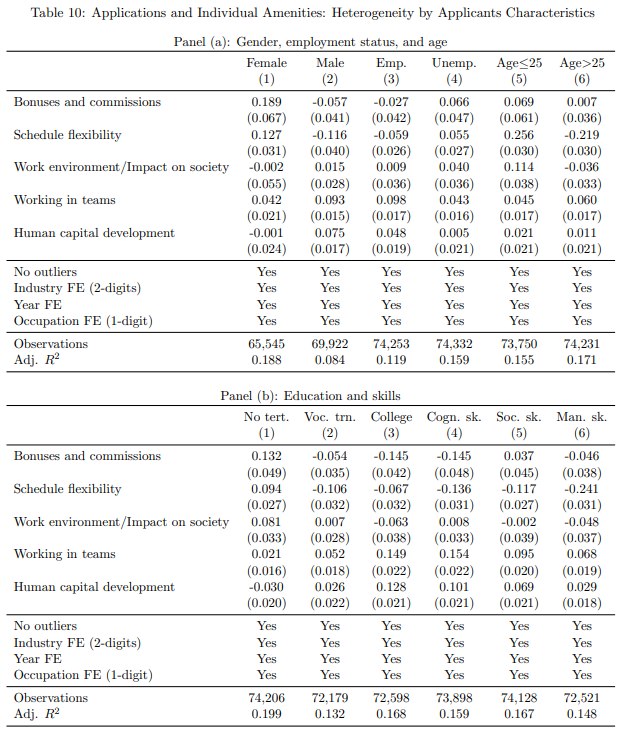
Notes: This table presents the estimated coefficients of equation (7). The dependent variable is the log number of applications made by applicants with the characteristic depicted in the column title, and the key regressors are five indicators associated with individual amenities (bonuses and commissions, schedule flexibility, work environment/impact on society, working in teams, and human capital development), so coefficients are interpreted as cross-sectional semi-elasticities. Panel (a) presents results by gender, employment status, and age. Panel (b) presents results by educational attainment (without tertiary education, vocational training, and college degree) and three categories of skills (cognitive, socio-emotional, and manual skills). Regressions exclude vacancies receiving more than 1,000 applications and include 2-digit industry fixed effects, year fixed effects, and 1-digit occupation fixed effects. Standard errors (reported in parentheses) are clustered at the 2-digit industry level.
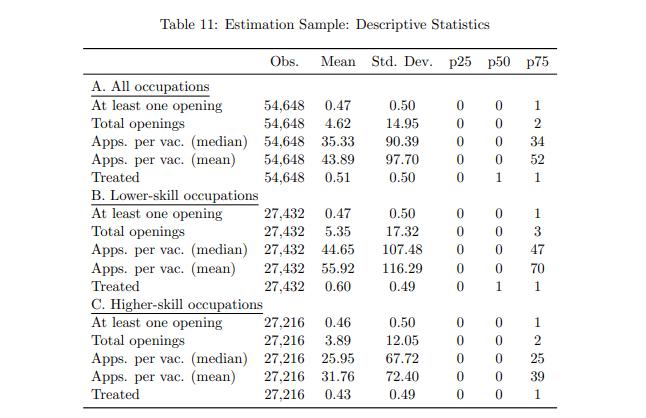
Notes: This table presents descriptive statistics of the estimation sample. The unit of observation is a 2-digit industry by 1-digit occupation cell by calendar month. Panel (a) shows summary statistics for all occupations combined. Panel (b) shows summary statistics for the lower-skilled occupational group. Panel (c) shows summary statistics for the higher-skilled occupational group.
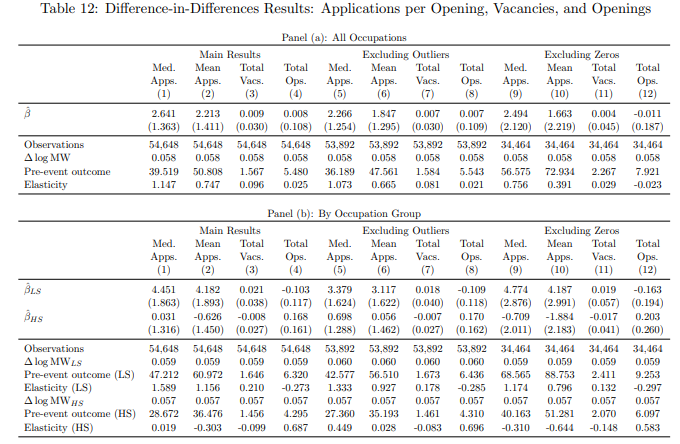
Notes: Panel (a) presents the estimated β coefficient of equation (11). Panel (b) presents the estimated β coefficients in a model that considers interactions with indicators for lower- and higher-skill occupational groups. Regressions include cell-by-event fixed effects, calendar month-by-1 digit-industry fixed effects, and minimum wage changes not occurring in January or July (see Panel (c) of Figure 7). The dependent variables, as depicted in the column titles, include (in levels) the median number of applications, the mean number of applications, the total number of vacancies, and the total number of openings. Reported elasticities are computed by dividing the β-coefficient by the pre-event average outcome within treated cells, normalized by the log change in minimum wage among treated cells. In each panel, Columns (1)-(4) present the main results, Columns (5)-(8) present results that exclude bin-by-event window observations where the median number of applications exceeded 750, and Columns (9)-(12) exclude bin-by-event window observations for which the outcome is 0 more than 4 months within the event window. Standard errors (reported in parentheses) are clustered at the 2-digit industry level.
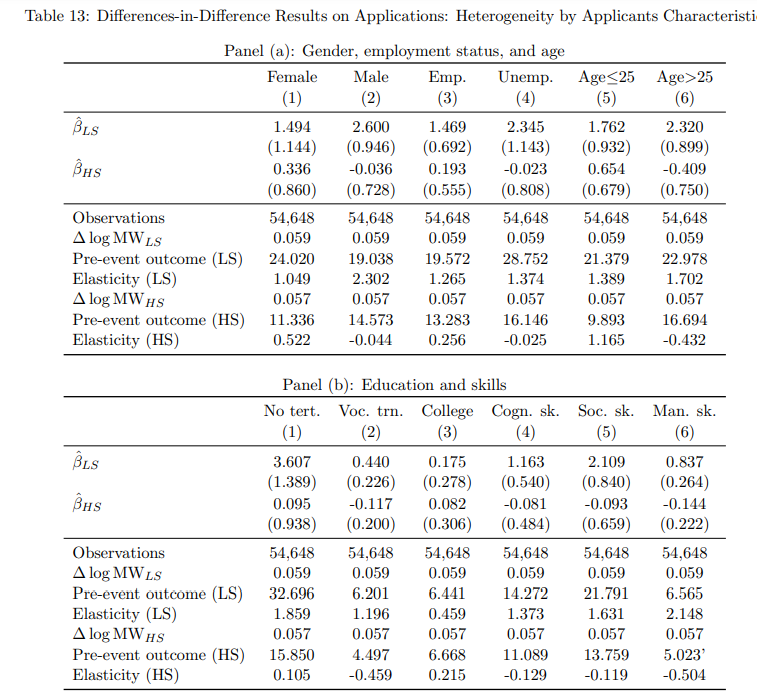
Notes: This table presents the estimated β coefficient of equation (11) in a model that considers interactions with indicators for lower and higher-skill occupational groups. The dependent variable is the number of applications made by applicants with the characteristic depicted in the column title. Regressions include cell-by-event fixed effects, calendar month-by-1 digit-industry fixed effects, and minimum wage changes not occurring in January or July (see Panel (c) of Figure 7). Reported elasticities are computed by dividing the β-coefficient by the pre-event average outcome within treated cells, normalized by the log change in minimum wage among treated cells. Panel (a) presents results by gender, employment status, and age. Panel (b) presents results by educational attainment (without tertiary education, vocational training, and college degree) and three categories of skills (cognitive, socio-emotional, and manual skills). Standard errors (reported in parentheses) are clustered at the 2-digit industry level.
A. Methodology for Creating Variables from Free Text Entries
This appendix provides an overview of the methodology used to create variables from free text entries, which is based on Adamczyk et al. (Forthcoming) and Escudero et al. (Forthcoming). We first discuss the creation of skills variables. We then discuss the creation of occupational codes. Finally, we discuss the elicitation of advertised non-wage amenities. Additional details can be found in the aforementioned papers.
A.1 Skills
All skill-related variables are based on the methodology developed in Escudero et al. (Forthcoming). Their approach seeks to provide a comprehensive representation of labor market dynamics across diverse contexts that goes beyond formal qualification measures by covering the skills demanded by employers in vacancies and highlighted by workers in their online profiles. The authors propose a taxonomy that groups skills into three broad categories: cognitive, socio-emotional, and manual skills. In turn, each category is decomposed into sub-categories, giving form to a total of fourteen subcategories. See Table A.1 for a description of each category and subcategory and the sources each category was derived from.
The taxonomy is built upon existing literature from labor economics and psychology and has been expanded to adapt it to individual country contexts, with a particular focus on emerging and developing countries and online job board data. The starting point of the categorization is established taxonomies designed for classifying skills in online data within the United States, particularly Deming and Kahn (2018). Other sources used include Heckman and Kautz (2012), Kureková et al. (2016), and Deming and Noray (2020). The first extension is to include manual skills, which are often omitted in U.S.- centered analyses. Then, the second extension expands the conceptual foundations relating to cognitive and socio-emotional skills to facilitate a more comprehensive analysis of online data beyond individuals with high formal qualifications. To achieve these expansions, the taxonomy included additional keywords and expressions drawn from various studies (see Autor et al., 2003; Spitz-Oener, 2006; Almlund et al., 2011; Heckman and Kautz, 2012; Kureková et al., 2016; Hershbein and Kahn, 2018; Atalay et al., 2020; Deming and Noray, 2020), as well as the pilot exercise for O-NET Uruguay.
To elicit the skill variables in the BJ data, the authors use a natural language processing (NLP) methodology that integrates pre-processing techniques with a rule-based classification approach, guided by the taxonomy and the specific list of keywords and phrases associated with each of the 14 subcategories. While some skills subcategories are closely linked, the keywords and expressions used to characterize them are distinct, allowing for the unique identification of skills in the data. In a second step, this dictionary is enlarged by including synonyms of the original words obtained through scraping a thesaurus website (www.wordreference.com) and manually checking the applicability of the retrieved synonyms.
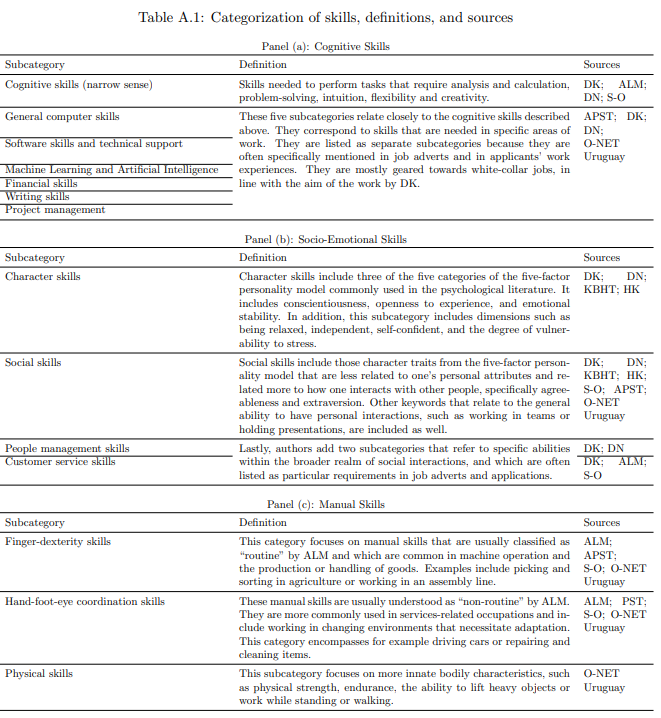
Notes: This table describes the skills subcategories presented in Table 1 of Escudero et al. (Forthcoming), based on the concrete keywords used in the taxonomy. ALM stands for Autor et al. (2003), APST for Atalay et al. (2020), DK for Deming and Kahn (2018), DN for Deming and Noray (2020), HK for Hershbein and Kahn (2018), HK for Heckman and Kautz (2012), KBHT for Kureková et al. (2016), and S-O for Spitz-Oener (2006).
This procedure leads to a total of 741 distinct skills, based on the unique keywords and expressions.
The skills-subcategory variables are then created using the unstructured text data present in both the vacancies posted by firms and the job spells of applicants available in their BJ profiles. From vacancy data, the authors elicit the skills that are demanded by the vacancy. From employment history data, the authors elicit the skills applicants report having. The open-text descriptions offer the most viable approach for creating skills variables, as they contain detailed information on skills for all vacancies (99.9%) and a majority of applicants’ job spells (68.5%). These open-text descriptions undergo a series of pre-processing steps using NLP techniques, including the translation of keywords and phrases from English to Spanish, tokenization, text normalization, lemmatization, n-gram creation in the skills taxonomy, and n-gram creation in the vacancy and applicants’ data. These processes are employed to reformat the text data into a structured format that facilitates the mapping with the skills dictionary.
Finally, the skill variables are established by tallying keywords and phrases linked to each skill category and subcategory that are found within the text. A skill is considered present if at least one of the keywords/phrases from the dictionary is identified in the text. Additionally, we calculated the frequency of keyword occurrences for each skill and use this as an indicator of the degree of intensity with which a particular skill used. See Escudero et al. (Forthcoming) for additional details.
A.2 Occupations
The raw data provided by BJ only classifies vacancies and applicants’ job spells into ISCO-08 occupation codes for a limited subset of the data. This missing data problem prevents comprehensive analyses at the occupation level. To solve this problem, Escudero et al. (Forthcoming) employed a similar methodology as the one described aboved to elicit 1- and 2-digit occupational codes for the full sample of vacancies and applicants’ job spells. To elicit the occupations posted vacancies seek to fill, the authors leveraged textual information from four open-text fields associated with each vacancy: job title, job description, required level of education, and hierarchical level of the position. To elicit the occupation associated with applicants’ job spells, the authors used the same information, except for job titles, which are not available as a separate entry. This data undergoes NLP procedures similar to the ones used for eliciting skills variables. The resulting text is then categorized into ISCO-08 codes through a three-step process.
The first step is analogous to the rule-based model employed to create the skills variables. The authors employ a dictionary of keywords, selected based on the most frequently used words and phrases from the subset of both vacancies and applicants’ job spells already classified by BJ into ISCO-08 occupational codes. The dictionary used originates from the official ISCO-08 international classification. This exercise provided the set of rules used to classify the remaining job titles into occupational categories at the 2- digit level. Additionally, the authors used information about the educational level to distinguish between levels 2 and 3, denoting individuals from the same field with either higher education (level 2) or any other education (level 3). Similarly, information about the hierarchical level is used to identify managers and directors, placing them in level 1 of the ISCO classification.
To enhance the performance of the procedure, the authors introduced a machine learning algorithm (in the form of a predictive model) to assign codes to vacancies and job spells that were unclassified or for which the original BJ assignment significantly differs from the one that results from the algorithm. This process occurs in two steps. First, the model is trained using the already classified observations to assign 1-digit ISCO codes. Second, additional information from applicants and vacancies is incorporated into a second prediction model to refine the code assignment at the 2-digit level.
Based on various tests and sensitivity analyses, the authors chose Gradient Boosting to code 1-digit and 2-digit occupations in the vacancy data, and Random Forest for the applicants’ data. As a result, 100% of vacancies have an assigned 1-digit occupation code, and 94.8% of them also have a 2-digit occupation code. For applicants, all job spells with a text description were classified at the 1-digit level, and 97.8% were also classified at the 2-digit level. See Escudero et al. (Forthcoming) for additional details.
A.3 Amenities
The methodology for identifying advertised amenities in unstructured vacancy data is akin to the one used for the skills variables, and it is based on the procedure outlined in Adamczyk et al. (Forthcoming).
To begin, we developed a taxonomy of amenities using the related empirical literature as a starting point and then extending it to better suit the Uruguayan context and the nature of online job boards. As a first source, we follow Maestas et al. (2023), who provide a list of nine job attributes based on the results from the American Worker Conditions Survey (AWCS). The survey collects workers’ assessments of nine work characteristics: schedule flexibility, telecommuting opportunities, physical demands, pace of work, autonomy, paid time off, working with others, job-training opportunities, and impact on society. To broaden the scope of the categorization, we employ the comprehensive categorization proposed by Sockin (2024), which organizes non-wage amenities in 48 categories derived from the literature using a topic-modeling machine learning algorithm implemented in the text of amenities descriptions in U.S. employer-employee data. Table A.2 lists additional sources we use to refine the procedure for specific amenities.
Given these categories, we then undertook three steps to broaden the scope of the categorization. First, we reorganized these categories to align with vacancy data. The literature primarily relies on U.S. workers’ reviews, but not all categories are pertinent to vacancy data because certain aspects of a job may not be appropriate to advertise in a posted vacancy. Second, we supplemented the list of keywords and expressions used in the literature to characterize different amenities, tailoring them to better fit the context of Uruguay. Third, we introduced an additional amenity category, “work equipment and allowances,” to reflect the post-pandemic reality and to incorporate attributes of manual work that may hold greater importance in Uruguay and other global south countries relative to the U.S. economy.
We grouped these additional keywords into five broad categories, resulting in a total of 16 amenity subcategories. In some cases, we adjusted specific subcategories to ensure there was no overlap among the keywords and expressions assigned to each subcategory. The process yielded a final set of 659 words and expressions, comprising 357 original terms and 302 different versions of the same expressions (for multiword expressions). Table A.2 provides a list of these categories, along with their definitions and, where applicable, their sources in the literature. More details are available in Adamczyk et al. (Forthcoming).
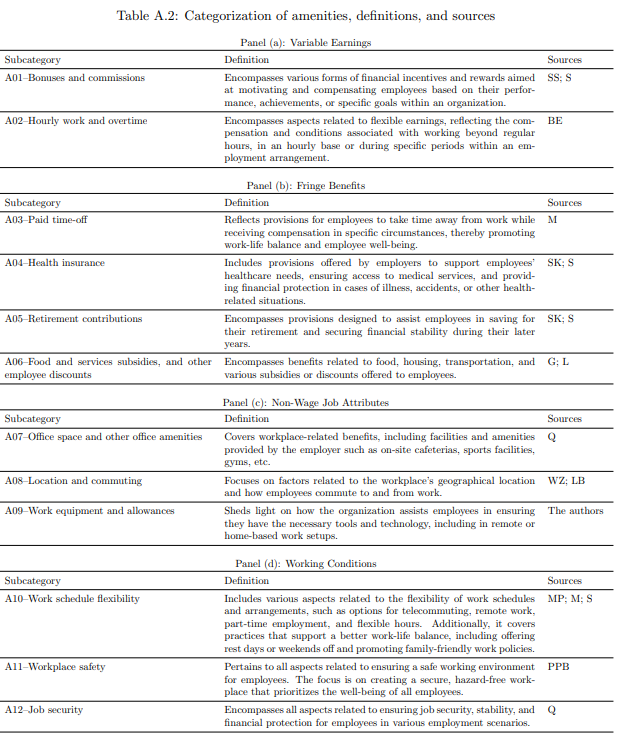
To apply this dictionary to the BJ vacancy data, both the terms in the dictionary and the free text information from the job advertisements need to be formatted appropriately. The process is similar to the one used for creating the skills variables, albeit with some modifications. These steps encompass keyword detection, tokenization (dividing the text into single units or tokens), normalization (removing capitalization and special characters), removing stop words (including exceptions for words included in the dictionary, such as ‘buen,’ ‘mucho,’ ‘gran,’ etc.), and
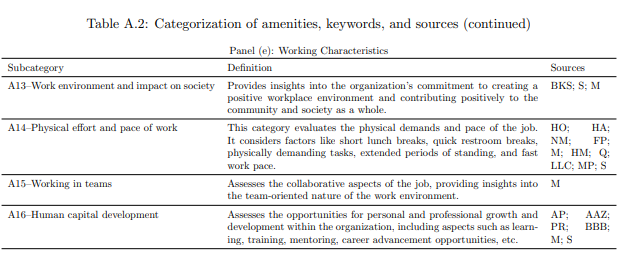
Notes: See Adamczyk et al. (Forthcoming) for additional details. S stands for Sockin (2024), SS for Sockin and Sockin (2019), BE for Beckers et al. (2008), M for Maestas et al. (2023), SK for Simon and Kaestner (2004), G for Glassdoor (2015), L for Libert (2016), Q for Quinn (1974), WZ for Wasmer and Zenou (2002); LB for Le Barbanchon et al. (2020), MP for Mas and Pallais (2017), PPB for Park et al. (2021), BKS for Breza et al. (2017), HO for Holmlund (1983), HA for Hayward et al. (1989), NM for Neumark and McLaughlin (2012), FP for Filer and Petri (1988), HM for Hamermesh (1990), LLC for Lopes et al. (2014), AAZ for Athey et al. (2000), AP for Acemoglu and Pischke (1999), PR for Parent (1999), and BBB for Barron et al. (1999).
lemmatization (associating different versions of a word, such as conjugated verb forms, with a common root word, like unconjugated verbs). Once the text describing vacancies and the keywords and expressions from the dictionary are in the same format, they can be matched using an NLP rule-based classification approach to identify amenities in the vacancy data. Importantly, this process accommodates variation in word order within expressions and allow matches with up to one external word in between the words from the dictionary expression.
The algorithm then tallies the occurrences of words and expressions from the dictionary in the vacancy texts and aggregates them for each broader amenity category. To simplify the analysis, this number is transformed into an indicator variable for each amenity subcategory. The indicator takes the value of one if any of the keywords or expressions from that particular subcategory are identified in the job advert.
Out of the 86,062 vacancies in the BJ data,33 50.6% were assigned at least one of the 16 amenities. While some vacancies list up to eight amenities, more than three-quarters of those with assigned amenities advertise only one or two. The most frequently matched subcategories are “human capital development” (22.6% of vacancies), “working in teams” (18.7%), and “work environment and impact on society” (17.9%). The lowest number of matches is found for “retirement contributions” (33 matches, or 0.04% of the observations) and “health insurance” (38 matches, 0.04% of the observations), possibly because these are legally mandated benefits that may not warrant explicit mention in the Uruguayan context.
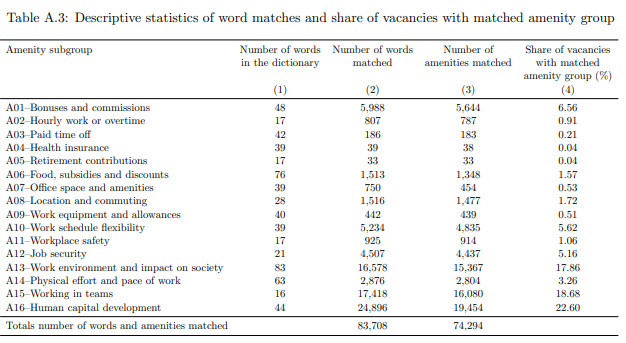
Notes: Analysis done on the base of 86,062 vacancies. See Adamczyk et al. (Forthcoming) for more details.
A comprehensive list of the share of vacancies with the assigned amenity can be found in Table A.3.
Regarding individual keywords, “trabajar en equipo (teamwork)”, which belongs to the working in teams category, is the most frequently matched (with a total of 12,579 matches). Typically, in each subcategory, a few keywords dominate the majority of matches, with other terms making smaller contributions. Figure A.1 displays word clouds for all amenity subcategories, where the size of a word corresponds to its share of matches within that subcategory. It is important to note that the use of keywords and expressions to create amenity variables underwent several rounds of manual verification to ensure that words and expressions were contextually accurate. This verification was manually conducted for a sample of vacancies for all words appearing at the top of the matches for each subcategory, as well as for a selection of other words deemed necessary by the authors of this study and Adamczyk et al. (Forthcoming). While the procedure was performed for the complete list of 16 amenities, in the analysis, we focus on the 5 amenities with the highest prevalence, namely, bonuses and commissions, schedule flexibility, work environment/impact on society, working in teams, and human capital development. The rest of the amenities are found to be relatively infrequent and also, in some cases, offer additional interpretation challenges.
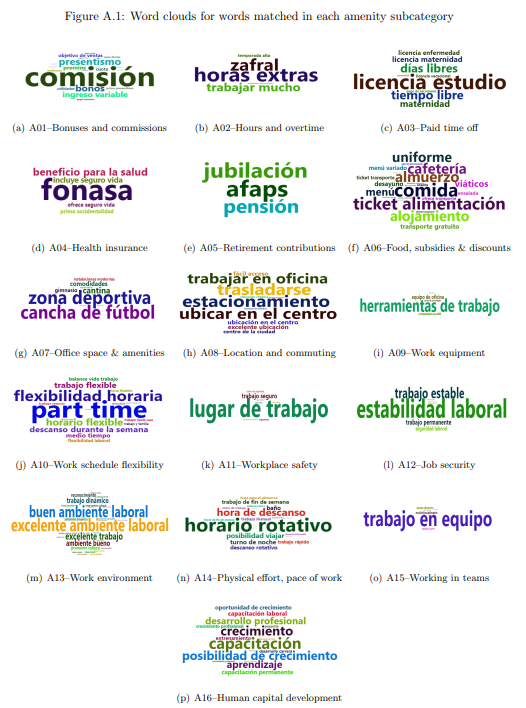
Notes: Authors’ elaboration based on Adamczyk et al. (Forthcoming). The analysis is based on the full sample of 86,062 vacancies. The words displayed in the word clouds represent the original words used to define amenities. For the matching process, these original words were lemmatized to facilitate the matching. The inclusion of original words in the figure is for clarity and ease of understanding.
B. Additional Figures and Tables
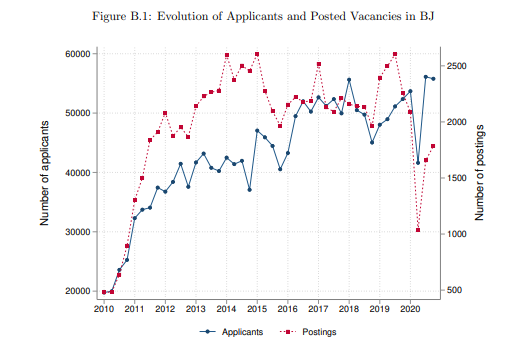
Notes: This figure shows, for each quarter between 2010 and 2020, the number of active applicants (i.e., IDs that made at least one application, left y-axis) and the number of posted vacancies in the BJ platform (right y-axis).
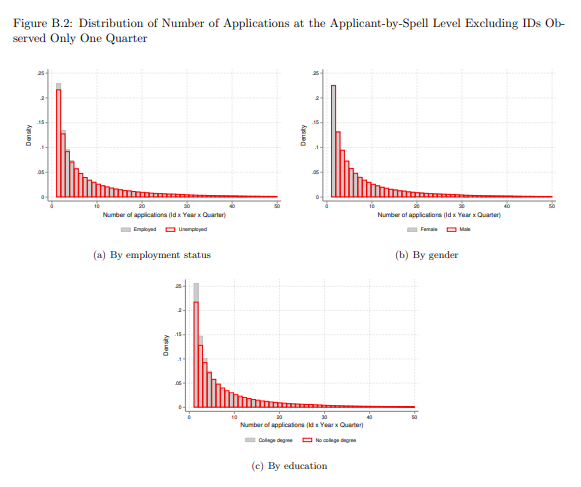
Notes: This figure shows histograms for the number of applications made by applicants in a quarter-by-year to our final sample of posted vacancies (see Section 1 for details on the sample restrictions). This figure is restricted to applicant IDs that are observed in at least two different calendar quarters. Panel (a) distinguishes applicants by employment status. Panel (b) distinguishes applicants by gender. Panel (c) distinguishes applicants by educational attainment. These plots only consider applicant-quarter-year combinations with a positive number of applications. For readability, we censor the histograms at 50 applications.
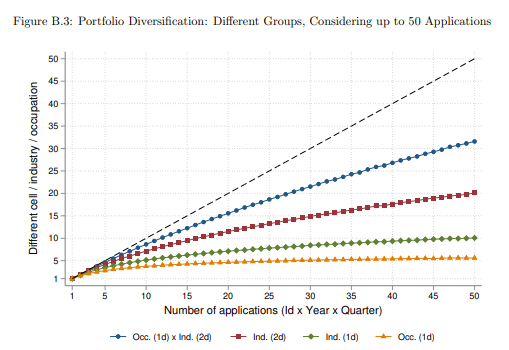
Notes: This figure plots the statistic described in equation (1), the average number of “groups” individuals apply to in each quarter-by-year, as a function of the total number of applications made in the quarter-by-year to our final sample of posted vacancies (see Section 1 for details on the sample restrictions). “Groups” refer to 2-digit industries by 1-digit occupation cells (blue curve, which considers 504 categories), 2-digit industries (red curve, 70 categories), 1-digit industries (green curve, 14 categories), and 1-digit occupations (yellow curve, 8 categories). For readability, we censor the figure at 50 applications.
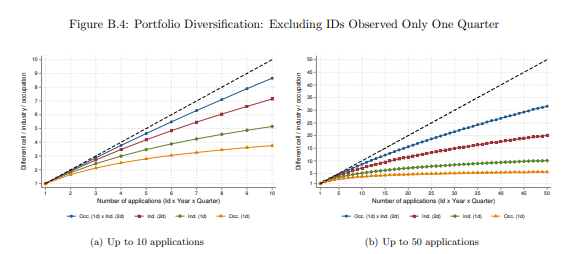
Notes: This figure plots the statistic described in equation (1), the average number of “groups” individuals apply to in each quarter-by-year, as a function of the total number of applications made in the quarter-by-year to our final sample of posted vacancies (see Section 1 for details on the sample restrictions). This figure is restricted to applicant IDs that are observed in at least two different calendar quarters. “Groups” refer to 2-digit industries by 1-digit occupation cells (blue curve, which considers 504 categories), 2-digit industries (red curve, 70 categories), 1-digit industries (green curve, 14 categories), and 1-digit occupations (yellow curve, 8 categories). The figure in Panel (a) is censored at 10 applications. The figure in Panel (b) is censored at 50 applications.
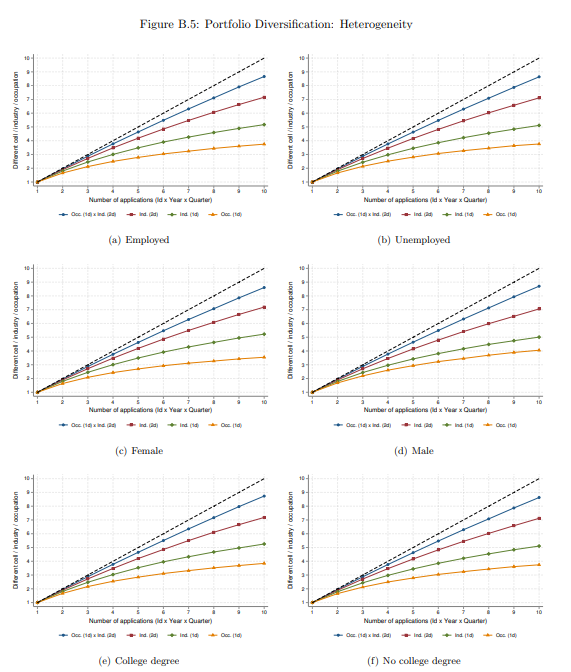
Notes: This figure plots the statistic described in equation (1), the average number of “groups” individuals apply to in each quarter-by-year, separately for applicants with different characteristics as a function of the total number of applications made in the quarter-by-year to our final sample of posted vacancies (see Section 1 for details on the sample restrictions). Panel (a) considers employed applicants. Panel (b) considers unemployed applicants. Panel (c) considers female applicants. Panel (d) considers male applicants. Panel (e) considers applicants with a college degree. Panel (f) considers applicants without a college degree. “Groups” refer to 2-digit industries by 1-digit occupation cells (blue curve, which considers 504 categories), 2-digit industries (red curve, 70 categories), 1-digit industries (green curve, 14 categories), and 1-digit occupations (yellow curve, 8 categories). For readability, we censor the figure at 10 applications.
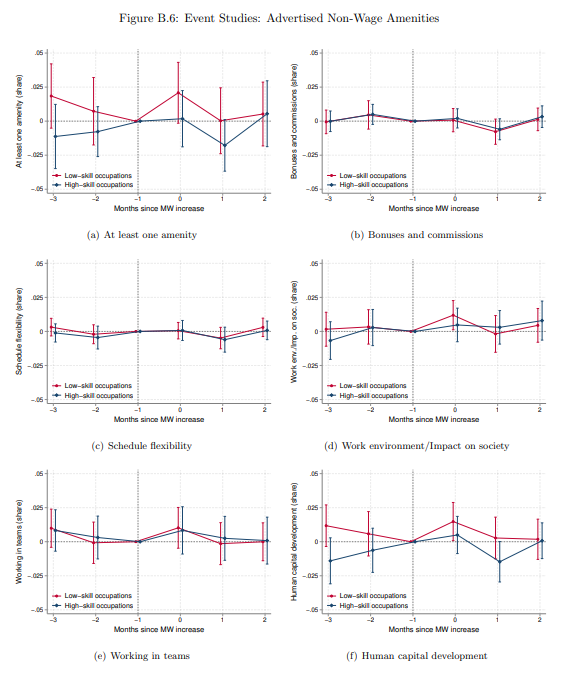
Notes: These figures plot the estimated βτ coefficients of equation (10) with their corresponding 95% confidence intervals using different dependent variables. Coefficients are interacted with indicators for lower- and higher-skill occupational groups. Panel (a) uses the share of vacancies that advertise at least one amenity as a dependent variable. Panel (b) uses the share of vacancies that advertise bonuses and commissions as a dependent variable. Panel (c) uses the share of vacancies that advertise schedule flexibility as a dependent variable. Panel (d) uses the share of vacancies that advertise work environment/impact on society as a dependent variable. Panel (e) uses the share of vacancies that advertise working in teams as a dependent variable. Panel (f) uses the share of vacancies that advertise human capital development as a dependent variable. Regressions control for cell-by-event fixed effects, calendar month-by-1 digit-industry fixed effects, and minimum wage changes not occurring in January or July (see Panel (c) of Figure 7). Standard errors are clustered at the 2-digit industry level.
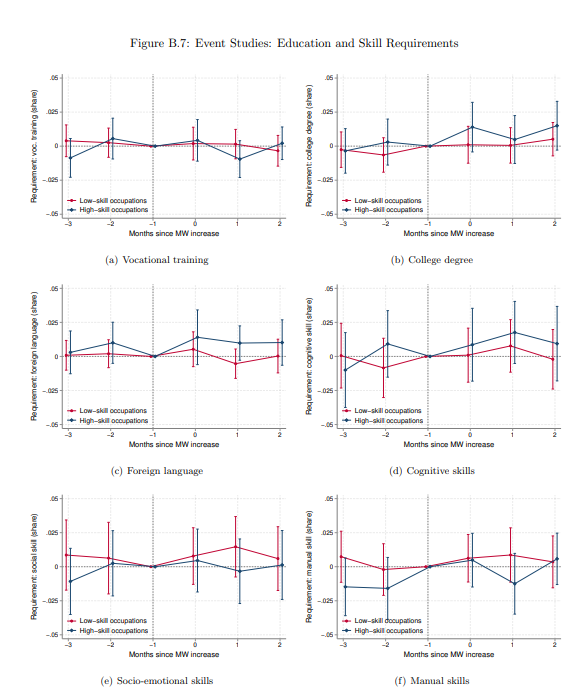
Notes: These figures plot the estimated βτ coefficients of equation (10) with their corresponding 95% confidence intervals using different dependent variables. Coefficients are interacted with indicators for lower- and higher-skill occupational groups. Panel (a) uses the share of vacancies that require vocational training as a dependent variable. Panel (b) uses the share of vacancies that require a college degree as a dependent variable. Panel (c) uses the share of vacancies that require knowing a foreign language as a dependent variable. Panel (d) uses the share of vacancies that require cognitive skills as a dependent variable. Panel (e) uses the share of vacancies that require socio-emotional skills as a dependent variable. Panel (f) uses the share of vacancies that require manual skills as a dependent variable. Regressions control for cell-by-event fixed effects, calendar month-by-1 digit-industry fixed effects, and minimum wage changes not occurring in January or July (see Panel (c) of Figure 7). Standard errors are clustered at the 2-digit industry level.
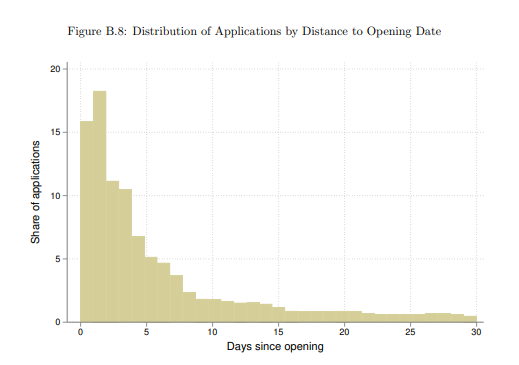
Notes: This figure plots the distribution of the timing of applications to vacancies relative to the opening date. “Distance” refers to the days elapsed since the opening of the vacancy.
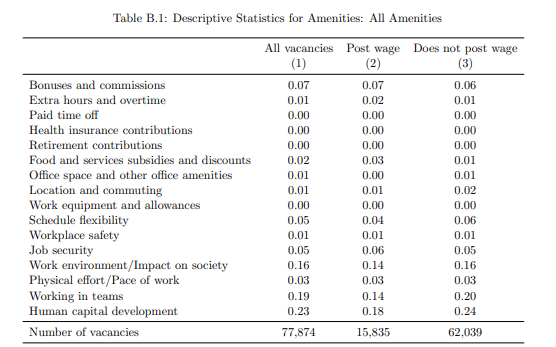
Notes: This table shows summary statistics for the amenities advertised in our final sample of vacancies (see Section 2 for details on the sample restrictions). Advertised amenities were elicited following Adamczyk et al. (Forthcoming). The table details whereas vacancies advertise each individual amenity. This table considers the full list of amenities discussed in Appendix A. Statistics are also shown separately between vacancies that post a wage and vacancies that do not post a wage.
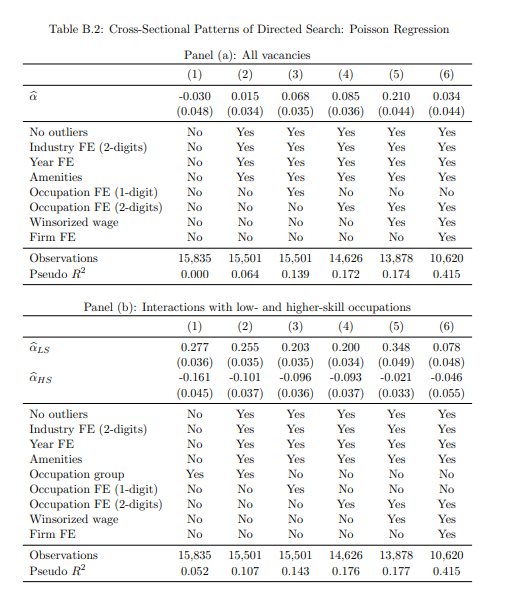
Notes: Panel (a) presents the coefficient of equation (2) estimated using a Poisson model. If β denotes the point estimate, the elasticity is recovered as exp(β) -1. The standard error is estimated using the Delta method. Panel (b) presents the estimated (αLS, αHS) coefficients of equation (3). The dependent variable is the log number of applications, and the key regressor is the log posted wage, so coefficients are interpreted as cross-sectional elasticities. Column (1) shows results with no controls in Panel (a) and includes a control for the occupational group in Panel (b). Column (2) excludes vacancies receiving more than 1,000 applications and includes 2-digit industry fixed effects, year fixed effects, and controls for advertised amenities (indicators for bonuses and commissions, schedule flexibility, work environment/impact on society, working in teams, and human capital development). Columns (3) and (4) add 1-digit and 2-digit occupation fixed effects, respectively. Column (5) excludes the vacancies at the top 5% of the posted wage distribution. Column (6) only considers vacancies that are posted by firms that post at least 10 vacancies in the BJ platform and includes firm fixed effects. Standard errors (reported in parentheses) are clustered at the 2-digit industry level.
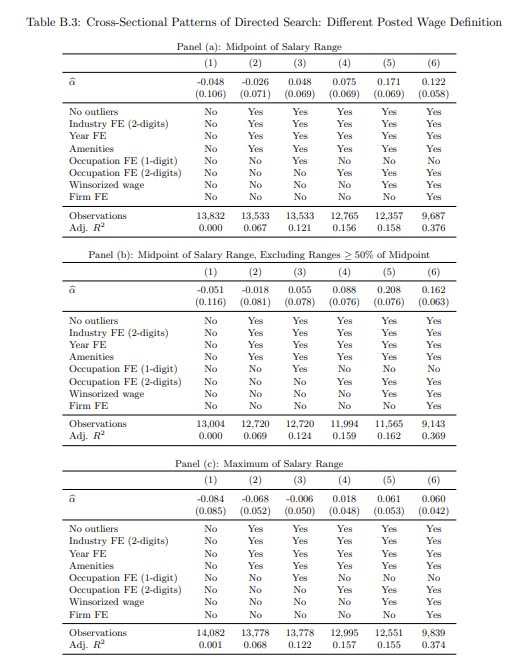
This table presents the estimated α coefficient of equation (2) using different definitions of posted wage. The dependent variable is the log number of applications, and the key regressor is the log posted wage, so coefficients are interpreted as cross-sectional elasticities. Panel (a) considers the midpoint of the salary range. Panel (b) considers the midpoint of the salary range, excluding vacancies whose range exceeds the 50% of the midpoint. Panel (c) considers the maximum of the salary range. Column (1) shows results with no controls. Column (2) excludes vacancies receiving more than 1,000 applications and includes 2-digit industry fixed effects, year fixed effects, and controls for advertised amenities (indicators for bonuses and commissions, schedule flexibility, work environment/impact on society, working in teams, and human capital development). Columns (3) and (4) add 1-digit and 2-digit occupation fixed effects, respectively. Column (5) excludes the vacancies at the top 5% of the posted wage distribution. Column (6) only considers vacancies that are posted by firms that post at least 10 vacancies in the BJ platform and includes firm fixed effects. Standard errors (reported in parentheses) are clustered at the 2-digit industry level.
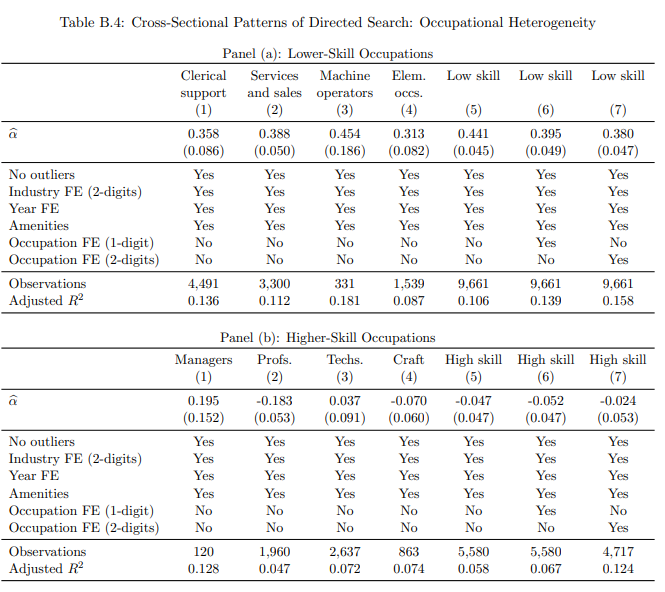
Panel (a) presents the estimated α coefficient of equation (2) for lower-skill occupations. Panel (b) presents the estimated coefficient of equation (2) for higher-skill occupations. The dependent variable is the log number of applications, and the key regressor is the log posted wage, so coefficients are interpreted as cross-sectional elasticities. Within each panel, Columns (1)-(4) show results for individual occupations in regressions that exclude vacancies receiving more than 1,000 applications and include 2-digit industry fixed effects, year fixed effects, and controls for advertised amenities (indicators for bonuses and commissions, schedule flexibility, work environment/impact on society, working in teams, and human capital development). Within each panel, Columns (5)-(7) show results for the broad occupation groups. Column (5) does not include occupation fixed effects, while Columns (6) and (7) include 1-digit and 2-digit occupation fixed effects, respectively. Standard errors (reported in parentheses) are clustered at the 2-digit industry level.
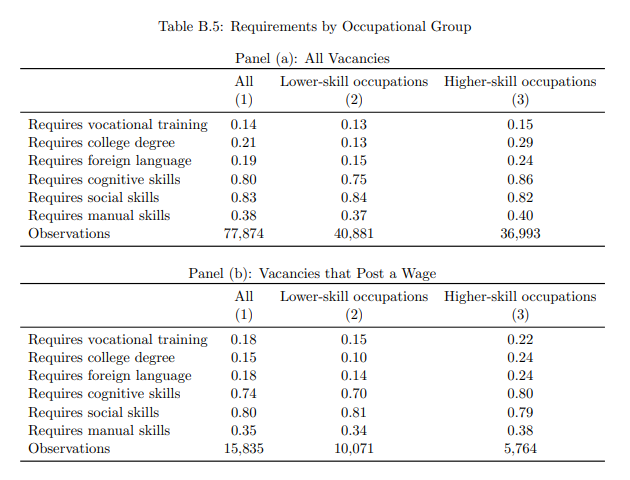
Notes: This table shows summary statistics for the presence of requirements (in terms of formal qualifications, foreign language, or skills) in our final sample of vacancies (see Section 1 for details on the sample restrictions). Panel (a) considers all vacancies. Panel (b) restricts to vacancies that post a wage. Within each panel, statistics are shown for all vacancies, vacancies attached to lower-skill occupations, and vacancies attached to higher-skill occupations.
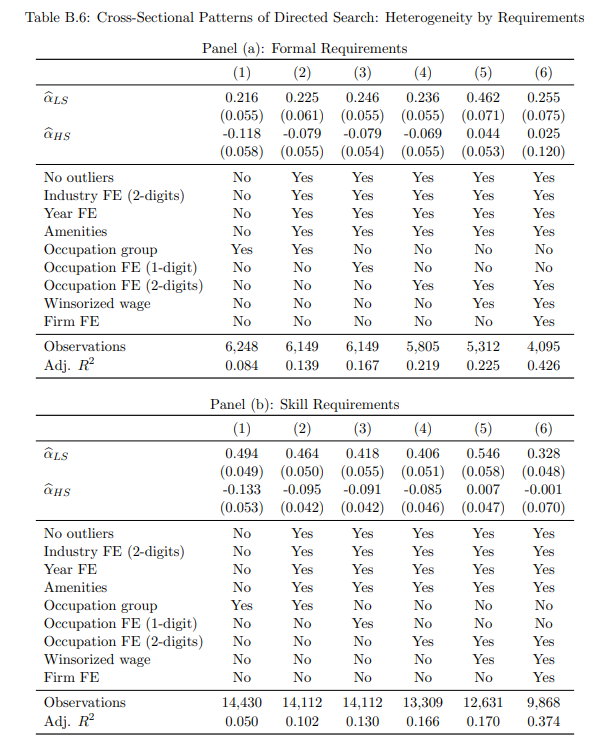
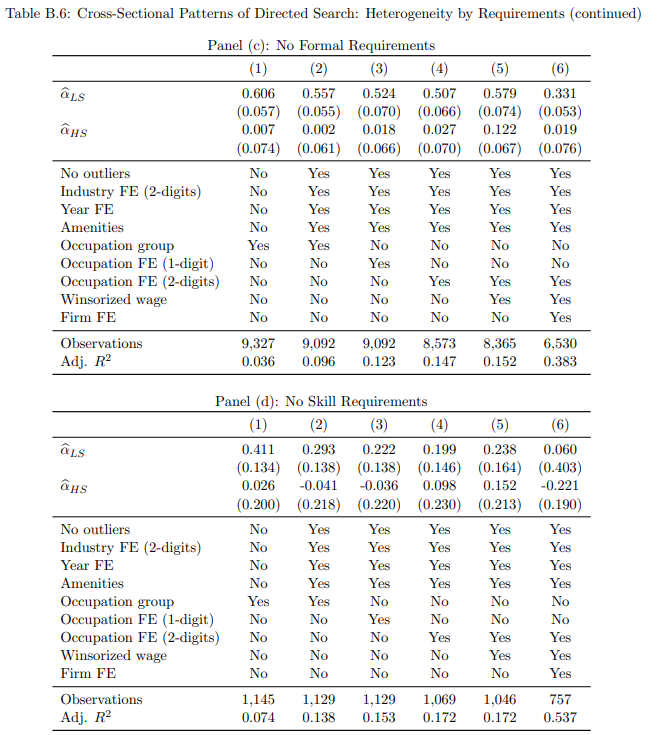
Notes: This table presents the estimated (αLS, αHS) coefficients of equation (3). The dependent variable is the log number of applications, and the key regressor is the log posted wage, so coefficients are interpreted as cross-sectional elasticities. Panel (a) considers vacancies that post at least one formal qualification requirement (education and/or language). Panel (b) considers vacancies that post at least one skill requirement (cognitive, socio-emotional, and/or manual). Panels (c) and (d) present results without these requirements, respectively. Column (1) includes a control for the occupational group. Column (2) excludes vacancies receiving more than 1,000 applications and includes 2-digit industry fixed effects, year fixed effects, and controls for advertised amenities (indicators for bonuses and commissions, schedule flexibility, work environment/impact on society, working in teams, and human capital development). Columns (3) and (4) add 1-digit and 2-digit occupation fixed effects, respectively. Column (5) excludes the vacancies at the top 5% of the posted wage distribution. Column (6) only considers vacancies that are posted by firms that post at least 10 vacancies in the BJ platform and includes firm fixed effects. Standard errors (reported in parentheses) are clustered at the 2-digit industry level.
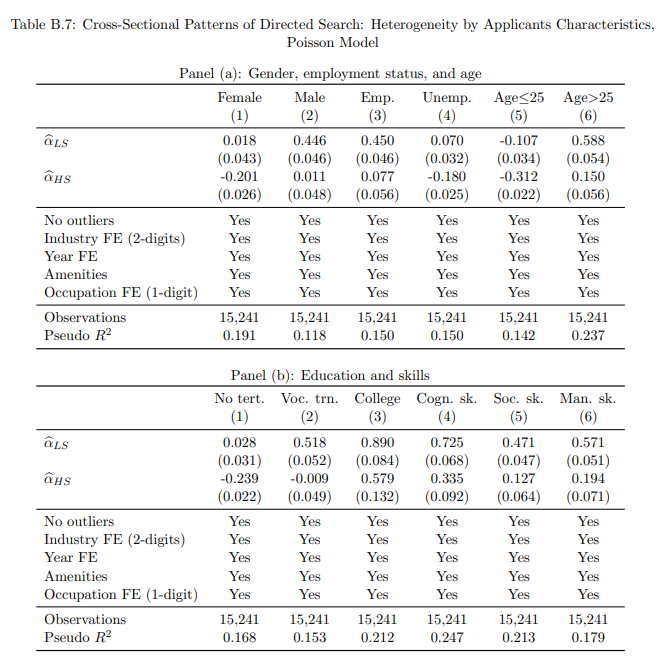
Notes: This table presents the (αLS, αHS) coefficients of equation (3) estimated using a Poisson model. If β denotes the point estimate, the elasticity is recovered as exp(β) -1. The standard error is estimated using the Delta method. The dependent variable is the log number of applications made by applicants with the characteristic depicted in the column title, and the key regressor is the log posted wage, so coefficients are interpreted as cross-sectional elasticities. Panel (a) presents results by gender, employment status, and age. Panel (b) presents results by educational attainment (without tertiary education, vocational training, and college degree) and three categories of skills (cognitive, socio-emotional, and manual skills). Regressions exclude vacancies receiving more than 1,000 applications and include 2-digit industry fixed effects, year fixed effects, controls for advertised amenities (indicators for bonuses and commissions, schedule flexibility, work environment/impact on society, working in teams, and human capital development), and 1-digit occupation fixed effects. Standard errors (reported in parentheses) are clustered at the 2-digit industry level.
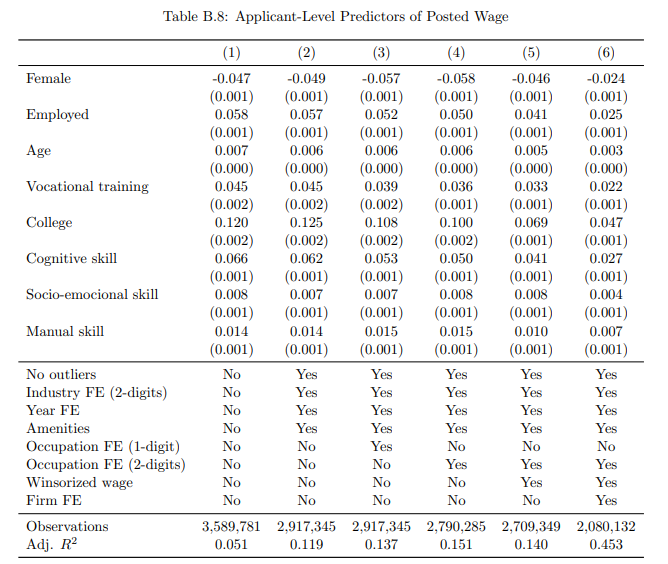
Notes: This table presents the estimated (αF, αE, αA, αV, αC, αCS, αSK, αMS) coefficients of equation (4). The dependent variable is the log posted wage of the application, and the key regressors are individual characteristics of the applicant. Column (1) shows results with no controls. Column (2) excludes vacancies receiving more than 1,000 applications and includes 2-digit industry fixed effects, year fixed effects, and controls for advertised amenities (indicators for bonuses and commissions, schedule flexibility, work environment/impact on society, working in teams, and human capital development). Columns (3) and (4) add 1-digit and 2-digit occupation fixed effects, respectively. Column (5) excludes the vacancies at the top 5% of the posted wage distribution. Column (6) only considers vacancies that are posted by firms that post at least 10 vacancies in the BJ platform and includes firm fixed effects. Standard errors (reported in parentheses) are clustered at the 2-digit industry level.
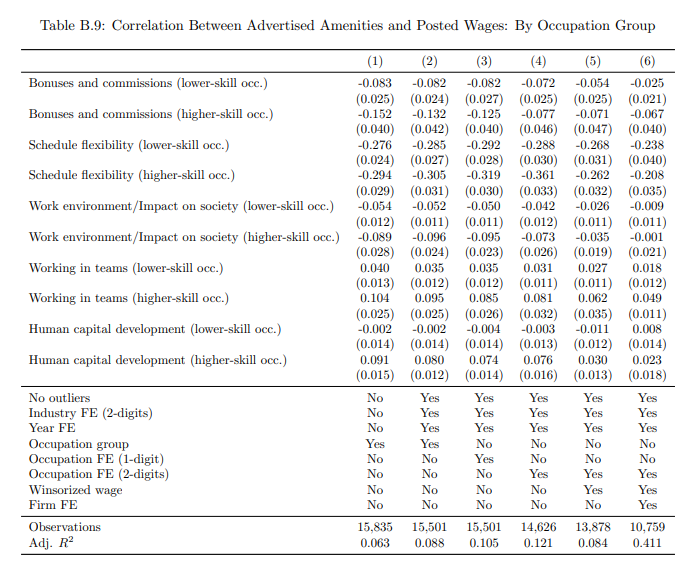
Notes: This table presents the estimated (, ) coefficients of equation (6). The dependent variable is the log posted wage, and the key regressors are indicators for advertised amenities, so coefficients are interpreted as cross-sectional semi-elasticities. Column (1) includes a control for the occupational group. Column (2) excludes vacancies receiving more than 1,000 applications and includes 2-digit industry fixed effects, year fixed effects, and controls for advertised amenities (indicators for bonuses and commissions, schedule flexibility, work environment/impact on society, working in teams, and human capital development). Columns (3) and (4) add 1-digit and 2-digit occupation fixed effects, respectively, in exchange for the occupational group indicator. Column (5) excludes the vacancies at the top 5% of the posted wage distribution. Column (6) only considers vacancies that are posted by firms that post at least 10 vacancies in the BJ platform and includes firm fixed effects. Standard errors (reported in parentheses) are clustered at the 2-digit industry level.
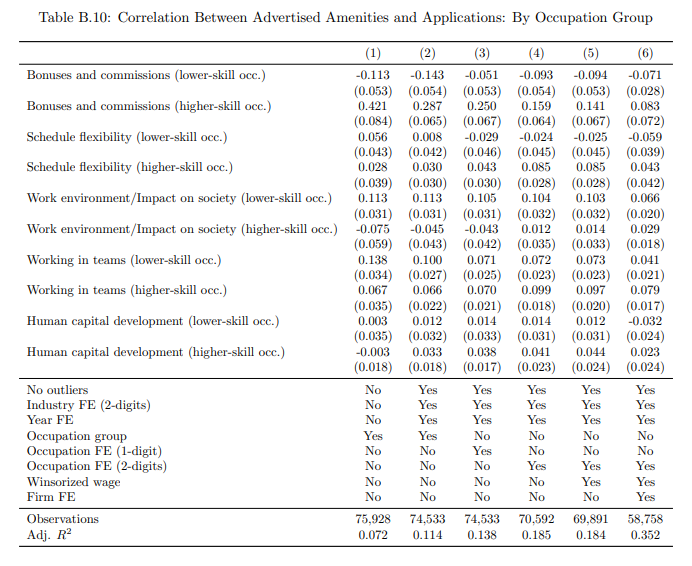
Notes: This table presents the estimated (, ) coefficients of equation (8). The dependent variable is the log number of applications, and the key regressors are indicators for advertised amenities, so coefficients are interpreted as cross-sectional semi-elasticities. Column (1) includes a control for the occupational group. Column (2) excludes vacancies receiving more than 1,000 applications and includes 2-digit industry fixed effects, year fixed effects, and controls for advertised amenities (indicators for bonuses and commissions, schedule flexibility, work environment/impact on society, working in teams, and human capital development). Columns (3) and (4) add 1-digit and 2-digit occupation fixed effects, respectively, in exchange for the occupational group indicator. Column (5) excludes the vacancies at the top 5% of the posted wage distribution. Column (6) only considers vacancies that are posted by firms that post at least 10 vacancies in the BJ platform and includes firm fixed effects. Standard errors (reported in parentheses) are clustered at the 2-digit industry level.
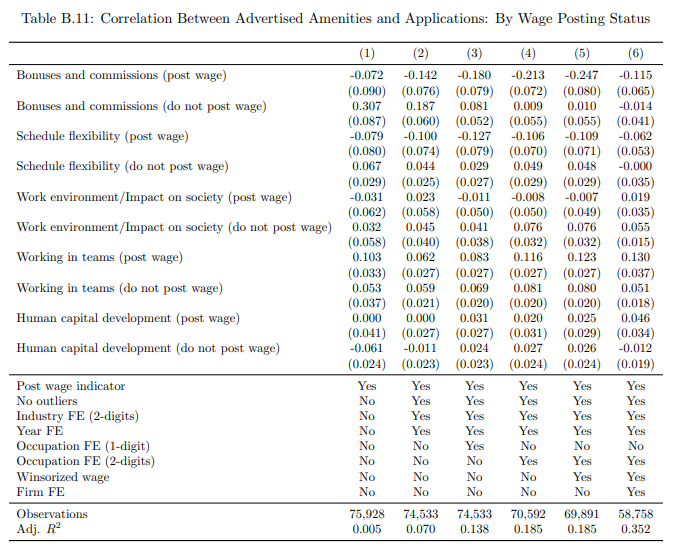
Notes: This table presents the estimated (, ) coefficients of equation (9). The dependent variable is the log number of applications, and the key regressors are indicators for advertised amenities, so coefficients are interpreted as cross-sectional semi-elasticities. Column (1) includes a control for whether the vacancy posts a wage. Column (2) excludes vacancies receiving more than 1,000 applications and includes 2-digit industry fixed effects, year fixed effects, and controls for advertised amenities (indicators for bonuses and commissions, schedule flexibility, work environment/impact on society, working in teams, and human capital development). Columns (3) and (4) add 1-digit and 2-digit occupation fixed effects, respectively. Column (5) excludes the vacancies at the top 5% of the posted wage distribution. Column (6) only considers vacancies that are posted by firms that post at least 10 vacancies in the BJ platform and includes firm fixed effects. Standard errors (reported in parentheses) are clustered at the 2-digit industry level.
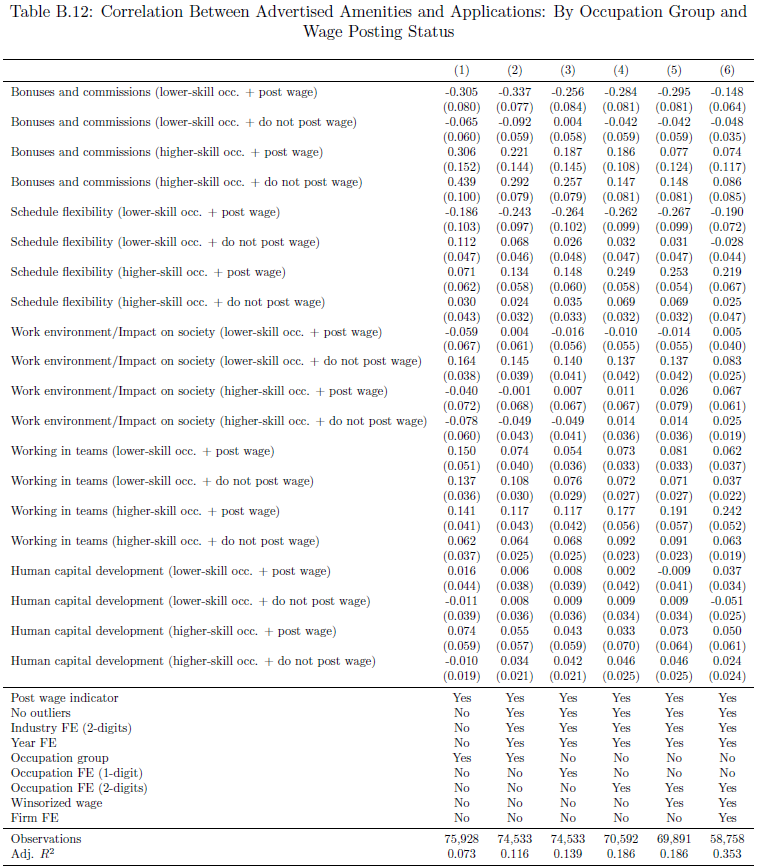
Notes: This table presents the estimated coefficients of the saturated version of equations (8) and (9) that includes cross-interactions between occupational group and wage-posting status. The dependent variable is the log number of applications, and the key regressors are indicators for advertised amenities, so coefficients are interpreted as cross-sectional semi-elasticities. Column (1) includes a control for whether the vacancy posts a wage and a control for the occupational group. Column (2) excludes vacancies receiving more than 1,000 applications and includes 2-digit industry fixed effects, year fixed effects, and controls for advertised amenities (indicators for bonuses and commissions, schedule flexibility, work environment/impact on society, working in teams, and human capital development). Columns (3) and (4) add 1-digit and 2-digit occupation fixed effects, respectively, in exchange for the occupational group indicator. Column (5) excludes the vacancies at the top 5% of the posted wage distribution. Column (6) only considers vacancies that are posted by firms that post at least 10 vacancies in the BJ platform and includes firm fixed effects. Standard errors (reported in parentheses) are clustered at the 2-digit industry level.
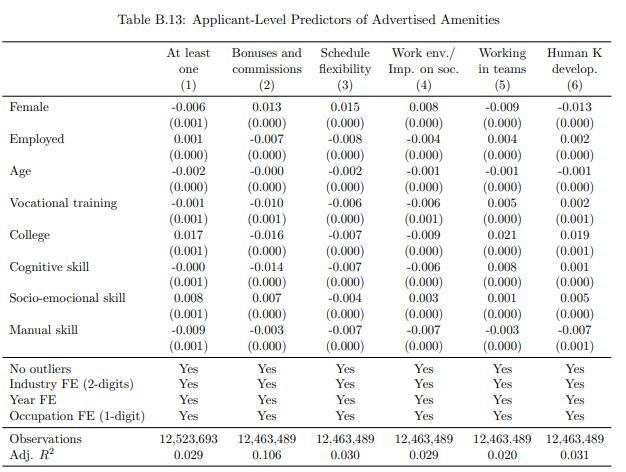
Notes: This table presents the estimated (αF, αE, αA, αV, αC, αCS, αSK, αMS) coefficients of version of equation (4) that use amenity indicators as dependent variables. Each column considers a different dependent variable, and the key regressors are individual characteristics of the applicant. Regressions exclude vacancies receiving more than 1,000 applications and include 2-digit industry fixed effects, year fixed effects, and 1-digit occupation fixed effects. Standard errors (reported in parentheses) are clustered at the 2-digit industry level.
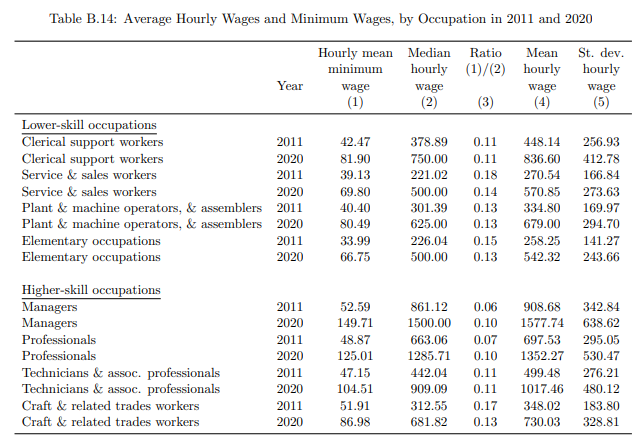
Notes: This table shows average hourly wages and minimum wages by 1-digit occupation built from survey data for years 2011 and 2020. The aggregated minimum wage numbers in Column (1) are based on mean minimum wages within 2-digit industries, which were weighted depending on their share within the 1-digit occupations. Numbers in Column (1) were also converted from full-time equivalents to the hourly level by dividing monthly minimum wage levels by 200 monthly hours. Hourly wage data in Columns (2), (4), and (5) are computed using Uruguay’s nationally representative household survey, the Encuesta Continua Hogares restricted to employees and excluding the top 1 percent of wages. To compare the economic significance of the minimum wages across broad occupations, in Column (3), hourly mean minimum wages are expressed as a share of median hourly wages. The wage and minimum wage data are shown in 2020 Uruguayan pesos.
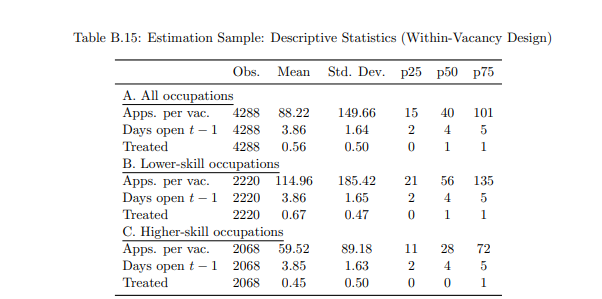
Notes: This table presents descriptive statistics of the estimation sample used in the within-vacancy design (see equation (12)). The unit of observation is a vacancy by calendar month. Panel (a) shows summary statistics for all occupations combined. Panel (b) shows summary statistics for the lower-skilled occupational group. Panel (c) shows summary statistics for the higher-skilled occupational group. “Days open in t -1” refers to the days the vacancy is active in the BJ before the minimum wage change takes place. The sample includes vacancies that were posted between June 25 and 30 as well as December 26 and 31 during the years 2011 through 2020. We exclude vacancies receiving more than 1,000 applications.
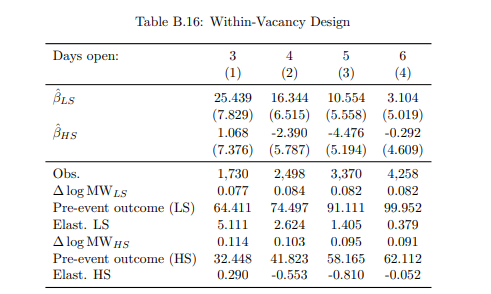
Notes: This table presents the estimated (βLS, βHS) coefficients of equation (12). Regressions include vacancy and calendar month fixed effects. The dependent variable is the number of applications (in levels). Each column considers a different sample of vacancies that vary on the days they were open before the minimum wage took place, ranging from 3 (Column (1)) to 6 (Column (4)). Reported elasticities are computed by dividing the β-coefficient by the pre-event average outcome within treated cells, normalized by the log change in minimum wage among treated cells. Standard errors (reported in parentheses) are clustered at the 2-digit industry level.
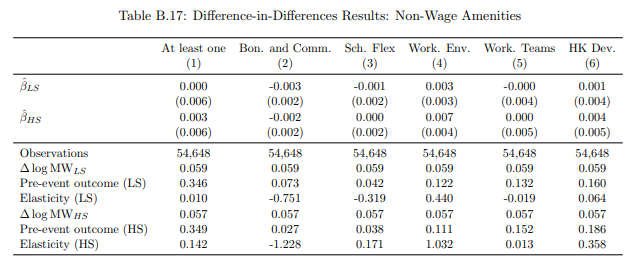
Notes: This table presents the estimated β coefficient of equation (11) in a model that considers interactions with indicators for lower and higher-skill occupational groups. Regressions include cell-by-event fixed effects, calendar month-by-1 digit-industry fixed effects, and minimum wage changes not occurring in January or July (see Panel (c) of Figure 7). The dependent variables, as depicted in the column titles, include (in levels) the share of vacancies advertising at least one amenity, the share of vacancies advertising bonuses and commissions, the share of vacancies advertising schedule flexibility, the share of vacancies advertising work environment/impact on society, the share of vacancies advertising working in teams, and the share of vacancies advertising human capital development. Reported elasticities are computed by dividing the β-coefficient by the pre-event average outcome within treated cells, normalized by the log change in minimum wage among treated cells. Standard errors (reported in parentheses) are clustered at the 2-digit industry level.
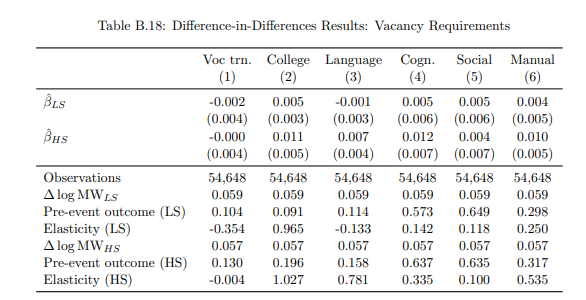
Notes: This table presents the estimated β coefficient of equation (11) in a model that considers interactions with indicators for lower and higher-skill occupational groups. Regressions include cell-by-event fixed effects, calendar month-by-1 digit-industry fixed effects, and minimum wage changes not occurring in January or July (see Panel (c) of Figure 7). The dependent variables, as depicted in the column titles, include (in levels) the share of vacancies requiring vocational training, the share of vacancies requiring a college degree, the share of vacancies requiring foreign language knowledge, the share of vacancies requiring cognitive skills, the share of vacancies requiring socio-emotional skills, and the share of vacancies requiring manual skills. Reported elasticities are computed by dividing the β-coefficient by the pre-event average outcome within treated cells, normalized by the log change in minimum wage among treated cells. Standard errors (reported in parentheses) are clustered at the 2-digit industry level.
Appendix Bibliography
Acemoglu, Daron and J. S. Pischke, “The structure of wages and investment in general training,” Journal of Political Economy, 1999, 107 (3), 539–572.
Adamczyk, Willian, Isaure Delaporte, and Ver´onica Escudero, “Job Amenities in Developing Countries: an analysis of online labour markets,” ILO Working Paper, Forthcoming.
Almlund, Mathilde, Angela Lee Duckworth, James Heckman, and Tim Kautz, “Chapter 1 - Personality Psychology and Economics,” in Eric A. Hanushek, Stephen Machin, and Ludger Woessmann, eds., Handbook of the Economics of Education, Vol. 4, Elsevier, 2011, pp. 1–181.
Atalay, Enghin, Phai Phongthiengtham, Sebastian Sotelo, and Daniel Tannenbaum, “The Evolution of Work in the United States,” American Economic Journal: Applied Economics, 2020, 12 (2), 1–34.
Athey, Susan, Christopher Avery, and Peter Zemsky, “Mentoring and Diversity,” American Economic Review, 2000, 90 (4), 765–786.
Autor, David, Frank Levy, and Richard Murnane, “The skill content of recent technological change: An empirical exploration,” The Quarterly Journal of Economics, 2003, 118 (4), 1279–1333.
Barbanchon, Thomas Le, Roland Rathelot, and Alexandra Roulet, “Gender Differences in Job Search: Trading off Commute against Wage,” The Quarterly Journal of Economics, 2020, 136 (1), 381–426.
Barron, John M., Mark C. Berger, and Dan A. Black, “Do Workers Pay for On-The-Job Training?,” The Journal of Human Resources, 1999, 34 (2), 235.
Beckers, Debby G.J., Dimitri Van Der Linden, Peter G.W. Smulders, Michiel A.J. Kompier, Toon W. Taris, and Sabine A.E. Geurts, “Voluntary or involuntary? Control over overtime and rewards for overtime in relation to fatigue and work satisfaction,” Work & Stress, 2008, 22 (1), 33–50.
Breza, Emily, Supreet Kaur, and Yogita Shamdasani, “The morale effects of pay inequality,” The Quarterly Journal of Economics, 2017, 133 (2), 611–663.
Deming, David and Kadeem Noray, “Earnings Dynamics, Changing Job Skills, and STEM Careers,” Quarterly Journal of Economics, 2020, 135 (8), 1965–2005.
and Lisa B. Kahn, “Skill requirements across firms and labor markets: Evidence from job postings for professionals,” Journal of Labor Economics, 2018, 36 (S1), S337–S369.
Escudero, Verónica, Hannah Liepmann, and Ana Podjanin, “Using Online Vacancy and Job Applicants’ Data to Study Skills Dynamics,” Research in Labor Economics, Forthcoming.
Filer, Randall K. and Peter A. Petri, “A Job-Characteristics Theory of Retirement,” The Review of Economics and Statistics, 1988, 70 (1), 123.
Glassdoor, “4 in 5 Employees Want Benefits or Perks More Than a Pay Raise; Glassdoor Employment Confidence Survey (Q3 2015) - Glassdoor US,” 2015.
Hamermesh, Daniel S., “Shirking or Productive Schmoozing: Wages and the Allocation of Time at Work,” Industrial and Labor Relations Review, 1990, 43 (3), 121S.
Hayward, Mark D., William R. Grady, Melissa A. Hardy, and David Sommers, “Occupational influences on retirement, disability, and death,” Demography, 1989, 26 (3), 393–409.
Heckman, James and Tim Kautz, “Hard evidence on soft skills,” Labour Economics, 2012, 19 (4), 451–464.
Hershbein, Bratt and Lisa B. Kahn, “Do recessions accelerate routine-biased technological change? Evidence from vacancy postings,” American Economic Review, 2018, 108 (7), 1737–72.
Holmlund, Bertil, “Payroll Taxes and Wage Inflation: The Swedish Experience,” The Scandinavian Journal of Economics, 1983, 85 (1), 1.
Kureková, Lucia Mýtna, Miroslav Beblavý, Corina Haita, and Anna-Elisabeth Thum, “Employers’ skill preferences across Europe: between cognitive and non-cognitive skills,” Journal of Education and Work, 2016, 29 (6), 662–687.
Libert, Kelsey, “Employee Benefits Study: The Cost and Value of Employee Perks,” 2016.
Lopes, Helena, Sérgio Lagoa, and Teresa Calapez, “Work autonomy, work pressure, and job satisfaction: An analysis of European Union countries,” The Economic and Labour Relations Review, 2014, 25 (2), 306–326.
Maestas, Nicole, Kathleen J Mullen, David Powell, Till Von Wachter, and Jeffrey B Wenger, “The value of working conditions in the United States and the implications for the structure of wages,” American Economic Review, 2023, 113 (7), 2007–2047.
Mas, Alexandre and Amanda Pallais, “Valuing alternative work arrangements,” American Economic Review, 2017, 107 (12), 3722–59.
Neumark, David and Joanne Song McLaughlin, “Barriers to Later Retirement: Increases in the Full Retirement Age, Age Discrimination, and the Physical Challenges of Work,” Working Paper, 2012.
Parent, Daniel, “Wages and Mobility: The Impact of Employer-Provided Training,” Journal of Labor Economics, 1999, 17 (2), 298–317.
Park, R. Jisung, Nora Pankratz, and A. Patrick Behrer, “Temperature, Workplace Safety, and Labor Market Inequality,” IZA Working Paper, 2021, (14560).
Quinn, Robert P., Job Satisfaction: Is There a Trend?, University of Michigan Library, 1974.
Simon, Kosali Ilayperuma and Robert Kaestner, “Do Minimum Wages Affect Non-Wage Job Attributes? Evidence on Fringe Benefits,” ILR Review, 2004, 58 (1), 52–70.
Sockin, Jason, “Show Me the Amenity: Are Higher-Paying Firms Better All Around?,” Working Paper, 2024.
and Michael Sockin, “A pay scale of their own: Gender differences in variable pay,” Working Paper, 2019, (3512598).
Spitz-Oener, Alexandra, “Technical Change, Job Tasks, and Rising Educational Demands: Looking outside the Wage Structure,” Journal of Labor Economics, 2006, 24 (2), 235–270.
Wasmer, Etienne and Yves Zenou, “Does City Structure Affect Job Search and Welfare?,” Journal of Urban Economics, 2002, 51 (3), 515–541.
References
Adamczyk, Willian, Isaure Delaporte, and Verónica Escudero, “Job Amenities in Developing Countries: an analysis of online labour markets,” ILO Working Paper, Forthcoming.
Alfonsi, Livia, Oriana Bandiera, Vittorio Bassi, Robin Burgess, Imran Rasul, Munshi Sulaiman, and Anna Vitali, “Tackling Youth Unemployment: Evidence From a Labor Market Experiment in Uganda,” Econometrica, 2020, 88 (6), 2369–2414.
Allegretto, Sylvia and Michael Reich, “Are local minimum wages absorbed by price increases? Estimates from internet-based restaurant menus,” ILR Review, 2018, 71 (1), 35–63.
Altmann, S., R. Mahlstedt, M. J. Rattenborg, and A. Sebald, “Which Occupations do Unemployed Workers Target? Insights from Online Job Search Profiles,” Working Paper, 2024.
Arnold, David, Simon Quach, and Bledi Taska, “The impact of pay transparency in job postings on the labor market,” Working Paper, 2023.
Ashenfelter, Orley and Štěpán Jurajda ˇ , “Minimum wages, wages, and price pass-through: The case of McDonald’s Restaurants,” Journal of Labor Economics, 2022, 40 (S1), S179—-S201.
Atalay, Enghin, Phai Phongthiengtham, Sebastian Sotelo, and Daniel Tannenbaum, “The Evolution of Work in the United States,” American Economic Journal: Applied Economics, 2020, 12 (2), 1–34.
Attanasio, Orazio, Adriana Kugler, and Costas Meghir, “Subsidizing Vocational Training for Disadvantaged Youth in Colombia: Evidence from a Randomized Trial,” American Economic Journal: Applied Economics, 2011, 3 (3), 188–220.
Azar, José, Steven Berry, and Ioana Elena Marinescu, “Estimating labor market power,” Working Paper, 2022.
Baker, Andrew, David F Larcker, and Charles CY Wang, “How Much Should We Trust Staggered Difference-In-Differences Estimates?,” Journal of Financial Economics, 2022.
Banfi, Stefano and Benjamin Villena-Roldan, “Do high-wage jobs attract more applicants? Directed search evidence from the online labor market,” Journal of Labor Economics, 2019, 37 (3), 715–746.
Barbanchon, Thomas Le, Roland Rathelot, and Alexandra Roulet, “Gender differences in job search: Trading off commute against wage,” The Quarterly Journal of Economics, 2021, 136 (1), 381–426.
Bassier, Ihsaan, Alan Manning, and Barbara Petrongolo, “Vacancy duration and wages,” Working Paper, 2023.
Batra, Honey, Amanda Michaud, and Simon Mongey, “Online Job Posts Contain Very Little Wage Information,” Working paper, 2023.
Belot, Michèle, Philipp Kircher, and Paul Muller, “Providing Advice to Jobseekers at Low Cost: An Experimental Study on Online Advice,” The Review of Economic Studies, 2019, 86, 1411–1447.
_ , _ , and _ , “How Wage Announcements Affect Job Search - A Field Experiment,” American Economic Journal: Macroeconomics, 2022, 14 (4), 1–67.
Bó, Ernesto Dal, Frederico Finan, and Martín A Rossi, “Strengthening state capabilities: The role of financial incentives in the call to public service,” The Quarterly Journal of Economics, 2013, 128 (3), 1169–1218.
Bonhomme, Stephane and Gregory Jolivet, “The pervasive absence of compensating differentials,” Journal of Applied Econometrics, 2009, 24 (5), 763–795.
Burdett, Kenneth and Dale T Mortensen, “Wage differentials, employer size, and unemployment,” International Economic Review, 1998, pp. 257–273.
Butschek, Sebastian, “Raising the bar: Minimum wages and employers’ hiring standards,” American Economic Journal: Economic Policy, 2021.
Caldwell, S., I. Haegele, and J. Heining, “Bargaining and inequality in the labor market,” Working Paper, 2024.
Caldwell, Sydnee and Nikolaj Harmon, “Outside options, bargaining, and wages: Evidence from coworker networks,” Working Paper, 2019.
Card, David, “Who set your wage?,” American Economic Review, 2022, 112 (4), 1075–1090.
_ , Jesse Rothstein, and Moises Yi, “Industry wage differentials: A firm-based approach,” Journal of Labor Economics, 2024, 42 (S1), 11–59.
Cengiz, Doruk, Arindrajit Dube, Attila Lindner, and Ben Zipperer, “The effect of minimum wages on low-wage jobs,” The Quarterly Journal of Economics, 2019, 134 (3), 1405–1454.
_ , _ , _ , and David Zentler-Munro, “Seeing Beyond the Trees: Using Machine Learning to Estimate the Impact of Minimum Wages on Labor Market Outcomes,” Journal of Labor Economics, 2021.
Clemens, Jeffrey, “How do firms respond to minimum wage increases? Understanding the relevance of non-employment margins,” Journal of Economic Perspectives, 2021, 35 (1), 51–72.
_ , Lisa B Kahn, and Jonathan Meer, “Dropouts need not apply? The minimum wage and skill upgrading,” Journal of Labor Economics, 2021, 39 (S1), S107–S149.
Coviello, Decio, Erika Deserranno, and Nicola Persico, “Minimum wage and individual worker productivity: Evidence from a large US retailer,” Journal of Political Economy, 2022, 130 (9), 2227– 2500
Cullen, Zoë, “Is pay transparency good?,” Journal of Economic Perspectives, 2024, 38 (1), 153–180.
Cullen, Zoe B, Shengwu Li, and Ricardo Perez-Truglia, “What’s my employee worth? The effects of salary benchmarking,” Working Paper, 2024.
Deming, David and Lisa B. Kahn, “Skill requirements across firms and labor markets: Evidence from job postings for professionals,” Journal of Labor Economics, 2018, 36 (S1), S337–S369.
Draca, Mirko, Stephen Machin, and John Van Reenen, “Minimum wages and firm profitability,” American Economic Journal: Applied Economics, 2011, 3 (1), 129–51.
Drucker, Lev, Katya Mazirov, and David Neumark, “Who pays for and who benefits from minimum wage increases? Evidence from Israeli tax data on business owners and workers,” Journal of Public Economics, 2021, 198.
Dube, Arindrajit, Daniele Girardi, Oscar Jorda, and Alan Taylor, “A local projections approach to difference-in-differences event studies,” Working Paper, 2023.
_ , Suresh Naidu, and Adam D Reich, “Power and dignity in the low-wage labor market: Theory and evidence from wal-mart workers,” Working Paper, 2022.
_ , William Lester, and Michael Reich, “Minimum wage shocks, employment flows, and labor market frictions,” Journal of Labor Economics, 2016, 34 (3), 663–704.
Dustmann, Christian, Attila Lindner, Uta Schönberg, Matthias Umkehrer, and Philipp Vom Berge, “Reallocation effects of the minimum wage: Evidence from Germany,” Quarterly Journal of Economics, 2022, 137 (1), 267—-328.
Emanuel, Natalia and Emma Harrington, “Firm frictions and the payoffs of higher pay: Labor supply and productivity responses to a voluntary firm minimum wage,” Working Paper, 2022.
Escudero, Verónica, Hannah Liepmann, and Ana Podjanin, “Using Online Vacancy and Job Applicants’ Data to Study Skills Dynamics,” Research in Labor Economics, Forthcoming.
Fluchtmann, J., A. M. Glenny, N. Harmon, and J. Maibom, “Unemployed Job Search Across People and Over Time: Evidence from Applied-For Jobs,” Journal of Labor Economics, Forthcoming.
Fluchtmann, Jonas, Anita Glenny, Nikolaj Harmon, and Jonas Maibon, “The Gender Application Gap: Do men and women apply for the same jobs?,” American Economic Journal: Economic Policy, forthcoming, 2024.
Gardner, John, “Two-stage differences in differences,” Working Paper, 2021.
Gittings, Kaj and Ian Schmutte, “Getting handcuffs on an octopus: Minimum wages, employment, and turnover,” ILR Review, 2016, 69 (5), 1133–1170.
Goldin, Claudia, “A grand gender convergence: Its last chapter,” American economic review, 2014, 104 (4), 1091–1119.
Hall, Robert E and Alan B Krueger, “Evidence on the incidence of wage posting, wage bargaining, and on-the-job search,” American Economic Journal: Macroeconomics, 2012, 4 (4), 56–67.
Harasztosi, Péter and Attila Lindner, “Who Pays for the minimum Wage?,” The American Economic Review, 2019, 109 (8), 2693–2727.
He, Haoran, David Neumark, and Qian Weng, “‘I Still Haven’t Found What I’m Looking For’: Evidence of Directed Search from a Field Experiment,” The Economic Journal, 2023, 133 (649), 258– 280.
Hershbein, Bratt and Lisa B. Kahn, “Do recessions accelerate routine-biased technological change? Evidence from vacancy postings,” American Economic Review, 2018, 108 (7), 1737–72.
Holzer, Harry, Lawrence Katz, and Alan Krueger, “Job Queues and Wages,” Quartely Journal of Economics, 1991, 106 (3), 739–768.
ILO, International Standard Classification of Occupations 2008 (ISCO-08): Structure, group definitions and correspondence tables 2012.
_ , “Las relaciones laborales en Uruguay: 10 a˜nos de cambios,” ILO, 2014.
_ , “ILOSTAT country profiles,” 2022. https://ilostat.ilo.org/data/country-profiles/, accessed May 27 2022.
INE, “Anuario Estadistico 2021,” Instituto Nacional de Estadisticas, 2021.
Jäger, Simon, Christopher Roth, Nina Roussille, and Benjamin Schoefer, “Worker beliefs about outside options,” The Quarterly Journal of Economics, 2024, 139 (3), 1505–1556.
Konings, Jozef and Stijn Vanormelingen, “The Impact of Training on Productivity and Wages: Firm-Level Evidence,” The Review of Economics and Statistics, 2015, 97 (2), 485–497.
Krueger, Alan and Lawrence Summers, “Efficiency wages and the inter-industry wage structure,” Econometrica, 1988, pp. 259–293.
Krueger, Alan B and Andreas I Mueller, “A contribution to the empirics of reservation wages,” American Economic Journal: Economic Policy, 2016, 8 (1), 142–179.
Ku, Hyejin, “Does minimum wage increase labor productivity? Evidence from piece rate workers,” Journal of Labor Economics, 2022, 40 (2), 325—-359.
Kunst, David, Richard B. Freeman, and Remco Oostendorp, “Occupational Skill Premia around the World: New Data, Patterns and Drivers,” Labour Economics, 2022, 79, 102255.
Lachowska, Marta, Alexandre Mas, Raffaele Saggio, and Stephen A Woodbury, “Wage Posting or Wage Bargaining? A Test Using Dual Jobholders,” Journal of Labor Economics, 2022, 40 (1).
Lamadon, Thibaut, Jeremy Lise, Costas Meghir, and Jean-Marc Robin, “Labor market matching, wages, and amenities,” Working Paper, 2024.
_ , Magne Mogstad, and Bradley Setzler, “Imperfect competition, compensating differentials and rent sharing in the US labor market,” American Economic Review, 2022, 112 (1), 169–212.
Leung, Justin H, “Minimum wage and real wage inequality: Evidence from pass-through to retail prices,” Review of Economics and Statistics, 2021, 103 (4), 754–769.
Lindenlaub, Ilse and Fabien Postel-Vinay, “The Worker-Job Surplus,” Working Paper, 2022.
Maestas, Nicole, Kathleen J Mullen, David Powell, Till Von Wachter, and Jeffrey B Wenger, “The value of working conditions in the United States and the implications for the structure of wages,” American Economic Review, 2023, 113 (7), 2007–2047.
Manning, Alan, “The elusive employment effect of the minimum wage,” Journal of Economic Perspectives, 2021, 35 (1), 3–26.
_ , “Monopsony in labor markets: A review,” ILR Review, 2021, 74 (1), 3–26.
_ and Barbara Petrongolo, “How local are labor markets? Evidence from a spatial job search model,” American Economic Review, 2017, 107 (10), 2877–2907.
Marinakis, Andrés, “Non-compliance with minimum wage laws in Latin America: The importance of institutional factors,” International Labour Review, 2016, 155 (1), 133–156.
Marinescu, Ioana and Ronald Wolthoff, “Opening the black box of the matching function: The power of words,” Journal of Labor Economics, 2020, 38 (2), 535–568.
Mas, Alexandre and Amanda Pallais, “Valuing alternative work arrangements,” American Economic Review, 2017, 107 (12), 3722–59.
_ and _ , “Labor supply and the value of non-work time: Experimental estimates from the field,” American Economic Review: Insights, 2019, 1 (1), 111–126.
Mayneris, Florian, Sandra Poncet, and Tao Zhang, “Improving or disappearing: Firm-level adjustments to minimum wages in China,” Journal of Development Economics, 2018, 135, 20–42.
Mazzuchi, Graciela, Las relaciones laborales en el Uruguay: De 2005 a 2008, OIT Ginebra, 2009.
Moen, Espen R, “Competitive search equilibrium,” Journal of Political Economy, 1997, 105 (2), 385– 411.
Montobbio, Fabio, Jacopo Staccioli, Maria Enrica Virgillito, and Marco Vivarelli, “The empirics of technology, employment and occupations: Lessons learned and challenges ahead,” Journal of Economic Surveys, 2023.
Morchio, Iacopo and Christian Moser, “The gender pay gap: Micro sources and macro consequences,” Working Paper, 2023.
Mueller, Andreas, Damian Osterwalder, Josef Zweimüller, and Andreas Kettemann, “Vacancy Durations and Entry Wages: Evidence from Linked Vacancy–Employer–Employee Data,” Review of Economic Studies, 2023.
Piqueras, Jon, “Search Effort and the Minimum Wage,” Working Paper, 2023.
Postel-Vinay, Fabien and Jean-Marc Robin, “The distribution of earnings in an equilibrium search model with state-dependent offers and counteroffers,” International Economic Review, 2002, 43 (4), 989–1016.
_ and _ , “Equilibrium wage dispersion with worker and employer heterogeneity,” Econometrica, 2002, 70 (6), 2295–2350.
Renkin, Tobias, Claire Montialoux, and Michael Siegenthaler, “The pass-through of minimum wages into US retail prices: Evidence from supermarket scanner data,” Review of Economics and Statistics, 2022, 104 (5), 890–908.
Riley, Rebecca and Chiara Rosazza Bondibene, “Raising the standard: Minimum wages and firm productivity,” Labour Economics, 2017, 44, 27–50.
Roussille, Nina and Benjamin Scuderi, “Bidding for Talent: A Test of Conduct in a High-Wage Labor Market,” Working Paper, 2024.
Ruffini, Krista, “Higher wages, service quality, and firm profitability: Evidence from nursing homes and minimum wage reforms,” The Review of Economics and Statistics, Forthcoming.
Skoda, Samuel, “Directing job search in practice: Mandating pay information in job ads,” Working Paper, 2022.
Sockin, Jason, “Show Me the Amenity: Are Higher-Paying Firms Better All Around?,” Working Paper, 2024.
Sokolova, Anna and Todd Sorensen, “Monopsony in labor markets: A meta-analysis,” ILR Review, 2021, 74 (1), 27–55.
Sorkin, Isaac, “Ranking firms using revealed preference,” The Quarterly Journal of Economics, 2018, 133 (3), 1331–1393.
Taber, Christopher and Rune Vejlin, “Estimation of a Roy/search/compensating differential model of the labor market,” Econometrica, 2020, 88 (3), 1031–1069.
UNDP, “Human Development Reports, Uruguay,” 2022. https://hdr.undp.org/en/countries/profiles/URY, accessed May 27 2022.
Vergara, Damian, “Minimum wages and optimal redistribution: The role of firm profits,” Working Paper, 2023.
Wiltshire, Justin, Carl McPherson, and Michael Reich, “Minimum wage effects and monopsony explanations,” Working Paper, 2023.
Wiswall, Matthew and Basit Zafar, “Preference for the workplace, investment in human capital, and gender,” The Quarterly Journal of Economics, 2018, 133 (1), 457–507.
World Bank, “World Bank Country and Lending Groups,” 2022. https://datahelpdesk.worldbank.org/knowledgebase/articles/906519-world-bank-country-and-lendinggroups, accessed May 27 2022.
Acknowledgements
We thank Marcelo Bergolo, Sydnee Caldwell, David Card, Rodrigo Ceni, Zoe Cullen, Jennifer Hunt, Patrick Kline, Elva López Mourelo, and seminar participants at the Columbia Junio Micro-Macro Labor Conference, the 6th IDSC of IZA Workshop (“Matching Workers and Jobs Online”), Princeton University, the 8th RDW Conference (ILO), UC Berkeley, and Universidad de la República de Montevideo for very helpful comments and suggestions. We especially thank Marcelo Bergolo, Paula Carrasco, Rodrigo Ceni, Nicolás Grau, and Cecilia Parada for generously sharing raw data on digitized collective bargaining agreements, and Willian Boschetti Adamczyk for contributing to the analysis of non-wage amenities. The responsibility for opinions expressed in this article rests solely with its authors, and publication does not constitute an endorsement by the International Labour Office of the opinions expressed in it. Other usual disclaimers apply.

