


Generative AI and Jobs
A Refined Global Index of Occupational Exposure
Abstract
This study updates the ILO’s 2023 Global Index of Occupational Exposure to Generative AI (GenAI), incorporating recent advances in the technology and increasing user familiarity with GenAI tools. Using a representative sample from the 29,753 tasks in the Polish occupational classification system and a survey of 1,640 people employed in each 1-digit ISCO-08 groups, we collect 52,558 data points regarding perceive potential of automation for 2,861 tasks. We then compare this input with a survey and several rounds of Delphi-style discussions among a smaller group of international experts. Based on this process, we create a repository of knowledge about task automation that goes beyond national specificities and use it to develop an AI assistant able to predict scores for tasks in the technical documentation of ISCO-08.
Our 2025 scores are presented in a revised framework of four progressively increasing exposure gradients, with a new set of global estimates of employment shares exposed to GenAI. Clerical occupations continue to have the highest exposure levels. Additionally, some strongly digitized occupations have increased exposure, highlighting the expanding abilities of GenAI regarding specialized tasks in professional and technical roles.
Globally, one in four workers are in an occupation with some GenAI exposure. 3.3% of global employment falls into the highest exposure category, albeit with significant differences between female (4.7%) and male employment (2.4%). These differences increase with countries’ income (9.6% female vs 3.5% male in Gradient 4 in HICs), and so does the overall exposure (11% of total employment in LICs vs 34% in HICs). As most occupations consist of tasks that require human input, transformation of jobs is the most likely impact of GenAI. Linking our refined index with national micro data enables precise projections of such transformations, offering a foundation for social dialogue and targeted policy responses to manage the transition.
Introduction
In August 2023, the ILO published the first global employment estimates of potential occupational exposure to generative artificial intelligence (GenAI) (Gmyrek et al., 2023). This research was prompted by concerns – that have featured prominently in the media – of the potential for the technology to replace large shares of knowledge work.
Since the release of the 2023 estimates, there have been further technological advances in GenAI, including the introduction of Large Language Models (LLMs) with expanded capabilities in image recognition and audio and video production. Moreover, many new GenAI applications have been developed as a result of the possibility of linking GenAI models with Application Programming Interface (API) tools. Indeed, GenAI has been likened to a general-purpose technology, meaning that it may continue generating new applications and innovations across various sectors, driving long-term economic and societal transformations.
Despite this rapidly developing landscape, it is important for policy makers to develop deeper understanding of how technological advances might impact existing jobs. To address this need, the Research department of the ILO has partnered with NASK, the National Research Institute of the Ministry of Digital Affairs in Poland, to develop a more precise assessment of potential effects of GenAI on employment across countries.
This study builds on the method developed by the ILO
The first step in our analysis is based on Poland’s national 6-digit classification of occupations that includes nearly 30,000 tasks. This expands tenfold the number of tasks given in the ISCO-08 structure and enables a fine-grained assessment of tasks’ automation potential, based on a more up-to-date set of occupations and tasks than those captured in the ISCO-08 system. As Poland’s 6-digit classification is aligned with the 4-digit ISCO-08, the occupational scores can be compiled at the 4-digit level allowing a straightforward comparison and updating of the 2023 estimates of the ILO (GBB). In addition, the study improves the methodological framework of GBB, by drawing on the combined strengths of human and AI abilities, with an additional layer of expert verification.
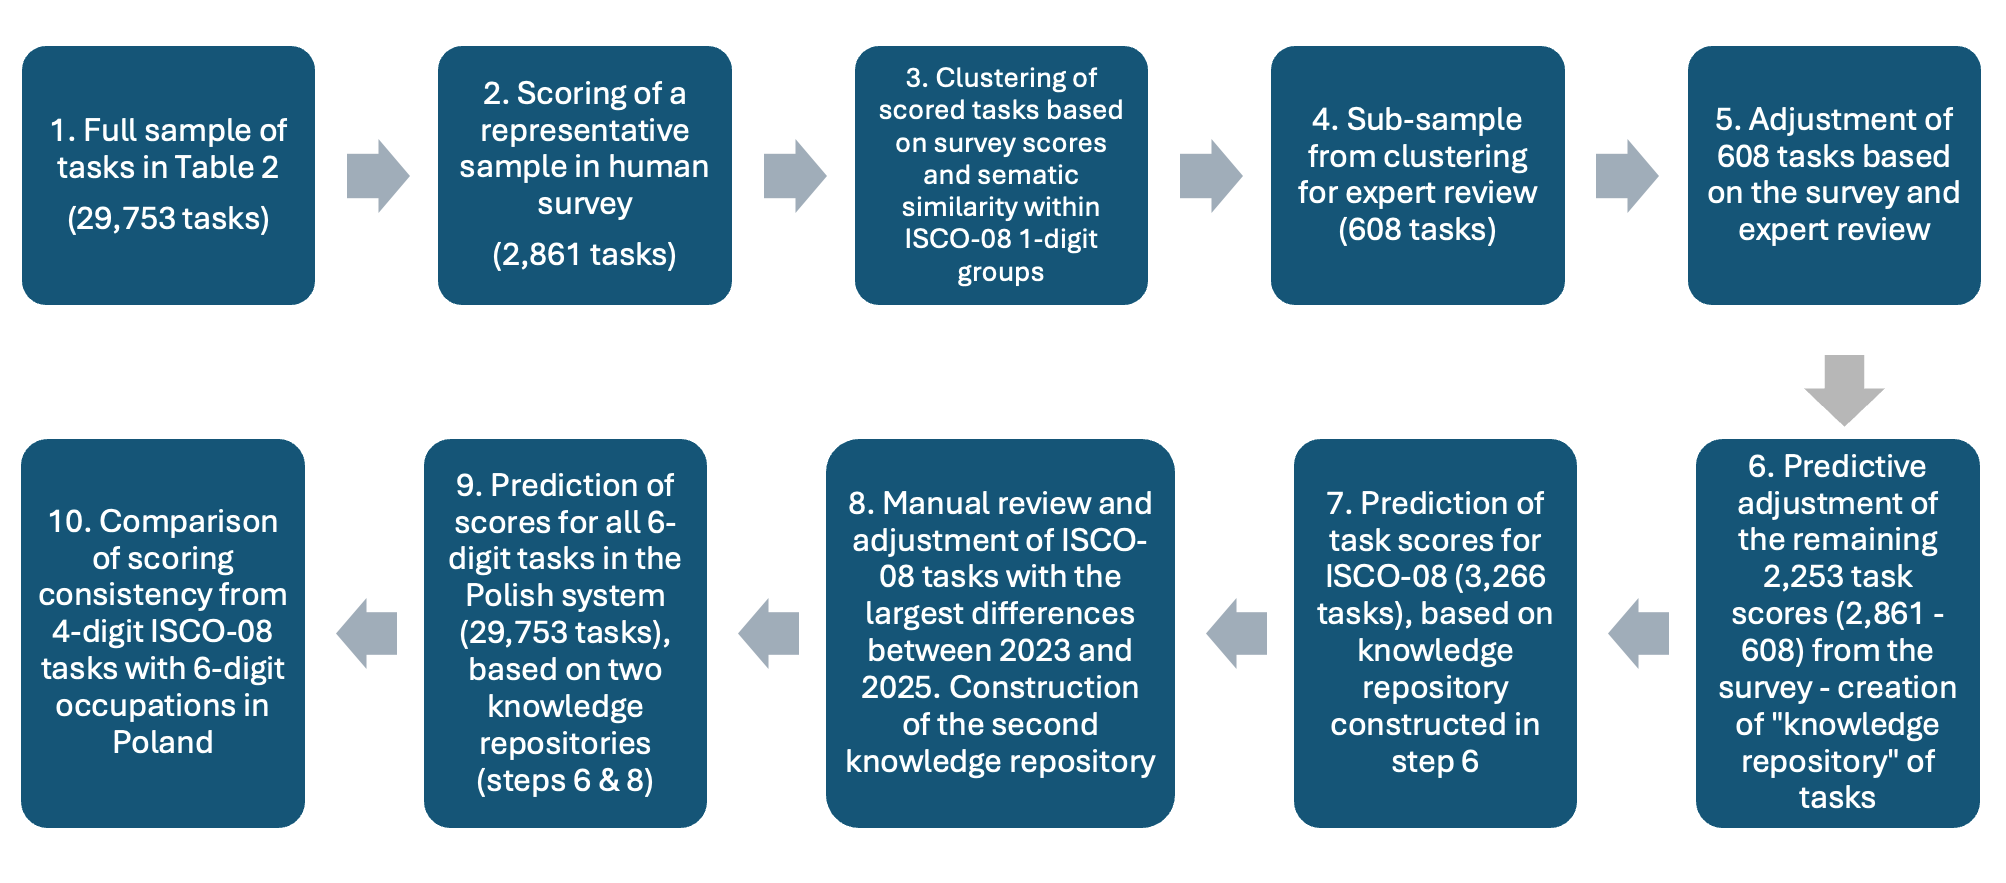
Specifically, we surveyed 1,640 people currently employed in Poland in each ISCO-08 1-digit group to rank the automation potential of a representative sample of tasks that pertain to their occupational group. As the second step, we asked a mix of national and international experts to conduct a detailed review of a large sample of tasks previously assessed in the survey to validate or adjust the level of automation scores through an iterative process. Since we maintain the hierarchical link to ISCO-08 and focus on technological feasibility rather than specific country context, by combining opinions of local and international experts, we create a system that enables more precise predictions of the potential of automation of individual occupational tasks with GenAI technology, including at the international level. To achieve that, we input the human scores into an AI model, to generate scores reflecting human judgement for nearly 30,000 individual tasks pertaining to 2,500 occupations at 6-digit level in Poland. We then use the same AI predictor to re-generate scores for the tasks in ISCO-08, previously provided by GBB (2023), thereby adjusting the 2023 index of the ILO, which now benefits from both the input of people employed in each ISCO-08 1-digit group and from expert opinions. As the final step, we provide updated global, regional and income-based estimates of employment that has the potential to be transformed by Gen AI technology.
Our study specifically targets GenAI tools, isolating the effects of this recent family of AI from broader AI applications, such as the use of Machine Learning (ML) algorithms or image recognition in industrial production. There are several considerations that justify such selective focus. First, we respond to the growing need for a research tool that could provide a better picture of GenAI’s potential impact on national labour markets, given the growing societal angst concerning this technology and the recent reports about increasing levels of adoption of GenAI at work
This paper is the first in a series of upcoming publications based on ILO and NASK cooperation that strive to improve the methodology for assessing employment effects of AI, but also to document in detail the methods used, including the survey, expert verification process and the construction of the AI model used for predictions. Subsequent papers will present an assessment of the potential impact of GenAI on the Polish labour market, based on more detailed occupation and task-level data and using a mix of quantitative and qualitative methods. All publications will include the methodological blueprints and technical details of both the quantitative and qualitative components, including survey questionnaires and interview guidelines. By making these tools openly accessible, we hope to contribute to the development of an improved method for assessing potential impact of GenAI on jobs and to stimulate more detailed national-level studies, including in lower- and middle-income countries.
Task-based approaches to automation in the literature
Central to the study of technology on work is the insight that jobs are a “bundle of tasks” (Autor, 2015). As such, task automation might, or might not lead to job automation, depending on the importance of a particular task to an occupation. Analyses of employment effects of automation that use the task-based approach, including this study, attempt to capture two central considerations: (i) the ability of a specific technology to automate a given task and (ii) the character of existing occupations in the labour market, based on the detailed tasks performed by these occupations. By modelling the intersection of these two dimensions, one arrives at a range of possible projections of how such technology could interact with occupational tasks, leading either to their full automation through technology-driven substitution, or to a transformation, through partial automation and human-machine complementarity. While the task-based framework certainly has limitations, recent academic literature shows the analytical advantages of this method for modelling employment and labour market impacts
Research on AI and tasks has shown important improvements in methods and scope in recent years, which includes using AI tools for research purposes. In one of the early papers on Machine Learning (ML) and jobs,
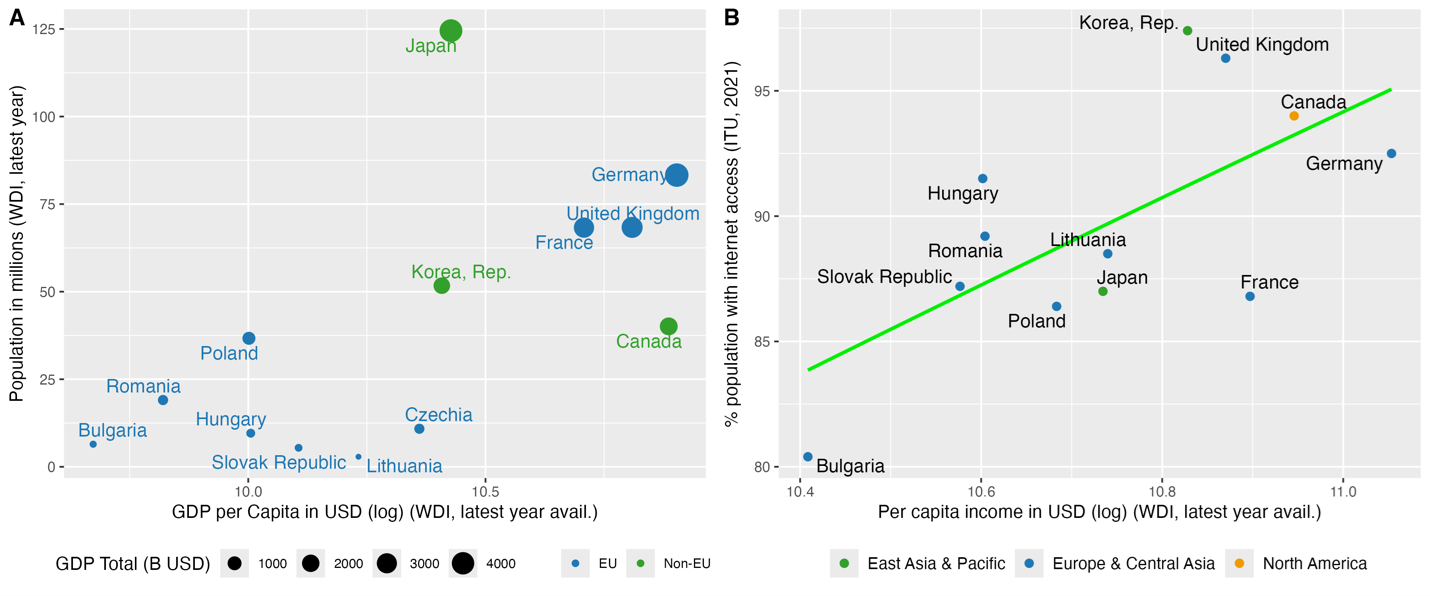
Most task-based studies are focussed on the US, due to the very detailed nature of the O*NET database, as well as its public accessibility. This typically forces researchers interested in the global picture or other countries and regions to base their analysis on the strong assumption of similarity of local economic and labour effects to those projected in the US context. In reality, occupational tasks can vary significantly among individual countries, which poses a particular challenge in developing countries. As such, working with tasks in the ISCO-08 system offers a useful and simple common denominator for projections across different countries, regions and income groups. Our method combines the strengths of this global framework with a significantly more detailed national classification system in Poland, which provides a detailed list of occupations and tasks, based on the latest labour market data. This helps us establish a starting point for modelling interaction of GenAI’s abilities with up-to-date tasks and occupations in a setting located between the countries with highest incomes and the emerging economies (Figure 1). Using a combination of GenAI tools, we subsequently transfer this knowledge back to the tasks in ISCO-08 system.
Tasks and occupations in the 6-digit system in Poland
Within Europe, Poland is quite representative of the larger group of Central and Eastern European (CEE) countries, albeit with a significantly larger population (38 million) than most of its peers. Globally, the CEE ranks between the high-income advanced economies and the emerging economies of the Global South. With respect to access to the internet, Poland ranks below UK and Germany, but higher than Japan and France. Thus, for assessing the potential of task automation, it seems reasonable to assume that Poland is representative of the upper threshold of automation potential, due to high availability of digital equipment and widespread internet access.
Figure 1. Income- and population-based similarities (A) and access to the internet (B) across countries
The Ministry of Family, Labour and Social Policy (MOL) in Poland maintains a system of occupational classifications, with task and job descriptions that are regularly updated.2 The system is used by Statistics Poland (GUS) and other state institutions for labor market analysis. At the most detailed, 6-digit level, this framework contains 2541 occupations and 29,753 corresponding tasks (Table 1). Since the system is publicly available online, we initially designed a scraping bot that crawled through individual occupational pages and downloaded job descriptions and corresponding tasks into a structured data frame.3 The extracted content was subsequently cross verified against a tabular occupational classification provided by the Ministry. The Polish classification system is compatible with the hierarchical structure of ISCO-08, which means that we could easily append an additional mapping of occupations from 1 to 4-digit level (Table 1).
Table 1. Composition of occupational tasks in the Polish classification system and in ISCO-08
|
ISCO- 08 occupational classification |
Polish 6-digit occupational classification |
||||||||||
|---|---|---|---|---|---|---|---|---|---|---|---|
|
ISCO-08 1-digit |
Group Name |
Count of 2-digits |
Share in 2-digits |
Count of 3-digits |
Share in 3-digits |
Count of 4-digits |
Share in 4-digits |
Count of 6-digits |
Share in 6-digits |
Count of 6-digit tasks |
Share in 6-digit tasks |
|
1 |
Managers |
4 |
10.0% |
11 |
8.7% |
30 |
7.1% |
173 |
6.8% |
2565 |
8.6% |
|
2 |
Professionals |
6 |
15.0% |
27 |
21.4% |
92 |
21.7% |
721 |
28.4% |
8715 |
29.3% |
|
3 |
Technicians and associate professionals |
5 |
12.5% |
19 |
15.1% |
80 |
18.9% |
507 |
20.0% |
5956 |
20.0% |
|
4 |
Clerical support workers |
4 |
10.0% |
8 |
6.3% |
27 |
6.4% |
71 |
2.8% |
768 |
2.6% |
|
5 |
Service and sales workers |
4 |
10.0% |
13 |
10.3% |
40 |
9.5% |
149 |
5.9% |
1730 |
5.8% |
|
6 |
Skilled agricultural, forestry and fishery workers |
3 |
7.5% |
9 |
7.1% |
17 |
4.0% |
53 |
2.1% |
684 |
2.3% |
|
7 |
Craft and related trades workers |
5 |
12.5% |
14 |
11.1% |
65 |
15.4% |
407 |
16.0% |
4554 |
15.3% |
|
8 |
Plant and machine operators, and assemblers |
3 |
7.5% |
14 |
11.1% |
40 |
9.5% |
348 |
13.7% |
3769 |
12.7% |
|
9 |
Elementary occupations |
6 |
15.0% |
11 |
8.7% |
32 |
7.6% |
112 |
4.4% |
1012 |
3.4% |
|
Total |
40 |
100% |
126 |
100% |
423 |
100% |
2541 |
100% |
29753 |
100% |
|
Note: Table 1 illustrates the hierarchical relationship between ISCO-08 and the Polish 6-digit classification of occupations. The “Count of x-digits” columns show the number of occupations at each level, with 423 occupations at the 4-digit ISCO-08 level. The “Count of 6-digits” column represents the number of occupations in the Polish system mapped to ISCO-08’s 4-digit level. Armed Forces Occupations have been excluded due to the lack of specific tasks. Shares indicate the percentage of each group at the corresponding level. The table only includes occupations for which detailed tasks are available in the Polish classification; those without tasks have been excluded.
Assessment of tasks’ automation potential
3.1. Initial Algorithmic predictions
As the first step, we conducted a purely algorithmic assessment of potential exposure to automation for each task in the Polish 6-digit system, relying on three advanced LLMs available on the market at the end of 2024: GPT-4, GPT-4o and Gemini Flash 1.5. The method relies on the approach previously used by GBB (2023), with a sequential API call devised to assign a score ranging from 0 to 1 for each individual task, where 0 means the task cannot be automated and 1 means the task could be fully automated with GenAI technology (the task can be conducted without participation of a human operator).4 The LLM is provided with information on the occupation to which the task pertains in ISCO-08 and requested to produce a justification for each predicted score.
Figure 2. Distribution of synthetic automation scores from 3 LLMs, by ISCO-08 1-digit
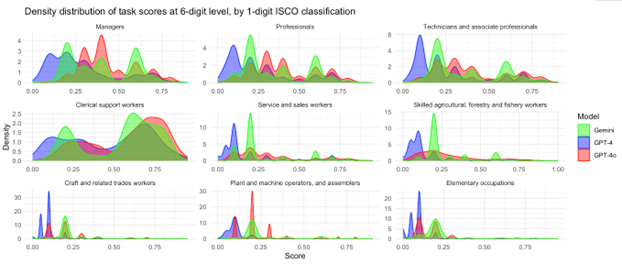
The overall distribution of these synthetic automation scores is generally consistent with scores based on ISCO-08 documentation (GBB, 2023;
3.2. Selection of occupational tasks for human assessment
To improve the precision of our synthetic predictions, we design a human-based evaluation of the potential for task automation. Since scoring of all 29,753 tasks would be too cumbersome for a survey, we focus on a sub-sample of tasks that are representative of the tasks in each professional group at 1-digit ISCO-08 level (Table 1). We employ the standard formula to calculate sample size (see Appendix 2).
Table 2 presents task sample calculations for each 1-digit category. The minimum number of scorings per question is set to 20, based on the general rule used by ILO Statistics for micro-data analysis, where observations with less than 16 respondents are flagged as unreliable. The number of scorings is set to 35 per respondent, based on our pre-testing of the survey form for potential fatigue effects.
Table 2. Survey sample selection
|
ISCO-08 1-digit category |
Description (1-digit) |
Number of tasks |
% of all tasks |
Unadjusted Sample Size (infinite Population) |
Adjusted sample size |
Sample Proportion |
Nr of scorings per task |
Total task scorings |
Tasks per survey respondent |
Nr of Respondents |
|---|---|---|---|---|---|---|---|---|---|---|
|
1 |
Managers |
2'565 |
8.6% |
384 |
334 |
11.7% |
20 |
6682 |
35 |
191 |
|
2 |
Professionals |
8'715 |
28.6% |
384 |
368 |
12.9% |
20 |
7357 |
35 |
210 |
|
3 |
Technicians And Associate Professionals |
5'956 |
21.1% |
384 |
361 |
12.6% |
20 |
7216 |
35 |
206 |
|
4 |
Clerical Support Workers |
768 |
2.6% |
384 |
256 |
9.0% |
20 |
5124 |
35 |
146 |
|
5 |
Service And Sales Workers |
1'730 |
5.4% |
384 |
314 |
11.0% |
20 |
6288 |
35 |
180 |
|
6 |
Skilled Agricultural, Forestry, And Fishery Workers |
684 |
2.3% |
384 |
246 |
8.6% |
20 |
4923 |
35 |
141 |
|
7 |
Craft And Related Trades Workers |
4'554 |
15.5% |
384 |
354 |
12.4% |
20 |
7084 |
35 |
202 |
|
8 |
Plant And Machine Operators, And Assemblers |
3'769 |
12.6% |
384 |
349 |
12.2% |
20 |
6972 |
35 |
199 |
|
9 |
Elementary Occupations |
1'012 |
3.3% |
384 |
279 |
9.7% |
20 |
5571 |
35 |
159 |
|
0 |
Armed Forces Occupations |
|
|
|
|
|
|
|
|
|
|
|
TOTAL |
29'753 |
100.0% |
|
2'861 |
100% |
|
57'218 |
|
1'635 |
Within these initial parameters, each respondent is assigned a random set of tasks from the larger sample of tasks for each broad occupational group. The randomization of the tasks’ sample selection maintains a general pattern of the distribution of scores similar to the scores initially generated with the LLMs (Section 4.1). However, the respondents are not made aware of these prior distributions, instead they receive a wide range of tasks with respect to their automation potential.
3.3. Survey design and recruitment
We conducted the human survey using the Computer-Assisted Web Interview (CAWI) method, drawing on a large online research platform in Poland, used for both commercial and scientific studies. This also means that some demographic characteristics are already pre-filtered at survey deployment stage, whereas others are captured through a set of core questions at the start of the survey (Table 3). Specifically, we capture respondents’ gender, age group, size and place of residence, region of residence, highest level of education and their current profession. The professional classification is further facilitated by providing respondents with a short description of ISCO-08 1-digit classifications, alongside examples of occupations that fit into each category.
In addition to demographic information, subsequent core questions are designed to capture respondents' knowledge and experience with GenAI. These questions help contextualize how familiarity and interaction with GenAI may influence assessments of task automation potential. Specifically, respondents are asked how long they have worked in their current profession (Q4), as more experienced workers may have a deeper understanding of their tasks and offer more cautious or realistic assessments. Additionally, they are queried on their familiarity with AI (Q5), with more knowledgeable respondents potentially providing more informed evaluations. We also capture how often respondents use AI tools in their job (Q6), which provides insight into their practical engagement with AI and its integration into their daily tasks.
Finally, in core questions 7-8, we ask how respondents view the broader impact of AI on jobs in their field, helping us understand their perspectives on automation over the next five years. The final question in this section probes respondents’ views on the likelihood that their own job could be partially or fully replaced by AI, which helps assess whether job security concerns might influence their task evaluations. Table 3 below provides a summary of the core questions.
Table 3. Core survey questions
|
Question |
Answer Options |
|
|---|---|---|
|
1 |
What is your gender? |
Male / Female / Other / Prefer not to say |
|
2 |
What is your age? |
Age ranges (e.g., 18-24, 25-34, 35-44, etc.) |
|
3 |
What is your highest level of education? |
1. High school or equivalent; 2. Bachelor's degree; 3. Master's degree; 4. PhD or higher; 5. Other |
|
4 |
How many years have you worked in your current profession? |
1. Less than 1 year; 2. 1-5 years; 3. 6-10 years; 4. 11-15 years; 5. More than 15 years |
|
5 |
Have you heard of Generative Artificial Intelligence (GenAI, e.g. ChatGPT)? |
1. Yes; 2. No; 3. Hard to say |
|
5a |
How would you rate your level of knowledge about Generative Artificial Intelligence (GenAI, e.g. ChatGPT)? |
1. Very low; 2. Low; 3. Average; 4. High 5. Very high |
|
6 |
How often do you use Generative Artificial Intelligence tools (GenAI, e.g. ChatGPT)? |
1. Never; 2. Rarely (a few times a year); 3. Occasionally (a few times a month); 4. Frequently (a few times a week); 5. Daily |
|
7 |
How do you think Generative Artificial Intelligence (GenAI, e.g. ChatGPT) will impact jobs in your field in the next 5 years? |
1. No impact at all; 2. Slight impact; 3. Moderate impact; 4. Strong impact; 5. Transformational impact |
|
8 |
To what extent can your job be replaced by Generative AI (e.g. ChatGPT) in the next 5 years? |
Will not be replaced (0%) |-----------------slider----------------|Will be completely replaced (100%); I don't know |
In its main section, the survey moves to the assessment of respondents’ perception of tasks’ automation potential. Each respondent is presented with a random selection of 35 tasks from their occupational group at 1-digit ISCO-08 level, as previously described in the sample selection process (Section 4.2). For each task, respondents are asked to evaluate the susceptibility of the task to automation by generative AI on a scale from 0 to 100, with 0 indicating "not automatable" and 100 indicating "fully automatable".6 In addition to scoring tasks for automation potential, respondents are asked to indicate whether they personally perform a similar task in their current job by ticking a box next to each task. This allows for the comparison of GenAI’s perceived impact on tasks that are only present in respondents’ occupational group, with those directly relevant to the respondents' current work.
Text Box 1. Sample Question for Task Automation Assessment
Below is a list of 35 tasks performed by people in different occupations. Please rate how much you think artificial intelligence can automate each of the tasks. Use the slider to indicate your opinion on a scale from 0 to 100, where 0 means no potential for automation, and 100 means full potential for automation.
Occupation: Actor
Task 1: Developing one's own artistic concept of a role
Slider scale (0-100):
| 0 - No potential for automation using GenAI | ------------ Slider ------------ | 100 - Full potential for automation using GenAI
| I don't know
Do you perform this or a similar task in your current job?
-
Yes
-
No
3.4. Survey design limitations
The survey is designed to capture insights from individuals currently employed in various occupational categories of the 1-digit ISCO-08 framework. This means that tasks of managers are assessed by individuals working as managers, tasks of professionals are assessed by professionals, etc. The subsequent data analysis explores the differences among individuals based on their attitudes about technology, knowledge of AI and other parameters that are captured in the core questions (Table A3).
The advantage of this approach is that the tasks are assessed by those familiar with the work from their own professional context. On the downside, this survey design means that the sample may not represent the entire working population, and interpretability of opinions on the automation potential is limited to comparisons within each 1-digit group. We also expect an imbalance of understanding and experience with tasks and GenAI across different occupational groups, as managers or professionals are likely to know more about AI than elementary workers, whereas the latter are likely to understand better the nature of elementary workers’ tasks, but might have less familiarity with GenAI tools.
We mitigate these negative effects in several ways. First, to equilibrate the level of understanding among participants, a prompt about current abilities of GenAI is shown in the introduction of the second part of the survey (see Text Box 2 and full survey questionnaire in the Appendix). Second, we run a survey among the ILO, NASK and MOL experts on a smaller sample of tasks, drawn from across all ISCO-08 groups, and compare these results to the results of main survey respondents (Section 5). In cases of drastic discrepancies, we consult with the expert group and manually establish what seems to be the most reasonable score.
Text Box 2. Introductory prompt for survey respondents
We have a short piece of information for you about Generative Artificial Intelligence (GenAI). In our study, we want to distinguish GenAI from artificial intelligence (AI).
AI allows you to make decisions based on data (e.g. what product to offer you next in an online store, recognize car license plates at the entrance to the parking lot and raise the barrier)
GenAI can generate new content, e.g. images, text, speech. The most popular tool is ChatGPT, which can answer questions, write emails, prepare an application to the office, create reports, summarize a specified text (e.g. an article, book).
What can GenAI do?
-
Write a text, "pretending" to be a specific person, e.g. an official, poet, financial analyst;
-
Prepare translations between languages, e.g. from Polish to English;
-
Convert written text into human speech ("read" text in a given language);
-
Program - change specified tasks into computer language code, e.g. Python, HTML;
-
Generate an image, e.g. a photo, based on a given description, or recognize and describe an image (e.g. what is in the photo).
3.5. Survey of Task Automation Potential
3.5.1. Sample properties
The main survey sample consists of 57,400 observations and 1,640 unique respondents. Among these, 105 participants responded with 'Don't know' to most questions, providing less than 50% of the required task rankings. Due to limited engagement, these participants were removed from the analysis as they were deemed insufficiently credible. The excluded group includes a variety of demographic and occupational profiles, which were carefully reviewed to ensure that their removal would not introduce significant bias into the results. As the next step, we excluded 1,167 observations where participants responded with 'Don't know' to the ranking of task automation potential. This ensures the analysis focuses only on responses where participants felt equipped to provide meaningful input.
A detailed examination of “don’t know” answers showed that they occur twice as frequently in manual or technical fields – particularly among Technicians and Associate Professionals (Group 3), Craft and Related Trades Workers (Group 7), Plant and Machine Operators and Assemblers (Group 8), and Elementary Occupations (Group 9) – than in other occupational groups.7 Since the differences in stated exposure and frequency of use of GenAI do not seem to justify this pattern (see section 4.5.2), it suggests that participants may have felt less equipped to assess the automation potential of tasks requiring specialized technical expertise or manual skills. This is illustrated though the three tasks with the largest number of “don’t know” responses (7 each): (i) operating devices (centrifuges and filters) used for separating fermented milk mass into yeast slurry, (ii) recording delivered goods and collected coins (tokens), and (iii) organizing and cleaning the workstation.
Following this exclusion, we retained a substantial sample of 1,535 respondents, contributing a total of 52,558 data points. These data points correspond exclusively to cases where participants provided valid responses to the primary survey question regarding the potential for task automation. Importantly, this filtering process did not reduce the total number of tasks assessed, which remains at the representative sample size of 2,861, as calculated in Table 2.
Figure 3. Age and sex distribution in the survey compared to Labour Force Survey (LFS) data in Poland (employed individuals)
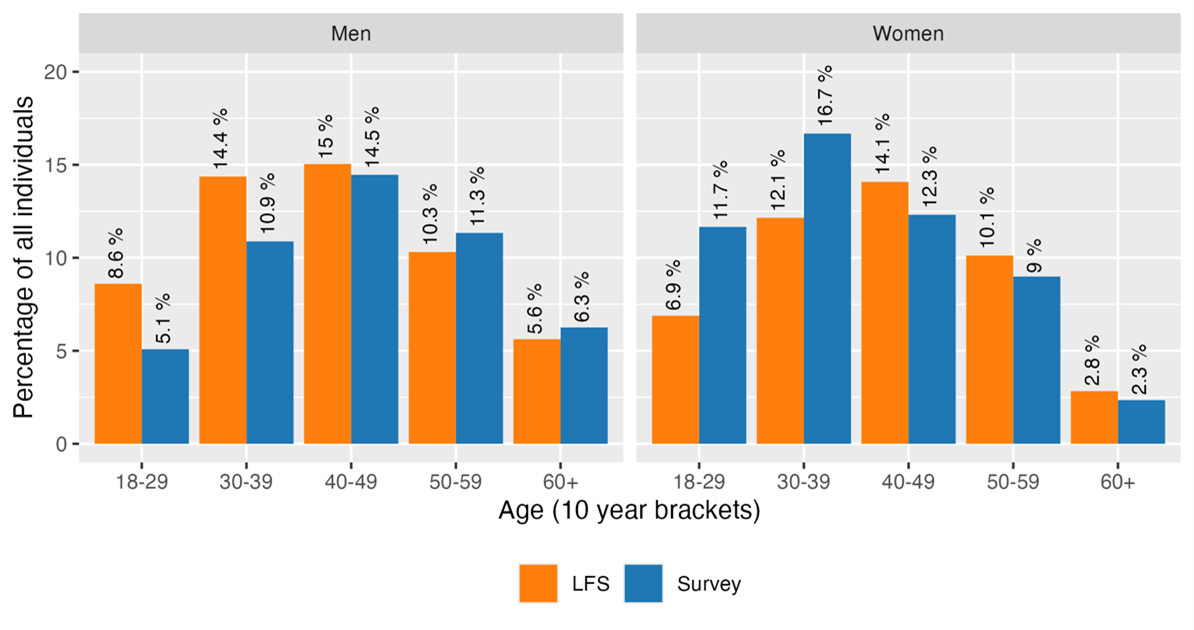
The survey sample is well-balanced in terms of gender, with 51% female and 49% male respondents. The actual gender distribution among the employed population aged 18+ in Poland is more skewed toward men, with 53.9% of employed individuals being male and 46% female. As shown in Figure 3, this results in the survey overrepresenting female opinions in the younger age brackets (18–29 and 30–39).
Figure 4. Distribution of occupational groups in the survey, compared to LFS in Poland (employed individuals) and to the desired sample (Table 2)
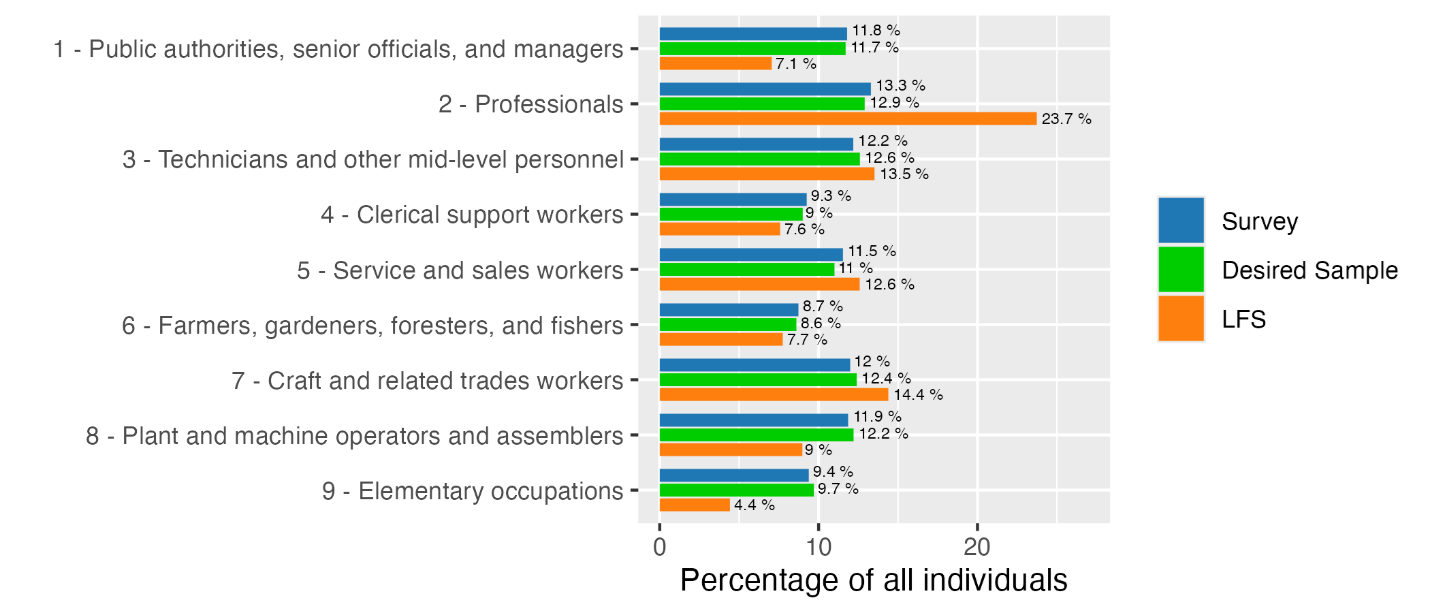
Figure 4 illustrates the broader distribution of the survey sample across ISCO-08 1-digit groups, compared to both the employed population in the LFS and the desired sample (Table 2). Professionals (2) are clearly the most underrepresented group, while groups 1, 8 and 9 are overrepresented in survey responses, compared to the actual employment numbers. Notably, however, the desired sample calculated in Table 2, based on the share of tasks in each 1-digit category, achieves a closer alignment to the LFS structure for certain occupational groups.
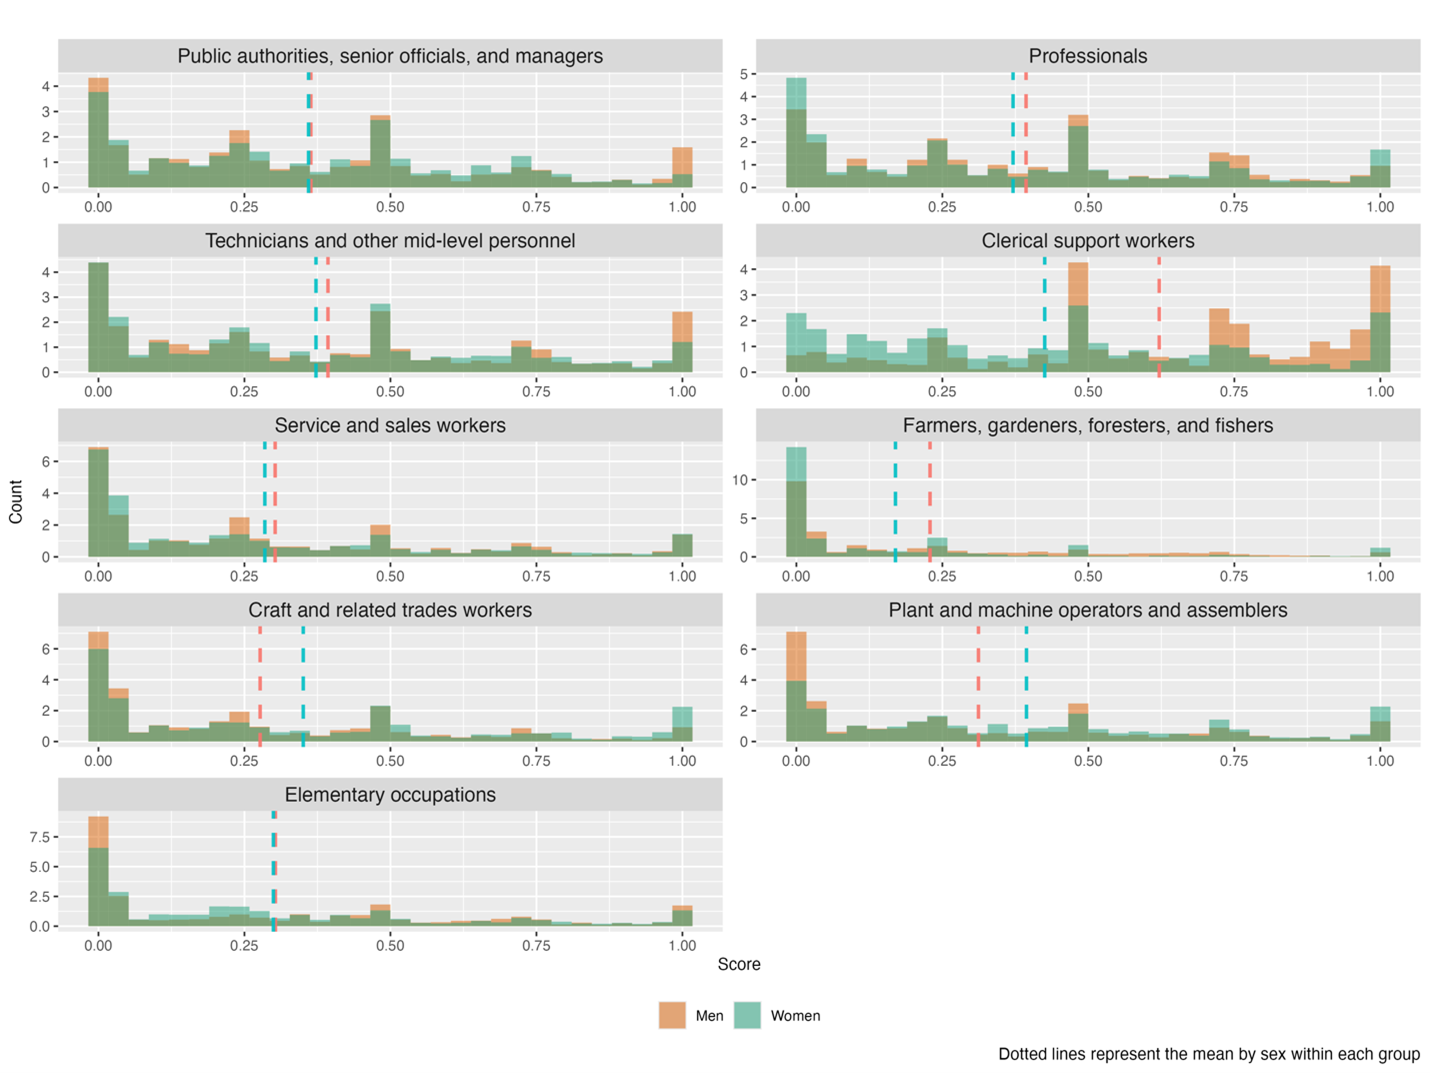
Figure 5. Occupation and sex distribution among survey participants compared to LFS in Poland (employed individuals)
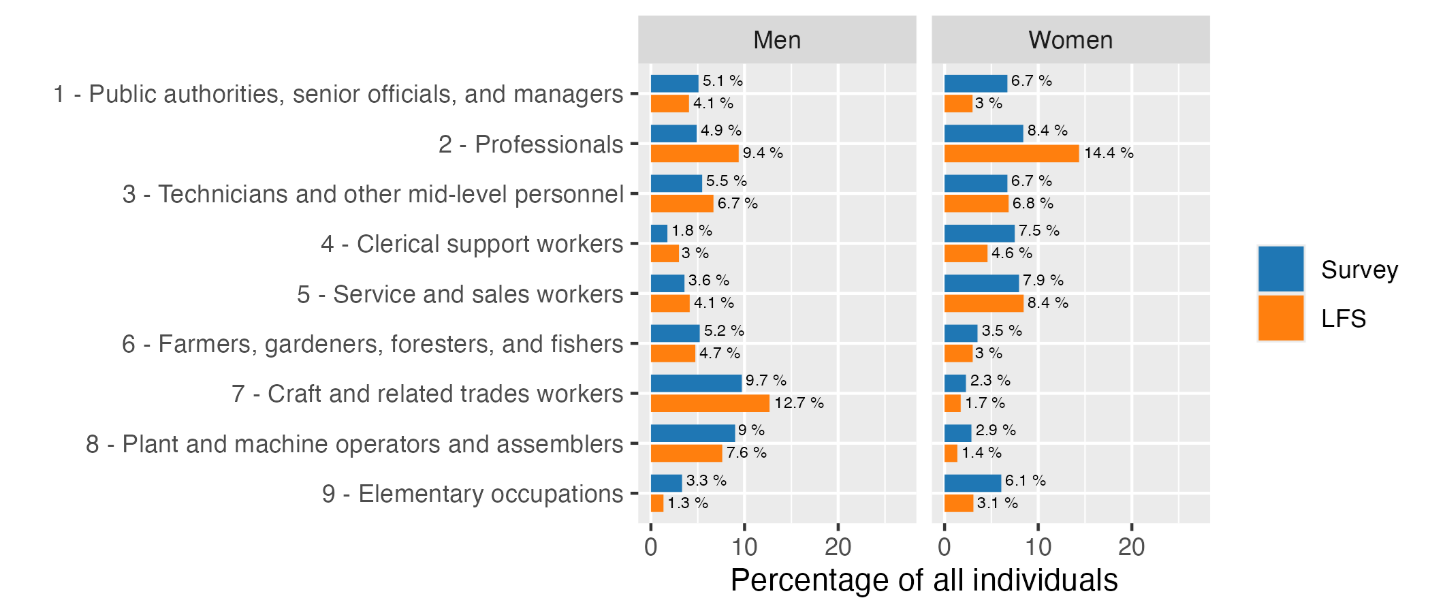
In terms of sex-related representation within occupations, largest imbalances occur within occupational groups of public authorities, senior officials and managers (1), clerical workers and elementary occupations (9), which are represented by women in the survey to a visibly higher extent than in the labour market (Figure 5). Men are underrepresented, compared to the LFS, among professionals (1) and craft workers (7). For other occupational groups, the survey pattern is fairly consistent with national labour market trends.
Such discrepancies are important to note but do not affect our strategy, as the primary goal of sampling was to ensure representativeness of tasks at the level of occupational 1-digit groups, rather than replicating the exact gender and economic structure of the employed population (Table 2). With this objective met, we did not apply additional weight-based adjustments to the survey sample. Instead, the deviations between the survey and LFS are treated as a natural variation inherent to a task-specific character of this study, which follows the imbalances in the total number of tasks across 1-digit groups, as well as other assumptions made in Section 4.2.
3.5.2. Participants’ Exposure to GenAI: Screening Questions
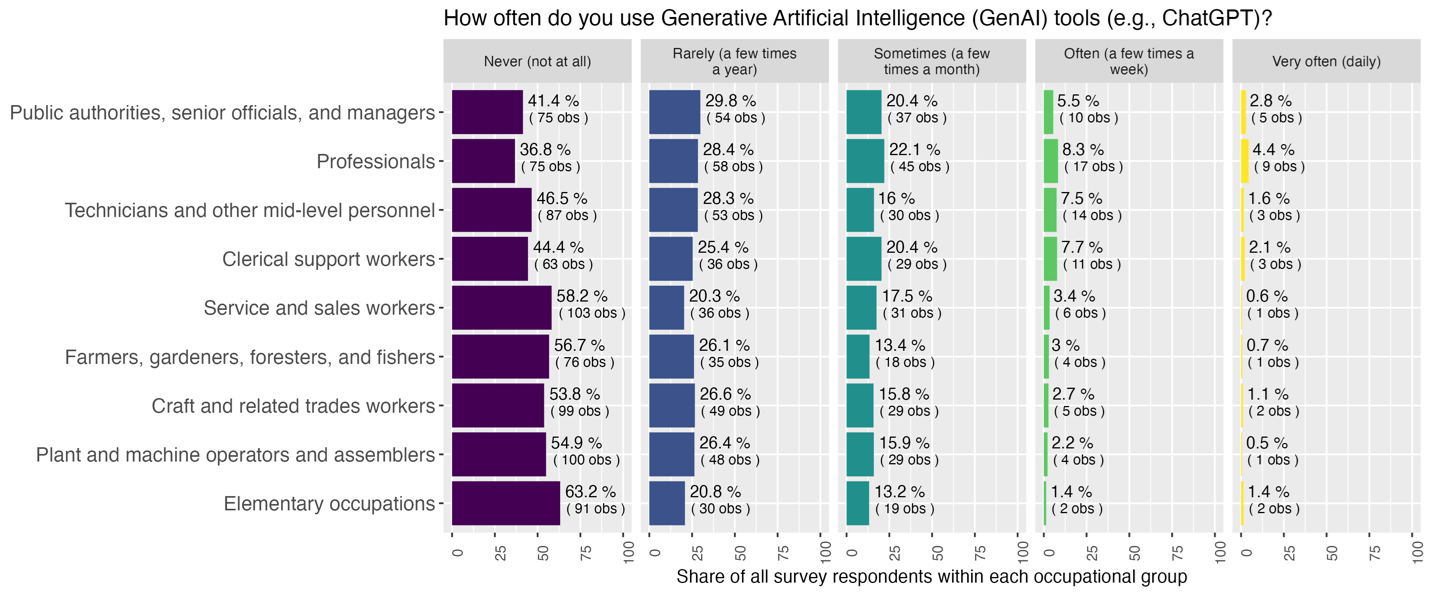
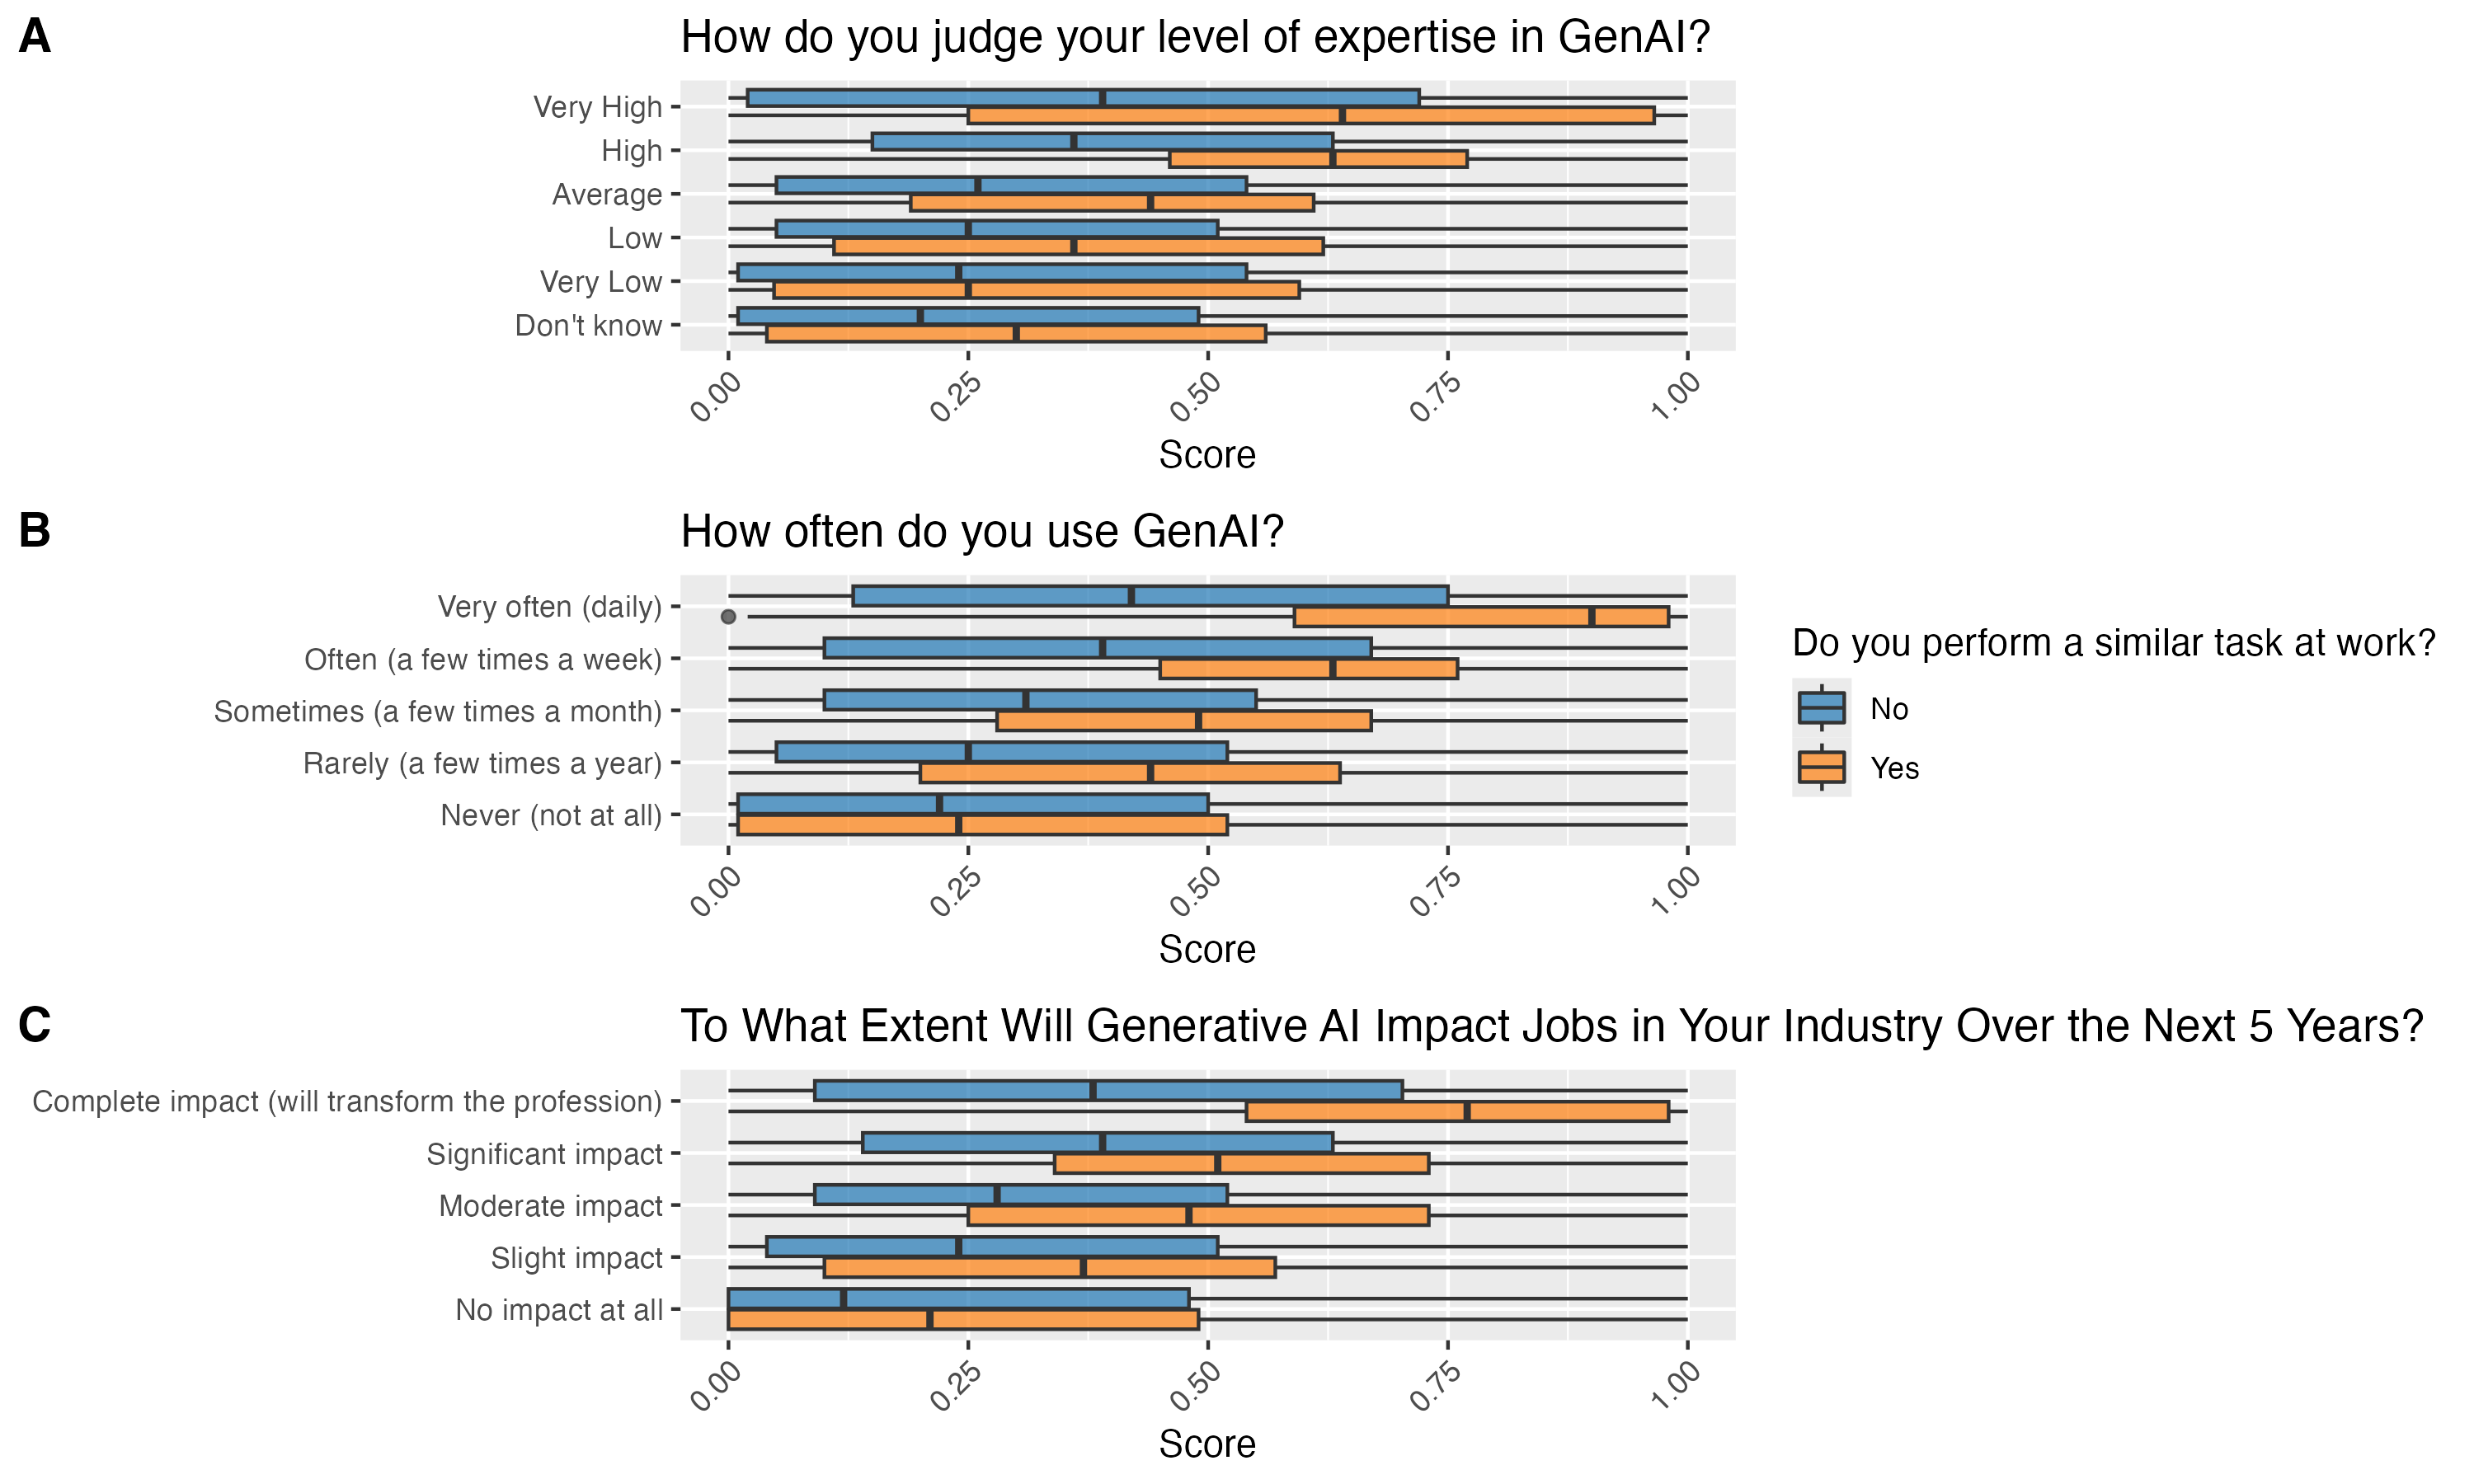
The screening section of the survey tested participants’ prior exposure to GenAI. A significant majority of survey participants (71.2%) report having heard about this technology, with relatively small differences between genders and occupational groups. Despite this high level of awareness, the actual use of GenAI is limited, with most respondents reporting they "never" (50.1%) or "rarely" (26%) use it. Sporadic use (few times a month) is reported by 17.4% of all participants, with only 4.8% reporting regular use and less than 2% using it very often. Among the 1-digit occupational groups, professionals, technicians, public authorities, senior officials and managers use these technologies more frequently than the groups with a stronger presence of manual tasks (Figure 6). This seems consistent with recent studies of GenAI adoption, which suggest higher use of GenAI among occupations with a larger share of cognitive work
Figure 6. Frequency of use of GenAI, by 1-digit ISCO-08
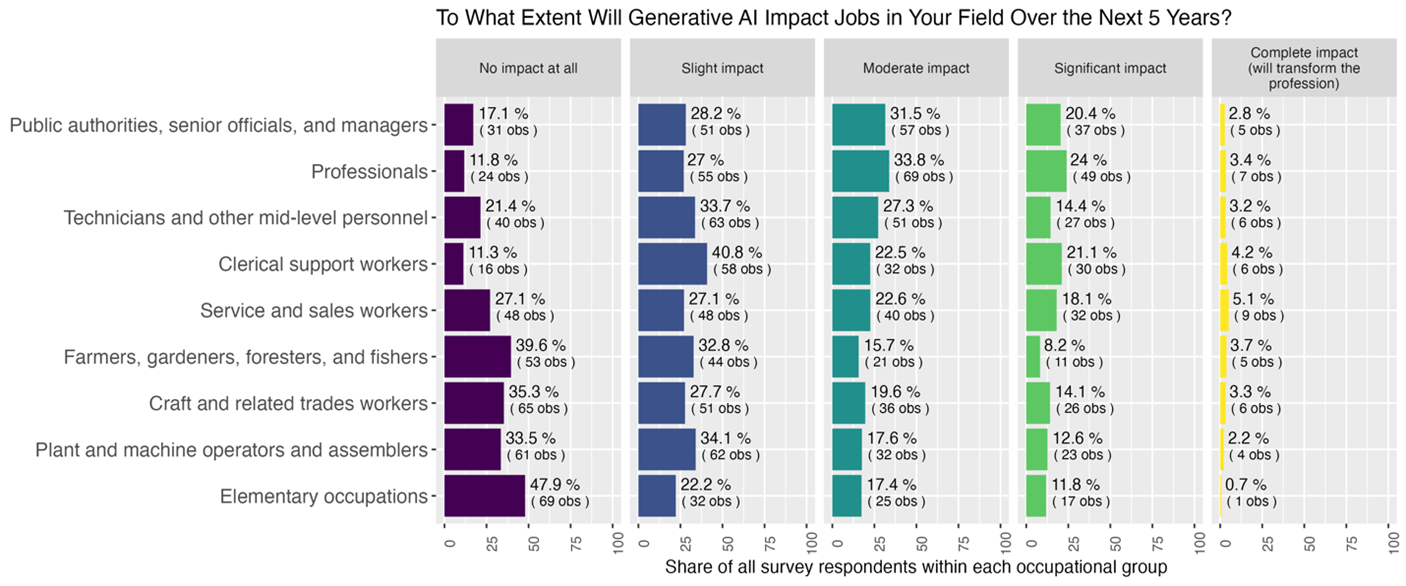
When considering the potential impact of GenAI on jobs within their industries, most respondents expect either no impact (26.5%) or only a slight impact (30.2%). As shown in Figure 7, manual and technical groups have a significantly higher share of such responses. Reports of moderate and significant impact are highest among professionals (33.8% and 20.4%), public authorities, senior official and managers (31.5% and 24%), clerical support workers (22.5 % and 21.1%) and technicians (27.3% for moderate impact), though the latter stand out with notably lower expectations of a significant impact (14.4%). This might be due to the inherent complexity of many tasks in this professional group. In comparison, relatively few respondents predict a complete transformation of their occupations, with the highest share of such responses among service and sales workers (5.1%) and clerical support workers (4.2%), and a small total number of these observations.
Figure 7. Expectations of impact on the work area
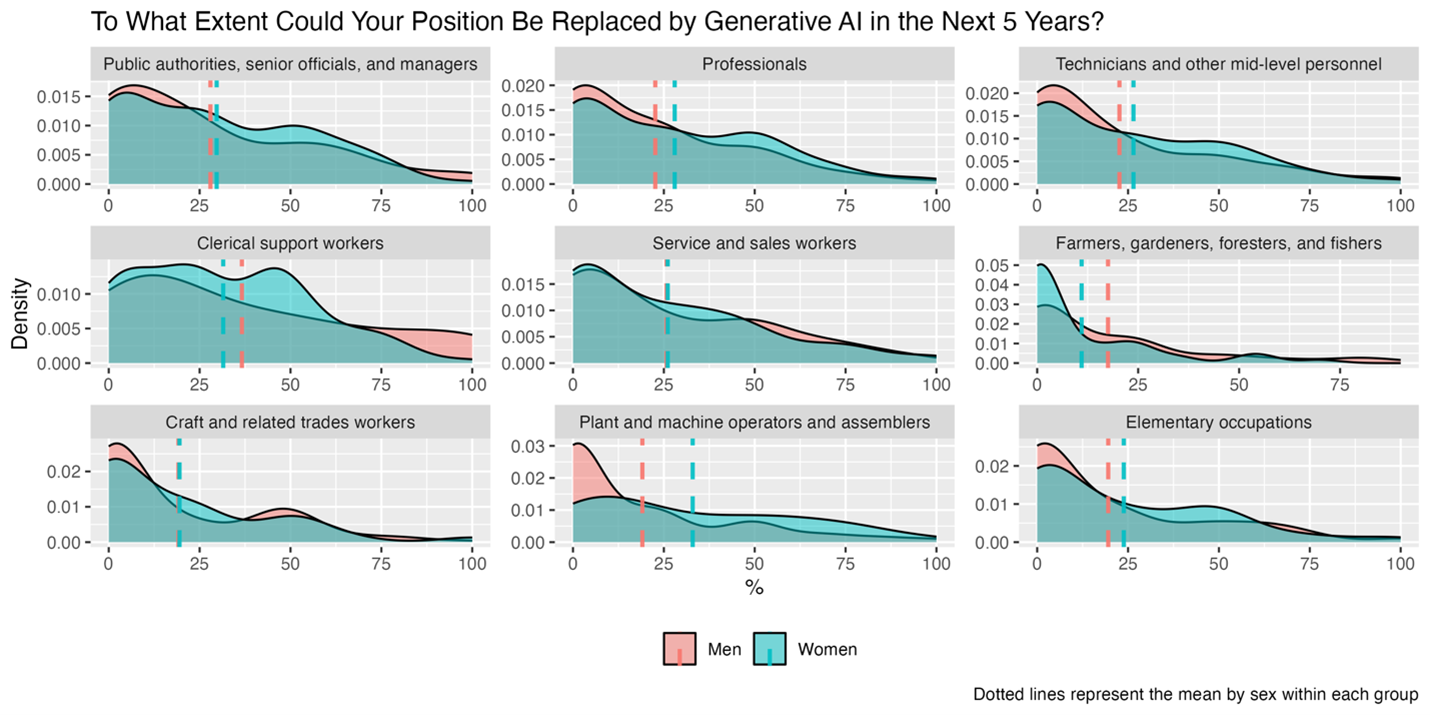
We further examine these trends by asking respondents a more personal question, related to their perceived likelihood of GenAI replacing their current job in the next five years. For most professions, responses are clustered at the lower end of the risk spectrum, suggesting limited concern about replacement by GenAI in the mid-term (Figure 8). However, among clerical support workers, the density of responses representing moderate to high levels of concern is noticeably higher, with women reporting slightly higher risks compared to men, while the converse is observed among plant and machine operators and assemblers.
Figure 8. Expectations of impact on individuals’ current job – distribution of individual scores
3.5.3. Scoring of task automation potential
The survey asked respondents to evaluate the extent to which GenAI could automate the execution of various tasks (see Text Box 1). As shown in Figure 9, responses reveal gendered scoring that aligns with occupational segregation. For example, the scores provided by clerical support workers are predominantly from women, reflecting the high representation of women in this occupational group. However, men within this occupation tend to assign higher scores, potentially reflecting a different perception of task automatability or biases regarding clerical work, despite their lower representation in this group. Conversely, men dominate responses in occupations such as craft and trade workers and plant and machine operators, but for the tasks in these occupations, they assign lower scores than women. These differences may be representative of different task composition or even tasks performed by men and women, even when in the same occupational category, which then influence their scoring.
Figure 9. Distribution of task-level scores by sex and occupational group (1-digit ISCO-08)
To better understand the factors associated with higher task automation scores, we conducted a set of exploratory regressions using the main task-level score as the dependent variable and controlling for occupational clustering. Results suggest that across occupations, familiarity with a task is associated with higher scores, and this relationship strengthens with greater reported exposure to GenAI. Respondents who use GenAI frequently – such as on a daily or weekly basis – tend to assign higher scores. Similarly, those who believe GenAI will have a “Complete” or “Significant Impact” on their occupation consistently assign the highest task scores (Figure 10).8
Figure 10. Scoring as a function of familiarity with GenAI and the scored task – distribution of individual scores
One way to address this variation in scoring would be to apply corrective weights to responses, giving greater influence to respondent profiles likely to have more relevant expertise. For example, one could assign more weight to respondents reporting greater familiarity with GenAI or frequent usage or prioritize scores from individuals who perform similar tasks in their daily work. However, in our sample, this would introduce significant limitations. For 91.5% of the tasks, respondents did not report performing a similar task in their work – even when the task belonged to the same 1-digit occupational group as their current job. This is not surprising. For instance, within the “Professionals” group alone, the representative sample consisted of 368 tasks drawn from a pool of 8,715 tasks (Table 2), making exact task matching unlikely.
Moreover, adjusting for beliefs or usage would require strong theoretical assumptions about what constitutes “credible” scoring. For example, a respondent who believes their profession will be completely transformed by GenAI in the next five years may be highly informed, or may be expressing anxiety, speculation, or dystopian fears. Without richer data to distinguish between these interpretations, applying corrective weights risks introducing new biases.
Given the relatively small size of these specific subgroups in our dataset, we refrain from implementing such adjustments in the current analysis to avoid overfitting or compromising credibility. Instead, we flag this as an important area for future survey design, particularly in capturing respondent expertise and task familiarity more systematically.
For the present study, we treat the survey as a starting point, designed to capture a broad spectrum of perspectives reflecting varying degrees of familiarity with both tasks and GenAI. In many cases, a respondent’s understanding of the task itself may be more influential than their understanding of the technology, especially for concrete physical tasks (e.g. trimming flowers, assembling mechanical parts). Accordingly, we rely on mean scores across all respondents to reflect the collective judgment of a diverse sample grounded in workplace experience. To enhance robustness, we supplement this with expert evaluation of a subset of tasks (section 5), ensuring that final scores reflect both practical insights and a realistic appraisal of current GenAI capabilities.
Expert validation survey
The expert group includes international specialists at the ILO and its partner organizations, NASK and the Polish Ministry of Family, Labour and Social Policy.9 The primary criterion for expert selection is their understanding of labour markets, including the complexity of occupations and tasks, and their real-life applications. While the experts are expected to have familiarity with the current family of generative AI technologies and their applications, expertise in AI design or development is not a requirement. This approach ensures that the focus remains on the feasibility and practical implications of automation within existing technological constraints, as technology experts tend to overstate technological capacities and risks when evaluating broader applications, particularly in workplace settings (
Since the experts cannot review all 2,861 tasks used in the survey, we focus on a representative sub-sample, selected in such a way to subsequently permit adjustments to entire task clusters. The overall scheme of this score adjustment procedure is presented in Figure 11.
Figure 11. Schema of the scoring stages
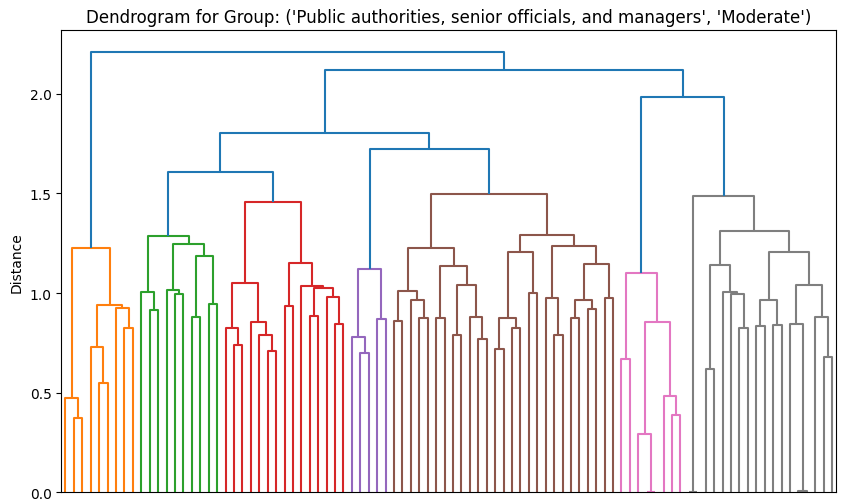
First, we cluster the tasks into four fixed intervals, based on the distribution of the mean scores from the survey.10 We then use hierarchical clustering to group similar tasks within those clusters based on their semantic content. First, we assign embeddings to each task description using the text-embedding-ada-002 model from OpenAI. Next, for each subgroup – defined by the combination of an occupational group at ISCO-08 1-digit level and a particular survey score cluster – we perform Ward’s hierarchical clustering.11 We generate a dendrogram for each subgroup, plotting the tasks along the horizontal axis and the linkage distances (or “heights”) along the vertical axis. Clusters are then formed by “cutting” the dendrogram at a chosen linkage height, such that every branch below this cut line becomes its own cluster (Figure 12).
In our approach, we select the height threshold manually for each subgroup through visual inspection of the dendrogram. This allows us to flexibly accommodate heterogeneity among subgroup’s tasks, so as to ensure that each final cluster contains tasks that are genuinely similar in content. Once the distance threshold is determined, all tasks in the subgroup are assigned to a unique cluster. The process is repeated for each occupation–score-cluster combination. Although our visual inspection introduces an element of subjective judgment, it ensures that spurious or extremely fine-grained splits are avoided, helping to maintain coherent groupings of tasks for the subsequent expert review.
Figure 12. Example of a dendogram used for the review of tasks’ semantic clustering
Once each task had been assigned to a cluster, based on its 1-digit occupational group, scoring bracket from the survey and the semantic similarity of tasks, we generate the final sample of tasks for expert review. To ensure coverage across all clusters while limiting the total burden on experts, we applied a scaling factor (set to 20%) to determine the approximate fraction of tasks to sample from each group.12 We then enforced a minimum of one task per cluster (to avoid excluding smaller clusters entirely) and a maximum of five tasks per cluster to keep the workload manageable. Through this procedure, we achieve a balanced, yet compact, sample that captures semantic diversity while preventing over-sampling from any single cluster. We retain the cluster assignment for each task, so that the expert review can be subsequently looped back into adjustments of the scores in the cluster that the sampled task originated from.
Each of the selected 608 tasks was then presented to a panel of experts. For each task, the experts were shown (i) the occupation and cluster information, (ii) the average survey score (rescaled to 0–1), and (iii) the full task description. If they agreed with the survey score, they left it unchanged; otherwise, they entered a revised expert score (0–1).
In many cases, the differences between the survey and expert scores are non-trivial. They also vary significantly across occupational groups, revealing distinct patterns based on the nature of pertaining tasks (Figure 13). In occupations dominated by manual and physical tasks, such as Craft and Related Trades Workers, Plant and Machine Operators, and Farmers, Gardeners, Foresters, and Fishers, experts consistently assigned lower scores compared to the survey respondents, reflecting the practical limitations of automating tasks that require physical manipulation or manual dexterity. In contrast, occupations involving more cognitive or knowledge-intensive tasks, such as Clerical Support Workers and Professionals, show a much more mixed picture. While some tasks in these groups received lower scores, many others were revised upwards by the expert group, reflecting the greater adaptability of generative AI for structured, data-driven, or communication-focused tasks. For example, Clerical Support Workers display a combination of increases and decreases, suggesting nuanced task-specific assessments where automation potential depends heavily on the nature of individual tasks.
Adjustment of survey sub-sample
In the next step, we compared the average of expert scores with the original mean survey scores using two independent AI models as impartial arbiters to propose an adjusted score.13 The models were informed about the sources of the scores in such a way that would prevent them from automatically siding with the expert group: group one was defined as “practical knowledge of the work and types of tasks they were presented, since they worked in the same occupational groups from which we selected tasks they scored”, while the second group was described as “respondents with more theoretical knowledge of technology and labour markets”. Rather than simply averaging the two scores, the models were explicitly instructed to focus their analysis on the task characteristics and the current capabilities of generative AI and required to provide justifications for each adjustment and its relative position to the original scores.
Figure 13. Task-level scores from the survey and experts, compared to AI-arbitrated scores
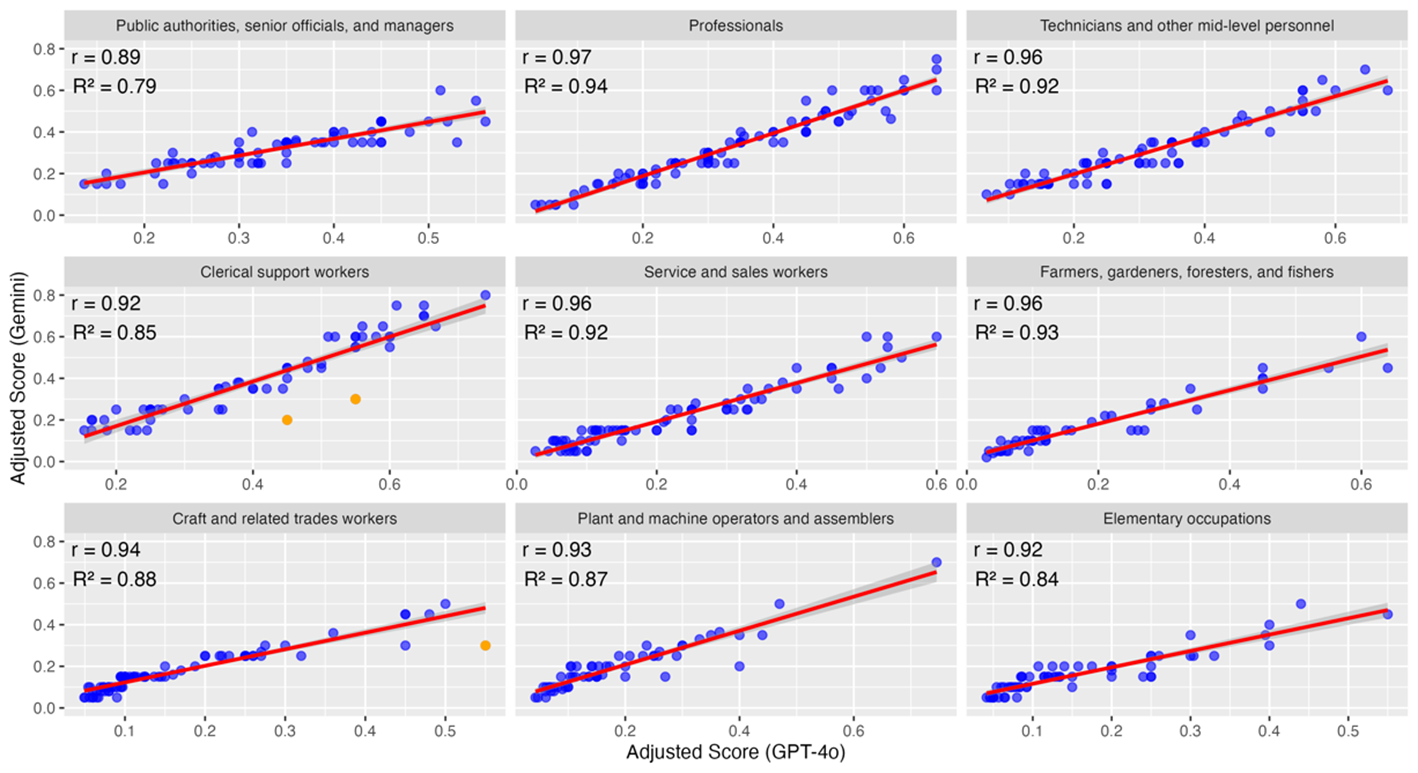
The overall correlation between the adjusted scores produced by the two AI models is 0.96, with correlations within occupational groups exceeding 0.9 in all but one case14 (Figure 14). This high level of agreement demonstrates that, when provided with sufficient background knowledge in the form of reference ranges of scores, the models converge on remarkably similar predictions. Notably, only three tasks exhibited an absolute difference in scores exceeding 0.2 (orange dots in Figure 13). In these cases, GPT-4o tended to adopt a more optimistic perspective on the feasibility of automation, whereas Gemini emphasized the importance of human judgment as a critical factor.
Figure 14. Comparison of Adjusted Scores: GPT-4o vs Gemini by Occupational Group
For the final adjustment, we averaged the scores of the two arbitrating models and manually reviewed the justifications, without observing any significant inconsistencies. Table 4 illustrates the result of the adjustment process through examples of tasks where expert scores were significantly higher or lower than the survey averages, with the final adjusted score and GPT-4o justification. For tasks such as “operating injection molding machines” or “performing mechanical processing of silicon”, experts highlighted the limitations of generative AI in handling physical and manual components, leading to significantly reduced adjusted scores compared to the survey. Conversely, for tasks like “maintaining documentation of classes with children” or “performing financial estimates for household budgets”, the experts recognized the structured and analytical nature of these tasks, which generative AI can assist with to a substantial degree.
Table 4. Sample of adjustments and justifications between the survey and expert scores (examples of largest upward and downward revisions)
|
Task |
Survey |
Experts |
Adjusted |
Justification |
|---|---|---|---|---|
|
Applying various welding methods and using different types of welding machines and equipment, in accordance with training or qualifications. |
0.43 |
0.05 |
0.05 |
The task involves hands-on physical work requiring skill and precision, such as welding using various machines, which is not currently automatable by generative AI technologies like ChatGPT. These technologies excel in tasks involving data processing, language understanding, and information generation but do not possess capabilities for physical task execution, hence aligning closer with the revised score. |
|
Conducting a card game - checking the condition of cards used for the game in terms of marking, degree of wear and quantity, verifying the correctness of bets, shuffling, dealing and revealing cards, announcing the sum of cards, making payouts according to the rates established in the game rules. |
0.55 |
0.19 |
0.25 |
While generative AI can assist with understanding game rules, verifying bets, and conducting some aspects of digital card games, the physical handling of cards, checking their conditions, and ensuring fairness in shuffling and dealing still require a human touch. The theoretical group's lower score reflects the challenge of applying AI to specific physical and interactive elements of the task. Therefore, the lower revised score is more reflective of the practical limitations in automating such work. |
|
Installing and initiating mechanical and electrical robots and peripheral equipment at new workstations |
0.55 |
0.19 |
0.25 |
Installing and initiating mechanical and electrical robots and peripheral equipment at new workstations requires hands-on skills, precise calibration, and the ability to interact with physical hardware. While generative AI can assist with planning, documentation, and troubleshooting guides, the physical installation and configuration still require human expertise. Therefore, the lower score of 0.1925 is more reflective of reality, though slightly adjusted upward to 0.25 to acknowledge AI's support role in providing information or instructions during the task. |
|
Organizing thematic activities (recreational, sports, entertainment) for different age groups |
0.16 |
0.38 |
0.3 |
While generative AI can suggest ideas and develop thematic activities based on input parameters, organizing such activities requires an understanding of group dynamics, spontaneous decision-making, and the ability to adjust plans based on participant interactions and preferences. AI can assist in planning and offering content ideas, but human oversight remains necessary to ensure engagement and safety, especially when catering to varied age groups. Therefore, a score of 0.3 reflects AI's supportive role rather than full automation capability in this task. |
|
Performing financial estimates to develop a household budget |
0.37 |
0.64 |
0.64 |
The task of performing financial estimates to develop a household budget can be significantly automated with generative AI tools like ChatGPT due to the structured and data-driven nature of budget calculations. GenAI can generate budget templates, provide financial advice based on data inputs, and simulate different financial scenarios, which aligns closely with the theoretical group's higher score of 0.64, indicating strong potential for automation with AI's current capabilities. |
|
Maintaining documentation of classes conducted with children. |
0.16 |
0.43 |
0.3 |
Generative AI can assist in maintaining documentation by generating templates, formatting, and summarizing information, which supports automation of routine documentation tasks. However, nuances in class content, individual student progress, and teacher observations require human oversight, limiting full automation potential. My score aligns closer to the higher revised score, acknowledging GenAI's capabilities while recognizing the need for human involvement. |
Adjustment of all survey scores
After adjusting the 608 tasks for which we had both survey scores and expert evaluations, we proceeded to predict adjustments for the remaining 2,253 tasks (2,861 minus 608) scored in the initial survey. Each of these tasks is linked to a reference cluster and semantically similar tasks that were reviewed and adjusted in the earlier steps (see Sections 5 and 6). To ensure consistency, the AI models were provided with the context of already adjusted scores from semantically similar tasks within the same occupational group and scoring bracket. Following the methodology outlined in Section 6, we utilized two independent AI models to generate predictions, achieving a correlation coefficient of 0.95 across all data points. The final predicted scores were determined as the mean of the two model outputs.
Figure 15. Survey scores, expert evaluation and final adjustments for 2,861 tasks in the main survey
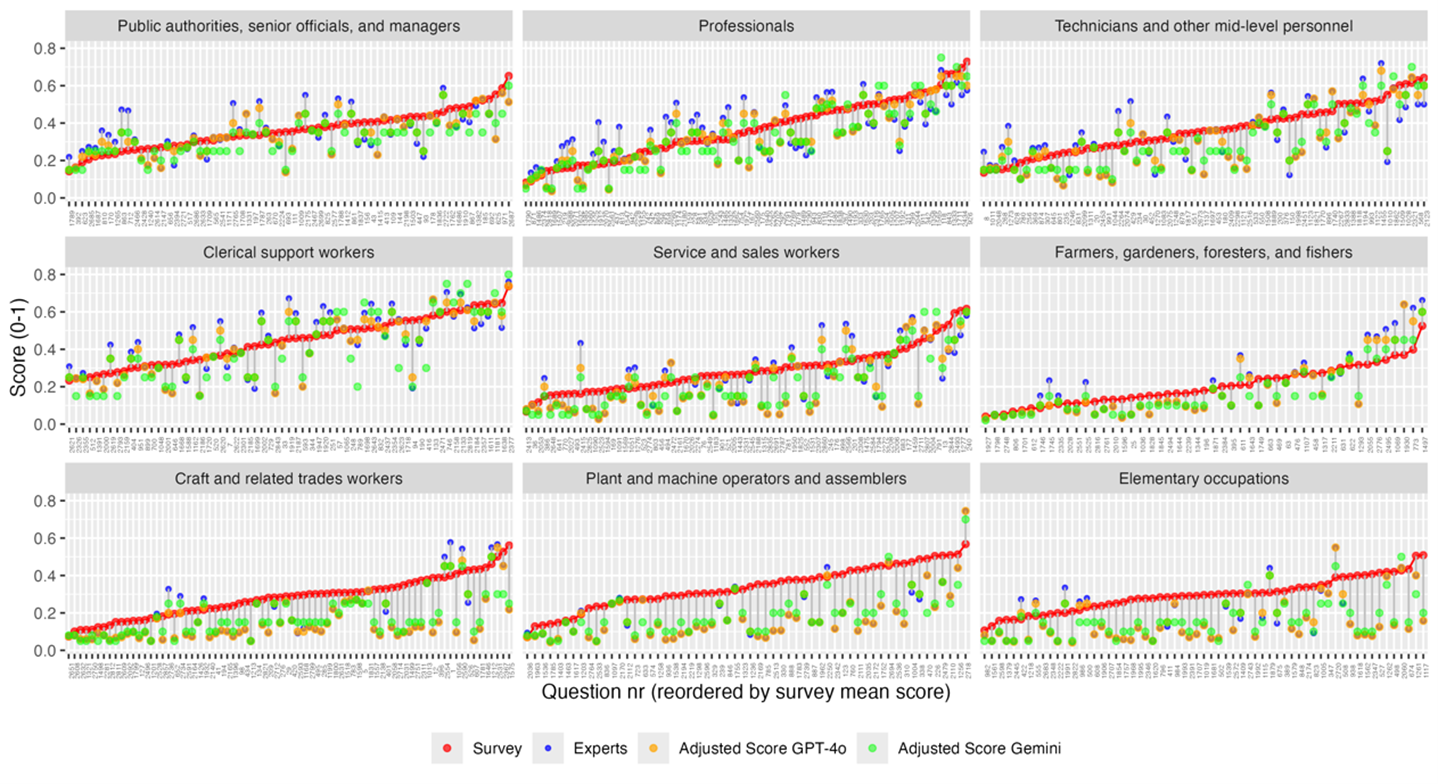
Figure 15 shows all 2,861 tasks scored in the main survey, arranged on the horizontal axis in ascending order of their initial survey scores. Each panel represents a different occupational group. Red points indicate the mean scores derived from survey responses, while purple diamonds represent expert evaluations for tasks where such scores were available. Orange squares show the final adjusted scores, based on the AI-driven reconciliation of survey and expert evaluations for tasks with both inputs, and green triangles represent AI-based predictions for tasks without expert scores, using reference scores from the corresponding cluster as context. The blue lines illustrate the overall trend among the final scores (a mix of adjusted and predicted scores), with a notable lowering of scores for more manual tasks.
Prediction of synthetic task-level scores for all ISCO-08 and 6-digit occupations
As the final step, we use the adjusted survey scores for 2,861 tasks to develop an AI assistant capable of predicting synthetic scores for new tasks across various classification systems. This combines the strengths of human expertise with generative AI’s ability to generate consistent, large-scale responses based on precise instructions.
Text Box 3. The conceptual structure of the LLM prompt (Python code for GPT-4o)
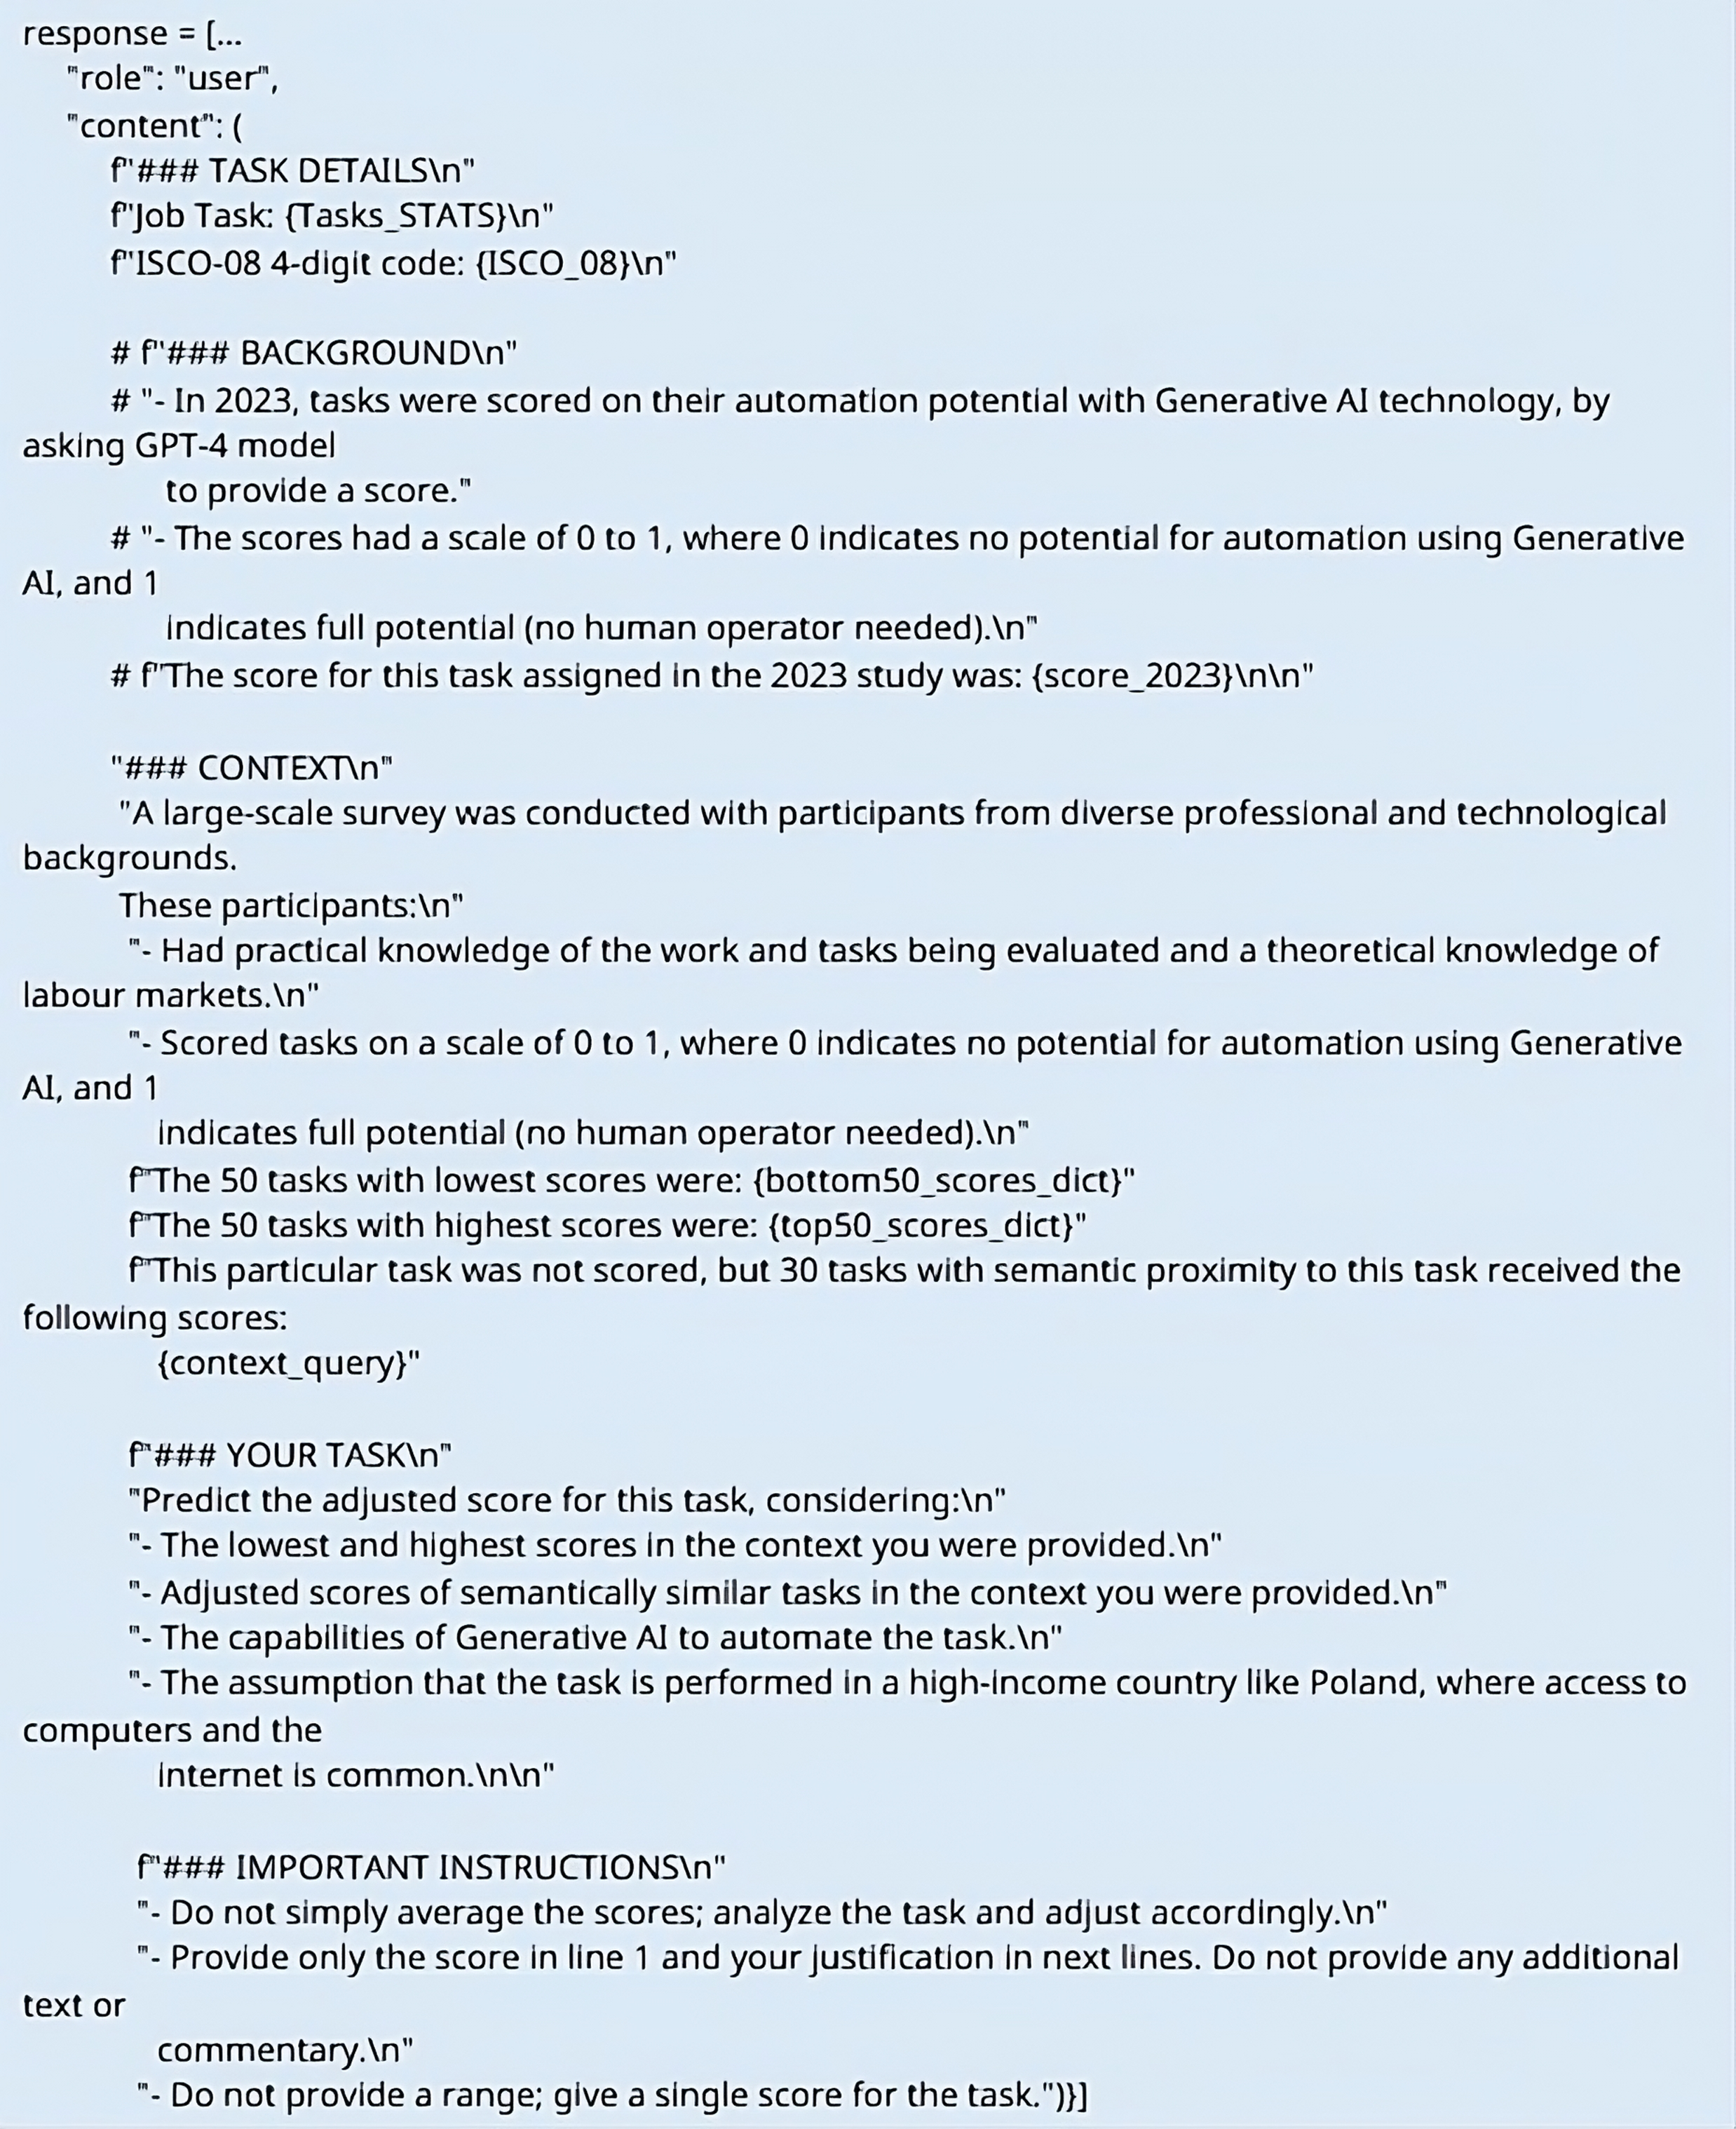
To develop our predictive model, we evaluated two approaches: (i) fine-tuning a large language model (LLM) with the 2,861-task dataset or (ii) designing an advanced prompting strategy (prompt engineering). Fine-tuning, while promising for learning domain-specific patterns, is resource-intensive and limited by our relatively small dataset.15 In contrast, by using a sufficiently large set of example tasks within the prompt, we can provide the model with explicit “demonstrations” of scoring of similar tasks in our main dataset. To ensure a balanced approach, we provide each prompt with a sample of tasks with the highest 50 and lowest 50 scores, alongside the scores of 30 tasks with greatest semantic similarity to the tasks that the model is requested to score. To create the semantic context, we construct a rapid-search vector database with all 2,861 adjusted scores. The database is queried at the start of each API call and extracts tasks with semantic similarity to the task that is being scored. Once the 30 most similar tasks have been retrieved, a set of complete instructions is passed to the model’s API, as per the general prompt strategy illustrated in Box 3.
We first validate the predictive model using a sample of tasks from the survey that were adjusted as per sections 5-7, but not included in the semantic context provided to the model.16 Once the prompt adjustments deliver satisfactory performance, we use the same system to predict automation scores for 3,265 tasks in ISCO-08 (as in Gmyrek et al., 2023).17 This approach bridges expert-validated human assessments with the scalability of LLM-based predictions, enabling consistent and extensible scoring for tasks across classification systems.
For a further refinement of our scoring system, we filter 364 tasks where the scoring in 2025 changed by more than 25% of the absolute value of 2023 score. We review these tasks manually, using an expert consensus-building method. First, we conduct a mini survey among co-authors, in which each respondent is asked to arbitrate between the diverging scores. For 64 ISCO-08 tasks, where we still observe a divergence of expert opinions, we conduct a detailed group discussion, in order to reach consensus and agree on a justification.
Following the final manual verification process, we establish a second knowledge repository, also stored in a vector database. The main LLM prompt is then updated to incorporate this additional reference by conducting two sequential semantic context retrievals for each prediction, further improving the model’s precision in predicting scores for new tasks. Using this approach, we generate predictions for all 29,753 tasks in the Polish classification system (Table 1).
To compare these 6-digit predictions with 4-digit ISCO-08 classifications, we calculate (i) the mean of all task scores aggregated at the 4-digit level and (ii) occupational means at the 6-digit level, subsequently deriving the 4-digit mean from these 6-digit components. In both cases, the correlation between predictions based on ISCO-08 tasks and Polish 6-digit tasks is 0.92, demonstrating exceptional stability of predictions. In other words, while one might question the exact scores assigned to tasks in our knowledge repository – a challenge not unique to our study – once the repository and prompting techniques are in place, the model consistently produces stable predictions based on reference tasks and their scores, and irrespective of the occupational classification system. This approach offers promising possibilities for replication across other occupational classifications, which we intend to explore further. For the remainder of this paper, we focus primarily on revising ISCO-08 scores, leaving a detailed analysis of Poland’s 6-digit occupations for a separate study (Gmyrek et al., forthcoming, 2025).
Adjusted Global Index of GenAI Exposure
To classify ISCO-08 occupations into varying levels of exposure to Generative AI (GenAI), we update the framework introduced in Gmyrek et al. (2023). Similarly to the original approach, we rely on two moments of distribution: occupational mean and standard deviation (SD) of task-level scores pertaining to a given 4-digit occupation. However, instead of using automation and augmentation potential as two extreme categories with the "big unknown" in between, we now adopt a more nuanced classification scheme that represents a spectrum of exposure, with occupations considered as exposed classified into four increasing gradients (Figure 16 and Table 5).
Figure 16. AI Exposure Gradients: ISCO-08 4-digit level occupations
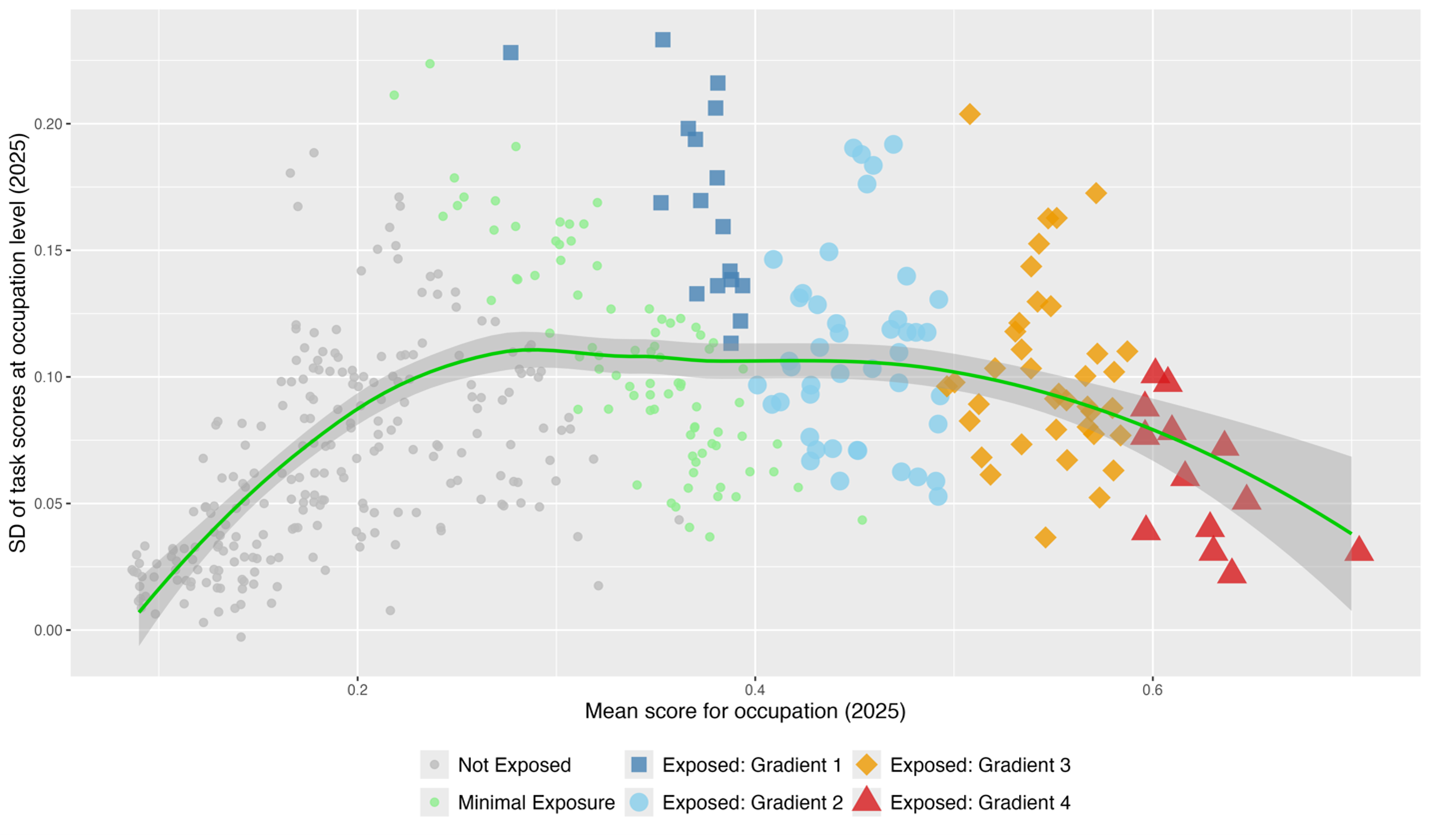
Note: Figure 16 presents all ISCO-08 4-digit occupations classified into GenAI exposure categories as per the criteria in Table 5. A detailed list of occupation-level means and SDs is available in the Appendix, Table A1. In addition, task-level scores within the overall hierarchy of ISCO-08 are available here: https://pgmyrek.github.io/2025_GenAI_scores_ISCO08/
Gradient 1 represents occupations with low overall GenAI exposure but significant variability across tasks (Low exposure, high task variability). While some tasks within these roles may have high automation potential, the occupation has many tasks that continue requiring human roles, aligning closely with the notion of augmentation in the old framework. Gradient 2 includes occupations with moderate GenAI exposure and a mix of highly exposed and minimally exposed tasks, resulting in uneven impacts where some tasks may be disrupted while others remain unaffected (Moderate exposure, high task variability). Gradient 3 captures occupations where a significant portion of tasks are consistently exposed to GenAI, signaling growing automation risks and requiring adaptation strategies for workers (Significant exposure, high task variability). Gradient 4 highlights occupations with the highest share of tasks exposed to potential GenAI-driven automation, and with a high consistency of this exposure across tasks (Highest exposure, low task variability). This gradient aligns closely with the notion of automation risk in our earlier classification system
Table 5. GenAI Exposure Gradients: Definition and Interpretation
|
GenAI Exposure |
Definition (Mean & SD of Task Scores) |
Interpretation |
|---|---|---|
|
Exposed: Gradient 4 (Highest exposure, low task variability) |
μ ≥ 0.6 and μ - σ >= 0.5 |
High and consistent GenAI exposure across tasks within the occupation. Most current tasks in these jobs have a high potential of automation, with little variability in task-level exposure. |
|
Exposed: Gradient 3 (Significant exposure, high task variability) |
0.5 ≤ μ < 0.6 and μ + σ ≥ 0.5 |
Above-moderate occupational exposure: even though some tasks remain less exposed, the overall potential of automation of the current tasks with GenAI is growing in these occupations. |
|
Exposed: Gradient 2 (Moderate exposure, high task variability) |
0.4 ≤ μ < 0.5 and μ + σ ≥ 0.5 |
Moderate occupational AI exposure, with high task-level variability. These occupations include a mix of some tasks that are exposed to GenAI and others not at risk, making the impact uneven. |
|
Exposed: Gradient 1 (Low exposure, high task variability) |
μ < 0.4 and μ + σ ≥ 0.5 |
Low overall GenAI exposure at the occupational level, but high variability across tasks. Some tasks within these occupations have an elevated automation potential, even if the occupation as a whole remains strongly reliant on tasks that have a low potential of automation. |
|
Minimal Exposure (Low exposure, moderate task variability) |
μ < 0.5 and μ + σ > 0.4 |
Occupations with low GenAI exposure, where some tasks show moderate automation potential, but overall occupational exposure remains limited. |
|
Not Exposed |
Occupations that don’t meet any of the above conditions. |
Occupations where most tasks remain relatively unaffected by GenAI, with low task variability and a stable low mean exposure score. |
This revised framework addresses some limitations of the earlier categorization system, particularly the interpretative challenges posed by the category, “the big unknown". By expanding the exposure categories into a continuous gradient, the updated framework improves the readability and interpretability of results and enables us to stack employment estimates into the overall category of exposed occupations (Figure 17 in Section 10).18 It also captures in a more nuanced way how GenAI can impact occupations at varying levels of exposure, based on task-level variability and overall occupational risks. Furthermore, the framework's flexibility enhances its applicability to country-specific contexts, allowing policymakers to better understand the distribution of GenAI's potential impact and prioritize interventions for the most affected groups in the national contexts.
We stress that these classifications merely suggest the general trends and types of occupations at different levels of exposure, since any type of task scoring system carries a degree of subjectivity. While the abilities of GenAI and its derivative technologies evolve rapidly, many additional local factors, not covered in this global study, can either speed up and expand, or limit the impact of these technologies on specific occupations. The advantage of this more detailed categorization of occupations into four progressive gradients is that it will allow for tracking the movement of occupations over time, and for occupational-level comparisons across national classification systems with varying collections of tasks.19
Changes to occupational classifications
Our 2025 task-level scores are broadly consistent with those of the ILO 2023 study
Figure 17. AI Exposure: Comparison of 2025 with 2023, ISCO -08 4-digit level occupations
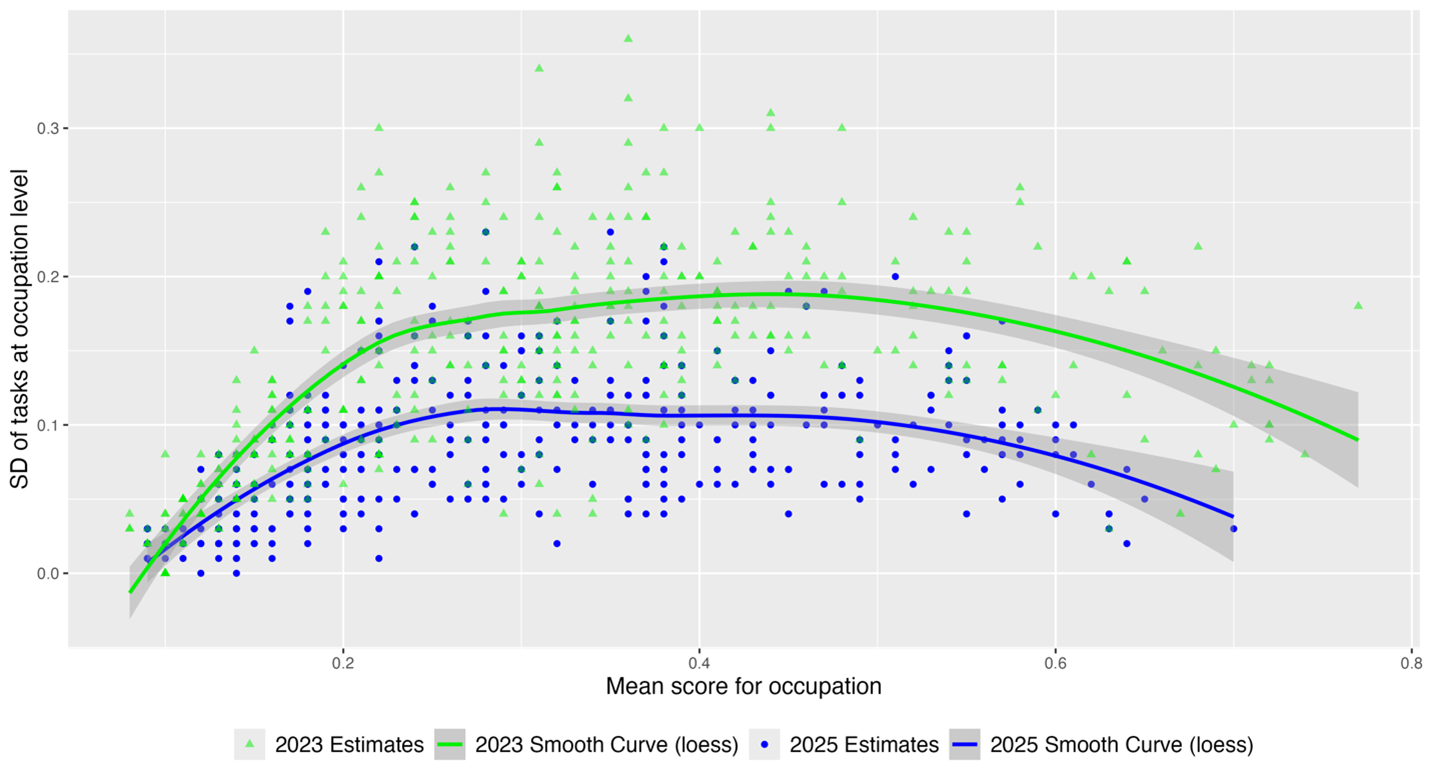
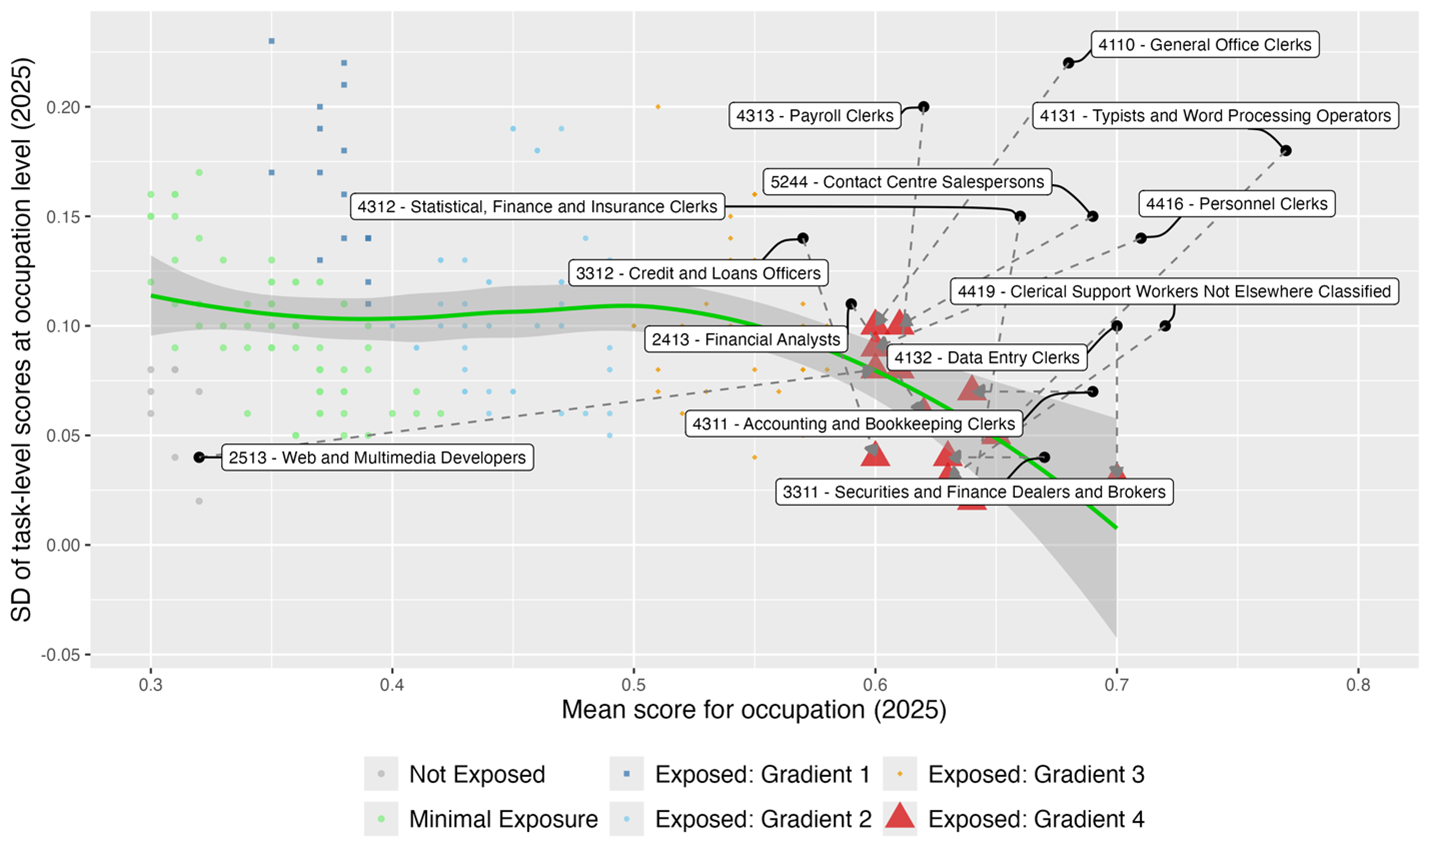
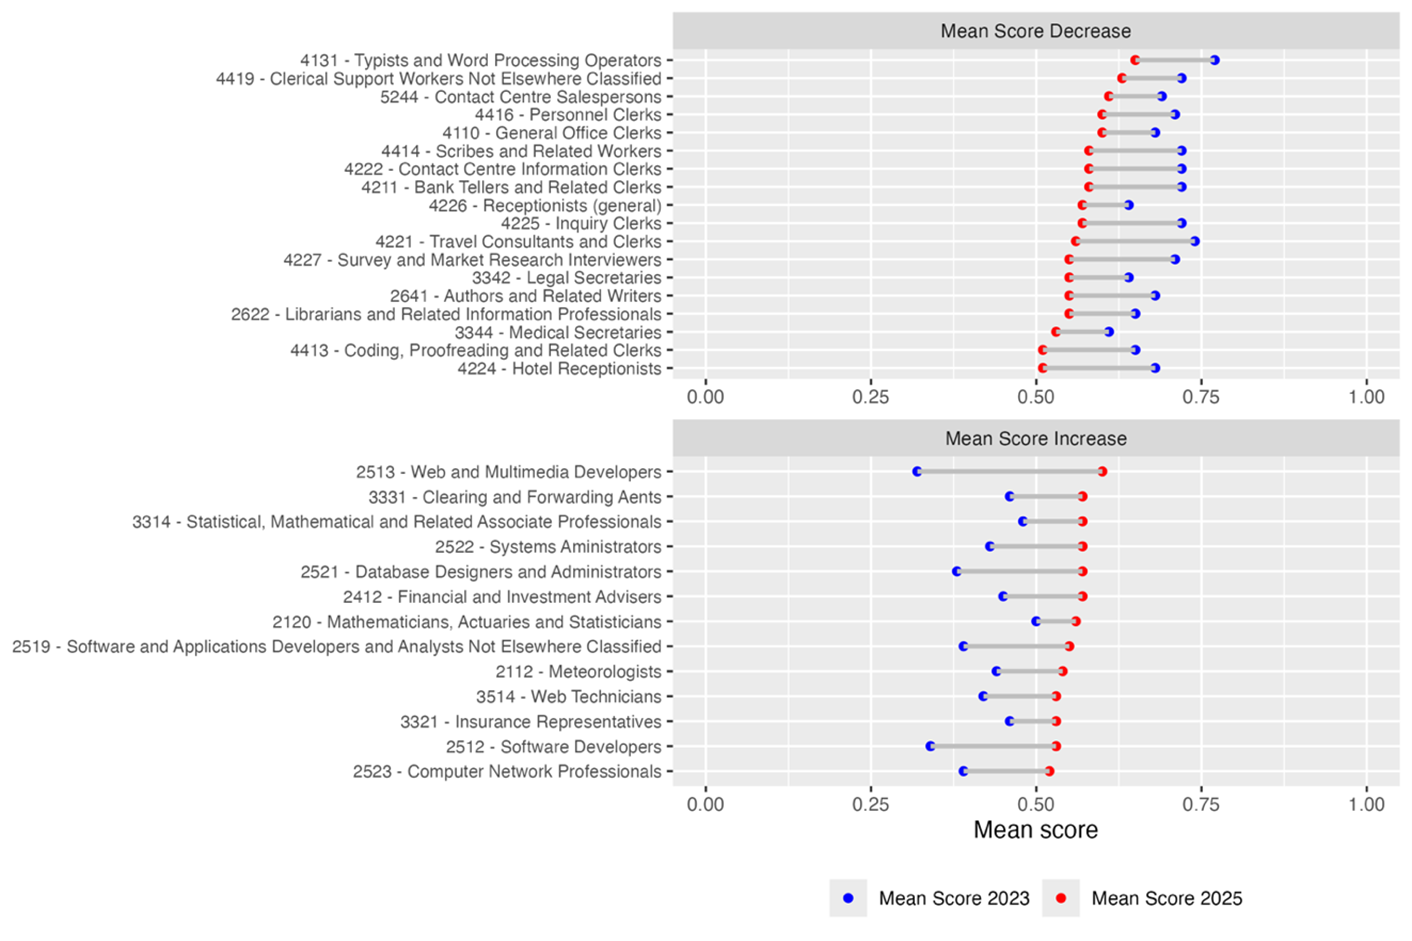
Similar to our 2023 study, clerical occupations exhibit the highest levels of exposure, though with a decline in their mean scores due to a reassessment of certain task-level evaluations (Figures 18 & 19). This decrease highlights the distinction between the theoretical automation potential of a task and the practical insights gained from two years of experimentation with GenAI tools. While tasks such as taking meeting notes or scheduling appointments can significantly benefit from GenAI support, our 2023 scores for such tasks, which reached 0.9 in some cases, reflected an overly optimistic assessment of full automation potential. In reality, many of these tasks still require substantial human effort. Despite the decline in overall mean scores for these occupations, many still fall within the highest exposure gradient (Level 4), since the final classification does not depend solely on the mean score but is determined through a simultaneous assessment of each occupation’s mean and the dispersion of corresponding task-level scores (SD, see Figure 16 and Table 5). Among the 13 occupations classified in gradient 4, the majority represent clerical roles, including data entry clerks, typists and word processing operators, accounting and bookkeeping clerks, and general office clerks.
Figure 18. Changes to occupational exposure between 2023 and 2025 within Gradient 4
On the other hand, several highly digitized occupations have seen an increase in their mean scores. This applies, for example, to web and media developers, statistical and database specialists, as well as financial and software-related occupations (Figure 17). A key factor behind this shift is the rapid expansion of AI capabilities since our previous study in 2023. At that time, large language models (LLMs) were primarily viewed as advanced text generators. Since then, they have acquired multimodal abilities, allowing them to process and generate not only text but also images, audio, and video. Additionally, these models have been gaining some agentic capabilities, allowing them to execute multi-step tasks autonomously, interact with software environments, and make decisions based on contextual inputs. These advancements significantly broaden the scope of tasks that can be at least partially automated using GenAI, with software development and multimedia sectors among some of the leading adopters.
While many of these occupations fall within gradient 3 and 4, one must consider that these roles are deeply intertwined with digital technologies, and indeed, many of these occupations have emerged as a result of technological advancements. The scores reflect the high potential of automation among their current tasks, but these occupations also possess a strong capacity to evolve and develop new tasks through innovative application of GenAI and related digital tools. In previous technological transitions, this type of adaptation was exemplified by the well-known case of bank tellers following the diffusion of automatic teller machines (ATMs) in the 1990s
Figure 19. 4-digit level occupations (ISCO-08) with largest changes in mean scores between 2023 and 2024
Revised global employment estimates
Having established a comprehensive list of 4-digit occupations with corresponding GenAI exposure scores (Appendix A, Table A1), we focus on the 112 occupations identified as exposed and estimate the share of employment that these occupations represent at the global, regional, and income-based levels. We apply the same method as in
Figure 20. Global estimates of occupations potentially exposed to GenAI (% of employment by sex)
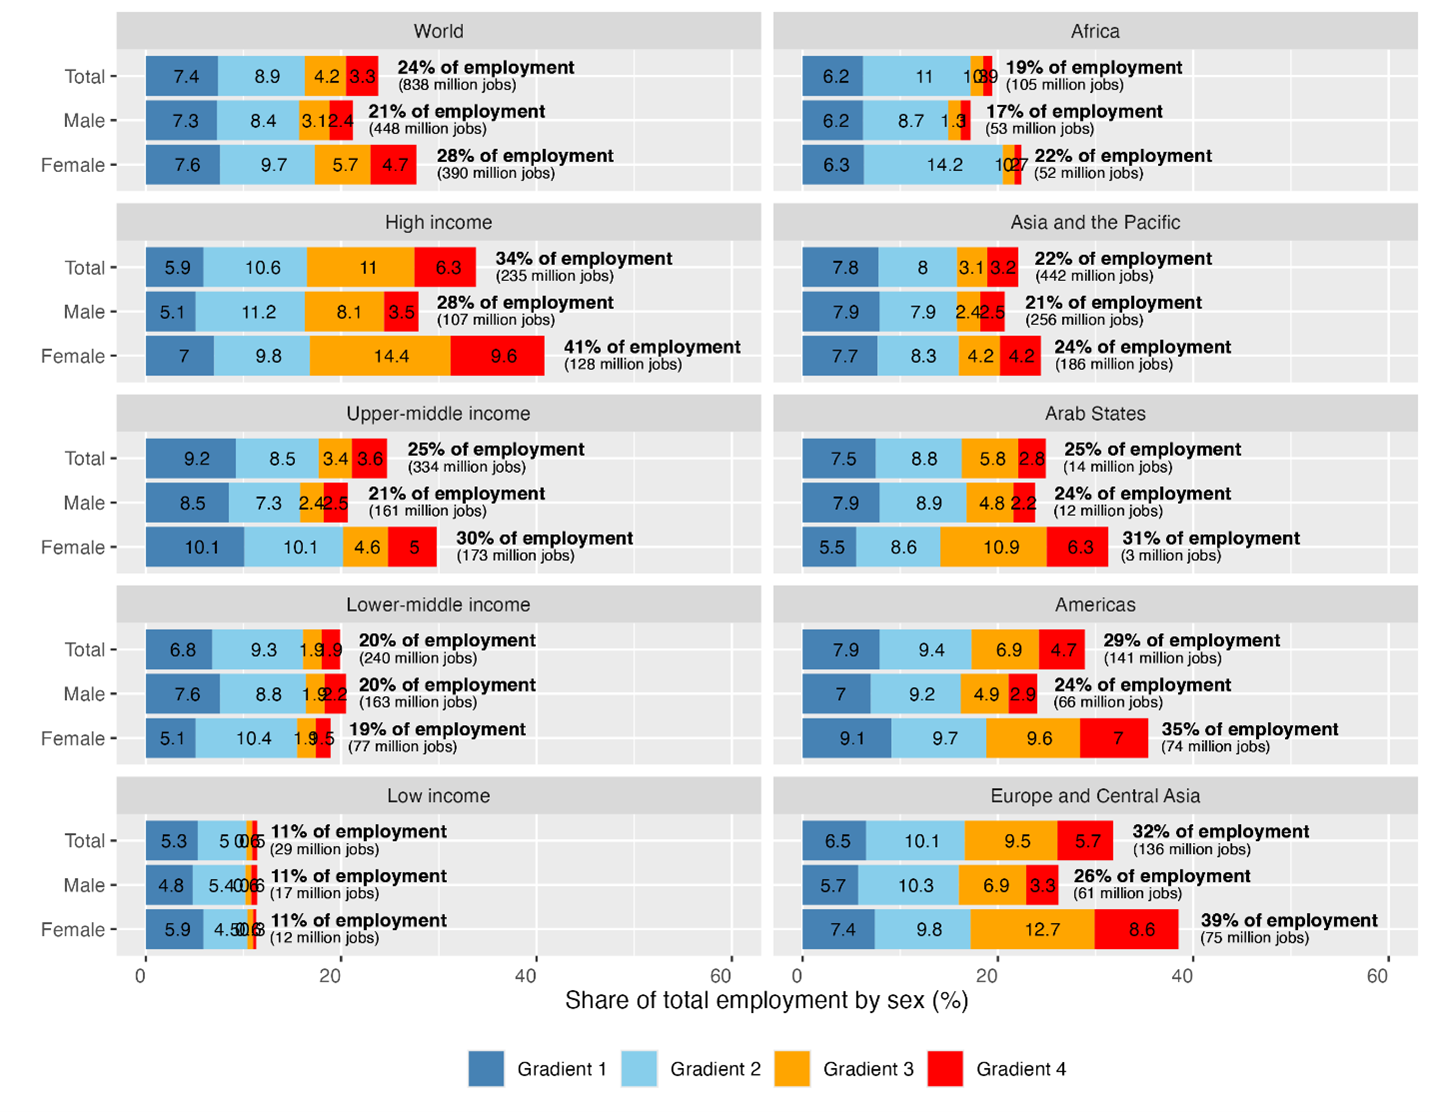
At the global level, about a quarter of all employment falls into one of the four exposure gradients, with significant differences between female and male employment, particularly in the top two exposure gradients (Figure 18). Among male workers, approximately one-fifth of jobs fall within one of the exposure gradients, with 3.1% in gradient 3 and 2.4% in the highest exposure gradient (gradient 4). In contrast, not only is the total share of female employment in potentially exposed occupations notably higher, but the difference is also concentrated in the top two gradients, with 5.7% of female employment in gradient 3 and another 4.7% in gradient 4. These disparities are even more pronounced in High-Income Countries, where 34% of total employment falls within one of the four exposure gradients, with 17.3% in gradients 3 and 4. However, when disaggregated by gender, 28% of male employment is exposed, with only 3.5% in gradient 4, compared to 41% of female employment, with 14.4% in gradient 3 and 9.6% in gradient 4.
Income-based differences in exposure are striking, with High-Income Countries showing the highest share of employment in one of the four exposure gradients (34%). The total share of exposed employment declines significantly as income levels decrease, reaching just 11% in Low-Income Countries (LICs). Lower income levels also reduce gender disparities in exposure, primarily due to the lower concentration of occupations in the highest exposure gradients (gradients 3 and 4). Gender disparities are also more pronounced in wealthier regions, particularly in Europe and Central Asia, where 39% of female employment falls into one of the four exposure gradients compared to 26% for men. These patterns reflect both occupational structures and the extent to which GenAI-exposed roles, such as clerical, financial, and customer service jobs, are concentrated in higher-income countries.
These new estimates are consistent with those given in 2023, but more refined. The previous version attributed 2.3% of global employment to the “automation” category, one percentage point lower than the 3.3% assigned to gradient 4. In addition, the 2023 estimate attributed 13% of employment as subject to “augmentation” and an additional 16.2% of employment in “the big unknown”. The combined employment share for Gradients 1-3 for the world in the current analysis is 20.5%, 9 percentage points lower than combined shares of augmentation and “the big unknown” (29.2%) reported in 2023. The 2023 findings that women are more affected than men, and that the percentage of employment affected increases as countries’ income level increases, still hold.
It is important to stress that these new estimates reflect “exposure” to GenAI and not the actual impact on employment. As in 2023, the 2025 estimates represent the upper threshold of the percentage of employment that could be affected if GenAI technology were fully implemented. Infrastructure constraints (electricity, broadband), insufficient digital skills, the cost of technology, and inherent operational difficulties associated with the technology are just some of the barriers to full adoption. An important aspect also concerns the institutional and societal acceptance of automating tasks and occupations – even when technically feasible. For instance, few consumers may be inclined to watch evening news presented by avatars. Similarly, financial institutions might hesitate to fully delegate decisions such as mortgage approvals or business plan evaluations to AI systems, preferring to retain human judgement, oversight and accountability.
Indeed, the results indicate that few jobs consist of tasks that are fully automatable with current GenAI technology; nearly all occupations have some tasks that require human input. Gradients 1-3 comprise occupations where the automation of specific tasks is limited, and some degree of task variability exists. As such, the “bundle of tasks” that constitutes occupations acts as a buffer against full automation. However, this does not mean that demand for these occupations will remain stable, as the efficiencies gained from introducing technology may mean that fewer workers are needed. If efforts are not made to help such jobs evolve with GenAI and integrate new tasks, even partial automation of existing tasks could lead to a decline in overall job demand in occupations found in higher exposure gradients. In addition, in some cases, the remaining set of non-automated tasks may result in jobs that are no longer humanly sustainable or desirable, thereby limiting the feasibility of adopting imbalanced technological solutions
Finally, the estimates do not account for new jobs that may be created, nor the technological advances that could potentially automate more tasks in the future. In that sense, our estimates present a static snapshot of the exposure of existing occupations to GenAI at the start of 2025.
Conclusion
In this paper, we have presented the methodology used to develop a new global index of occupational exposure to GenAI, as well as new estimates of the global effects on employment. We build on the approach developed by the ILO in 2023, but with several notable refinements. First, by beginning our analysis with the Polish 6-digit occupational structure, we expand by ten-fold the amount of detailed task information available for the analysis of task automation. In addition, using a representative sample from the 29,753 tasks in the Polish occupational classification system and a survey of 1,640 people in Poland, we captured the opinions of each 1-digit ISCO-08 group on the potential for task automation in the job categories in which they are currently employed (52,558 data points). We then compared this input with an expert survey and conducted subsequent rounds of revisions among a smaller international expert group for the tasks with the highest degree of disagreement. Based on this process, we built a repository of knowledge with adjusted task scores that goes beyond Poland’s national specificities and reflects a broader consensus on the task automation potential of current GenAI tools.
We subsequently used this repository to develop an AI assistant that could predict scores for these tasks based on this additional information as well as the technical documentation of ISCO-08. These scores update the original set of scores produced by the ILO in 2023
The new global index presented in this paper is generic, due to the nature of ISCO-08 and the structure of tasks associated with occupations in this framework. Its definite strength – similar to ISCO-08 – is that it provides a common global denominator and a direct link to national labour forces surveys held in the ILO harmonized micro data repository, which relies on the same classification of occupational structures. Even though all countries do not use ISCO-08, mappings of the national systems to this common international standard are available. This eliminates the need for crosswalks from other national systems (e.g. O*NET), which involves tenuous assumptions about the similarity of detailed occupations in the technologically advanced context of the USA to other countries, especially non-HICs. The simple and comparable character of our ISCO-08 based index enables direct production of global, regional and income-based employment estimates, based on the same statistical modelling techniques that are used by the ILO for other global figures (see Section 11).
Our 2025 scores are presented in a revised occupational classification system, adopting a framework of four progressively increasing exposure gradients, that better highlights the importance of potential AI exposure and task variability for determining possible outcomes. We produced a new set of global estimates of GenAI exposure based on this revised classification.
The new index maintains many of the headline findings of the 2023 methodology. Clerical occupations continue to have the highest exposure levels, albeit with some important downward revisions to individual tasks scores. Such occupations include data entry clerks, typists, accounting, bookkeeping clerks and administrative secretaries. Additionally, some occupations – such as financial analysts, and web and multimedia developers (gradient 4), as well as bank tellers, translators, applications programmers, investment advisers (gradient 3) – have increased their levels of exposure, highlighting the expanding abilities of GenAI technology to potentially automate more specialized tasks in professional and technical roles.
Overall, the revised global employment estimates of GenAI exposure are lower than in our 2023 paper, though still, one in four jobs globally (24%) has some degree of exposure, and one in three jobs in high-income countries. What is particularly striking is the continued association of gender with occupations with higher levels of exposure, especially in higher-income countries. Compared to 7.8% of female employment and 2.9% of male employment in high-income countries classified as having high automation potential in 2023, the current study increases these figures to 9.6% for females and 3.5% for males, respectively.
Notwithstanding these findings, we stress that such exposure does not imply the immediate automation of an entire occupation, but rather the potential for a large share of its current tasks to be performed using this technology. Whether this leads to the disappearance of an occupation or workforce replacement is a more complex question – one that will depend on the initial decision to adopt the technology, but also the extent to which individuals in these occupations are given opportunities to learn to work with these technologies and adapt to the evolving nature of their tasks. As argued by numerous economists, the key to unlocking the productivity benefits of GenAI lies not in the search of outright labour savings, but in the extent to which human expertise can be complemented with new technological capacities to reshape occupations and generate additional value-added
Ensuring such positive synergies necessitates an approach to technology’s adoption at the workplace that is human-centered. With one in four workers across the world in an occupation with some degree of GenAI exposure, there is need to ensure that the transition is managed through social dialogue, both to minimize “technological unemployment” and the hardship associated with it, but also to ensure that for the majority who remain employed, the technology is implemented in a way that that supports them in carrying out their jobs. Workers know their jobs best and can play an important role in the design, adaptation and use of the technology at the workplace, to the benefit of both working conditions and productivity.
Annex
1. Exposure by 4-digit ISCO-08 occupation
Table A1. ISCO-08 occupations by exposure gradient
|
Exposure |
4-digit code |
Occupation Name |
Mean |
SD |
|---|---|---|---|---|
|
Gradient 4 |
4132 |
Data Entry Clerks |
0.7 |
0.03 |
|
Gradient 4 |
4131 |
Typists and Word Processing Operators |
0.65 |
0.05 |
|
Gradient 4 |
4311 |
Accounting and Bookkeeping Clerks |
0.64 |
0.07 |
|
Gradient 4 |
4312 |
Statistical, Finance and Insurance Clerks |
0.64 |
0.02 |
|
Gradient 4 |
3311 |
Securities and Finance Dealers and Brokers |
0.63 |
0.04 |
|
Gradient 4 |
4419 |
Clerical Support Workers Not Elsewhere Classified |
0.63 |
0.03 |
|
Gradient 4 |
2413 |
Financial Analysts |
0.62 |
0.06 |
|
Gradient 4 |
4313 |
Payroll Clerks |
0.61 |
0.08 |
|
Gradient 4 |
5244 |
Contact Centre Salespersons |
0.61 |
0.1 |
|
Gradient 4 |
2513 |
Web and Multimedia Developers |
0.6 |
0.08 |
|
Gradient 4 |
3312 |
Credit and Loans Officers |
0.6 |
0.04 |
|
Gradient 4 |
4110 |
General Office Clerks |
0.6 |
0.1 |
|
Gradient 4 |
4416 |
Personnel Clerks |
0.6 |
0.09 |
|
Gradient 3 |
2643 |
Translators, Interpreters and Other Linguists |
0.59 |
0.11 |
|
Gradient 3 |
4120 |
Secretaries (general) |
0.58 |
0.1 |
|
Gradient 3 |
4211 |
Bank Tellers and Related Clerks |
0.58 |
0.09 |
|
Gradient 3 |
4222 |
Contact Centre Information Clerks |
0.58 |
0.06 |
|
Gradient 3 |
4414 |
Scribes and Related Workers |
0.58 |
0.08 |
|
Gradient 3 |
2412 |
Financial and Investment Advisers |
0.57 |
0.11 |
|
Gradient 3 |
2514 |
Applications Programmers |
0.57 |
0.08 |
|
Gradient 3 |
2521 |
Database Designers and Administrators |
0.57 |
0.08 |
|
Gradient 3 |
2522 |
Systems Aministrators |
0.57 |
0.05 |
|
Gradient 3 |
3314 |
Statistical, Mathematical and Related Associate Professionals |
0.57 |
0.1 |
|
Gradient 3 |
3331 |
Clearing and Forwarding Aents |
0.57 |
0.09 |
|
Gradient 3 |
4225 |
Inquiry Clerks |
0.57 |
0.09 |
|
Gradient 3 |
4226 |
Receptionists (general) |
0.57 |
0.17 |
|
Gradient 3 |
2120 |
Mathematicians, Actuaries and Statisticians |
0.56 |
0.09 |
|
Gradient 3 |
4221 |
Travel Consultants and Clerks |
0.56 |
0.07 |
|
Gradient 3 |
2431 |
Advertising and Marketing Professionals |
0.55 |
0.09 |
|
Gradient 3 |
2519 |
Software and Applications Developers and Analysts Not Elsewhere Classified |
0.55 |
0.16 |
|
Gradient 3 |
2622 |
Librarians and Related Information Professionals |
0.55 |
0.04 |
|
Gradient 3 |
2631 |
Economists |
0.55 |
0.08 |
|
Gradient 3 |
2641 |
Authors and Related Writers |
0.55 |
0.09 |
|
Gradient 3 |
3342 |
Legal Secretaries |
0.55 |
0.13 |
|
Gradient 3 |
4227 |
Survey and Market Research Interviewers |
0.55 |
0.16 |
|
Gradient 3 |
2112 |
Meteorologists |
0.54 |
0.13 |
|
Gradient 3 |
2642 |
Journalists |
0.54 |
0.1 |
|
Gradient 3 |
3343 |
Administrative and Executive Secretaries |
0.54 |
0.14 |
|
Gradient 3 |
4223 |
Telephone Switchboard Operators |
0.54 |
0.15 |
|
Gradient 3 |
2512 |
Software Developers |
0.53 |
0.07 |
|
Gradient 3 |
3321 |
Insurance Representatives |
0.53 |
0.12 |
|
Gradient 3 |
3344 |
Medical Secretaries |
0.53 |
0.11 |
|
Gradient 3 |
3514 |
Web Technicians |
0.53 |
0.12 |
|
Gradient 3 |
2523 |
Computer Network Professionals |
0.52 |
0.06 |
|
Gradient 3 |
3252 |
Medical Records and Health Information Technicians |
0.52 |
0.1 |
|
Gradient 3 |
2411 |
Accountants |
0.51 |
0.08 |
|
Gradient 3 |
2434 |
Information and Communications Technology Sales Professionals |
0.51 |
0.09 |
|
Gradient 3 |
4224 |
Hotel Receptionists |
0.51 |
0.07 |
|
Gradient 3 |
4413 |
Coding, Proofreading and Related Clerks |
0.51 |
0.2 |
|
Gradient 3 |
2433 |
Technical and Medical Sales Professionals (excluding ICT) |
0.5 |
0.1 |
|
Gradient 3 |
4323 |
Transport Clerks |
0.5 |
0.1 |
|
Gradient 2 |
2166 |
Graphic and Multimedia Designers |
0.49 |
0.09 |
|
Gradient 2 |
2511 |
Systems Analysts |
0.49 |
0.05 |
|
Gradient 2 |
2529 |
Database and Network Professionals Not Elsewhere Classified |
0.49 |
0.06 |
|
Gradient 2 |
3313 |
Accounting Associate Professionals |
0.49 |
0.13 |
|
Gradient 2 |
3322 |
Commercial Sales Representatives |
0.49 |
0.08 |
|
Gradient 2 |
3352 |
Government Tax and Excise Officials |
0.49 |
0.12 |
|
Gradient 2 |
2153 |
Telecommunications Engineers |
0.48 |
0.12 |
|
Gradient 2 |
2632 |
Sociologists, Anthropologists and Related Professionals |
0.48 |
0.12 |
|
Gradient 2 |
3332 |
Conference and Event Planners |
0.48 |
0.14 |
|
Gradient 2 |
4213 |
Pawnbrokers and Money-lenders |
0.48 |
0.06 |
|
Gradient 2 |
1346 |
Financial and Insurance Services Branch managers |
0.47 |
0.12 |
|
Gradient 2 |
2356 |
Information Technology Trainers |
0.47 |
0.1 |
|
Gradient 2 |
2621 |
Archivists and Curators |
0.47 |
0.11 |
|
Gradient 2 |
2633 |
Philosophers, Historians and Political Scientists |
0.47 |
0.06 |
|
Gradient 2 |
2656 |
Announcers on Radio, Television and Other Media |
0.47 |
0.12 |
|
Gradient 2 |
3512 |
Information and Communications Technology User Support Technicians |
0.47 |
0.19 |
|
Gradient 2 |
2421 |
Management and Organization Analysts |
0.46 |
0.1 |
|
Gradient 2 |
4411 |
Library Clerks |
0.46 |
0.18 |
|
Gradient 2 |
5243 |
Door-to-door Salespersons |
0.46 |
0.18 |
|
Gradient 2 |
2423 |
Personnel and Careers Professionals |
0.45 |
0.07 |
|
Gradient 2 |
3315 |
Valuers and Loss Assessors |
0.45 |
0.19 |
|
Gradient 2 |
3353 |
Government Social Benefits Officials |
0.45 |
0.07 |
|
Gradient 2 |
4212 |
Bookmakers, Croupiers and Related Gaming Workers |
0.45 |
0.19 |
|
Gradient 2 |
1330 |
Information and Communications Technology Service Managers |
0.44 |
0.07 |
|
Gradient 2 |
1420 |
Retail and Wholesale Trade Managers |
0.44 |
0.15 |
|
Gradient 2 |
2165 |
Cartographers and Surveyors |
0.44 |
0.12 |
|
Gradient 2 |
3324 |
Trade Brokers |
0.44 |
0.1 |
|
Gradient 2 |
3339 |
Business Services Agents Not Elsewhere Classified |
0.44 |
0.12 |
|
Gradient 2 |
4322 |
Production Clerks |
0.44 |
0.06 |
|
Gradient 2 |
2432 |
Public Relations Professionals |
0.43 |
0.09 |
|
Gradient 2 |
3341 |
Office Supervisors |
0.43 |
0.11 |
|
Gradient 2 |
3354 |
Government Licensing Officials |
0.43 |
0.07 |
|
Gradient 2 |
3511 |
Information and Communications Technology Operations Technicians |
0.43 |
0.13 |
|
Gradient 2 |
3513 |
Computer Network and Systems Technicians |
0.43 |
0.08 |
|
Gradient 2 |
4214 |
Debt Collectors and Related Workers |
0.43 |
0.07 |
|
Gradient 2 |
5221 |
Shopkeepers |
0.43 |
0.1 |
|
Gradient 2 |
1219 |
Business Services and Administration Managers Not Elsewhere Classified |
0.42 |
0.1 |
|
Gradient 2 |
2152 |
Electronics Engineers |
0.42 |
0.13 |
|
Gradient 2 |
4229 |
Client Information Workers Not Elsewhere Classified |
0.42 |
0.13 |
|
Gradient 2 |
5242 |
Sales Demonstrators |
0.42 |
0.11 |
|
Gradient 2 |
1221 |
Sales and Marketing Managers |
0.41 |
0.09 |
|
Gradient 2 |
2424 |
Training and Staff Development Professionals |
0.41 |
0.09 |
|
Gradient 2 |
4412 |
Mail Carriers and Sorting Clerks |
0.41 |
0.15 |
|
Gradient 2 |
2131 |
Biologists, Botanists, Zoologists and Related Professionals |
0.4 |
0.1 |
|
Gradient 1 |
2351 |
Education Methods Specialists |
0.39 |
0.11 |
|
Gradient 1 |
2634 |
Psychologists |
0.39 |
0.14 |
|
Gradient 1 |
3411 |
Legal and Related Associate Professionals |
0.39 |
0.14 |
|
Gradient 1 |
3431 |
Photographers |
0.39 |
0.12 |
|
Gradient 1 |
5230 |
Cashiers and Ticket Clerks |
0.39 |
0.14 |
|
Gradient 1 |
2111 |
Physicists and Astronomers |
0.38 |
0.14 |
|
Gradient 1 |
3141 |
Life Science Technicians (excluding Medical) |
0.38 |
0.18 |
|
Gradient 1 |
5223 |
Shop Sales Assistants |
0.38 |
0.16 |
|
Gradient 1 |
7321 |
Pre-press Technicians |
0.38 |
0.22 |
|
Gradient 1 |
9623 |
Meter Readers and Vending-machine Collectors |
0.38 |
0.21 |
|
Gradient 1 |
1411 |
Hotel Managers |
0.37 |
0.13 |
|
Gradient 1 |
3433 |
Gallery, Museum and Library Technicians |
0.37 |
0.2 |
|
Gradient 1 |
4415 |
Filing and Copying Clerks |
0.37 |
0.17 |
|
Gradient 1 |
9621 |
Messengers, Package Deliverers and Luggage Porters |
0.37 |
0.19 |
|
Gradient 1 |
3256 |
Medical Assistants |
0.35 |
0.23 |
|
Gradient 1 |
5211 |
Stall and Market Salespersons |
0.35 |
0.17 |
|
Gradient 1 |
8322 |
Car, Taxi and Van Drivers |
0.28 |
0.23 |
|
Minimal Exposure |
3522 |
Telecommunications Engineering Technicians |
0.45 |
0.04 |
|
Minimal Exposure |
2422 |
Policy Administration Professionals |
0.42 |
0.06 |
|
Minimal Exposure |
2164 |
Town and Traffic Planners |
0.41 |
0.06 |
|
Minimal Exposure |
2265 |
Dieticians and Nutritionists |
0.41 |
0.07 |
|
Minimal Exposure |
1223 |
Research and Development Managers |
0.4 |
0.06 |
|
Minimal Exposure |
1222 |
Advertising and Public Relations Managers |
0.39 |
0.05 |
|
Minimal Exposure |
2113 |
Chemists |
0.39 |
0.1 |
|
Minimal Exposure |
3323 |
Buyers |
0.39 |
0.08 |
|
Minimal Exposure |
3333 |
Employment agents and contractors |
0.39 |
0.09 |
|
Minimal Exposure |
1112 |
Senior Government Officials |
0.38 |
0.08 |
|
Minimal Exposure |
1120 |
Managing Directors and Chief Executives |
0.38 |
0.06 |
|
Minimal Exposure |
1321 |
Manufacturing Managers |
0.38 |
0.11 |
|
Minimal Exposure |
1324 |
Supply, Distribution and Related Managers |
0.38 |
0.05 |
|
Minimal Exposure |
1349 |
Professional Services Managers Not Elsewhere Classified |
0.38 |
0.07 |
|
Minimal Exposure |
2133 |
Environmental Protection Professionals |
0.38 |
0.04 |
|
Minimal Exposure |
2143 |
Environmental Engineers |
0.38 |
0.07 |
|
Minimal Exposure |
3114 |
Electronics Engineering Technicians |
0.38 |
0.11 |
|
Minimal Exposure |
1114 |
Senior Officials of Special-interest Organizations |
0.37 |
0.06 |
|
Minimal Exposure |
1211 |
Finance Managers |
0.37 |
0.04 |
|
Minimal Exposure |
1344 |
Social Welfare Managers |
0.37 |
0.07 |
|
Minimal Exposure |
2141 |
Industrial and Production Engineers |
0.37 |
0.07 |
|
Minimal Exposure |
2161 |
Building Architects |
0.37 |
0.08 |
|
Minimal Exposure |
2162 |
Landscape Architects |
0.37 |
0.08 |
|
Minimal Exposure |
2310 |
University and Higher Education Teachers |
0.37 |
0.12 |
|
Minimal Exposure |
2619 |
Legal Professionals Not Elsewhere Classified |
0.37 |
0.09 |
|
Minimal Exposure |
2654 |
Film, Stage and Related Directors and Producers |
0.37 |
0.07 |
|
Minimal Exposure |
3422 |
Sports Coaches, Instructors and Officials |
0.37 |
0.12 |
|
Minimal Exposure |
3432 |
Interior Designers and Decorators |
0.37 |
0.08 |
|
Minimal Exposure |
4321 |
Stock Clerks |
0.37 |
0.06 |
|
Minimal Exposure |
1212 |
Human Resource Managers |
0.36 |
0.05 |
|
Minimal Exposure |
1342 |
Health Service Managers |
0.36 |
0.05 |
|
Minimal Exposure |
1345 |
Education Managers |
0.36 |
0.1 |
|
Minimal Exposure |
1412 |
Restaurant Managers |
0.36 |
0.12 |
|
Minimal Exposure |
2114 |
Geologists and geophysicists |
0.36 |
0.1 |
|
Minimal Exposure |
2611 |
Lawyers |
0.36 |
0.09 |
|
Minimal Exposure |
3359 |
Government Regulatory AssociatePprofessionals Not Elsewhere Classified |
0.36 |
0.1 |
|
Minimal Exposure |
5222 |
Shop Supervisors |
0.36 |
0.12 |
|
Minimal Exposure |
1322 |
Mining Managers |
0.35 |
0.11 |
|
Minimal Exposure |
2145 |
Chemical Engineers |
0.35 |
0.12 |
|
Minimal Exposure |
2163 |
Product and Garment Designers |
0.35 |
0.09 |
|
Minimal Exposure |
2320 |
Vocational Education Teachers |
0.35 |
0.12 |
|
Minimal Exposure |
2354 |
Other Music Teachers |
0.35 |
0.09 |
|
Minimal Exposure |
2355 |
Other Arts Teachers |
0.35 |
0.1 |
|
Minimal Exposure |
3118 |
Draughtspersons |
0.35 |
0.11 |
|
Minimal Exposure |
3122 |
Manufacturing Supervisors |
0.35 |
0.13 |
|
Minimal Exposure |
3334 |
Real Estate Agents and Property Managers |
0.35 |
0.09 |
|
Minimal Exposure |
3521 |
Broadcasting and Audio-visual Technicians |
0.35 |
0.11 |
|
Minimal Exposure |
1323 |
Construction Managers |
0.34 |
0.06 |
|
Minimal Exposure |
1343 |
Aged Care Service Managers |
0.34 |
0.09 |
|
Minimal Exposure |
2353 |
Other Language Teachers |
0.34 |
0.11 |
|
Minimal Exposure |
3155 |
Air Traffic Safety Electronics Technicians |
0.34 |
0.1 |
|
Minimal Exposure |
2262 |
Pharmacists |
0.33 |
0.09 |
|
Minimal Exposure |
2359 |
Teaching Professionals Not Elsewhere Classified |
0.33 |
0.1 |
|
Minimal Exposure |
3412 |
Social Work Associate Professionals |
0.33 |
0.13 |
|
Minimal Exposure |
1431 |
Sports, Recreation and Cultural Centre Managers |
0.32 |
0.1 |
|
Minimal Exposure |
2230 |
Traditional and Complementary Medicine Professionals |
0.32 |
0.11 |
|
Minimal Exposure |
3351 |
Customs and Border Inspectors |
0.32 |
0.14 |
|
Minimal Exposure |
5113 |
Travel Guides |
0.32 |
0.11 |
|
Minimal Exposure |
8219 |
Assemblers Not Elsewhere Classified |
0.32 |
0.17 |
|
Minimal Exposure |
2655 |
Actors |
0.31 |
0.15 |
|
Minimal Exposure |
3135 |
Metal Production Process Controllers |
0.31 |
0.13 |
|
Minimal Exposure |
3154 |
Air Traffic Controllers |
0.31 |
0.09 |
|
Minimal Exposure |
3212 |
Medical and Pathology Laboratory Technicians |
0.31 |
0.16 |
|
Minimal Exposure |
7515 |
Food and Beverage Tasters and Graders |
0.31 |
0.16 |
|
Minimal Exposure |
7543 |
Product Graders and Testers (except Foods and Beverages) |
0.31 |
0.11 |
|
Minimal Exposure |
1341 |
Child Care Service Managers |
0.3 |
0.15 |
|
Minimal Exposure |
2222 |
Midwifery Professionals |
0.3 |
0.15 |
|
Minimal Exposure |
3213 |
Pharmaceutical Technicians and Assistants |
0.3 |
0.12 |
|
Minimal Exposure |
3259 |
Health Associate Professionals Not Elsewhere Classified |
0.3 |
0.15 |
|
Minimal Exposure |
5161 |
Astrologers, Fortune-tellers and Related Workers |
0.3 |
0.16 |
|
Minimal Exposure |
9629 |
Elementary Workers Not Elsewhere Classified |
0.29 |
0.14 |
|
Minimal Exposure |
2264 |
Physiotherapists |
0.28 |
0.14 |
|
Minimal Exposure |
5131 |
Waiters |
0.28 |
0.16 |
|
Minimal Exposure |
8171 |
Pulp and Papermaking Plant Operators |
0.28 |
0.14 |
|
Minimal Exposure |
8212 |
Electrical and Electronic Equipment Assemblers |
0.28 |
0.19 |
|
Minimal Exposure |
1311 |
Agricultural and Forestry Production Managers |
0.27 |
0.13 |
|
Minimal Exposure |
5153 |
Building Caretakers |
0.27 |
0.16 |
|
Minimal Exposure |
8211 |
Mechanical Machinery Assemblers |
0.27 |
0.17 |
|
Minimal Exposure |
5112 |
Transport Conductors |
0.25 |
0.17 |
|
Minimal Exposure |
5322 |
Home-based Personal Care Workers |
0.25 |
0.18 |
|
Minimal Exposure |
8321 |
Motorcycle Drivers |
0.25 |
0.17 |
|
Minimal Exposure |
5245 |
Service Station Attendants |
0.24 |
0.16 |
|
Minimal Exposure |
8332 |
Heavy Truck and Lorry Drivers |
0.24 |
0.22 |
|
Minimal Exposure |
3221 |
Nursing Associate Professionals |
0.22 |
0.21 |
|
Not Exposed |
1213 |
Policy and Planning Managers |
0.36 |
0.04 |
|
Not Exposed |
2144 |
Mechanical Engineers |
0.32 |
0.07 |
|
Not Exposed |
3116 |
Chemical Engineering Technicians |
0.32 |
0.02 |
|
Not Exposed |
1111 |
Legislators |
0.31 |
0.04 |
|
Not Exposed |
2151 |
Electrical Engineers |
0.31 |
0.08 |
|
Not Exposed |
2612 |
Judges |
0.31 |
0.08 |
|
Not Exposed |
2142 |
Civil Engineers |
0.3 |
0.06 |
|
Not Exposed |
2149 |
Engineering Professionals Not Elsewhere Classified |
0.3 |
0.08 |
|
Not Exposed |
2330 |
Secondary Education Teachers |
0.3 |
0.07 |
|
Not Exposed |
2132 |
Farming, Forestry and Fisheries Advisers |
0.29 |
0.1 |
|
Not Exposed |
2146 |
Mining Engineers, Metallurgists and Related Professionals |
0.29 |
0.05 |
|
Not Exposed |
2211 |
Generalist Medical Practitioners |
0.29 |
0.1 |
|
Not Exposed |
3121 |
Mining Supervisors |
0.29 |
0.08 |
|
Not Exposed |
3133 |
Chemical Processing Plant Controllers |
0.29 |
0.1 |
|
Not Exposed |
3134 |
Petroleum and Natural Gas Refining Plant Operators |
0.29 |
0.11 |
|
Not Exposed |
3152 |
Ships' Deck Officers and Pilots |
0.29 |
0.11 |
|
Not Exposed |
2263 |
Environmental and Occupational Health and Hygiene Professionals |
0.28 |
0.05 |
|
Not Exposed |
2352 |
Special Needs Teachers |
0.28 |
0.1 |
|
Not Exposed |
2635 |
Social Work and Counselling Professionals |
0.28 |
0.1 |
|
Not Exposed |
2652 |
Musicians, Singers and Composers |
0.28 |
0.09 |
|
Not Exposed |
3112 |
Civil Engineering Technicians |
0.28 |
0.07 |
|
Not Exposed |
3117 |
Mining and metallurgical technicians |
0.28 |
0.06 |
|
Not Exposed |
3123 |
Construction Supervisors |
0.28 |
0.06 |
|
Not Exposed |
3131 |
Power Production Plant Operators |
0.28 |
0.11 |
|
Not Exposed |
2212 |
Specialist Medical Practitioners |
0.27 |
0.12 |
|
Not Exposed |
3113 |
Electrical Engineering Technicians |
0.27 |
0.05 |
|
Not Exposed |
3132 |
Incinerator and Water Treatment Plant Operators |
0.27 |
0.09 |
|
Not Exposed |
3153 |
Aircraft Pilots and Related Associate Professionals |
0.27 |
0.05 |
|
Not Exposed |
8132 |
Photographic Products Machine Operators |
0.27 |
0.06 |
|
Not Exposed |
2341 |
Primary School Teachers |
0.26 |
0.09 |
|
Not Exposed |
3111 |
Chemical and Physical Science Technicians |
0.26 |
0.09 |
|
Not Exposed |
3115 |
Mechanical Engineering Technicians |
0.26 |
0.08 |
|
Not Exposed |
3119 |
Physical and Engineering Science Technicians Not Elsewhere Classified |
0.26 |
0.05 |
|
Not Exposed |
3142 |
Agricultural Technicians |
0.26 |
0.09 |
|
Not Exposed |
5132 |
Bartenders |
0.26 |
0.12 |
|
Not Exposed |
8121 |
Metal Processing Plant Operators |
0.26 |
0.1 |
|
Not Exposed |
2221 |
Nursing Professionals |
0.25 |
0.13 |
|
Not Exposed |
3423 |
Fitness and Recreation Instructors and Programme Leaders |
0.25 |
0.07 |
|
Not Exposed |
3434 |
Chefs |
0.25 |
0.06 |
|
Not Exposed |
5241 |
Fashion and Other Models |
0.25 |
0.06 |
|
Not Exposed |
7322 |
Printers |
0.25 |
0.11 |
|
Not Exposed |
7421 |
Electronics Mechanics and Servicers |
0.25 |
0.13 |
|
Not Exposed |
2266 |
Audiologists and Speech Therapists |
0.24 |
0.04 |
|
Not Exposed |
2267 |
Optometrists and Ophthalmic Opticians |
0.24 |
0.07 |
|
Not Exposed |
3254 |
Dispensing Opticians |
0.24 |
0.07 |
|
Not Exposed |
3257 |
Environmental and Occupational Health Inspectors and Associates |
0.24 |
0.04 |
|
Not Exposed |
5246 |
Food Service Counter Attendants |
0.24 |
0.13 |
|
Not Exposed |
5312 |
Teachers' Aides |
0.24 |
0.14 |
|
Not Exposed |
7422 |
Information and Communications Technology Installers and Servicers |
0.24 |
0.14 |
|
Not Exposed |
8131 |
Chemical Products Plant and Machine Operators |
0.24 |
0.07 |
|
Not Exposed |
1113 |
Traditional Chiefs and Heads of Villages |
0.23 |
0.1 |
|
Not Exposed |
2240 |
Paramedical Practitioners |
0.23 |
0.13 |
|
Not Exposed |
3151 |
Ships' Engineers |
0.23 |
0.05 |
|
Not Exposed |
3355 |
Police Inspectors and Detectives |
0.23 |
0.07 |
|
Not Exposed |
3421 |
Athletes and Sports Players |
0.23 |
0.11 |
|
Not Exposed |
8114 |
Cement, Stone and Other Mineral Products Machine Operators |
0.23 |
0.11 |
|
Not Exposed |
1312 |
Aquaculture and Fisheries Production Managers |
0.22 |
0.08 |
|
Not Exposed |
3211 |
Medical Imaging and Therapeutic Equipment Technicians |
0.22 |
0.03 |
|
Not Exposed |
3253 |
Community Health Workers |
0.22 |
0.08 |
|
Not Exposed |
3258 |
Ambulance Workers |
0.22 |
0.17 |
|
Not Exposed |
5111 |
Travel Attendants and Travel Stewards |
0.22 |
0.1 |
|
Not Exposed |
5151 |
Cleaning and Housekeeping Supervisors in Offices, Hotels and Other Establishments |
0.22 |
0.1 |
|
Not Exposed |
5162 |
Companions and Valets |
0.22 |
0.05 |
|
Not Exposed |
5212 |
Street Food Salespersons |
0.22 |
0.11 |
|
Not Exposed |
6123 |
Apiarists and Sericulturists |
0.22 |
0.11 |
|
Not Exposed |
6221 |
Aquaculture Workers |
0.22 |
0.15 |
|
Not Exposed |
7323 |
Print Finishing and Binding Workers |
0.22 |
0.09 |
|
Not Exposed |
7513 |
Dairy Products Makers |
0.22 |
0.17 |
|
Not Exposed |
7521 |
Wood Treaters |
0.22 |
0.15 |
|
Not Exposed |
7523 |
Woodworking Machine Tool Setters and Operators |
0.22 |
0.16 |
|
Not Exposed |
8183 |
Packing, Bottling and Labelling Machine Operators |
0.22 |
0.01 |
|
Not Exposed |
2342 |
Early Childhood Educators |
0.21 |
0.05 |
|
Not Exposed |
2651 |
Visual Artists |
0.21 |
0.04 |
|
Not Exposed |
3143 |
Forestry Technicians |
0.21 |
0.07 |
|
Not Exposed |
5169 |
Personal Services Workers Not Elsewhere Classified |
0.21 |
0.07 |
|
Not Exposed |
7127 |
Air Conditioning and Refrigeration Mechanics |
0.21 |
0.11 |
|
Not Exposed |
7213 |
Sheet Metal Workers |
0.21 |
0.09 |
|
Not Exposed |
7311 |
Precision-instrument Makers and Repairers |
0.21 |
0.08 |
|
Not Exposed |
8112 |
Mineral and Stone Processing Plant Operators |
0.21 |
0.1 |
|
Not Exposed |
8154 |
Bleaching, Dyeing and Fabric Cleaning Machine Operators |
0.21 |
0.15 |
|
Not Exposed |
9331 |
Hand and Pedal Vehicle Drivers |
0.21 |
0.08 |
|
Not Exposed |
2269 |
Health Professionals Not Elsewhere Classified |
0.2 |
0.08 |
|
Not Exposed |
3222 |
Midwifery Associate Professionals |
0.2 |
0.07 |
|
Not Exposed |
5152 |
Domestic Housekeepers |
0.2 |
0.1 |
|
Not Exposed |
5165 |
Driving Instructors |
0.2 |
0.03 |
|
Not Exposed |
5414 |
Security Guards |
0.2 |
0.09 |
|
Not Exposed |
5419 |
Protective Services Workers Not Elsewhere Classified |
0.2 |
0.05 |
|
Not Exposed |
6129 |
Animal Producers Not Elsewhere Classified |
0.2 |
0.14 |
|
Not Exposed |
7222 |
Toolmakers and Related Workers |
0.2 |
0.1 |
|
Not Exposed |
8122 |
Metal Finishing, Plating and Coating Machine Operators |
0.2 |
0.04 |
|
Not Exposed |
8182 |
Steam Engine and Boiler Operators |
0.2 |
0.04 |
|
Not Exposed |
8311 |
Locomotive Engine Drivers |
0.2 |
0.08 |
|
Not Exposed |
8344 |
Lifting Truck Operators |
0.2 |
0.1 |
|
Not Exposed |
9321 |
Hand Packers |
0.2 |
0.05 |
|
Not Exposed |
9334 |
Shelf Fillers |
0.2 |
0.1 |
|
Not Exposed |
9520 |
Street Vendors (excluding Food) |
0.2 |
0.1 |
|
Not Exposed |
2653 |
Dancers and Choreographers |
0.19 |
0.1 |
|
Not Exposed |
3230 |
Traditional and Complementary Medicine Associate Professionals |
0.19 |
0.11 |
|
Not Exposed |
5311 |
Child Care Workers |
0.19 |
0.09 |
|
Not Exposed |
6122 |
Poultry Producers |
0.19 |
0.1 |
|
Not Exposed |
6130 |
Mixed Crop and Animal Producers |
0.19 |
0.11 |
|
Not Exposed |
7232 |
Aircraft Engine Mechanics and Repairers |
0.19 |
0.07 |
|
Not Exposed |
7315 |
Glass Makers, Cutters, Grinders and Finishers |
0.19 |
0.06 |
|
Not Exposed |
7411 |
Building and Related Electricians |
0.19 |
0.06 |
|
Not Exposed |
8113 |
Well Drillers and Borers and Related Workers |
0.19 |
0.12 |
|
Not Exposed |
3214 |
Medical and Dental Prosthetic Technicians |
0.18 |
0.05 |
|
Not Exposed |
5120 |
Cooks |
0.18 |
0.06 |
|
Not Exposed |
5142 |
Beauticians and Related Workers |
0.18 |
0.19 |
|
Not Exposed |
5411 |
Fire Fighters |
0.18 |
0.1 |
|
Not Exposed |
6111 |
Field Crop and Vegetable Growers |
0.18 |
0.12 |
|
Not Exposed |
6113 |
Gardeners, Horticultural and Nursery Growers |
0.18 |
0.11 |
|
Not Exposed |
6223 |
Deep-sea Fishery Workers |
0.18 |
0.07 |
|
Not Exposed |
7126 |
Plumbers and Pipe Fitters |
0.18 |
0.1 |
|
Not Exposed |
7223 |
Metal Working Machine Tool Setters and Operators |
0.18 |
0.05 |
|
Not Exposed |
7231 |
Motor Vehicle Mechanics and Repairers |
0.18 |
0.04 |
|
Not Exposed |
7313 |
Jewellery and Precious Metal Workers |
0.18 |
0.05 |
|
Not Exposed |
7314 |
Potters and Related Workers |
0.18 |
0.07 |
|
Not Exposed |
7316 |
Sign Writers, Decorative Painters, Engravers and Etchers |
0.18 |
0.08 |
|
Not Exposed |
7534 |
Upholsterers and Related Workers |
0.18 |
0.09 |
|
Not Exposed |
8141 |
Rubber Products Machine Operators |
0.18 |
0.05 |
|
Not Exposed |
8143 |
Paper Products Machine Operators |
0.18 |
0.02 |
|
Not Exposed |
8331 |
Bus and Tram Drivers |
0.18 |
0.06 |
|
Not Exposed |
8343 |
Crane, hoist and related plant operators |
0.18 |
0.03 |
|
Not Exposed |
9411 |
Fast Food Preparers |
0.18 |
0.05 |
|
Not Exposed |
9510 |
Street and Related Service Workers |
0.18 |
0.09 |
|
Not Exposed |
9612 |
Refuse Sorters |
0.18 |
0.11 |
|
Not Exposed |
2636 |
Religious Professionals |
0.17 |
0.12 |
|
Not Exposed |
3255 |
Physiotherapy Technicians and Assistants |
0.17 |
0.07 |
|
Not Exposed |
5141 |
Hairdressers |
0.17 |
0.18 |
|
Not Exposed |
5163 |
Undertakers and Embalmers |
0.17 |
0.17 |
|
Not Exposed |
6112 |
Tree and Shrub Crop Growers |
0.17 |
0.11 |
|
Not Exposed |
6114 |
Mixed Crop Growers |
0.17 |
0.12 |
|
Not Exposed |
6121 |
Livestock and Dairy Producers |
0.17 |
0.1 |
|
Not Exposed |
6222 |
Inland and Coastal Waters Fishery Workers |
0.17 |
0.1 |
|
Not Exposed |
7221 |
Blacksmiths, Hammersmiths and Forging Press Workers |
0.17 |
0.05 |
|
Not Exposed |
7224 |
Metal Polishers, Wheel Grinders and Tool Sharpeners |
0.17 |
0.05 |
|
Not Exposed |
7233 |
Agricultural and Industrial Machinery Mechanics and Repairers |
0.17 |
0.04 |
|
Not Exposed |
7412 |
Electrical Mechanics and Fitters |
0.17 |
0.05 |
|
Not Exposed |
7512 |
Bakers, Pastry-cooks and Confectionery Makers |
0.17 |
0.08 |
|
Not Exposed |
7532 |
Garment and Related Patternmakers and Cutters |
0.17 |
0.04 |
|
Not Exposed |
7536 |
Shoemakers and Related Workers |
0.17 |
0.06 |
|
Not Exposed |
8111 |
Miners and Quarriers |
0.17 |
0.11 |
|
Not Exposed |
8142 |
Plastic Products Machine Operators |
0.17 |
0.05 |
|
Not Exposed |
8181 |
Glass and Ceramics Plant Operators |
0.17 |
0.06 |
|
Not Exposed |
8312 |
Railway Brake, Signal and Switch Operators |
0.17 |
0.04 |
|
Not Exposed |
3251 |
Dental Assistants and Therapists |
0.16 |
0.1 |
|
Not Exposed |
7522 |
Cabinet-makers and Related Workers |
0.16 |
0.06 |
|
Not Exposed |
7541 |
Underwater Divers |
0.16 |
0.09 |
|
Not Exposed |
8152 |
Weaving and Knitting Machine Operators |
0.16 |
0.03 |
|
Not Exposed |
8156 |
Shoemaking and Related Machine Operators |
0.16 |
0.02 |
|
Not Exposed |
8157 |
Laundry Machine Operators |
0.16 |
0.03 |
|
Not Exposed |
8159 |
Textile, Fur and Leather Products Machine Operators Not Elsewhere Classified |
0.16 |
0.01 |
|
Not Exposed |
2261 |
Dentists |
0.15 |
0.06 |
|
Not Exposed |
5329 |
Personal Care Workers in Health Services Not Elsewhere Classified |
0.15 |
0.03 |
|
Not Exposed |
7413 |
Electrical Line Installers and Repairers |
0.15 |
0.08 |
|
Not Exposed |
7514 |
Fruit, Vegetable and Related Preservers |
0.15 |
0.04 |
|
Not Exposed |
7531 |
Tailors, Dressmakers, Furriers and Hatters |
0.15 |
0.05 |
|
Not Exposed |
8151 |
Fibre Preparing, Spinning and Winding Machine Operators |
0.15 |
0.02 |
|
Not Exposed |
8153 |
Sewing Machine Operators |
0.15 |
0.03 |
|
Not Exposed |
8155 |
Fur and Leather Preparing Machine Operators |
0.15 |
0.02 |
|
Not Exposed |
8160 |
Food and Related Products Machine Operators |
0.15 |
0.03 |
|
Not Exposed |
2250 |
Veterinarians |
0.14 |
0.05 |
|
Not Exposed |
3240 |
Veterinary Technicians and Assistants |
0.14 |
0.02 |
|
Not Exposed |
5164 |
Pet Groomers and Animal Care Workers |
0.14 |
0.06 |
|
Not Exposed |
5321 |
Health Care Assistants |
0.14 |
0.06 |
|
Not Exposed |
5412 |
Police Officers |
0.14 |
0.03 |
|
Not Exposed |
5413 |
Prison Guards |
0.14 |
0.04 |
|
Not Exposed |
7111 |
House Builders |
0.14 |
0.07 |
|
Not Exposed |
7125 |
Glaziers |
0.14 |
0 |
|
Not Exposed |
7312 |
Musical Instrument Makers and Tuners |
0.14 |
0.02 |
|
Not Exposed |
7317 |
Handicraft Workers in Wood, Basketry and Related Materials |
0.14 |
0.01 |
|
Not Exposed |
7516 |
Tobacco Preparers and Tobacco Products Makers |
0.14 |
0.06 |
|
Not Exposed |
7549 |
Craft and Related Workers not Elsewhere Classified |
0.14 |
0.01 |
|
Not Exposed |
8172 |
Wood Processing Plant Operators |
0.14 |
0.05 |
|
Not Exposed |
8350 |
Ships' Deck Crews and Related Workers |
0.14 |
0.02 |
|
Not Exposed |
9111 |
Domestic Cleaners and Helpers |
0.14 |
0.08 |
|
Not Exposed |
9121 |
Hand Launderers and Pressers |
0.14 |
0.03 |
|
Not Exposed |
9333 |
Freight Handlers |
0.14 |
0.03 |
|
Not Exposed |
2659 |
Creative and Performing Artists Not Elsewhere Classified |
0.13 |
0.06 |
|
Not Exposed |
6310 |
Subsistence Crop Farmers |
0.13 |
0.05 |
|
Not Exposed |
6320 |
Subsistence Livestock Farmers |
0.13 |
0.04 |
|
Not Exposed |
7115 |
Carpenters and Joiners |
0.13 |
0.02 |
|
Not Exposed |
7121 |
Roofers |
0.13 |
0.08 |
|
Not Exposed |
7124 |
Insulation Workers |
0.13 |
0.02 |
|
Not Exposed |
7131 |
Painters and Related Workers |
0.13 |
0.04 |
|
Not Exposed |
7211 |
Metal Moulders and Coremakers |
0.13 |
0.01 |
|
Not Exposed |
7212 |
Welders and Flame Cutters |
0.13 |
0.05 |
|
Not Exposed |
7215 |
Riggers and Cable Splicers |
0.13 |
0.03 |
|
Not Exposed |
7234 |
Bicycle and Related Repairers |
0.13 |
0.02 |
|
Not Exposed |
7318 |
Handicraft Workers in Textile, Leather and Related Materials |
0.13 |
0.03 |
|
Not Exposed |
7511 |
Butchers, Fishmongers and Related Food Preparers |
0.13 |
0.03 |
|
Not Exposed |
7544 |
Fumigators and Other Pest and Weed Controllers |
0.13 |
0.04 |
|
Not Exposed |
8342 |
Earthmoving and Related Plant Operators |
0.13 |
0.02 |
|
Not Exposed |
9332 |
Drivers of Animal-drawn Vehicles and Machinery |
0.13 |
0.08 |
|
Not Exposed |
9412 |
Kitchen Helpers |
0.13 |
0.02 |
|
Not Exposed |
3413 |
Religious Associate Professionals |
0.12 |
0.07 |
|
Not Exposed |
6210 |
Forestry and Related Workers |
0.12 |
0.05 |
|
Not Exposed |
6330 |
Subsistence Mixed Crop and Livestock Farmers |
0.12 |
0.05 |
|
Not Exposed |
6340 |
Subsistence Fishers, Hunters, Trappers and Gatherers |
0.12 |
0.05 |
|
Not Exposed |
7132 |
Spray Painters and Varnishers |
0.12 |
0 |
|
Not Exposed |
7533 |
Sewing, Embroidery and Related Workers |
0.12 |
0.02 |
|
Not Exposed |
7542 |
Shotfirers and Blasters |
0.12 |
0.05 |
|
Not Exposed |
8341 |
Mobile Farm and Forestry Plant Operators |
0.12 |
0.03 |
|
Not Exposed |
9112 |
Cleaners and Helpers in Offices, Hotels and Other Establishments |
0.12 |
0.02 |
|
Not Exposed |
9212 |
Livestock Farm Labourers |
0.12 |
0.03 |
|
Not Exposed |
9214 |
Garden and Horticultural Labourers |
0.12 |
0.02 |
|
Not Exposed |
9329 |
Manufacturing Labourers Not Elsewhere Classified |
0.12 |
0.02 |
|
Not Exposed |
7113 |
Stonemasons, Stone Cutters, Splitters and Carvers |
0.11 |
0.02 |
|
Not Exposed |
7123 |
Plasterers |
0.11 |
0.01 |
|
Not Exposed |
7214 |
Structural Metal Preparers and Erectors |
0.11 |
0.02 |
|
Not Exposed |
7535 |
Pelt Dressers, Tanners and Fellmongers |
0.11 |
0.03 |
|
Not Exposed |
9123 |
Window Cleaners |
0.11 |
0.03 |
|
Not Exposed |
9213 |
Mixed Crop and Livestock Farm Labourers |
0.11 |
0.03 |
|
Not Exposed |
9216 |
Fishery and Aquaculture Labourers |
0.11 |
0.03 |
|
Not Exposed |
9311 |
Mining and Quarrying Labourers |
0.11 |
0.02 |
|
Not Exposed |
9622 |
Odd Job Persons |
0.11 |
0.03 |
|
Not Exposed |
7114 |
Concrete Placers, Concrete Finishers and Related Workers |
0.1 |
0.03 |
|
Not Exposed |
7122 |
Floor Layers and Tile Setters |
0.1 |
0.02 |
|
Not Exposed |
9129 |
Other Cleaning Workers |
0.1 |
0.01 |
|
Not Exposed |
6224 |
Hunters and Trappers |
0.09 |
0.03 |
|
Not Exposed |
7112 |
Bricklayers and Related Workers |
0.09 |
0.01 |
|
Not Exposed |
7119 |
Building Frame and Related Trades Workers Not Elsewhere Classified |
0.09 |
0.01 |
|
Not Exposed |
7133 |
Building Structure Cleaners |
0.09 |
0.01 |
|
Not Exposed |
9122 |
Vehicle Cleaners |
0.09 |
0.01 |
|
Not Exposed |
9211 |
Crop Farm Labourers |
0.09 |
0.02 |
|
Not Exposed |
9215 |
Forestry Labourers |
0.09 |
0.02 |
|
Not Exposed |
9312 |
Civil Engineering Labourers |
0.09 |
0.02 |
|
Not Exposed |
9313 |
Building Construction Labourers |
0.09 |
0.02 |
|
Not Exposed |
9611 |
Garbage and Recycling Collectors |
0.09 |
0.02 |
|
Not Exposed |
9613 |
Sweepers and Related Labourers |
0.09 |
0.03 |
|
Not Exposed |
9624 |
Water and Firewood Collectors |
0.09 |
0.03 |
2. Sampling Formula for section 4.2.
As presented in section 4.2, we apply the standard formula for calculating sample size in order to assign assigning the scoring tasks to the human evaluators.
Where:
-
N is sample size
-
Z is the Z-value (1.96 for a 95% confidence level)
-
p is the estimated proportion of the population that has a particular characteristic
-
E is the margin of error (e.g., standard 0.05)
In this formula, p traditionally refers to the proportion of "successes" in the population, which represents a probability-based assumption about the variability. Since in the selection of a sample of tasks we do not know that variability, we use the most conservative approach of applying p=0.5, which gives the safest (largest) sample size for each group of tasks.21 Subsequently, we apply the standard correction formula for a finite population, where N is the number of tasks for each 1-digit category:
3. Survey Questionnaire
Welcome Screen:
Dear Participants,
We kindly ask you to complete this survey to share your opinions on new technologies. The survey is anonymous, and the results will be analyzed and presented only in aggregate form.
Survey Questions:
-
What is your gender?
(Please mark one [1] answer with an X)
a. Female
b. Male
c. Other gender
d. Prefer not to say
-
Enter your year of birth
(Range from 1940 to 2009)
.......................................
-
Select the size of the locality where you live
(Please mark one [1] answer with an X)
a. Village
b. City up to 20,000 inhabitants
c. City from 20,001 to 50,000 inhabitants
d. City from 50,001 to 100,000 inhabitants
e. City from 100,001 to 200,000 inhabitants
f. City from 200,001 to 500,000 inhabitants
g. City above 500,000 inhabitants
-
Select the voivodeship (province) where you live.
(Please mark one [1] answer with an X)
a. Lower Silesian
b. Kuyavian-Pomeranian
c. Lublin
d. Lubusz
e. Łódź
f. Lesser Poland
g. Masovian (excluding Warsaw)
h. Masovian (Warsaw only)
i. Opole
j. Subcarpathian
k. Podlaskie
l. Pomeranian
m. Silesian
n. Świętokrzyskie
o. Warmian-Masurian
p. Greater Poland
q. West Pomeranian
r. I live abroad (end the survey)
-
What is your highest level of education?
(Please mark one [1] answer with an X)
a. Primary
b. Middle school
c. Vocational
d. Secondary
e. Post-secondary
f. Bachelor’s degree, engineering
g. Master’s degree
h. PhD and higher titles
-
What is your current occupation?
(Type your answer; a list of over 2,900 occupations from the PL classification database will be suggested.)
.......................................................................................
Question 7 is answered only by those who could not classify their occupation in Question 6 (i.e., if they entered something not in the database).
-
Assign your occupation to one of the following categories:
(Please mark one [1] answer with an X)
a. Public officials, senior officials, and managers (e.g., CEOs, managing directors, senior local government officials, managers in administration and trade)
b. Professionals (e.g., doctors, teachers, engineers)
c. Technicians and associate professionals (e.g., electricians, sales representatives, insurance agents)
d. Clerical support workers (e.g., secretaries, receptionists, HR staff)
e. Service and sales workers (e.g., cooks, hairdressers, security guards)
f. Farmers, gardeners, foresters, and fishers (e.g., orchardists, animal breeders, beekeepers)
g. Industrial and craft workers (e.g., bricklayers, plumbers, printers)
h. Machine operators and assemblers (e.g., electrical equipment assemblers, train drivers, delivery truck drivers)
i. Elementary occupations (e.g., domestic helpers, cleaners, caretakers)
-
How many years have you worked in your current occupation?
(Please mark one [1] answer with an X)
a. Less than 1 year
b. 1–5 years
c. 6–10 years
d. 11–15 years
e. Over 15 years
-
How many people work in your institution (company)? This refers to the branch/division where you work.
(Please mark one [1] answer with an X)
a. 1–9 people (please enter the exact number; input restricted to values 1–9
b. 10–19
c. 20–49
d. 50–249
e. 250 or more
f. I don’t know, but fewer than 10 people
g. I don’t know, but more than 9 people
-
What is the capital ownership of the company where you work?
(Please mark one [1] answer with an X)
a. Polish (fully Polish company, no foreign capital)
b. Mixed (company has both Polish and foreign capital)
c. Foreign (fully foreign company, no Polish capital)
d. Hard to say
-
Have you heard of Generative Artificial Intelligence (GenAI, e.g., ChatGPT)?
(Please mark one [1] answer with an X)
a. Yes
b. No
c. Hard to say
-
How would you rate your knowledge of Generative Artificial Intelligence (GenAI, e.g., ChatGPT)?
(Please mark one [1] answer with an X)
a. Very low
b. Low
c. Average
d. High
e. Very high
Display Text/Info:
Here’s a brief explanation of Generative Artificial Intelligence (GenAI). In this study, we distinguish between GenAI and Artificial Intelligence (AI).
AI makes decisions based on data (e.g., suggesting the next product in an online store, recognizing license plates at parking lot entrances, and raising the barrier).
GenAI can create new content, such as images, text, or speech. The most popular tool is ChatGPT, which can answer questions, write emails, prepare applications for offices, create reports, summarize texts (e.g., articles, books), and more.
What can GenAI do?
-
Write text, "imitating" a specific person, e.g., an official, a poet, a financial analyst;
-
Prepare translations between languages, e.g., from Polish to English;
-
Convert written text into human speech ("read" text in a given language);
-
Program—convert specified tasks into computer code, e.g., Python, HTML;
-
Generate images, e.g., photos based on descriptions, or recognize and describe images (e.g., what is in a photo).
-
How often do you use Generative Artificial Intelligence tools (GenAI, e.g., ChatGPT)?
(Please mark one [1] answer with an X)
a. Never
b. Rarely (a few times a year)
c. Sometimes (a few times a month)
d. Often (a few times a week)
e. Very often (daily)
-
To what extent do you think Generative Artificial Intelligence (GenAI, e.g., ChatGPT) will impact jobs in your industry over the next 5 years?
(Please mark one [1] answer with an X)
a. Not at all
b. Slightly
c. Moderately
d. Significantly
e. Completely (will transform the profession)
-
To what extent could your position be replaced by Generative Artificial Intelligence (e.g., ChatGPT) within the next 5 years?
(Rate by moving the slider on a scale from 0% to 100%, where 0% means "Will not be replaced" and 100% means "Will be completely replaced.")
*Will not be replaced (0%) |--------slider--------| Will be completely replaced (100%); I don’t know*
Slider-type question
Display Text/Info:
The following pages contain tasks performed by representatives of various professions. The tasks you are asked to evaluate in this part of the survey may or may not be performed by you currently or in the past. However, they belong to the set of tasks performed within the group of professions to which you belong. Therefore, we encourage you to evaluate each task, even those you have not encountered, based on both experience and intuition.
Task Evaluation
The respondent is asked to evaluate 15 tasks; each task should be evaluated 20 times; the "I don’t know" option is counted as an evaluation. Below is an example of a task description. The profession and task are randomly selected from the database provided to the supplier. Randomization occurs in each stratum (profession according to ISCO-08, 1-digit code).
O1. Evaluate to what extent you believe Generative Artificial Intelligence (GenAI, e.g., ChatGPT) can automate the performance of the following task.
Rate by placing the slider at the appropriate point on a scale from 0 to 100, where 0 means "No automation potential using GenAI" and 100 means "Full automation potential using GenAI for the task performed within the given profession."
Profession: Road Transport Engineer
Task: Participating in the development of new control and traffic measurement devices
0 - No automation potential using GenAI |--------slider--------| 100 - Full automation potential using GenAI
I don’t know
O1a. Do you perform this or a similar task at work?
a. Yes
b. No
References
Acemoglu, D., 2024. The Simple Macroeconomics of AI. Mass. Inst. Technol., Working Paper 32487, https://www.nber.org/papers/w32487
Acemoglu, D., Kong, F., Restrepo, P., 2024. Tasks At Work: Comparative Advantage, Technology and Labor Demand. Working Paper Series. https://doi.org/10.3386/w32872
Acemoglu, D., Restrepo, P., 2022. Tasks, Automation, and the Rise in U.S. Wage Inequality. Econometrica 90, 1973–2016. https://doi.org/10.3982/ECTA19815
Ananian, S., Aubert, P., Behaghel, L., 2006. Travailleurs âgés, nouvelles technologies et changements organisationnels : un réexamen à partir de l’enquête « Reponse ». Suivi d’un commentaire de Luc Behaghel : emploi des seniors - Des effets du changement technologique aux recommandations. Econ. Stat. 397, 21–49. https://doi.org/10.3406/estat.2006.7125
Autor, D., 2024. Applying AI to Rebuild Middle Class Jobs. NBER Working Paper Series, 32140, https://doi.org/10.3386/w32140
Bessen, J.E., 2016. How Computer Automation Affects Occupations: Technology, Jobs, and Skills. https://doi.org/10.2139/ssrn.2690435
Bick, A., Blandin, A., Deming, D.J., 2024. The Rapid Adoption of Generative AI. Working Paper Series. https://doi.org/10.3386/w32966
Bubeck, S., Chandrasekaran, V., Eldan, R., Gehrke, J., Horvitz, E., Kamar, E., Lee, P., Lee, Y.T., Li, Y., Lundberg, S., Nori, H., Palangi, H., Ribeiro, M.T., Zhang, Y., 2023. Sparks of Artificial General Intelligence: Early experiments with GPT-4.
Cazzaniga, M., Jaumotte, F., Li, L., Melina, G., Augustus J., P., Carlo, P., Emma J., R., Mendes, M., 2024. Gen-AI: Artificial Intelligence and the Future of Work, IMF, https://www.imf.org/en/Publications/Staff-Discussion-Notes/Issues/2024/01/14/Gen-AI-Artificial-Intelligence-and-the-Future-of-Work-542379 (accessed 2.19.24).
Comunale, M., Manera, A., 2024. The Economic Impacts and the Regulation of AI: A Review of the Academic Literature and Policy Actions, IMF, https://www.imf.org/en/Publications/WP/Issues/2024/03/22/The-Economic-Impacts-and-the-Regulation-of-AI-A-Review-of-the-Academic-Literature-and-546645 (accessed 3.26.24).
Faverio, M., Tyson, A., 2022. What the data says about Americans’ views of artificial intelligence. Pew Res. Cent., https://www.pewresearch.org/short-reads/2023/11/21/what-the-data-says-about-americans-views-of-artificial-intelligence/ (accessed 3.14.24).
Felten, E.W., Raj, M., Seamans, R., 2023. Occupational Heterogeneity in Exposure to Generative AI. https://doi.org/10.2139/ssrn.4414065
Frey, C.B., Osborne, M.A., 2017. The future of employment: How susceptible are jobs to computerisation? Technol. Forecast. Soc. Change 114, 254–280. https://doi.org/10.1016/j.techfore.2016.08.019
Gmyrek, P., Berg, J., Bescond, D., 2023. Generative AI and Jobs: A global analysis of potential effects on job quantity and quality, ILO Working Paper 96, https://www.ilo.org/publications/generative-ai-and-jobs-global-analysis-potential-effects-job-quantity-and, DOI: https://doi.org/10.54394/FHEM8239
Gmyrek, P., Lutz, C., Newlands, G., 2024. A technological construction of society: Comparing GPT-4 and human respondents for occupational evaluation in the UK. Br. J. Ind. Relat. https://doi.org/10.1111/bjir.12840
Gmyrek, P., Winkler, H., Garganta, S., 2024. Buffer or bottleneck?: employment exposure to generative AI and the digital divide in Latin America. ILO : World Bank. https://doi.org/10.54394/TFZY7681
Grampp, M., Brandes, D., Laude, D., 2023. Generative AI’s fast and furious entry into Switzerland (Delloite), https://www.deloitte.com/ch/en/Industries/technology/research/generative-ai.html
Karger, E., Rosenberg, J., Jacobs, Z., Hickman, M., Hadshar, R., Gamin, K., Smith, T., Williams, B., McCaslin, T., Tetlock, P.E., 2023. Forecasting Existential Risks: Evidence from a Long-Run Forecasting Tournament, FRI Working Paper #1. Forecasting Research Institute.
Maison & Partners, ThinkTank, 2024. POLACY O AI: codzienność, nadzieje, obawy. Warsaw, 2024, https://panelariadna.pl/raporty/polacy-o-ai?fbclid=IwY2xjawF8cUFleHRuA2FlbQIxMAABHa4EaPKNEUw30RFJH4Bi75E8xHb1-PZqFmkazhFqXvTBZ-SURof2SkKJeQ_aem__ptS_oYYk_jtfqWoT9Copw
McKinsey & Co., 2023. Economic potential of generative AI, https://www.mckinsey.com/capabilities/mckinsey-digital/our-insights/the-economic-potential-of-generative-ai-the-next-productivity-frontier
Nurski, L., Ruer, N., 2024. Exposure to generative AI in the European labour market: distributional implications, Bruegel Working Paper, https://www.bruegel.org/system/files/2024-03/WP%2006.pdf
Nurski, L., Vansteenkiste, S., 2024. De impact van technologie op beroepen. Het belang en de bruikbaarheid van impactscores en taakindices voor monitoring, analyses en projecties van de arbeidsmarkt, https://lirias.kuleuven.be/4176721?limo=0
Parker, K., Horowitz, J., O’Hanlon, J., 2025. U.S. Workers Are More Worried Than Hopeful About Future AI Use in the Workplace. Pew Res. Cent., https://www.pewresearch.org/social-trends/2025/02/25/workers-experience-with-ai-chatbots-in-their-jobs/ (accessed 3.7.25).
Pew Research Center, 2023. Americans explain in their own words what makes them either more concerned or more excited about the increased presence of AI in daily life. Internet Sci. Tech, https://www.pewresearch.org/internet/2022/03/17/ai-and-human-enhancement-americans-openness-is-tempered-by-a-range-of-concerns/ps_2022-03-17_ai-he_01-02/ (accessed 3.14.24).
Rutgers, 2024. U.S. Workers Assess the Impacts of Artificial Intelligence on Jobs: Topline Survey Results, Heldrich Center for Workforce Development, https://heldrich.rutgers.edu/wp-content/uploads/2024/02/Work_Trends_February_2024.pdf
Svanberg, M., Li, W., Fleming, M., Goehring, B., Thompson, N., 2024. Beyond AI Exposure: Which Tasks are Cost-Effective to Automate with Computer Vision? https://doi.org/10.2139/ssrn.4700751
Tegtmeier, P., Weber, C., Sommer, S., Tisch, A., Wischniewski, S., 2022. Criteria and Guidelines for Human-Centered Work Design in a Digitally Transformed World of Work: Findings from a Formal Consensus Process. Int. J. Environ. Res. Public. Health 19, 15506. https://doi.org/10.3390/ijerph192315506
Acknowledgements
We thank the many experts who contributed their time, insights, and feedback to the expert validation survey informing this study. While not all were able to participate directly, we gratefully acknowledge the engagement, comments, and support received from the following individuals and institutions:
NASK-PIB
Michał Falkowski, Michał Hałoń, Jarosław Kamiński, Szymon Łukasik
Ministry of Family, Work and Social Policy, Poland:
Jacek Brzeziński, Joanna Fedorczyk, Ewa Flaszyńska, Izabela Kaczmarska-Sawicka, Agnieszka Ołdakowska, Sławomir Sułkowski, Mikołaj Tarasiuk, Marcin Wiatrów, Anna Wrona
Ministry of Digital Affairs, Poland:
Aneta Zradzińska, Kamil Giera, Pamela Krzypkowska, Ewa Świętochowska
International Labour Organization:
David Bescond, ILO STATISTICS – global employment estimates in section 11
Willian Boschetti (ILO consultant)
Dino Ferrero (ITC-ILO)
Maria Vittoria Franceschelli (ITC-ILO)
Caroline Fredrickson, Director, ILO Research Department
Luis Melero García, Legal Specialist, ILO
Sher Verick, Senior Adviser, Office of the Deputy Director General, ILO
Academic and Research Institutions:
Ignacy Święcicki (PIE), Andrzej Zybała (SGH), Konrad Gawroński
Laura Nurski (Centre for European Policy Studies - CEPS);
The World Bank
Hernan Winkler, Senior Economist, Poverty and Equity Global Practice for Latin America and the Caribbean
We also thank all other respondents who participated in the survey and contributed valuable task assessments.
We are further grateful to the peer reviewers for their constructive comments, which significantly strengthened the quality of this work:
Sergei Soares, Senior Economist, ILO Research Department
Aguinaldo Maciente, Employment and Labour Market Policies Specialist, ILO Office for Brazil (CO-Brasilia)
Jacek Bieliński, Deputy Head of the Department of Sociology, Assistant Professor, Institute of Sociology, Civitas University
Santiago Garganta, Senior Researcher, CEDLAS, IIE-FCE, National University of La Plata (UNLP).
Use of AI tools: We used various AI tools to generate task-level scores, as detailed in the paper. Additionally, we used GPT-4o, Gemini 1.5, and DeepSeek for code debugging in R, Python and JavaScript, suggesting text edits, and for translating tasks, occupational descriptions and the survey form from Polish to English (see Appendix). The writing and calculations are our own – and so are any errors.

