


A study of the employment and earnings outcomes of second-generation migrants
Abstract
This study examines the labour market outcomes of second-generation migrants in 32 countries (30 European countries, Australia and the United States of America). Drawing on data from labour force surveys and other household surveys contained in the ILO Microdata Repository, it focuses on labour force participation, unemployment, status in employment, wages and self-employment income. The results of the analysis reveal differences between second-generation migrants and other people born in the same country once the specific composition of that population group in terms of age and educational attainment is taken into account. Second-generation migrants generally exhibit lower labour market participation and higher unemployment rates, and they appear more likely to be employees than self-employed in several of the countries studied. With regard to earnings, on average across the countries studied, a small wage gap is observed between second-generation migrant workers and the rest of native-born workers, with wage premiums existing only in a few countries. The final chapter discusses relevant legal frameworks dealing with non-discrimination and employment that affect second-generation migrants.
Introduction
The integration of migrants and their children is not just a social goal – it is a cornerstone of economic growth and resilience. This is especially relevant given that second-generation migrants could become one of the fastest-growing segments of the labour force in many regions of the world. Such a trend is suggested, in particular, by projections indicating that immigration will be a major driver of population growth in an increasing number of countries over the course of this century (United Nations 2024). In that regard, second-generation migrants are set to play a crucial role in shaping the future of labour markets. As the children of migrants, they bring with them unique perspectives, skills and dynamism that foster innovation and increase productivity.
It is therefore vital to acknowledge and address the specific labour market challenges faced by second-generation migrants. Existing studies have revealed how they experience disparities in labour market outcomes and job stability compared to their native-born counterparts, pointing to barriers that can limit the realization of their full potential and their access to decent work. The economic and social integration of second-generation migrants is essential, in order not only to fulfil the mission of promoting decent work for all but also to ensure that no one is left behind in the pursuit of shared prosperity. Such integration is aligned with the objectives of the United Nations in terms of reducing inequality and promoting inclusive growth, making it a priority for building sustainable and harmonious societies.1
Further research on the labour market experience of second-generation migrants is of the utmost importance for designing effective policies to support their integration. A better understanding of the disparities in employment rates, earnings outcomes and employment status between second-generation migrants and the rest of the native-born population can help in tackling the barriers to successful participation in the labour market. Quantifying the extent of these disparities allows for targeted interventions that can enhance economic opportunities for this population group. This would not only advance the ILO’s efforts to promote decent work for all, but also have the potential to foster economic growth, social stability and the integration of migrant communities into the workforce.
Adding to the modest body of literature on second-generation migrants, this paper accordingly examines their labour market outcomes through empirical analysis based on labour force survey data from 32 countries, specifically focusing on labour force participation, unemployment, wage employment and self-employment, and earnings. The analysis covers second-generation migrants in a broad set of European countries, Australia and the United States of America, thereby providing a comprehensive transnational comparison of labour market dynamics across various regions of the world.
Importantly, the specific labour market outcomes of second-generation migrants are analysed here using methodologies that make it possible to take into account the specific socio-demographic composition of this group, including education and age. This helps to narrow down the possible causes of the gaps observed when comparing the employment and earnings outcomes of second-generation migrants with those of the rest of the population.
By employing similar econometric methodologies and definitions across a broad selection of countries, the present study seeks to identify common trends, while also shedding light on the discrepancies in labour market outcomes experienced by second-generation migrants. Such an approach ensures improved comparability and serves to highlight national differences, thereby contributing to a deeper and more nuanced understanding of the impacts of global migration policies. A further added value of this study is that it touches upon the integration of migrants and their families into the host economy.
The structure of this working paper is as follows. Chapter 1 reviews the literature on second-generation migrants. Chapter 2 provides an overview of the data sources and surveys used, along with a detailed description of the methodology underlying the analysis. Chapter 3 presents descriptive statistics on the population of second-generation migrants across countries. Chapter 4 focuses on the employment outcomes of second-generation migrants, examining key labour market indicators while taking into account the specific socio-demographic composition of that population group. Chapter 5 offers an analysis of their wages and self-employment income. Chapter 6 highlights legal frameworks that are relevant to shaping the labour market outcomes of second-generation migrants. A series of concluding remarks round off the paper.
Literature review
In recent years, second-generation migrants have attracted considerable attention in academic discourse on account of the typical socio-economic challenges and opportunities that they experience compared with both their first-generation migrant parents and the rest of the native-born population. By “second generation” we mean the children of migrants who have themselves grown up and been educated in the countries of destination, often benefiting from the social and economic systems of these host countries in ways that their parents were unable to.
While first-generation migrants may experience incremental improvements in their socio economic position over the course of their life cycle (improvements that are positively associated with the time lived in the destination country), much of the progress achieved by the migrant population tends to be intergenerational. In other words, substantial socio economic advances and social integration are likely to manifest themselves more markedly among the second generation. As noted by Waldinger, Lim and Cort (2007), many second-generation migrants are able to enjoy upward mobility, despite various challenges. Fertig and Schmidt (2001) conclude that second-generation migrants are, on the whole, better integrated than their parents. There are indeed strong theoretical grounds to suggest that members of the second generation are likely to achieve more favourable labour market outcomes. They generally receive a better education than their parents, exhibit greater integration into the labour market and attain higher job positions, all of which are signs of positive intergenerational mobility (Alba and Foner 2006; Algan et al. 2010; Abramitzky, Boustan and Eriksson 2014; Aydemir and Sweetman 2007). However, existing studies have also found that a relatively better labour market integration of second-generation migrants compared with the first generation cannot be taken for granted. In particular, the labour market outcomes of second-generation migrants in some countries have been observed to depend on the country of origin and on the strength of their parents’ attachment to that country (Corluy et al. 2015; Monscheuer 2023).
A key factor underpinning intergenerational mobility is the accumulation of human capital. Immigrant groups with a high degree of transmission of human capital from parents to offspring improve their position on the labour market in the second generation (Hammarstedt and Palme 2012). Second-generation migrants are often better placed to acquire human capital as a result of early integration into the educational system of the host country. For example, achieving fluency in that country’s language – a major hurdle for first-generation migrants – comes more easily at school age than in late adulthood (Lippi-Green 1997). Second generation migrants are thus likely to exhibit superior linguistic skills compared with their parents, which, in turn, can enhance their employability and labour market integration. Furthermore, the educational opportunities available in developed countries – ranging from access to formal schooling all the way to higher education – are often significantly better than those in less developed countries. Lo Iacono and Demireva (2018) note that qualifications from the host country typically generate higher returns on the labour market than foreign qualifications. This effect tends to be more pronounced among, and has important implications for, second-generation migrant women, who usually experience worse labour opportunities than their male counterparts. Second generation migrants often adapt more quickly and exhibit better outcomes than their parents in the more supportive environment provided by the host country (Fleischmann and Dronkers 2007). The phenomenon of “intergenerational catch-up” – where the gap in educational attainment between immigrants and natives is reduced for the second-generation – can thus clearly be observed (Gries, Redlin and Zehra 2022). By seizing these opportunities, second-generation migrants can build up human capital, enabling them to achieve better labour market and economic outcomes than their parents (Haug 2005). If one parent is born in the host country, the outcome is even more favourable than when both parents are foreign-born, especially if it is the mother who is native-born (Rooth and Ekberg 2003).
In addition to studies comparing second-generation migrants’ outcomes with those of their parents, there is a strand of the literature that examines the differences with respect to the rest of the native-born population. For instance, second-generation migrants in Switzerland have been found to be socially mobile, innovative and “over-performing” compared with the native Swiss (Haug 2005). With regard to education, an overwhelmingly successful integration of second-generation migrants has been observed in the United States, except in the case of some Hispanic groups (Cadena, Duncan and Trejo 2015).
In line with these findings, a number of empirical studies have pointed to favourable labour market outcomes for second-generation migrants, often when comparing specific migrant groups with the native population. For example, in nineteenth century Argentina, first generation European immigrants experienced faster occupational upgrading than natives. The second-generation migrants outperformed natives in terms of literacy, occupational status and access to property, and attained higher rates of intergenerational mobility out of unskilled occupations (Pérez 2017).2 Studying only the male migrant population in the United States, Chiswick (1977) found that second-generation migrants earned more than the sons of native-born parents. More recently, second-generation Mexican Americans have been observed to exhibit higher levels of labour force attachment than blacks (Waldinger, Lim and Cort 2007). In Denmark, Gupta and Kromann (2014) found that second generation migrants with a secondary or primary school education, in particular women, performed as well or better than their ethnic Danish “twins” (ethnic Danes with the same background facing similar labour markets) in terms of unemployment rates, job search periods and the tendency to accept lower-quality jobs. Maskileyson, Semyonov and Davidov (2021) found that economic immigrant males in Switzerland were able to attain higher income than a comparable Swiss majority group already in the first generation, whereas their female counterparts managed to do so only in the second generation.
However, several studies have also revealed the heterogeneity of second-generation migrants’ labour market outcomes. For instance, employment rates for second-generation migrants in Belgium were found to be hardly better than those for first-generation migrants, though there was considerable variation in labour market outcomes among the second generation depending on the country of origin (Corluy et al. 2015). A study focusing on Germany indicates that most male second-generation migrants experience much higher unemployment than native Germans, even when taking into account the differences in human capital, and that there is substantial heterogeneity across national origin groups (Luthra 2010). Another study based on German data has highlighted that, at the transition from primary to secondary school, second-generation migrants receive worse grades and teacher recommendations for secondary-school tracks than natives, suggesting that immigrants are disproportionately affected by prevailing social inequalities (Lüdemann and Schwerdt 2013). Moreover, the authors provide evidence that these inequalities are having a negative impact on the future labour market performance of second-generation migrants. In the Netherlands, second-generation migrants generally achieve lower educational outcomes than their native Dutch peers, with significant variation depending on the country of origin of the immigrant parents (van Ours and Veenman 2003). With regard to small businesses, Efendic, Andersson and Wennberg (2016) find that Swedish firms run by second-generation migrants from member countries of the Organisation for Economic Co-operation and Development (OECD) exhibit higher growth rates than those run by natives, whereas the reverse is true of firms run by second-generation migrants from non-OECD countries, which suggests that “economic integration in terms of small business growth [among] immigrants in Sweden is characterized by segmented rather than universal assimilation.”3 In other words, immigrants and their children from countries that closely resemble the host country achieve social and economic integration more quickly than those from less similar countries, and this has various implications for the growth of small firms.
Furthermore, other studies have highlighted how second-generation migrants in some countries may be disadvantaged compared with the first generation, especially in the United States. Immigrants in that country earned more than natives in 1940, while their US born children earned more than natives in 1970. However, the difference was smaller between second-generation individuals and natives than between first-generation individuals and natives, which indicates regression towards the native mean (Borjas 1992, 1993). A phenomenon described as “second-generation decline” may be observed in the United States, where the children of poor immigrants, especially dark-skinned ones, are often unable to obtain jobs in the mainstream economy (Gans 1992).
The existing literature thus illustrates diverse adaptation outcomes among second generation migrants, which range from high educational and economic achievement to underachievement and marginalization, depending on socio-economic factors, community support and racial or ethnic barriers (Portes, Fernández-Kelly and Haller 2009). Similarly, Alba and Foner (2006) note that outcomes can vary widely depending on the national origin, racial background and community context of the immigrant families. There is also regional variation owing to cultural and historical factors. For example, second-generation migrants in northern Italy have been found to generally achieve better educational outcomes than their counterparts in the south (Ballarino and Panichella 2015). A cross-national analysis of the educational attainment of Turkish second-generation migrants in Austria, France and Sweden highlights how institutional arrangements can likewise play a part in shaping the intergenerational mobility process (Schnell 2014). Significantly, the levels of educational achievement among second-generation migrants in German-speaking Switzerland are higher than in Germany (Kunz 2016). As observed by Algan et al. (2010), for first- and second-generation migrants across France, Germany and the United Kingdom of Great Britain and Northern Ireland, there are significant disparities in employment rates and income levels compared to the native populations. Other forms of cultural context are also important in this regard. For instance, a study drawing on European Social Survey data has pointed to the impact that formal and informal institutions in the country of origin may have on aspects such as second generation migrants’ tolerance towards gay men and lesbians or their attitudes towards women working (Berggren, Ljunge and Nilsson 2019). In the United States, findings from a recent study indicate that the attachment of parents to the country of origin is a key factor in explaining the labour market outcomes of second-generation migrants. In particular, children whose parents are strongly attached to their country of origin speak English less frequently and more poorly and perform worse at school than their peers with parents who are not so attached (Monscheuer 2023). Further analysis by the author suggests that such strong family ties to the country of origin can have negative long-term effects on labour market performance.
Finally, there is a divergence between public perceptions and the actual extent of economic and social integration of migrants. The general public tend to hold negative views about the integration level of migrants that are not borne out by statistics, especially when it comes to employment, crime rates and social assimilation (Fertig and Schmidt 2001). On the other hand, more immigration-restrictive policies can lead to reduced assimilation of second-generation migrants by reinforcing cultural identities that are distinct from mainstream society (Galli and Russo 2019).
Data and methodology
2.1. Defining second-generation migrants
There is no universally accepted definition of second-generation migrants. However, the most common definitions are those widely used by organizations such as Eurostat and the OECD. As defined in the European Migration Network’s Asylum and Migration Glossary, a second‑generation migrant is “a person who was born in and is residing in a country that at least one of their parents previously entered as a migrant”.4 Put slightly differently, second‑generation migrants are persons who are native-born and who either have one foreign-born parent and one native-born parent or have two foreign-born parents (Eurostat 2011; Falcke, Meng and Nollen 2020). Within the framework of its Programme for International Student Assessment (PISA), the OECD (2023) defines a “second-generation immigrant student” as a child born in the country of assessment with at least one parent born outside that country.
In a study dealing with Switzerland, Ruspini (2010) points out that the notion of “second‑generation migrants” was first introduced into Swiss political discourse in the 1980s following a report by the Federal Commission for Foreigners that stated: “The ‘second generation of foreigners’ shall be understood to mean children born in Switzerland of foreign parents who came here as immigrants, and also children who entered Switzerland for the purposes of family reunification, insofar as they have completed the greater part of their schooling in our country.”5
For the purposes of statistical identification, two definitions of “second-generation migrant” are used in this paper. According to the first, an individual is considered a second-generation migrant if their country of birth matches the host country, but their mother’s country of birth is different from the host country. This is used as our main specification in the various analyses, and the corresponding results are presented in the main text. The decision to focus primarily on maternal country of birth is guided by the fact that a mother’s identification with the host country was found to significantly influence some of the life outcomes of her children, in particular those related to educational attainment and even earnings (Schüller 2015; Ramakrishnan 2004). The robustness of the estimates obtained was checked by using a second definition that applies the same criterion to the father’s country of birth. The corresponding results, presented in the appendix, are consistent with those based on the definition using the mother’s country of birth.
In the quantitative analysis presented in Chapters 4 and 5, second-generation migrants are compared with the rest of the population born in the same country. This makes it easier to assess the relative situation of second-generation migrants, as people born abroad are likely to have encountered very different experiences and challenges in terms of labour market integration. In addition to having to overcome the legal hurdles associated with settling in the country of destination, many of those born abroad may have received part of their education in education systems that are different from those in their country of destination, which gives rise to further obstacles (for example, with regard to the recognition of qualifications).
2.2. A sample of household surveys from 32 countries
Employing the criteria described in the previous section, we identified second-generation migrants from 32 countries using data from labour force surveys and other household surveys contained in the ILO Microdata Repository,6 which covers more than 160 countries. The surveys selected include information on the employment status and earnings of household members, in addition to the country of birth of individuals and their parents. With regard to job characteristics and earnings, the estimates reported in this paper are for the main jobs of individuals.
Given that second-generation migrants are likely to also work part-time,7 the analysis focuses on gross hourly wages as well as monthly wages in order to eliminate variation in earnings due to differences in working time.
Our final working database comprises 32 countries, drawn from different regions of the world, though most of them are developed and high-income countries. There are 30 European countries,8 along with Australia and the United States, in the database. Among the countries included, 27 are OECD member countries, 3 are OECD accession candidate countries and 2 are non‑OECD countries.9 Overall, our analysis covers six non-members of the European Union. Table A1 in the appendix provides a detailed breakdown of the countries selected and the corresponding survey years.
The analysis of wages and income from self-employment is restricted to countries with surveys that include the earnings of workers and feature a sufficient number of respondents (specifically wage employees and the self-employed) who are second-generation migrants to allow these dimensions to be studied properly.
When averages are estimated for the whole sample, or by country income group, each country is weighted equally. This makes it possible to focus on the role of national institutions and policies. Weighting each country by its working population would have caused the results to be driven mainly by the more populous countries.
In view of certain short-term disruptions linked to the COVID-19 pandemic, surveys conducted in 2020 were not considered to avoid possible discrepancies in data collection processes. During that period, many national statistical offices adapted their methods to conform to the social distancing measures implemented in their countries. Accordingly, most of the surveys selected are from 2022 (28 countries), with only a few from 2021 (3 countries) and 2023 (1 country).
Finally, it is worth noting that the countries in the sample apply various policies based on either jus soli (birthright citizenship) or jus sanguinis (citizenship by descent). The different approaches adopted with regard to these two principles may influence the labour market integration of second-generation migrants – in particular, through the impact that citizenship has on social integration and on access to employment (for example, some countries restrict access to public employment to national citizens). In Europe, the principle of jus sanguinis is broadly implemented. Reviewing citizenship policies in several European countries, Bauböck et al. (2013) found that jus sanguinis citizenship was available in each country surveyed and was the main channel for acquiring citizenship. In contrast, the authors observed significant differences in the application of jus soli across Europe. Countries such as Belgium, France, Germany, Greece, Ireland, Luxembourg, the Netherlands, Portugal and Spain were found to provide jus soli citizenship either at birth or after birth for those born on their territory, while at the other end of the spectrum, Iceland, Latvia, Lithuania, Montenegro, North Macedonia, the Republic of Moldova, Sweden and Türkiye were found to have no jus soli provisions apart from those for foundlings and stateless children. The situation in Europe stands in stark contrast with that in North America, where Canada and the United States offer citizenship to all children born on their territory. In Australia, jus solis was the prevailing principle until 1986, when amendments were introduced to qualify the acquisition of birthright citizenship (Thwaytes 2017).
Descriptive statistics
Across the sampled countries, the average share of second-generation migrants in the working-age population is 8.2 per cent (8.5 per cent when applying our second working definition from section 2.1, which uses paternal rather than maternal country of birth), with sex-disaggregated values of 8.5 per cent for men and 8.0 per cent for women. However, as can be seen from an “intensity map” showing the share of second-generation migrants in the working-age population in each country studied (figure 3.1), there are notable differences between countries. Applying the second working definition gives similar results (see figure A1 in the appendix).
Figure 3.1. Share of second-generation migrants in the working-age population in each of the sampled countries
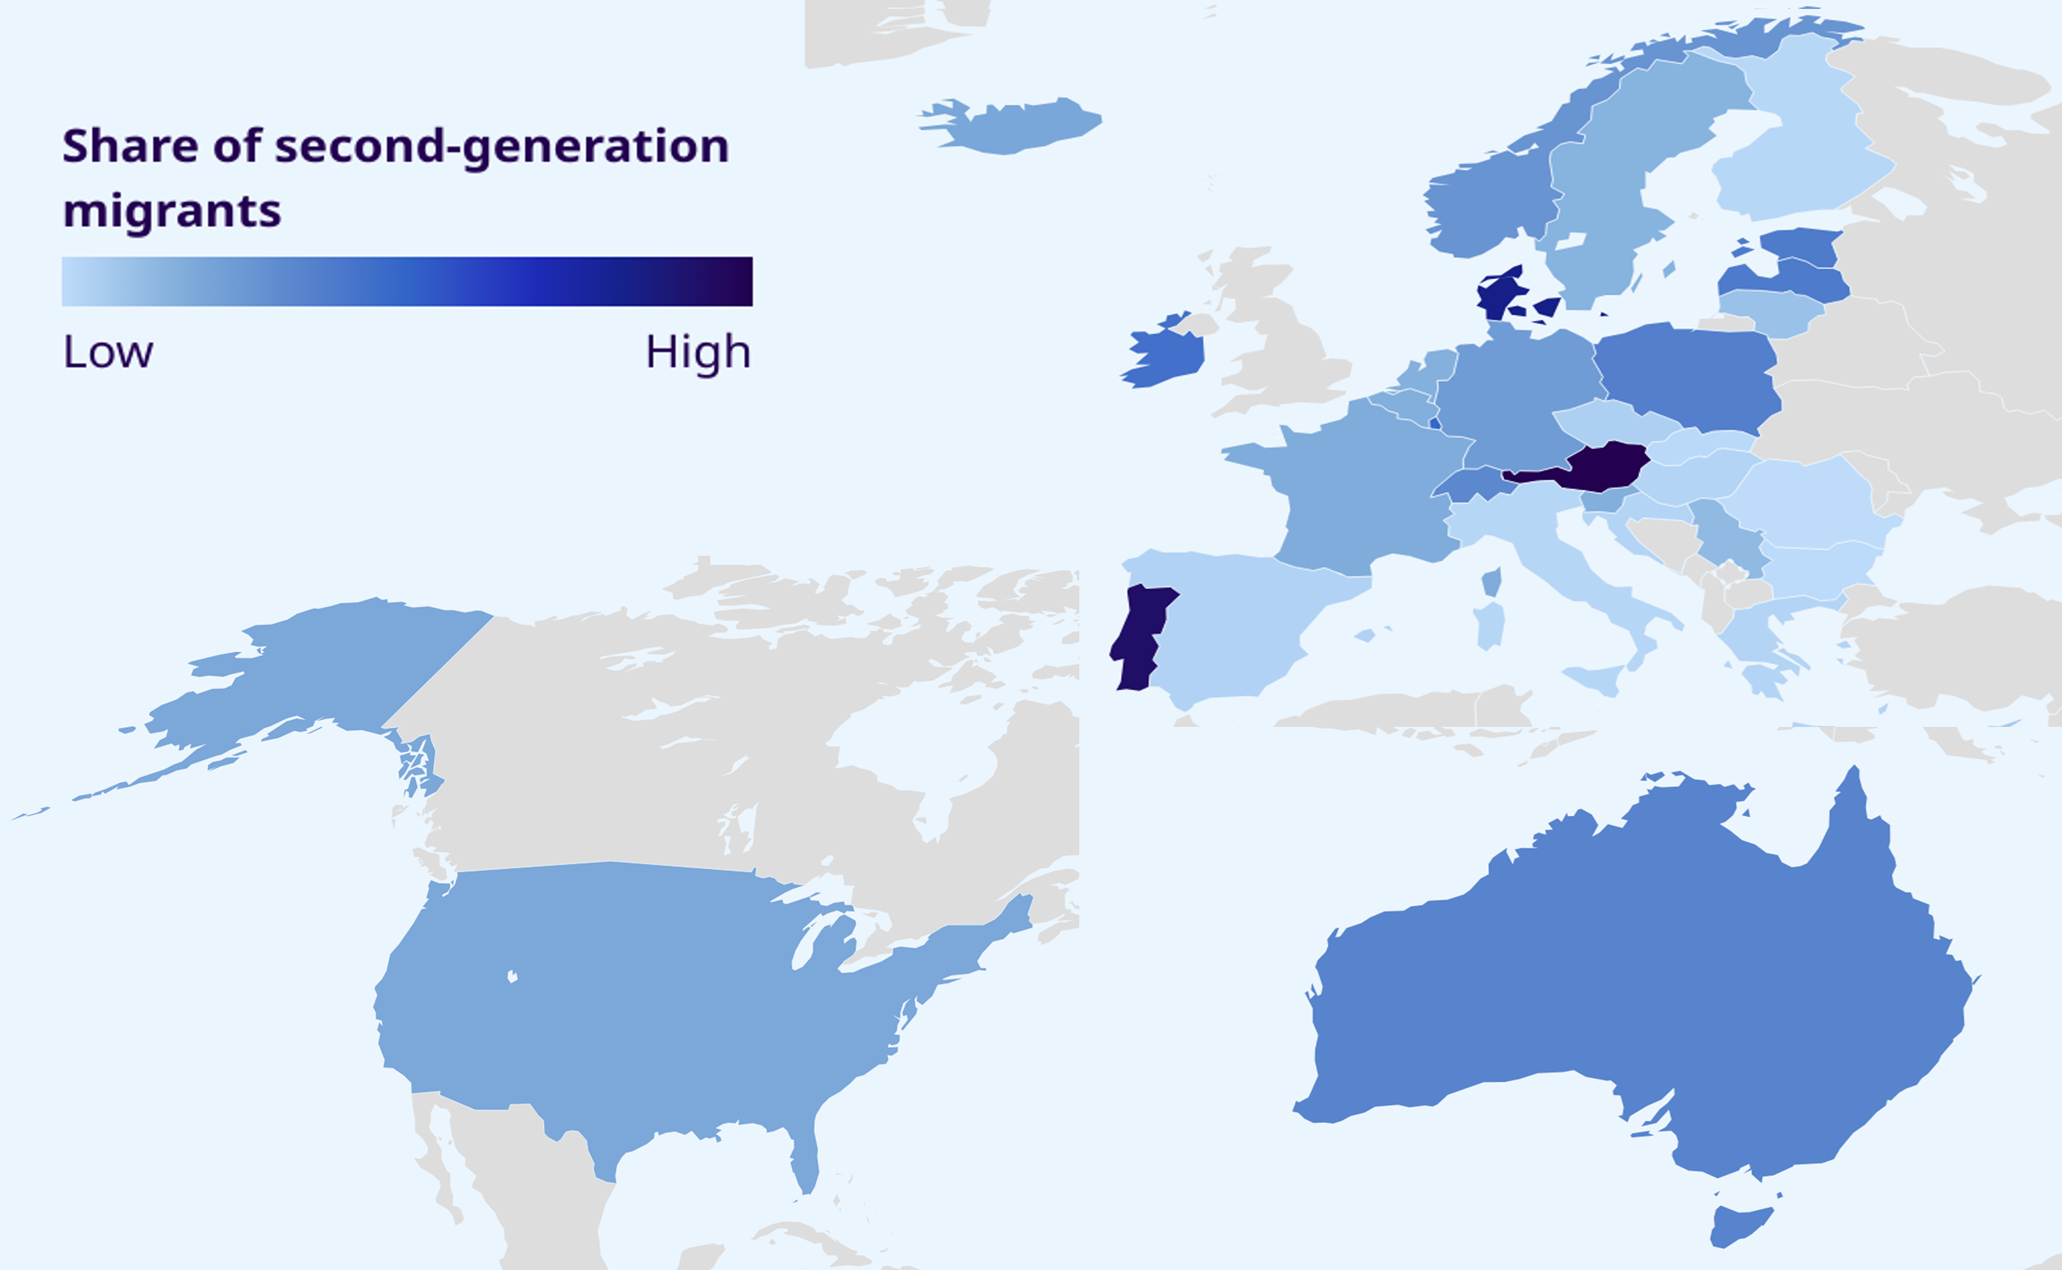
Source: ILO Harmonized Microdata collection (ILOSTAT), 2022 or the latest available year.
Figure 3.2 compares the age composition of second-generation male and female migrants across all countries in the sample with that of the rest of the native-born working‑age population. As can be seen, young people (those aged between 15 and 24 years) account for a larger proportion of the population group of second-generation migrants than for the rest of the working-age population born in the same country.
Similarly, figure 3.3 compares the distribution of second-generation male and female migrants by education level with that of other native-born people of working age. As can be seen, second-generation migrants tend to exhibit lower educational attainment than the rest of the native-born population. In particular, a larger share of the second-generation migrant population has a basic education only.
Figures A2 and A3 in the appendix present the same comparisons using our second working definition of “second-generation migrant”.
Figure 3.2. Age composition of working-age second-generation migrants and the rest of the native-born working-age population, by sex (percentage)
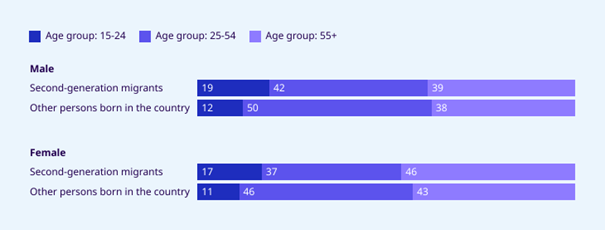
Note: The values reported are averages for the 32 countries in the sample.
Source: ILO Harmonized Microdata collection (ILOSTAT), 2022 or the latest available year.
Figure 3.3. Distribution of working-age second-generation migrants and the rest of the native-born working-age population by education level and sex (percentage)
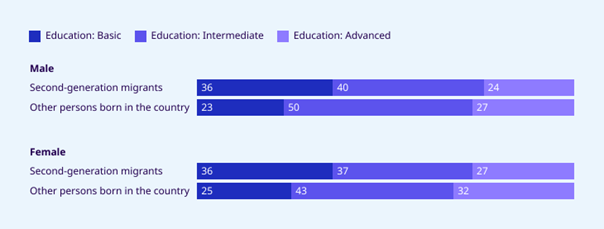
Note: The values reported are averages for the 32 countries in the sample.
Source: ILO Harmonized Microdata collection (ILOSTAT), 2022 or the latest available year.
Lastly, figure 3.4 compares the distribution of second-generation male and female migrants by occupational category with that of other native-born people of working age. On average across the countries studied, there is a higher share of clerical, service and sales workers among second-generation migrants than among the rest of native-born workers. Managers, professionals and technicians also appear to be slightly over-represented among second‑generation male migrants. The estimates obtained using the definition of second‑generation migrants based on paternal country of birth are similar, as can be seen in figure A4 in the appendix.
Figure 3.4. Distribution of second-generation migrant workers and other native-born workers in employment by occupational category and sex (percentage)
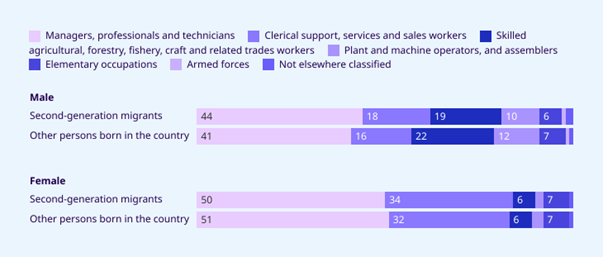
Note: The values reported are averages for the 32 countries in the sample.
Source: ILO Harmonized Microdata collection (ILOSTAT), 2022 or the latest available year.
These simple descriptive statistics highlight the socio-demographic particularities of the population group of second-generation migrants. Since labour market outcomes are likely to be impacted by specific characteristics, especially those related to age and education, taking the socio-demographic composition of second-generation migrants into account is essential when comparing their outcomes with those of the rest of the native-born population. In section 4.1, we accordingly discuss a methodology for comparing the labour market outcomes of second-generation migrants with those of the rest of the population while controlling for factors that could potentially skew the results.
Employment of second-generation migrants
4.1. A methodology for analysing the differences in employment outcomes between second-generation migrants and other native born people
The labour market outcomes observed for second-generation migrants may differ from those of the rest of the population born in the same country because of differences in socio‑demographic characteristics between the two population groups. For instance, lower educational attainment may reduce their chances of securing a job. On the other hand, the over‑representation of young people among second-generation migrants could also have an impact on labour force participation rates. When analysing discrepancies in labour market outcomes, it is therefore crucial to take into account the socio-demographic structure of the second-generation migrant population.
To that end, the econometric technique of logistic regression was applied to the data set constructed from the pooled country surveys selected for our analysis (see box 4.1 for details of the technique). This makes it possible to assess how being a second‑generation migrant influences the likelihood of various labour market outcomes, while simultaneously disentangling this effect from other observed factors such as educational attainment and age.10 In other words, the analysis aims to assess the differences in labour market outcomes between second-generation migrants and the rest of the native-born population, controlling for educational attainment and age. Such a methodology is critical for proper analysis, as existing studies have emphasized the role played by human capital variables, such as education, in the labour market integration of migrants and their descendants.
While certain other variables are also likely to drive the labour market outcomes of second‑generation migrants to some extent, they were not included in the present regression analysis. In particular, as noted in our literature review (see Chapter 1), ethnicity and country of origin may help to explain some of the observed differences between second-generation migrants and the rest of the native-born population. However, such information was not available in every country survey included in the sample.11 The average values presented in this paper may therefore not necessarily reflect the situation of each subgroup of second‑generation migrants when broken down by country of origin. To ensure maximum comparability across countries, only variables indicating education and experience were used when estimating the regressions.12 Thus, it is important to emphasize that the estimates presented here do not take into account potential unobservable characteristics that could influence the labour market participation of second-generation migrants. A further caveat has to do with the issue of endogeneity due to selection bias. When estimating the probability of unemployment (or the probability of being a wage employee), we considered only people participating in the labour market (or those employed when estimating the probability of being a wage employee), which may have skewed the results. Consequently, we can only deduce controlled association, but not pure causality, between being a second-generation migrant and the various labour market outcomes studied.
Box 4.1. Estimating the effect of being a second-generation migrant on the probability of selected labour outcomes
To quantify the effect of being a second-generation migrant on the probability of labour force participation, unemployment and wage employment, a logistic regression model is estimated separately for the whole population, for men and for women for each country in the sample (listed in table A1 in the appendix). This econometric approach involves estimating the parameters α, γ and β in the following equation:

where P(Y) is the probability that Y happens, with Y referring, variously, to labour force participation, unemployment and being a wage employee (as opposed to being self-employed). In equation (1), α is a constant, SGM is a dummy indicating whether a survey respondent is a second-generation migrant or not, and X denotes a set of control variables.
For labour market participation and unemployment, the control variables are educational attainment (lower secondary level or below = “basic”; upper secondary level = “intermediate”; and above secondary level = “advanced”) and age group (15–24 years, 25–55 years and 55+ years).
When estimating the probability of wage employment, the control variables also include the respondent’s occupation according to the International Standard Classification of Occupations (ISCO 08), with the ISCO-08 major groups aggregated into six categories (“Managers, professionals and technicians”, “Clerical support, services and sales workers”, “Skilled agricultural, forestry, fishery, craft and related trades workers”, “Plant and machine operators, and assemblers”, “Elementary occupations” and “Armed forces”). This allows one to control for possible differences in employment status that could be due to the type of occupation pursued.
The above model is used to estimate the results reported in table 4.1 for each country, which are presented in the form of “average marginal effects”. They correspond to the average increase (or decrease) in the likelihood of the event Y (that is, labour force participation, unemployment or wage employment) induced by the event “SGM = 1” (being a second-generation migrant).
We also perform a pooled analysis covering all the 32 countries in our sample and another pooled analysis covering just the European countries. This estimation additionally uses a country dummy to allow for country-fixed effects. These results are presented in the two rows with all values in bold in table 4.1, again as average marginal effects.
4.2. Employment outcomes of second-generation migrants
On average across countries, second-generation migrants are less likely to participate in the labour force and more likely to be unemployed
In most countries, being a second-generation migrant has a negative impact on the likelihood of labour market participation compared with other people born in the same country, even after controlling for age and educational attainment. As may be seen in table 4.1, in all the 16 countries with statistically significant estimates, except for Austria, Czechia, Sweden and Switzerland, second-generation migrants are less likely to participate in the labour force than other native-born people. This pattern is also strongly reflected in the sex-disaggregated estimates.
On average across countries, being a second-generation migrant reduces the likelihood of labour market participation by 7.5 percentage points in the overall population, with a decrease of 9.5 percentage points for men and 5.8 percentage points for women (see the very last row in table 4.1). This trend can be observed both for European countries as a whole and in the United States.
Considerable heterogeneity is nevertheless observable across countries where second‑generation migrants are less likely to participate in the labour market. For example, compared with other such countries, second-generation migrants in Poland, Iceland, Norway and Denmark appear much less likely to participate in the labour market than other native-born individuals. This appears to be in line with previous analysis based on a sample of OECD countries, which showed, in particular, that Scandinavian countries (in this case including Sweden) had a relatively large gap between the employment rates of natives and second‑generation migrants, even after controlling for educational attainment (OECD 2007).
Several reasons may be adduced to explain the lower participation rates of second-generation migrants. In particular, labour market barriers created by factors such as discrimination, relatively low returns to participation in the workforce and specific institutional arrangements could all negatively affect their labour market attachment and deter some of them from participating, analogously to the mechanisms that have been described for groups such as women and older workers (Winkler 2016; Watermann, Fasbender and Klehe 2023). Automatic birthright citizenship in Australia and the United States could be one reason why being a second-generation migrant in those two countries is slightly less detrimental to the likelihood of participating in the labour market than is the case in Europe on average, where such schemes are rarely used.
However, low labour force participation may also be explained by additional factors. For instance, the fact that the likelihood of second-generation migrants in Denmark being unemployed is relatively similar to that of other native-born workers (see the middle panel in table 4.1) despite their being less likely to participate in the labour force could suggest that the latter phenomenon is partly due to factors such as their enrolment in education or training. In that regard, recent analysis has found that the descendants of migrants are over‑represented in Danish universities and business schools (European Commission 2021).
As a robustness check, we performed a similar analysis using our second definition of “second‑generation migrant” (that is, where paternal country of origin is used to identify migrant background). Table A2 in the appendix shows the results.
When it comes to unemployment, being a second-generation migrant appears to have a positive impact on unemployment outcomes in most countries. Indeed, the likelihood of being unemployed increases in a statistically significant manner when the respondent is a second-generation migrant in 13 countries of the sample and decreases in only 3 countries (see the central panel of table 4.1).13 On average across countries, the probability of being unemployed, when educational attainment and age are taken into account, is higher by 1 percentage point for second‑generation migrants.
Like the estimates related to labour market participation, those for unemployment are likely to be reflected in the overall income gap between second-generation migrants and the rest of the native-born population, with the challenges of reduced job search opportunities possibly compounded by their being less well-integrated into society. In that regard, some studies have already highlighted that second-generation migrants experience lower employment rates and often find themselves in less stable job situations (Corluy et al. 2015). Minorities from less developed countries have been found to be particularly disadvantaged with regard to education, access to the labour market and occupational attainment (Heath, Rothon and Kilpi 2008).
In the present analysis, the variables included in our econometric model do not allow one to take into account all the aspects of human capital that can help to explain the higher levels of unemployment observed among second-generation migrants, including such factors as language proficiency (Crul and Vermeulen 2003). Behavioural characteristics in the labour market may also play a role: for instance, second-generation migrants were found by Constant et al. (2011) to be significantly more willing than other native-born persons to take risks and less likely to have a low amount of “positive reciprocity”.14 The same authors point out that individuals with a greater willingness to take risks have a lower employment probability after unemployment entry. This may be explained by the fact that such individuals, when faced with a job offer, tend to expect higher gains of continuing to look for a job. Such behaviour is usually reflected in a higher “reservation wage”, that is the lowest wage someone is willing to accept for a job. Finally, discrimination by employers against certain groups may be another factor behind the higher unemployment levels of second-generation migrants. Field experiments conducted in various countries have paired curricula vitae featuring native names and similar curricula vitae featuring names from different origins, shedding light on the discrimination faced by various ethnic groups in the course of the recruitment process (Ahmad 2020; Midtbøen 2016; Arnoult 2023).
Table 4.1. Effect of being a second-generation migrant on the probability of labour force participation, unemployment and wage employment, by country (percentage points)
|
Country |
Labour force participation |
Unemployment |
Wage employment |
||||||
|---|---|---|---|---|---|---|---|---|---|
|
All |
Men |
Women |
All |
Men |
Women |
All |
Men |
Women |
|
|
Europe |
|||||||||
|
Austria |
1.7* |
-0.1 |
3.6*** |
-0.8 |
-0.7 |
-1.0 |
13.3*** |
13.3*** |
13.4*** |
|
Belgium |
-3.7** |
-2.9 |
-4.9** |
4.0*** |
3.0** |
5.0*** |
2.3 |
2.6 |
2.5 |
|
Bulgaria |
-8.1 |
-11.5 |
-4.7 |
-5.0 |
4.9 |
0*** |
3.4 |
4.2 |
-0.1 |
|
Croatia |
-0.3 |
2.1 |
-2.3 |
9.8*** |
14.7*** |
-0.2 |
-0.6 |
0.3 |
-1.2 |
|
Cyprus |
-2.1 |
2.1 |
-6.6* |
-6.1* |
-4.0 |
-11.1 |
3.8 |
-1.9 |
16.4* |
|
Czechia |
4.8** |
4.3* |
5.1* |
-0.2 |
-0.2 |
-0.4 |
0.1 |
0.8 |
-0.9 |
|
Denmark |
-19.3*** |
-21.0*** |
-17.1*** |
0.1 |
0.1 |
-0.1 |
-2.4** |
-2.1 |
-2.8** |
|
Estonia |
-11.5*** |
-17.4*** |
-5.0*** |
1.8 |
4.4** |
-1.0 |
-0.7 |
2.9 |
-3.9* |
|
Finland |
-3.2 |
-10.0* |
2.3 |
4.9 |
6.5 |
2.4 |
14.3*** |
18.3** |
9.8* |
|
France |
-0.9 |
-0.3 |
-1.4 |
3.9*** |
4.4*** |
3.3*** |
0.7 |
2.1 |
-0.5 |
|
Germany |
-3.5*** |
-3.3*** |
-3.9*** |
0.7* |
0.5 |
0.9* |
0.1 |
0.9 |
-0.5 |
|
Greece |
-2.7 |
-3.5 |
-1.2 |
5.8 |
0.4 |
11.2* |
15.4** |
31.3*** |
-1.7 |
|
Hungary |
0.1 |
-6.5* |
6.5 |
-0.8 |
2.0 |
-5.5 |
-1.1 |
-4.1 |
1.7 |
|
Iceland |
-28.6*** |
-27.8*** |
-28.7*** |
1.8* |
1.8 |
2.0 |
-4.5** |
-6.1** |
-2.0 |
|
Ireland |
-6.2** |
-13.1*** |
-1.8 |
3.9*** |
4.3** |
4.2** |
0.7 |
2.8 |
-1.3 |
|
Italy |
-4.9 |
-3.8 |
-5.2 |
0.9 |
1.4 |
0 |
1.8 |
3.2 |
0.3 |
|
Latvia |
-4.8*** |
-3.2** |
-4.6*** |
1.4 |
-0.3 |
2.7** |
-0.1 |
-0.9 |
0.8 |
|
Lithuania |
-2.1 |
-1.9 |
-1.8 |
-0.1 |
-2.1 |
1.6 |
1.2 |
4.3 |
-0.7 |
|
Luxembourg |
-3.2 |
-2.5 |
-4.3 |
2.2** |
1.5 |
3.5* |
1.0 |
2.7 |
-0.2 |
|
Netherlands |
-4.1** |
-3.9* |
-4.2* |
1.7* |
1.0 |
2.4* |
-2.9 |
-5.0 |
-0.7 |
|
Norway |
-23.4*** |
-25.3*** |
-20.8*** |
1.5*** |
2.6*** |
0 |
-1.0 |
2.1 |
-2.9** |
|
Poland |
-31.4*** |
-36.2*** |
-23.9*** |
-0.5 |
0.2 |
-1.5 |
2.3 |
3.0 |
-1.0 |
|
Portugal |
-7.8*** |
-7.3*** |
-8.3*** |
1.2 |
2.9* |
-0.3 |
0.7 |
1.7 |
-0.1 |
|
Romania |
7.4 |
-4.2 |
20.6** |
0*** |
0*** |
0*** |
-2.7 |
0*** |
-11.0 |
|
Serbia |
0.2 |
1.1 |
-0.7 |
-5.9** |
-6.4* |
-4.3 |
2.5 |
3.5 |
2.2 |
|
Slovakia |
4.0 |
-0.4 |
6.2 |
-15.7** |
-12.2* |
0*** |
-2.8 |
-8.1 |
0 |
|
Slovenia |
-1.2 |
-4.1 |
2.1 |
1.7* |
0.2 |
2.7** |
2.2 |
2.4 |
1.1 |
|
Spain |
-0.1 |
-1.1 |
0.7 |
3.7* |
4.9* |
2.1 |
1.7 |
1.7 |
1.2 |
|
Sweden |
5.0*** |
3.7* |
6.1*** |
-0.8 |
0.5 |
-2.5 |
4.8*** |
5.2* |
4.2* |
|
Switzerland |
7.1*** |
9.3*** |
4.3* |
0.5 |
0.8 |
0 |
0.5 |
3.4* |
-2.4 |
|
Europe |
-7.9*** |
-10.2*** |
-5.9*** |
1.1*** |
1.4*** |
0.9** |
2.1*** |
3.3*** |
0.9* |
|
Rest of the world |
|||||||||
|
Australia |
-0.3 |
1.0 |
2.2 |
-0.9 |
-0.2 |
-1.9* |
1.1 |
0.8 |
2.0 |
|
United States |
-2.4*** |
-1.8*** |
-3.1*** |
0.7*** |
0.9*** |
0.5*** |
0.7*** |
0.6*** |
0.9*** |
|
All countries |
-7.5*** |
-9.5*** |
-5.8*** |
1.0*** |
1.3*** |
0.8** |
2.0*** |
3.0*** |
1.0* |
Note 1: ***, ** and * indicate that the result is statistically different from zero at the 1%, 5% and 10% level of significance, respectively.
Note 2: The results for labour force participation refer to the whole working-age population. Those for unemployment refer to the population in the labour force. Those for status in employment (wage employment versus self-employment) refer to the employed population.
Note 3: The labour force participation and unemployment models control for age and education. The model used to analyse status in employment (wage employment versus self-employment) features occupational category as an additional control.
Source: Analysis based on ILO Harmonized Microdata collection (ILOSTAT), 2022 or the latest available year. See table A1 in the appendix for more details.
Second-generation migrants tend to work as employees
The third set of results from the econometric models estimated here is presented in the rightmost panel of table 4.1 (for a robustness check using the alternative definition of “second‑generation migrant”, see table A2 in the appendix). These estimates indicate that second-generation migrants who are in employment are often more likely to be employees than to be self-employed, even after controlling for education, age and occupational category. On average across countries, being a second-generation migrant increases the likelihood of wage employment by 2 percentage points for the overall population, with the magnitude of the effect reaching 3 percentage points for men (compared with 1 percentage point for women).15
Partly owing to the small sample size of surveys, few country-level results are statistically significant. Nevertheless, being a second-generation immigrant significantly increases the likelihood of being an employee in five countries (Austria, Finland, Greece, Sweden and the United States), whereas the opposite effect can be observed in only two countries (Denmark and Iceland). In table 4.1, some gender-related differences are also noticeable: for example, being a second-generation migrant appears to have, on average, a relatively smaller effect on the likelihood of wage employment for women in Europe.
These overall findings are in line with the results from existing studies, including those that have focused on Europe. One such study found that second-generation migrants in 2014 were the migration status group least likely to be self-employed (Eurostat 2016). Similarly, a case study conducted in Vienna revealed that the share of entrepreneurs was lower among second-generation migrants than among Austrians without a migration background, naturalized persons and immigrants (Eurofound 2010). As shown by the averages for European countries and all countries in table 4.1, the trend is towards wage employment, despite the cross-country heterogeneity.
The greater likelihood of second-generation migrants being employees may be attributed in part to their greater zeal and upskilling enthusiasm as they seek to make up for a lack of networks. For instance, Chiswick (1977) pointed to the selectivity bias in migration, whereby first-generation immigrants may have been better equipped to navigate the labour market and were more motivated than non-immigrants – qualities that they subsequently transmitted to their children.
On another note, self-employment has been found to be an employment status characterized by a significant need for integration with the host society, which is vital when running one’s own business, and for having a strong established network.16 Second-generation migrants may be at a severe disadvantage compared with the rest of the population in that regard, accounting for their greater representation in wage employment and lower participation in self-employment.
To sum up our findings on employment outcomes: we have observed that second-generation migrants fare worse than other people born in the same country when it comes to labour force participation. On average, they are also more likely to be unemployed. Finally, when they are employed, it is found that second-generation migrants are on the whole more likely to be employees than self-employed, even though several estimates at the country level are not statistically significant.
Box 4.2. Comparing the working hours of second-generation migrants and other native born workers
In addition to labour force participation and unemployment, the number of hours worked is also an important determinant of an individual’s overall employment outcome (what is sometimes referred to as the “intensive employment margin”). Although working time is not the main focus of this study, the average number of hours worked by employees who are second-generation migrants has been estimated in order to identify possible specificities among that population group.
Figure A7 in the appendix shows the average number of weekly hours worked by second-generation migrants who are wage employees versus other native-born wage employees, broken down by sex and country. Across our sample of countries, second-generation migrants tend to work similar hours to other native-born workers, although there are some countries with small disparities in working time observed between the two population groups (for example, Czechia and Ireland). Given that the working hours of second-generation migrants in some cases differ from those of the rest of the native born population, the analysis in Chapter 5 looks at gross hourly wages as well as monthly wages, so as to eliminate variation in earnings due to differences in working time.
Earnings of second-generation migrants
5.1. A methodology for analysing the differences in earnings outcomes between second-generation migrants and other native-born people
In addition to labour force participation and employment, earnings are a key labour market outcome that has a significant impact on livelihoods. However, relatively few empirical analyses have focused on earnings. In Europe, a host of studies have examined this specific labour market outcome in Sweden. For example, Behrenz, Hammarstedt and Månsson (2007) found that male second-generation migrants with parents born in other Nordic countries, Eastern Europe or southern Europe have statistically lower incomes than their native counterparts. No significant differences were observed for male second-generation migrants with parents born in Western countries or non-European countries. For female second‑generation migrants, there were no differences in income in any group, except for women with parents born in other Nordic countries. In contrast, an earlier Swedish study found that second-generation migrants with a non-European background had lower earnings as well as a lower probability of being employed than the children of natives (Rooth and Ekberg 2003). However, Hammarstedt and Palme (2012) found an overall convergence in average earnings between immigrants and natives across generations in Sweden. As for other European countries, a review of the relative situation of first- and second-generation migrants in France, Germany and the United Kingdom yielded a mixed picture regarding upward mobility among the second generation: the United Kingdom was found to have made considerable progress in closing the immigrant–native pay gap between the first and second generations, whereas progress was less clear-cut for France and Germany (Algan et al. 2010). In contrast, a more recent study based on UK data found no statistically significant progress across generations relative to natives (Ochmann 2024). Finally, in recent studies looking at the United States, the earnings of second‑generation migrants have often been compared with those of white men from later (“third+”) generations, revealing substantial disparities across ethnic groups. For example, Duncan and Trejo (2018) observed small or non-existent wage premiums (relative to third+‑generation whites) for second‑generation whites and Asians, but wage penalties for blacks and Hispanics.
Building on evidence from the existing literature, we now focus on the earnings outcomes of second-generation migrants across a selection of countries for which data on earnings are available.17 Section 5.2 examines the hourly and monthly wages and income from self‑employment received by workers who are second-generation migrants. This analysis is based on findings from a subsample of 29 countries for wages and 21 countries for self‑employment earnings, the reduced number of countries being due to the limited availability of data on earnings in household surveys (see section 2.2).
To assess the impact of specific socio-demographic characteristics of second-generation migrants on their wages (or self-employment income) relative to other employees (or self‑employed persons), an econometric technique based on the Mincer model is applied to the data from the various country surveys selected for analysis (see box 5.1 for details). This technique allows us to examine the effect of being a second-generation migrant on earnings by incorporating age, educational attainment and occupational category as controls.
As with second-generation migrants’ employment outcomes in Chapter 4, it is important to note that the estimates related to their earnings outcomes presented here do not account for potential unobservable characteristics that could influence those outcomes. Therefore, only controlled association and not pure causality can be established through this analysis.
Box 5.1. Estimating the effect of being a second-generation migrant on the earnings from wage employment and self-employment
To further explore inequalities in the labour market, we estimate the relationship between being a second-generation migrant and earnings separately for the entire population of employees (or self‑employed) and for the male and female populations across our subsample of countries (29 countries for wage employment and 21 for self-employment), using the following Mincer model:

This econometric approach involves estimating the parameters α, γ and β, where γ is our parameter of interest. The dependent variable is ln Y, where Y stands for the outcome examined:
-
hourly wages
-
monthly wages
-
monthly income from self-employment.1
In equation (2), α is a constant, is a dummy variable equal to 1 if a survey respondent is a second‑generation migrant, and denotes a vector of observable characteristics that are used as control variables.
In our specification, the control variables are educational attainment (lower secondary school or below = “basic”; upper secondary school = “intermediate”; and above secondary level = “advanced”), age and age squared, and the respondent’s occupation according to the International Standard Classification of Occupations (ISCO-08), with the ISCO-08 major groups aggregated into six categories (“Managers, professionals and technicians”, “Clerical support, services and sales workers”, “Skilled agricultural, forestry, fishery, craft and related trades workers”, “Plant and machine operators, and assemblers”, “Elementary occupations” and “Armed forces”). When estimating averages across countries, we also use country dummies to allow for country-fixed effects.
The model is estimated using the method of ordinary least squares.2 As already mentioned, the coefficient of interest is γ, which provides an estimate of the difference in earnings between second-generation migrants and other native-born workers. Its estimated values are reported in the tables of chapter 5.
1 For income from self-employment, we only look at monthly income, as the quality of the information on hours worked is often lower for this subset of the population. However, analysis of hourly income has also been undertaken and the trends look very similar. These results are available upon request.
2 Ordinary Least Squares (OLS) is an econometric technique that allows the parameters α, γ and β of equation (2) above to be estimated.
5.2. Wages of second-generation migrants
The results of estimating equation (2) are presented in table 5.1 below for hourly wages as the outcome examined (see box 5.1).18 The estimates in the table correspond to the effect of being a second-generation migrant on hourly wages. On average across the countries studied, a small hourly wage gap between second-generation migrants and other native-born employees can be observed, with the former being paid slightly less than the latter once their socio‑demographic characteristics are taken into account (specifically 4.6 per cent less on average). This result is essentially driven by the wage penalty observed across the European countries in the sample (-5.1 per cent on average). However, at the country level, the estimates are not statistically significant in most cases, which is probably due in part to the small number of observations used in the analysis. The wage penalty is nevertheless statistically significant in Belgium, Estonia, Portugal and Slovakia, as well as in Austria and Ireland for men only, and in Cyprus for women only. In the United States, a statistically significant wage premium is observed, with second-generation migrants earning 4.8 per cent higher hourly wages than other native-born employees.
Thus, from the survey data analysed here it emerges that there is a wage penalty for either male or female second-generation migrants in several countries, while a wage premium is observed only in the United States and – with a lower statistical significance – also in Hungary.
Table A3 in the appendix presents the result of the estimation for monthly wages as the outcome examined instead of hourly wages. As with hourly wages, an average wage penalty is observed for Europe, namely 4.4 per cent, contrasting with a wage premium of 4.9 per cent for the United States. The slight differences between the values in tables 5.1 and A3 may potentially be accounted for by certain specificities in the working time of second-generation migrants (see box 4.2 in Chapter 4).
The pay gaps observed between second-generation migrants and their peers born in the same country are due to various factors not taken into account in the analysis through the use of educational attainment, age and occupational category as control variables. In particular, wage penalties among second-generation migrants may reflect the challenges faced by this group that are often highlighted in the literature on migration, such as poor integration, lack of networks, limited proficiency in the majority language and discrimination (Devos et al. 2025). As for the wage premium observed in the United States, the available evidence points to how second-generation migrants there are relatively well endowed in terms of education and skills. Indeed, a US study based on longitudinal childhood data indicates that the initial gap in mathematics scores between second-generation migrants and natives closes by the end of primary school, while for non-cognitive, or “soft”, skills there is a positive gap in favour of second-generation migrants by the third year of primary school (Hull and Norris 2020). This could help to explain the slightly higher wages earned later in life by second-generation migrants, consistent with the estimates presented in table 5.1. In that regard, the relatively high performance of second-generation migrants in the United States when it comes to education and wages has been emphasized by a number of previous studies (Card 2005). As a robustness check, we applied the same econometric methodology using our second definition of “second-generation migrant”. The results are presented in tables A4 and A5 in the appendix.
Table 5.1. Effect of being a second-generation migrant on hourly wages (percentage)
|
Country |
All |
Men |
Women |
|---|---|---|---|
|
Europe |
|||
|
Austria |
-3.3 |
-4.5* |
-1.0 |
|
Belgium |
-8.7** |
-7.3 |
-11.0** |
|
Bulgaria |
-18.2 |
25.1 |
-33.3 |
|
Croatia |
2.1 |
-2.6 |
3.8 |
|
Cyprus |
-7.1 |
6.4 |
-30.5* |
|
Czechia |
1.5 |
2.7 |
-0.6 |
|
Denmark |
0.1 |
2.3 |
-3.1 |
|
Estonia |
-11.0** |
-8.0 |
-13.6** |
|
Finland |
11.4 |
-0.5 |
21.2 |
|
France |
4.0 |
5.8 |
2.2 |
|
Germany |
1.3 |
2.6 |
-1.7 |
|
Greece |
-1.9 |
-6.7 |
4.7 |
|
Hungary |
18.0* |
10.3 |
25.6* |
|
Ireland |
-6.1 |
-16.7* |
5.0 |
|
Italy |
-1.1 |
5.1 |
-8.8 |
|
Latvia |
-1.7 |
-3.2 |
-0.3 |
|
Lithuania |
9.5 |
11.2 |
9.5 |
|
Luxembourg |
-6.9 |
-9.3 |
-3.0 |
|
Netherlands |
-1.9 |
-4.1 |
-0.4 |
|
Poland |
3.5 |
1.5 |
5.7 |
|
Portugal |
-5.2* |
-0.7 |
-11.1** |
|
Serbia |
3.0 |
0.6 |
3.2 |
|
Slovakia |
-9.1** |
-18.0*** |
1.1 |
|
Slovenia |
-1.1 |
-5.9 |
5.8 |
|
Spain |
-7.1 |
-10.0 |
-3.9 |
|
Sweden |
-1.6 |
-2.5 |
-1.7 |
|
Switzerland |
2.2 |
-0.8 |
2.8 |
|
Europe |
-5.1*** |
-6.5*** |
-3.8*** |
|
Rest of the world |
|||
|
Australia |
2.3 |
1.3 |
2.1 |
|
United States |
4.8*** |
2.0** |
7.3*** |
|
All countries |
-4.6*** |
-6.0*** |
-3.4*** |
Note: ***, ** and * indicate that the result is statistically different from zero at the 1%, 5% and 10% level of significance, respectively.
Source: Analysis based on ILO Harmonized Microdata collection (ILOSTAT), 2022 or the latest available year. See table A1 in the appendix for more details.
5.3. Self-employment income of second-generation migrants
Estimates of the effect of being a second-generation migrant on monthly self-employment income (obtained using equation (2) from box 5.1 with monthly self-employment income as the outcome examined) are presented in table 5.2 for a subsample of countries for which relevant data are available.19 It appears that almost all the statistically significant estimates point to an earnings penalty for second-generation migrants who are self-employed. For European countries, we observe an average penalty of 22.3 per cent for second-generation migrants (16.5 per cent among male entrepreneurs and 27.5 per cent among their female counterparts). Overall, these results tend to confirm the potential challenges that second‑generation migrants face in setting themselves up as self-employed, as discussed in Chapter 4.20
A robustness check was performed by applying the same methodology to our second definition of “second-generation migrant”. Table A6 in the appendix shows the results.
Table 5.2. Effect of being a second-generation migrant on monthly self-employment income (percentage)
|
Country |
All |
Men |
Women |
|---|---|---|---|
|
Europe |
|||
|
Austria |
-14.6 |
8.1 |
-54.5** |
|
Belgium |
-10.7 |
-27.1 |
42.7 |
|
Czechia |
6.7 |
2.5 |
15.5 |
|
Denmark |
-21.2 |
-32.8 |
-3.8 |
|
France |
-9.4 |
-6.7 |
-18.0 |
|
Germany |
-20.1** |
-23.9** |
-15.6 |
|
Hungary |
-79.1 |
50.6 |
-281.7* |
|
Ireland |
-24.3 |
-33.4 |
-7.2 |
|
Italy |
-36.2 |
-3.0 |
-142.2*** |
|
Latvia |
-7.1 |
-22.1 |
7.6 |
|
Lithuania |
-16 |
-15.7 |
1.6 |
|
Luxembourg |
-33.1 |
-15.9 |
-144.8 |
|
Netherlands |
-100.3* |
-74.2 |
-141.4 |
|
Poland |
-5.2 |
-1.5 |
-24.1 |
|
Portugal |
-29.4** |
-23.6 |
-34.5 |
|
Serbia |
22.5 |
8.8 |
102.3*** |
|
Slovenia |
-30.8 |
-57.7 |
-14.8 |
|
Spain |
-27.3 |
8.7 |
-59.4 |
|
Sweden |
8.8 |
-1.6 |
19.0 |
|
Switzerland |
-0.3 |
3.3 |
-6.2 |
|
Europe |
-22.3*** |
-16.5* |
-27.5** |
|
Rest of the world |
|||
|
Australia |
13.7 |
11.1 |
6.1 |
|
All countries |
-20.0*** |
-14.6* |
-25.7** |
Note: ***, ** and * indicate that the result is statistically different from zero at the 1%, 5% and 10% level of significance, respectively.
Source: Analysis based on ILO Harmonized Microdata collection (ILOSTAT), 2022 or the latest available year. See table A1 in the appendix for more details.
Legal frameworks shaping the labour market experience of second-generation migrants
In the previous chapter we analysed the labour market outcomes of second-generation migrants in a large number of countries, focusing on labour force participation, unemployment, status in employment, wages and self-employment income. Although we cannot assert a direct causal relationship between being a second-generation migrant and these outcomes, the controlled associations that we have established provide a picture of their labour market experience. Specifically, a lower rate of labour force participation compared with the rest of the native-born population has been highlighted. Similarly, second‑generation migrants seem, on average, to be more likely to be unemployed. Furthermore, except in a few countries, second-generation migrants tend to be wage employees rather than self-employed when they are in employment, which is probably due to a lack of integration and limited access to the networks that are necessary to operate as an entrepreneur. With regard to earnings, statistically significant wage penalties were observed for second-generation migrants in a number of European countries, whereas a wage premium was noted in the United States.
Building on this analysis, it is essential to understand how legal frameworks can act as a further influence on the labour market experience of second-generation migrants. Such frameworks, which include international labour standards21 and national laws, play a crucial role in establishing the rights and protections afforded to workers, thereby shaping their opportunities and treatment in the job market. This chapter will explore key standards that lay the foundation for inclusive labour markets which can benefit both second-generation migrants and the rest of the population. Section 6.1 first outlines the various sets of international labour standards relevant to promoting equality of opportunity and fair labour market outcomes. These instruments are then analysed in detail, together with the related supervisory work of the Committee of Experts on the Application of Conventions and Recommendations (CEACR).22 Finally, national practices aimed at ensuring equal employment opportunities and treatment are examined in section 6.2, which provides a brief overview of how international standards are applied in different countries.
6.1. International legal standards ensuring equal employment opportunities and treatment
Before embarking on our analysis of relevant legal frameworks, it is important to clarify that second-generation migrants are not considered to be migrant workers. Indeed, they do not meet the definition of “migrant worker” contained in the Migrant Workers (Supplementary Provisions) Convention, 1975 (No. 143), namely “a person who migrates or who has migrated from one country to another with a view to being employed otherwise than on his own account”, which “includes any person regularly admitted as a migrant worker” (Art. 11(1)). However, second-generation migrants have a migration background and they are often perceived as “foreigners” by a vast majority of the population, as a consequence of their belonging to ethnic minorities and, in some cases, not possessing the nationality of the country where they live and work (Bhimji 2008; Beaman 2017). These factors can lead to discriminatory treatment, creating challenges for second-generation migrants when it comes to both social integration and labour market participation, as outlined in the quantitative analysis in Chapters 4 and 5. As discussed further down, the Discrimination (Employment and Occupation) Convention (No. 111) and Recommendation (No. 111), 1958,23 provide crucial orientation on how to tackle discrimination and improve integration into the labour market.
Other international labour standards are relevant in addressing the discrimination and inequalities that second-generation migrants may face at work – for instance, the Employment Policy Convention (No. 122) and Recommendation (No. 122), 1964,24 and the Human Resources Development Convention, 1975 (No. 142).
Alongside the above-mentioned instruments, international labour standards dealing with wages are key to ensuring equality of treatment in employment for second‑generation migrants. These include the Minimum Wage-Fixing Machinery Convention, 1928 (No. 26), the Minimum Wage Fixing Convention (No. 131) and Recommendation (No. 135), 1970, and the Protection of Wages Convention, 1949 (No. 95) (see box 6.1).25
The focus of this section will be mainly on standards related to non-discrimination and equal treatment, given the role that they play in shaping the employment outcomes of second‑generation migrants.
Finally, it is important to look at the supervisory work of the CEACR as it supports the implementation of international labour standards at the national level. The category of workers considered in this study falls within the scope of the Committee’s comments concerning workers in general. On some occasions, the CEACR has explicitly referred to second-generation migrants and workers with a migration background in its observations and direct requests. Such references have occurred mainly when the Committee is reviewing the application of provisions on non-discrimination and equality of opportunity and treatment.
Box 6.1. International labour standards dealing with non-discrimination, equal treatment and wages
Non-discrimination and equal treatment
-
Discrimination (Employment and Occupation) Convention, 1958 (No. 111)
-
Employment Policy Convention, 1964 (No. 122)
-
Human Resources Development Convention, 1975 (No. 142)
-
Discrimination (Employment and Occupation) Recommendation, 1958 (No. 111)
-
Employment Policy Recommendation, 1964 (No. 122)
Wages
-
Minimum Wage-Fixing Machinery Convention, 1928 (No. 26)*
-
Minimum Wage Fixing Convention, 1970 (No. 131)
-
Protection of Wages Convention, 1949 (No. 95)
-
Minimum Wage Fixing Machinery (Agriculture) Convention, 1951 (No. 99)*
-
Minimum Wage Fixing Recommendation, 1970 (No. 135)
-
Minimum Wage-Fixing Machinery (Agriculture) Recommendation, 1951 (No. 89)*
* Instrument with interim status.
Source: ILO NORMLEX database.
International labour standards dealing with non-discrimination and equal treatment
Second-generation migrants tend to experience poor integration and face discriminatory treatment, which may partly explain their lower labour market participation and slightly higher unemployment rates on average, although outcomes vary substantially across countries, as described in section 4.2. International labour standards aimed at countering discrimination on the grounds of race, colour and national extraction play a crucial role in enabling the participation and equal treatment of second-generation migrants in the labour market, particularly in countries with a pattern of ethnic discrimination and citizenship schemes based on descent.
The Discrimination (Employment and Occupation) Convention, 1958 (No. 111), provides significant guidance on this score. It seeks to eliminate any discrimination in respect of employment and occupation and to promote equality of opportunity and treatment (Art. 2). Discrimination on the basis of “race, colour, sex, religion, political opinion, national extraction or social origin” is covered (Art. 1(1)(a)). Convention No. 111 also stipulates that special measures designed to meet the particular needs of persons who, for reasons such as social or cultural status, require special protection or assistance shall not be regarded as discrimination (Art. 5(2)). The accompanying Discrimination (Employment and Occupation) Recommendation, 1958 (No. 111), recommends that all persons should, without discrimination, enjoy equality of opportunity and treatment in respect of, inter alia, remuneration for work of equal value (para. 2(b)(v)).
The same principles are reiterated in the Employment Policy Convention (No. 122) and Recommendation (No. 122), 1964. These instruments call upon Member States to pursue an active policy aimed at ensuring “freedom of choice of employment and the fullest possible opportunity for each worker to qualify for, and to use his skills and endowments in, a job for which he is well suited, irrespective of race, colour, sex, religion, political opinion, national extraction or social origin” (Arts 1(1) and 1(2)(c) of the Convention and paras 1(1) and 1(2)(c) of the Recommendation).
Finally, the Human Resources Development Convention, 1975 (No. 142), promotes non‑discrimination in the field of vocational guidance and training. It specifically requires Member States to adopt vocational guidance and training policies and programmes that “encourage and enable all persons, on an equal basis and without any discrimination whatsoever, to develop and use their capabilities for work” (Art. 1(5)). Moreover, it stipulates that comprehensive employment information and guidance are to be made available to everyone (Art. 3).
The supervisory practice of the Committee of Experts on the Application of Conventions and Recommendations
The CEACR has dealt with inequalities at work affecting second-generation migrants mainly in the context of Convention No. 111, when considering discrimination against individuals with a migration background26 on the grounds of race, colour or national extraction (see box 6.2). The selection of comments related to Convention No. 111 offered here is based on the results presented in section 4.2, with a particular focus on comments addressed to those countries where being a second-generation migrant was associated with a reduction in the likelihood of labour market participation (table 4.1). Among these, relevant comments expressly mentioning second-generation migrants or individuals with a migration background were found, in particular, for Denmark, Germany and the Netherlands.
Box 6.2. How “race, colour and national extraction” are understood in the supervisory practice of the Committee of Experts on the Application of Conventions and Recommendations related to the Discrimination (Employment and Occupation) Convention, 1958 (No. 111)
In a general observation on discrimination based on race, colour and national extraction adopted in 2018, the Committee of Experts on the Application of Conventions and Recommendations (CEACR) explained the meaning of the grounds of “race, colour and national extraction” in the context of the Discrimination (Employment and Occupation) Convention, 1958 (No. 111). Furthermore, it provided examples of people affected by discrimination in employment on grounds that fall within the scope of the Convention.
In particular, the CEACR recalled that, under Convention No. 111, “the term ‘race’ includes any discrimination against linguistic communities or minority groups whose identity is based on religious or cultural characteristics or national or ethnic origin.” Additionally, it specified that discrimination on the basis of race and colour were generally examined together, as “colour” was one of the ethnic characteristics of human beings. The Committee also reiterated that national extraction covered “distinctions made on the basis of a person’s place of birth, ancestry or foreign origin”.
When reviewing the application of Convention No. 111, the Committee has therefore been seeking to address discrimination in the workplace experienced, inter alia, by “ethnic minorities, indigenous and tribal peoples, migrant workers, including migrant domestic workers, afro-descendants, national minorities and Roma people” (CEACR 2019a).
In its observations and direct requests related to Convention No. 111 that expressly mention second-generation migrants or individuals with a migration background, the CEACR has called upon States to strengthen their efforts to effectively address discrimination and ensure equality of opportunity and treatment. In an observation, it notably urged the Government of the Netherlands to provide information on the measures implemented to that end (CEACR 2024a). In a direct request addressed to the same Government, the Committee noted that various steps needed to be taken,27 including positive action measures (CEACR 2024b). In the same vein, the CEACR requested the German Government to provide information on the specific affirmative measures taken to ensure improved access to employment opportunities for “persons with a minority or migrant background”, including information on the impact of such measures (CEACR 2019b).
Among the concrete measures to be adopted by Germany to tackle discrimination based on ethnic origin or national extraction affecting second-generation migrants, the Committee referred to recruitment and selection processes. In particular, it acknowledged the introduction of pilot projects on depersonalized job applications in private enterprises and public administration with a view to reducing discrimination in recruitment, and noted the Government’s statement that, compared to the traditional process, depersonalized applications ensured that applicants with a migration background had a better chance of being invited to an interview. The Committee requested further information on these anonymous application methods and their results (CEACR 2019c, 2021a).
Taking up another aspect related to labour market outcomes, the CEACR inquired about equality of opportunity in training, skills development and career guidance when considering the situation of individuals with a migration background in Denmark and the Netherlands (CEACR 2018, 2016). In that regard, it has welcomed initiatives taken to improve the qualifications and skills of that population group, such as the establishment of regional skilled worker networks in Germany (CEACR 2021b).
In its most recent direct request on Convention No. 111 addressed to the Netherlands, the Committee also referred to the concern expressed by the United Nations Committee on the Elimination of Racial Discrimination about the stigmatization of people of African descent and the lack of disaggregated data on their social and economic situation. Subsequently, it asked for information on any assessment made of the impact of the measures undertaken to promote equality of opportunity and treatment of persons of African descent, and on cases of discrimination in employment and occupation against them dealt with by the national authorities (CEACR 2024b). Furthermore, to address discrimination in employment and occupation effectively, the Committee has requested or welcomed on several occasions the gathering of information on workers with a migration background in Denmark, particularly through the collection of employment and unemployment statistics disaggregated by origin (CEACR 2016, 2013a).
In addition to calling for specific measures to advance equality in the workplace, when assessing the situation of workers with a migration background in the light of Convention No. 111, the Committee has also addressed the root causes of discrimination. It thus encouraged the German and Dutch Governments to take action to combat racial stereotypes and prejudices and tackle systemic and structural discrimination against minority groups (CEACR 2021b, 2018). In particular, the Committee has noted the adoption of national programmes in Germany seeking to raise awareness of xenophobia and racism in the labour market and in society more broadly (CEACR 2013b).
In its observations and direct requests concerning discrimination in employment and treatment faced by second-generation migrant workers in the context of both Convention No. 111 and Convention No. 122, the Committee has also discussed vulnerable groups affected by intersectional discrimination, such as women and girls (CEACR 2023a, 2016) and young people (CEACR 2017, 2013b). Accordingly, it has reiterated the importance of statistical information on employment and unemployment rates, disaggregated by sex, age and origin (CEACR 2016, 2017).
6.2. National practices regarding non-discrimination and equal treatment of second-generation migrants
Countries sometimes do not have specific labour laws addressing the unique situation of second‑generation migrants. Nonetheless, various existing policy and legal frameworks can help to promote equality in employment outcomes for this category of workers. In most countries, second-generation migrants fall within the remit of national laws and policies aimed at fostering equality for workers generally. Legislation targeting individuals on the basis of national origin or ethnic background may also be indirectly relevant to second-generation migrants, reflecting an approach grounded in non-discrimination principles. Such laws and policies include non-discrimination measures and affirmative action policies that promote equality of opportunity and treatment. Although not always explicitly tailored to second‑generation migrants, these instruments contribute to broader efforts to advance fair treatment and equality of opportunity in the workplace.
The analysis in this section will focus on such measures and their relevance to second‑generation migrants in different countries. However, it should be noted that most countries with robust non-discrimination frameworks aimed at promoting equitable labour markets are middle- and high-income countries. In low-income countries, labour market integration for second-generation migrants may not be perceived as a significant issue or may manifest itself differently because of different socio-economic conditions and labour market structures. Recognizing these contextual differences is essential for a nuanced understanding of national practices that may affect second-generation migrants.
A first step in addressing the disparities in employment opportunities and treatment faced by second-generation migrants is the adoption of non-discrimination legislation,28 that is, laws which explicitly prohibit discrimination at work on the basis of national extraction or ethnic origin (Fugazza 2003). However, to achieve a positive impact on the labour market inclusion of second-generation migrants, such laws need to be enforced through adequate complaint and redress mechanisms that are accompanied by legal protections against retaliation.29 Box 6.3 below provides an example of a comprehensive national legal framework against racial and ethnic discrimination in employment and occupation that is supported by robust enforcement mechanisms.
Box 6.3. The legal and institutional framework in Luxembourg for combating ethnic and racial discrimination at work
Luxembourg is a multicultural country, in which 47.4 per cent of the population did not hold Luxembourgish nationality in 2023; indeed, the country’s population encompasses individuals from 170 different nationalities (Luxembourg, STATEC 2023). To foster social cohesion and promote inclusivity, the Government has enacted a comprehensive legal framework regulating intercultural coexistence that includes action plans to combat racism and discrimination at all administrative levels.1,2 With regard to tackling discrimination based on national, ethnic and racial grounds at work, the Labour Code,3 as amended by the 2006 Act on Equal Treatment,4 enshrined specific legal guarantees, established enforcement mechanisms and created an equality body.
The Labour Code of Luxembourg prohibits any direct or indirect discrimination based, inter alia, on “a real or assumed national, ethnic or racial affiliation” (art. L 251-1(1)). Thus, both direct and indirect discrimination are taken into account, with the latter defined as occurring “where a prima facie neutral provision, criterion or practice would put persons with ... a real or assumed national, ethnic or racial affiliation at a disadvantage compared with other persons” (art. L 251-1(2)). The prohibition of discrimination at work on the grounds of both real and perceived affiliation to a nationality, race or ethnic group reinforces the protection offered by this provision. Moreover, harassment related to one of the above-mentioned prohibited grounds of discrimination is also explicitly referred to as a form of discrimination (art. L 251-1(3)).
The prohibition of discrimination applies to a broad spectrum of aspects of an individual’s labour market experience, namely: “(a) conditions of access to employment, unpaid activities, or work, including selection criteria and terms of hiring, regardless of the sector of activity and for all occupational ranks, including with regard to promotion; (b) access to all types and all levels of vocational guidance, vocational training, vocational advanced training and retraining, including practical work experience; (c) employment and working conditions, including dismissals and pay; (d) membership or involvement in an organization of employees or of employers or any organization whose members engage in a given occupation, including such benefits as may be provided by this type of organization” (art. L 251-2).
With regard to the implementation of these legislative provisions, the Labour Code states that employees who believe that they have been discriminated against and report such acts should not be subject to reprisals as a consequence (art. L 253-1). Additionally, it is sufficient for the complainant to provide evidence of direct or indirect discrimination before the civil or administrative courts.5 After that, the burden of proof is on the defendant (usually the employer), who must prove that there has not been a violation of the principle of equal treatment (art. L 253-2). The law allows trade unions and certain associations to take legal action against an employer, provided that the employee whose rights they are defending does not object (art. L 253-4). The Labour and Mines Inspectorate is responsible for ensuring compliance with the rules on non-discrimination (art. L 254-1).
Furthermore, the Act on Equal Treatment of 28 November 2006 established an independent body responsible for combating discrimination, namely the Centre for Equal Treatment (art. 8).6 This equality body is tasked mainly with providing counselling and information to both the victims of discrimination and the national authorities. In particular, the Centre can issue opinions and recommendations on all issues relating to discrimination based on race, ethnic origin, sex, religion or belief, disability and age (art. 10).
Assessing the impact of all this legislation is not an easy task, as racial discrimination is not very visible in Luxembourg according to the European Network Against Racism. The country’s relatively good economic situation probably explains the fact that few cases of discrimination in employment are reported (ENAR 2018). Nevertheless, Luxembourg serves as a relevant example of the adoption of comprehensive legislation and supporting implementation mechanisms to tackle the discrimination faced, among others, by foreign and ethnic minority workers and, therefore, also by second‑generation migrants.
1 Luxembourg, Act of 23 August 2023 on Intercultural Living Together, amending the Act of 8 March 2017 on Luxembourgish Nationality.
2 Luxembourg, Ministry of Family Affairs, Solidarity, Living Together and Reception of Refugees, draft legislation of 7 February 2023 amending the Act of 8 March 2017 on Luxembourgish Nationality.
3 Luxembourg, Labour Code, consolidated version of 27 February 2024.
4 Luxembourg, Act of 28 November 2006 on Equal Treatment.
5 In many cases, the treatment of the victim may also qualify as a discrimination offence under the Criminal Code of Luxembourg (arts 454–457).
6 However, the European Network Against Racism has noted that in countries such as Cyprus, Finland and Luxembourg, where equality bodies were created following the adoption of non-discrimination legislation, there is a lack of awareness of these bodies (ENAR 2018).
In addition to strong enforcement mechanisms, non-discrimination legal frameworks in some countries have also been accompanied by more comprehensive policies focused, in particular, on creating the conditions for equal work opportunities and outcomes by compensating for or preventing discrimination in employment through specific measures. These measures are either enforced by the national authorities or their implementation can be requested of employers, and they cover a wide range of aspects.
The Dutch approach illustrates efforts to effectively enforce non-discrimination laws, complemented by systemic interventions enhancing the labour market outcomes of vulnerable groups. An advisory report published by the country’s Social and Economic Council in April 2014 pointed out that, while the national legal framework for preventing and addressing discrimination in the labour market was adequate, its implementation was not always effective (Netherlands, Social and Economic Council 2014). In response to the Council’s recommendations, the Ministry of Social Affairs and Employment shortly afterwards drew up an Action Plan against Labour Market Discrimination (Netherlands, Ministry of Social Affairs and Employment 2014). As part of the Action Plan, the Government committed itself to terminating contracts with companies convicted of discrimination and excluding them from public tenders for four years. The Inspectorate SZW30 (now the Netherlands Labour Authority) was tasked with enhancing monitoring by analysing labour market data and initiating compliance investigations, while the police were instructed to focus their efforts on refining the reporting of discrimination incidents and training officers to respond effectively.
The Action Plan also provides for schemes to support the employment of groups that are vulnerable to discrimination. It prioritizes awareness-raising through a public information campaign aimed at enhancing knowledge of rights and encouraging the reporting of discrimination. Similarly, it promotes the sharing of best practices that highlight successful employer initiatives. Works councils are encouraged to be representative of the diversity within the company and to develop a diversity charter. In accordance with the action plan, research must underpin these efforts, with studies of labour market discrimination to guide future policies. Taken together, these measures constitute a comprehensive framework for combating discrimination and upholding equitable labour practices.
Another example of equality legislation designed to enhance the labour market outcomes of second-generation migrants is the Canadian Employment Equity Act of 1995.31 Central to the Act are measures addressing systemic discrimination and fostering integration for four designated groups. Among these are “members of visible minorities”, which include second‑generation migrants meeting the Act’s definition of visible minorities as “persons, other than Aboriginal peoples, who are non-Caucasian in race or non-white in colour” (section 3). The measures provided for by the Act to address labour discrimination against visible minorities include specific obligations for employers to eliminate barriers and promote equitable representation. Employers are required to analyse their workforce in order to determine the degree of under-representation of visible minorities and other designated groups across occupational groups, and to identify discriminatory employment systems, policies and practices (section 9). Based on this analysis, they must prepare and implement an employment equity plan that sets out policies, practices and reasonable accommodations to rectify those disparities (section 10). As part of this plan, employers must establish concrete short-term goals to address gaps and periodically update them (sections 10 and 12–13). These measures are designed to achieve a degree of representation for people from designated groups reflecting their share in the broader Canadian workforce (section 5).32
Interventions can sometimes focus on specific aspects or stages of the labour market experience of second-generation migrants. That is the case with active employment policies geared towards meeting the needs of individuals with a migration background. By way of illustration, the National Employment Agency in the Republic of Moldova has organized job fairs and campaigns to raise awareness of the services of its territorial employment subdivisions available to young jobseekers, with special attention given to those with a migration background (CEACR 2022).
Another type of measure seeks to reduce discrimination in recruitment and hiring. In that regard, the UK Commission for Racial Equality has produced a statutory Code of Practice on Racial Equality in Employment that sets out guidelines for employers on good practices in the selection and assessment of candidates. The Code of Practice addresses discrimination in job advertisements, selection tests, interviews and language requirements (United Kingdom, Commission for Racial Equality 2005). Similarly, the use of anonymous application procedures is one of the practices for non-racially biased hiring recommended by the UK Equality and Human Rights Commission, which holds that “job descriptions, person specifications and application forms shouldn’t ask candidates to give unnecessary personal details or state requirements that aren’t directly related to the job” (cited in Åslund and Skans 2012, 83).
Specific measures adopted by countries also include the collection of data on ethnicity, which paves the way for the design and implementation of equal opportunity policies that benefit second-generation migrants. In the United States, employers with more than 100 employees are mandated to report their workforce demographics to the Equal Employment Opportunity Commission.33 Similarly, in the United Kingdom, the Race Disparity Unit provides clear, albeit non-mandatory guidance and recommends the use of a harmonized standard to any employers wishing to analyse the racial/ethnic distribution of their workforce for diversity, equality and inclusion monitoring in general or for the identification of potential ethnicity pay gaps (United Kingdom, Race Disparity Unit 2023).
With regard to wages, a recent ILO study has underscored how pay transparency reporting contributes to more equitable work outcomes (ILO 2022). Such reporting is essential for employees to be able to recognize disparities in compensation and challenge them. At the same time, employers can use it as a tool for identifying and addressing pay gaps and fostering inclusivity within their organization. There are now many countries taking proactive measures to tackle pay inequity between male and female workers through the introduction of gender pay gap reporting with specific legal obligations for employers (Pearson and Pritchett 2023). Although similar reporting on ethnicity pay gaps is still rare, South Africa’s employment equity legislation serves as a relevant example, as it obligates designated employers (those who have more than 50 employees or meet a certain annual turnover threshold) to report income differentials across both race and gender groups. Indeed, as pointed out by Fredman et al. (2021), the South African Employment Equity Act of 1998 requires the disaggregation of pay statistics in order to capture the differences in social and economic status among racial and ethnic groups.34
To sum up, national legal and policy frameworks addressing ethnic discrimination at work, which can also affect second-generation migrants, vary considerably but often focus exclusively on a particular aspect. Countries have developed a number of mechanisms to strengthen the implementation of these frameworks. Each country’s specific socio-economic context and the resources that are available to it should inform the adoption of such measures. Further research to examine not only which laws and policies are in place in different countries but also what impacts they are having can support the development of effective context-sensitive approaches.
Conclusion
This empirical study of a sample comprising 30 European countries, Australia and the United States has highlighted disparities in the labour market outcomes of second-generation migrants vis-à-vis the rest of the native-born population, with a focus on labour force participation, unemployment, status in employment, wages and self-employment income.
Although previous studies have shown that second-generation migrants generally perform better than their first-generation counterparts in terms of labour force integration, the findings presented here indicate that there are still disparities in many countries between their labour market outcomes and those of other native-born workers. Significantly, the econometric models used in our analysis suggest that these employment and earnings disparities can only partly be explained by the socio-demographic characteristics of individuals such as educational attainment and age.
In particular, second-generation migrants consistently exhibit lower labour market participation and higher unemployment rates than other individuals born in the same country, even after taking age and education into account, with larger gaps often observed among the male population. With regard to status in employment, second-generation migrants, especially men, are more likely to be in wage employment than self-employed in many countries. As for wages, second-generation migrants tend to be paid less on average than other native-born workers, with a wage penalty evident in many European countries when controlling for educational attainment, age and broad occupational category. In contrast, a wage premium is observed in the United States for second-generation migrants. When it comes to self-employment income, second-generation migrants tend to lag behind other native-born self-employed individuals in many of the countries studied, confirming the obstacles that they often face in starting their own business.
To varying degrees across countries, these findings may reflect broader challenges faced by second generation migrants, including restricted opportunities, discrimination, inadequate social integration, lack of networks, limited linguistic proficiency and ethnic penalties in the labour market. On the other hand, existing studies have pointed to factors that may help to explain cases where second-generation migrants fare relatively well on certain labour market outcomes, including a higher level of skills formation, for example with regard to soft skills.
Finally, the legal and regulatory framework is a key dimension shaping the labour market outcomes of second-generation migrants. International labour standards dealing with non discrimination and wages can provide guidance on how to ensure equal work outcomes. Comprehensive laws and policies have also been adopted at the national level, together with strong implementation and accountability mechanisms, to achieve equality of opportunity and treatment for workers with a migration background. While the prohibition of discrimination is an essential first step, both to remedy specific situations and to change norms and attitudes, many countries have also adopted complementary approaches, such as proactive employment and pay equity measures aimed at fostering the socio-economic inclusion of ethnic minority workers.
Annex
Figures
Figure A1. Share of second-generation migrants (based on alternative definition) in the working-age population in each of the sampled countries
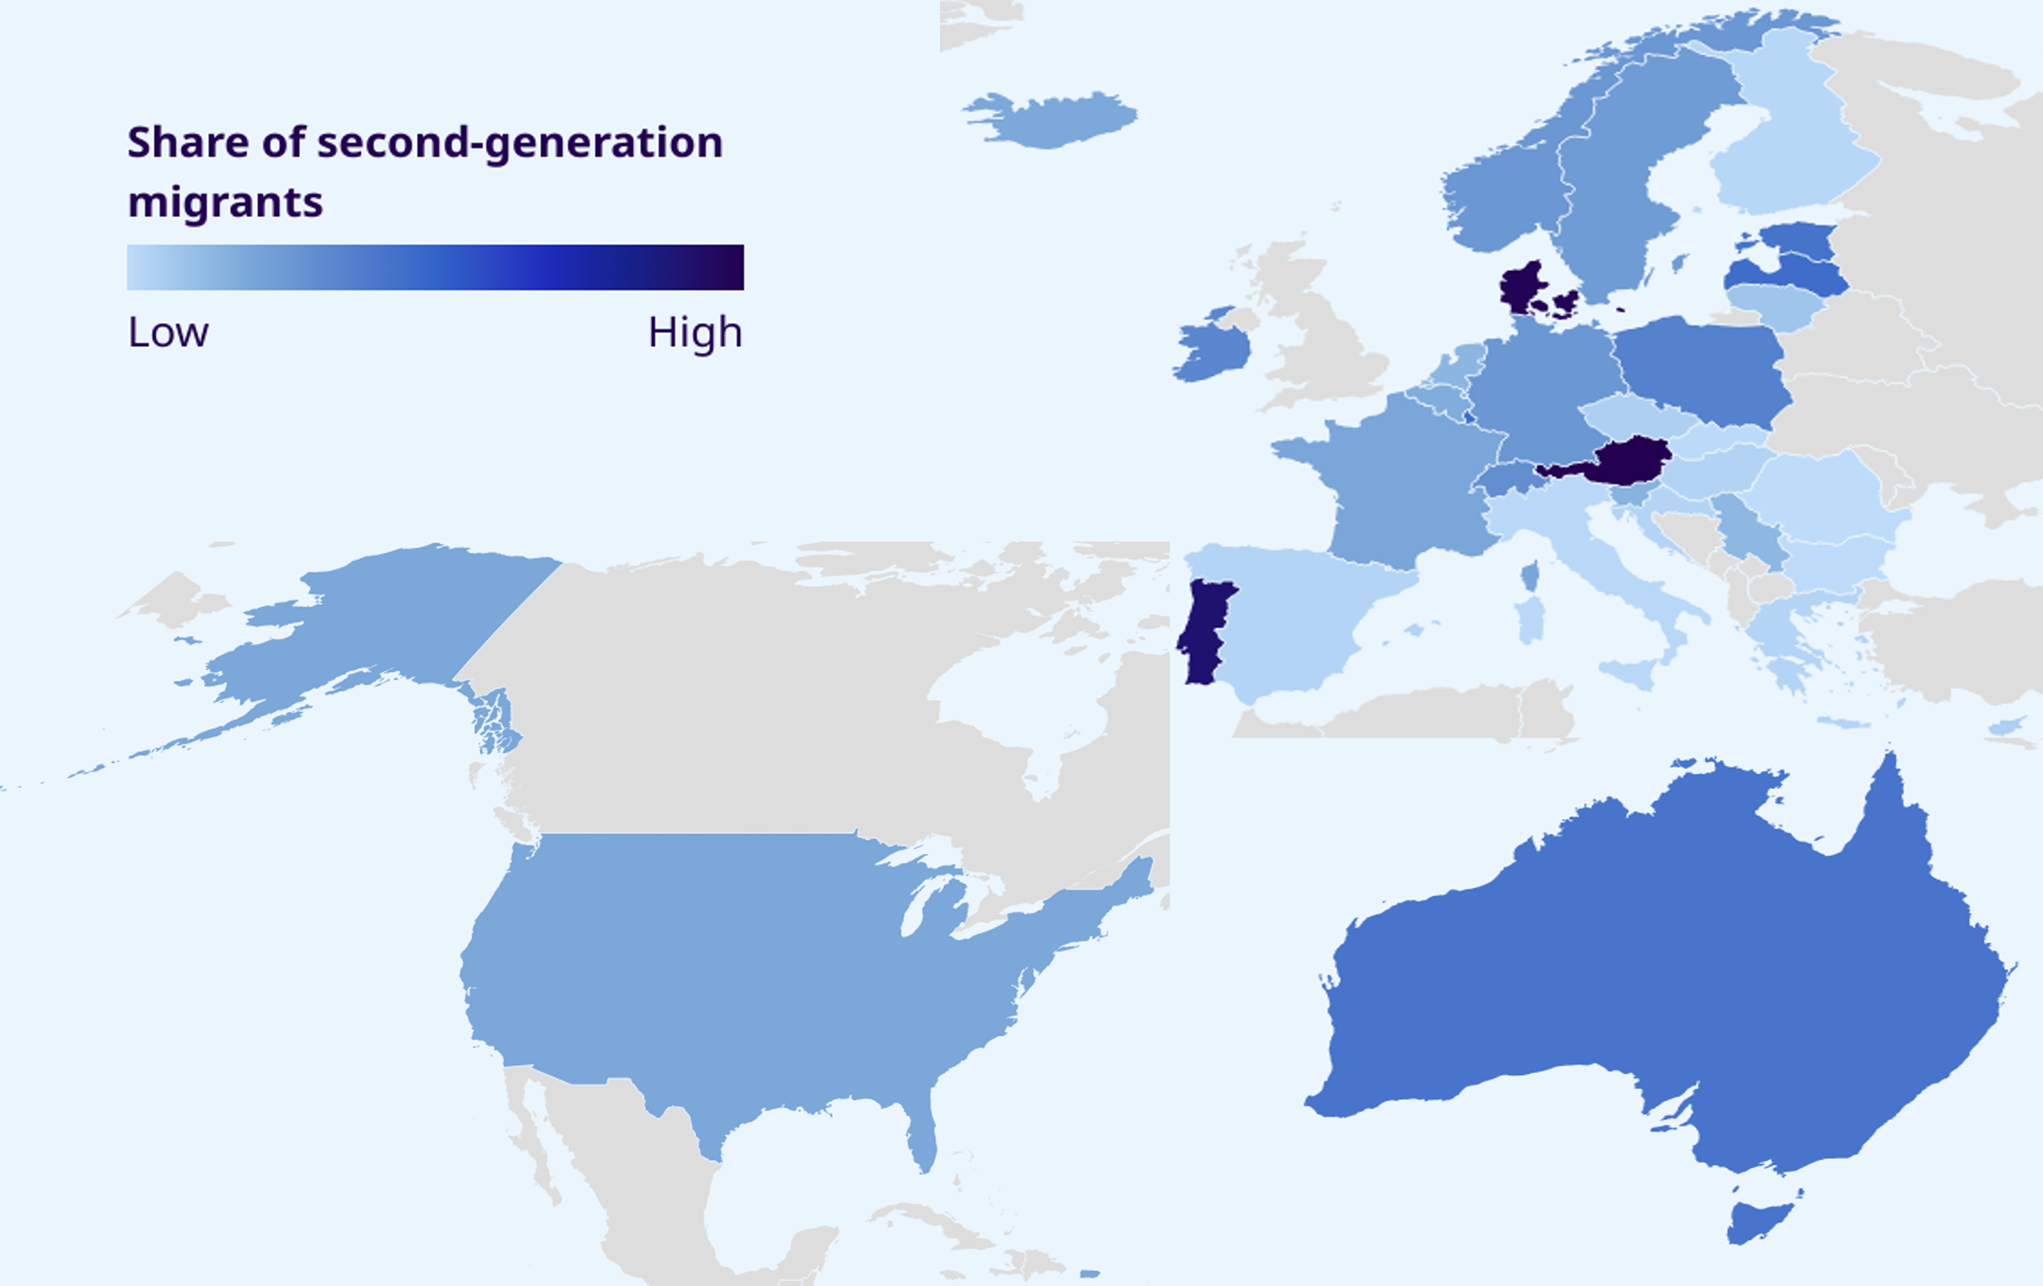
Note: This figure was prepared using our second working definition of a “second generation migrant”, that is, where a native-born individual has a foreign-born father (see section 2.1).
Source: ILO Harmonized Microdata collection (ILOSTAT), 2022 or the latest available year.
Figure A2. Age composition of working-age second-generation migrants (based on alternative definition) and the rest of the native-born working-age population, by sex (percentage)
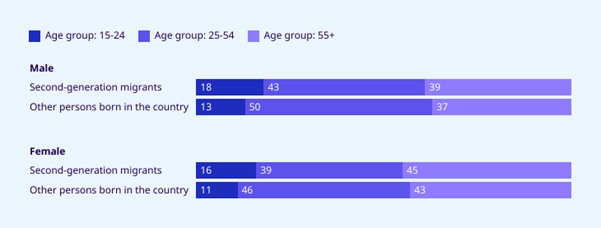
Note: This figure was prepared using our second working definition of a “second‑generation migrant”, that is, where a native-born individual has a foreign-born father (see section 2.1). The values reported are averages for the 32 countries in the sample.
Source: ILO Harmonized Microdata collection (ILOSTAT), 2022 or the latest available year.
Figure A3. Distribution of working-age second-generation migrants (based on alternative definition) and the rest of the native-born working-age population by education level and sex (percentage)
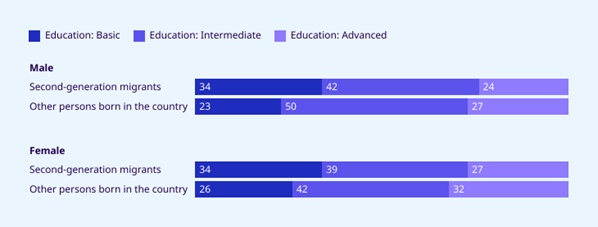
Note: This figure was prepared using our second working definition of a “second generation migrant”, that is, where a native-born individual has a foreign-born father (see section 2.1). The values reported are averages for the 32 countries in the sample.
Source: ILO Harmonized Microdata collection (ILOSTAT), 2022 or the latest available year.
Figure A4. Distribution of second-generation migrant workers (based on alternative definition) and other native-born workers in employment by occupational category and sex (percentage)
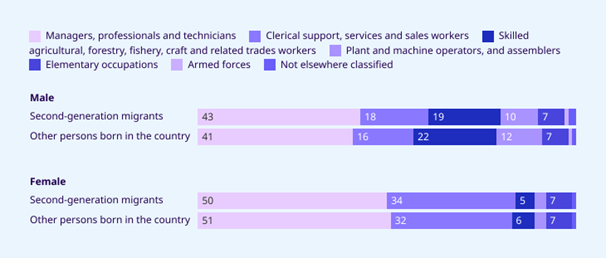
Note: This figure was prepared using our second working definition of a “second generation migrant”, that is, where a native-born individual has a foreign-born father (see section 2.1). The values reported are averages for the 32 countries in the sample.
Source: ILO Harmonized Microdata collection (ILOSTAT), 2022 or the latest available year.
Figure A5. Earnings distribution (based on hourly wages) of second-generation migrant wage employees, by region or country (percentage)
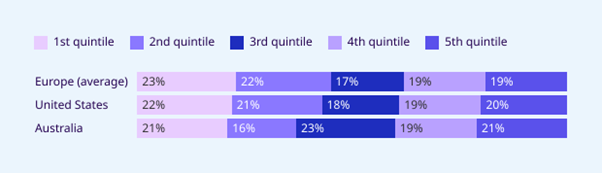
Note: The European average refers to the following countries: Austria, Belgium, Bulgaria, Croatia, Cyprus, Czechia, Denmark, Estonia, Finland, France, Germany, Greece, Hungary, Ireland, Italy, Latvia, Lithuania, Luxembourg, Netherlands, Poland, Portugal, Serbia, Slovakia, Slovenia, Spain, Sweden, Switzerland.
Source: ILO Harmonized Microdata collection (ILOSTAT), 2022 or the latest available year.
Figure A6. Earnings distribution (based on monthly self-employment income) of self-employed second-generation migrants, by region or country (percentage)
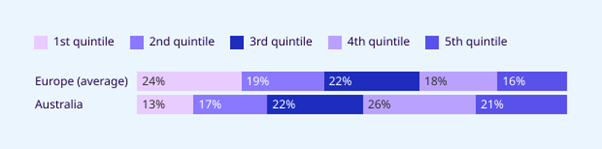
Note: The European average refers to the following countries: Austria, Belgium, Czechia, Denmark, France, Germany, Hungary, Ireland, Italy, Latvia, Lithuania, Luxembourg, Netherlands, Poland, Portugal, Serbia, Slovenia, Spain, Sweden, Switzerland.
Source: ILO Harmonized Microdata collection (ILOSTAT), 2022 or the latest available year.
Figure A7. Average number of weekly hours worked by second-generation migrants who are wage employees versus other native born wage employees, by sex and country
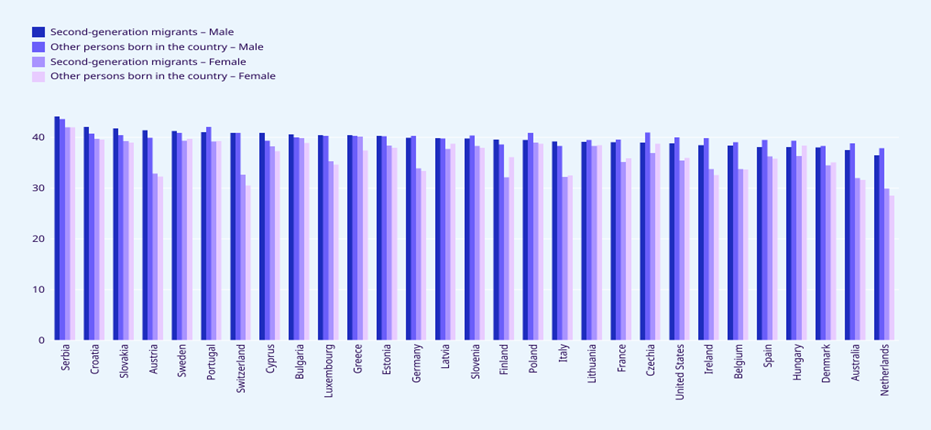
Note: Only countries are shown for which there are sufficient observations to estimate the mean number of weekly hours worked by second-generation migrants (according to our main working definition, that is, where a native-born individual has a foreign-born mother – see section 2.1).
Source: ILO Harmonized Microdata collection (ILOSTAT), 2022 or the latest available year.
Tables
Table A1. National data sources used to analyse the employment and earnings outcomes of second-generation migrants
|
Country |
Survey |
Year |
OECD status |
EU status |
|---|---|---|---|---|
|
Australia |
HILDA |
2021 |
OECD member |
Non-EU |
|
Austria |
EU-SILC |
2022 |
OECD member |
EU member |
|
Belgium |
EU-SILC |
2022 |
OECD member |
EU member |
|
Bulgaria |
EU-SILC |
2022 |
OECD candidate |
EU member |
|
Croatia |
EU-SILC |
2022 |
OECD candidate |
EU member |
|
Cyprus |
EU-SILC |
2022 |
Non-OECD |
EU member |
|
Czechia |
EU-SILC |
2022 |
OECD member |
EU member |
|
Denmark |
EU-SILC |
2022 |
OECD member |
EU member |
|
Estonia |
EU-SILC |
2022 |
OECD member |
EU member |
|
Finland |
EU-SILC |
2022 |
OECD member |
EU member |
|
France |
EU-SILC |
2022 |
OECD member |
EU member |
|
Germany |
EU-SILC |
2022 |
OECD member |
EU member |
|
Greece |
EU-SILC |
2022 |
OECD member |
EU member |
|
Hungary |
EU-SILC |
2022 |
OECD member |
EU member |
|
Iceland |
EU-LFS |
2022 |
OECD member |
Non-EU |
|
Ireland |
EU-SILC |
2022 |
OECD member |
EU member |
|
Italy |
EU-SILC |
2022 |
OECD member |
EU member |
|
Latvia |
EU-SILC |
2022 |
OECD member |
EU member |
|
Lithuania |
EU-SILC |
2022 |
OECD member |
EU member |
|
Luxembourg |
EU-SILC |
2022 |
OECD member |
EU member |
|
Netherlands |
EU-SILC |
2022 |
OECD member |
EU member |
|
Norway |
EU-LFS |
2022 |
OECD member |
Non-EU |
|
Poland |
EU-SILC |
2022 |
OECD member |
EU member |
|
Portugal |
EU-SILC |
2022 |
OECD member |
EU member |
|
Romania |
EU-SILC |
2022 |
OECD candidate |
EU member |
|
Serbia |
EU-SILC |
2021 |
Non-OECD |
Non-EU |
|
Slovakia |
EU-SILC |
2022 |
OECD member |
EU member |
|
Slovenia |
EU-SILC |
2022 |
OECD member |
EU member |
|
Spain |
EU-SILC |
2022 |
OECD member |
EU member |
|
Sweden |
EU-SILC |
2022 |
OECD member |
EU member |
|
Switzerland |
EU-SILC |
2021 |
OECD member |
Non-EU |
|
United States |
CPS |
2023 |
OECD member |
Non-EU |
CPS = Current Population Survey. EU-LFS = European Union Labour Force Survey. EU-SILC = European Union Statistics on Income and Living Conditions. HILDA = Household, Income and Labour Dynamics in Australia.
Source: ILO Harmonized Microdata collection (ILOSTAT), 2022 or the latest available year.
Table A2. Effect of being a second-generation migrant (based on alternative definition) on the probability of labour force participation, unemployment and wage employment, by country (percentage points)
|
Country |
Labour force participation |
Unemployment |
Wage employment |
||||||
|---|---|---|---|---|---|---|---|---|---|
|
All |
Men |
Women |
All |
Men |
Women |
All |
Men |
Women |
|
|
Europe |
|||||||||
|
Austria |
1.2 |
0.1 |
2.5* |
-0.8 |
-0.9 |
-0.7 |
14.0*** |
13.5*** |
14.6*** |
|
Belgium |
-3.5** |
-2.5 |
-4.3* |
4.3*** |
2.5** |
6.1*** |
3.6* |
5.1* |
1.7 |
|
Bulgaria |
-0.2 |
2.4 |
-6.2 |
-1.8 |
-9.8 |
3.7 |
4.5 |
0*** |
-7.3 |
|
Croatia |
0.5 |
-0.5 |
1.1 |
7.1** |
9.7** |
3.3 |
-2.6 |
-1.6 |
-3.9 |
|
Cyprus |
0.7 |
4.2 |
-1.3 |
-2.1 |
-4.3 |
0.8 |
6.2 |
9.3 |
5.3 |
|
Czechia |
3.9** |
1.1 |
6.3** |
1.6 |
0.9 |
2.5 |
1.9 |
1.2 |
2.0 |
|
Denmark |
-12.0*** |
-13.0*** |
-10.1*** |
0.3 |
2.0 |
-1.7 |
-1.3 |
-1.9 |
-0.8 |
|
Estonia |
-10.2*** |
-14.7*** |
-4.9** |
1.2 |
2.5 |
-0.1 |
-0.9 |
2.3 |
-3.6* |
|
Finland |
-10.4** |
-10.3* |
-9.8 |
3.3 |
2.1 |
4.1 |
-5.6 |
-0.6 |
-9.1* |
|
France |
-0.6 |
0.7 |
-1.6 |
4.5*** |
5.9*** |
3.0*** |
0.1 |
2.1 |
-1.7 |
|
Germany |
-2.5*** |
-2.7*** |
-2.7*** |
1.1*** |
1.1** |
1.0* |
0.7 |
2.1** |
-0.8 |
|
Greece |
-3.8 |
-5.7 |
-1.3 |
5.7 |
1.1 |
10.7* |
13.0* |
25.8** |
-0.8 |
|
Hungary |
-5.3* |
-9.9** |
-0.3 |
-3.3 |
-2.8 |
-4.1 |
-9.2*** |
-11.2** |
-7.4* |
|
Iceland |
-27.2*** |
-26.0*** |
-27.2*** |
-0.2 |
-1.0 |
0.5 |
-5.7*** |
-9.2*** |
-0.3 |
|
Ireland |
-7.2*** |
-9.6*** |
-6.3* |
1.5 |
1.5 |
1.7 |
2.7 |
7.9** |
-2.1 |
|
Italy |
-0.1 |
2.7 |
-4.2 |
-1.2 |
3.0 |
-9.1 |
30.5*** |
48.6*** |
16.1** |
|
Latvia |
-5.0*** |
-0.9 |
-6.5*** |
1.8* |
2.0 |
1.6 |
-0.8 |
-1.7 |
-0.1 |
|
Lithuania |
-2.0 |
3.7 |
-4.9 |
4.1 |
2.1 |
5.4 |
-7.1** |
-11.8** |
-3.2 |
|
Luxembourg |
-0.6 |
1.2 |
-1.6 |
0.8 |
0.3 |
1.3 |
-0.7 |
1.8 |
-2.6 |
|
Netherlands |
-0.4 |
-1.9 |
1.0 |
1.8* |
0.8 |
2.6** |
0.6 |
-2.9 |
3.7 |
|
Norway |
-25.1*** |
-26.3*** |
-23.2*** |
-0.3 |
0 |
-0.8 |
1.5 |
3.2 |
0 |
|
Poland |
-35.4*** |
-39.8*** |
-28*** |
-3.5** |
-2.9* |
-4.4 |
-1.2 |
-4.0 |
2.4 |
|
Portugal |
-7.7*** |
-7.4*** |
-8.0*** |
2.8*** |
5.6*** |
0.1 |
0.5 |
0.5 |
0.6 |
|
Romania |
0.7 |
-14.5 |
22.0 |
0*** |
0*** |
0*** |
-1.2 |
0*** |
-8.4 |
|
Serbia |
-3.1* |
-2.3 |
-3.9* |
-0.8 |
-0.7 |
0.1 |
-0.7 |
-0.3 |
0.8 |
|
Slovakia |
10.7* |
8.1 |
13.4 |
0 |
1.7 |
-4.3 |
13.5* |
40.0** |
-4.2 |
|
Slovenia |
1.9 |
-5.1* |
9.3*** |
1.7* |
-0.2 |
2.9** |
-2.0 |
-2.9 |
-1.9 |
|
Spain |
-1.5 |
-4.1 |
1.2 |
1.1 |
2.5 |
-1.0 |
-1.7 |
-1.3 |
-1.6 |
|
Sweden |
5.3*** |
4.5** |
5.8*** |
0.6 |
1.7 |
-0.8 |
1.9 |
2.7 |
0.5 |
|
Switzerland |
6.3*** |
8.2*** |
4.7** |
1.4* |
1.6 |
1.2 |
0.3 |
3.6* |
-2.5 |
|
Europe |
-7.1*** |
-9.0*** |
-5.4*** |
1.5*** |
1.8** |
1.1** |
1.8*** |
2.7*** |
0.8 |
|
Rest of the world |
|||||||||
|
Australia |
-0.7 |
0.1 |
-1.6 |
-0.5 |
0.7 |
-2.2** |
0 |
0 |
0.4 |
|
United States |
-2.6*** |
-2.3*** |
-2.9*** |
0.8*** |
1.1*** |
0.5*** |
0.9*** |
0.6*** |
1.2*** |
|
All countries |
-6.7*** |
-8.3*** |
-5.2*** |
1.4*** |
1.8** |
0.9** |
1.6*** |
2.4*** |
0.8* |
Note 1: This table was prepared using our second working definition of a “second-generation migrant”, that is, where a native-born individual has a foreign-born father (see section 2.1).
Note 2: ***, ** and * indicate that the result is statistically different from zero at the 1%, 5% and 10% level of significance, respectively.
Note 3: The results for labour force participation refer to the whole working-age population. Those for unemployment refer to the population in the labour force. Those for status in employment (wage employment versus self-employment) refer to the employed population.
Note 4: The labour force participation and unemployment models control for age and education. The model used to analyse status in employment (wage employment versus self employment) features occupational category as an additional control.
Source: Analysis based on ILO Harmonized Microdata collection (ILOSTAT), 2022 or the latest available year. See table A1 for more details.
Table A3. Effect of being a second-generation migrant on monthly wages (percentage)
|
Country |
All |
Men |
Women |
|---|---|---|---|
|
Europe |
|||
|
Austria |
-1.2 |
-0.4 |
0.2 |
|
Belgium |
-9.3** |
-9.2 |
-11.5* |
|
Bulgaria |
-16.9 |
26.5 |
-31.9 |
|
Croatia |
3.9 |
-0.2 |
4.6 |
|
Cyprus |
-3.0 |
10.4 |
-26.5 |
|
Czechia |
-3.2 |
-1.3 |
-6.4 |
|
Denmark |
2.3 |
3.3 |
-0.3 |
|
Estonia |
-10.5** |
-7.3 |
-13.3** |
|
Finland |
1.6 |
0.6 |
-2.5 |
|
France |
2.6 |
5.1 |
0.1 |
|
Germany |
2.0 |
1.9 |
-0.8 |
|
Greece |
2.0 |
-8.1 |
15.3 |
|
Hungary |
6.5 |
-1.6 |
16.2 |
|
Ireland |
-5.2 |
-20.8** |
9.2 |
|
Italy |
2.9 |
12.4 |
-9.7 |
|
Latvia |
-2.6 |
-2.0 |
-2.5 |
|
Lithuania |
7.4 |
9.7 |
6.5 |
|
Luxembourg |
-6.4 |
-9.9 |
-3.0 |
|
Netherlands |
0.1 |
-5.3 |
4.5 |
|
Poland |
3.7 |
-0.5 |
8.1* |
|
Portugal |
-5.3* |
-1.1 |
-11.4** |
|
Serbia |
4.6 |
2.5 |
4.4 |
|
Slovakia |
-5.7 |
-13.1** |
2.2 |
|
Slovenia |
-0.7 |
-4.8 |
5.6 |
|
Spain |
-6.0 |
-8.3 |
-3.5 |
|
Sweden |
-0.6 |
-1.3 |
-1.5 |
|
Switzerland |
9.1*** |
0.1 |
10.1** |
|
Europe |
-4.4*** |
-6.6*** |
-2.8** |
|
Rest of the world |
|||
|
Australia |
-0.1 |
-4.0 |
1.9 |
|
United States |
4.9*** |
1.0 |
8.0*** |
|
All countries |
-3.7*** |
-6.0*** |
-2.0 |
Note: ***, ** and * indicate that the result is statistically different from zero at the 1%, 5% and 10% level of significance, respectively.
Source: Analysis based on ILO Harmonized Microdata collection (ILOSTAT), 2022 or the latest available year. See table A1 for more details.
Table A4. Effect of being a second-generation migrant (based on alternative definition) on hourly wages (percentage)
|
Country |
All |
Men |
Women |
|---|---|---|---|
|
Europe |
|||
|
Austria |
-3.2 |
-4.6* |
-0.4 |
|
Belgium |
-6.6** |
-4.6 |
-9.5*** |
|
Bulgaria |
36.6*** |
39.5*** |
15.5 |
|
Croatia |
-4.4 |
-21.7*** |
13.9*** |
|
Cyprus |
-1.4 |
-6.5 |
-3.5 |
|
Czechia |
1.1 |
-4.2 |
7.0* |
|
Denmark |
-4.9* |
-8.6** |
-1.1 |
|
Estonia |
-9.8** |
-8.0 |
-10.9** |
|
Finland |
11.3 |
-9.6 |
44.1 |
|
France |
0.9 |
1.0 |
1.4 |
|
Germany |
0.9 |
2.8 |
-2.0 |
|
Greece |
4.9 |
8.1 |
-3.4 |
|
Hungary |
3.3 |
-2.6 |
10.3 |
|
Ireland |
-4.1 |
-9.0 |
0.9 |
|
Italy |
-12.0 |
10.9 |
-37.1 |
|
Latvia |
-2.7 |
2.1 |
-7.9*** |
|
Lithuania |
3.9 |
-8.3 |
13.4* |
|
Luxembourg |
-10.9** |
-16.0** |
-2.6 |
|
Netherlands |
-1.4 |
-2.0 |
0.2 |
|
Poland |
1.1 |
4.3 |
-1.6 |
|
Portugal |
-3.6 |
1.2 |
-8.2 |
|
Serbia |
8.2** |
6.0 |
6.4 |
|
Slovakia |
2.3 |
3.6 |
-17.2* |
|
Slovenia |
2.6 |
4.1 |
2.9 |
|
Spain |
6.2 |
8.5 |
1.5 |
|
Sweden |
-5.7** |
-9.6*** |
-2.0 |
|
Switzerland |
1.4 |
1.1 |
0 |
|
Europe |
-4.7*** |
-5.6*** |
-3.6*** |
|
Rest of the world |
|||
|
Australia |
-0.4 |
-1.5 |
0.1 |
|
United States |
3.7*** |
1.0 |
6.5*** |
|
All countries |
-4.3*** |
-5.3*** |
-3.3*** |
Note 1: This table was prepared using our second working definition of a “second generation migrant”, that is, where a native-born individual has a foreign-born father (see section 2.1).
Note 2: ***, ** and * indicate that the result is statistically different from zero at the 1%, 5% and 10% level of significance, respectively.
Source: Analysis based on ILO Harmonized Microdata collection (ILOSTAT), 2022 or the latest available year. See table A1 for more details.
Table A5. Effect of being a second-generation migrant (based on alternative definition) on monthly wages (percentage)
|
Country |
All |
Men |
Women |
|---|---|---|---|
|
Europe |
|||
|
Austria |
-1.2 |
-0.1 |
0.2 |
|
Belgium |
-8.1** |
-7.0 |
-10.9** |
|
Bulgaria |
39.7*** |
42.1*** |
19.0 |
|
Croatia |
-3.4 |
-21.5*** |
15.8*** |
|
Cyprus |
-0.7 |
-6.9 |
-2.4 |
|
Czechia |
-1.8 |
-5.9 |
2.4 |
|
Denmark |
-7.5** |
-12.1** |
-2.4 |
|
Estonia |
-9.9** |
-9.4 |
-9.7* |
|
Finland |
-3.5 |
-8.1 |
-3.6 |
|
France |
-0.7 |
-0.1 |
0.2 |
|
Germany |
2.0 |
2.8 |
-0.5 |
|
Greece |
10.0* |
10.3 |
4.3 |
|
Hungary |
-3.9 |
-7.1 |
2.3 |
|
Ireland |
-7.1 |
-11.7 |
-5.8 |
|
Italy |
-10.1 |
6.3 |
-29.0 |
|
Latvia |
-3.3 |
1.6 |
-8.3*** |
|
Lithuania |
-1.1 |
-8.6 |
5.2 |
|
Luxembourg |
-10.2* |
-16.5*** |
-0.3 |
|
Netherlands |
-1.1 |
-5.0 |
6.6 |
|
Poland |
1.8 |
2.8 |
1.9 |
|
Portugal |
-3.8 |
0.5 |
-8.3 |
|
Serbia |
10.2** |
8.1 |
7.9** |
|
Slovakia |
2.1 |
3.8 |
-22.1 |
|
Slovenia |
1.4 |
3.2 |
1.6 |
|
Spain |
6.1 |
6.3 |
2.4 |
|
Sweden |
-5.4** |
-9.1** |
-1.9 |
|
Switzerland |
4.7 |
-3.5 |
8.1* |
|
Europe |
-5.0*** |
-6.8*** |
-3.1** |
|
Rest of the world |
|||
|
Australia |
-2.4 |
-4.6 |
-1.2 |
|
United States |
3.8*** |
-0.3 |
7.9*** |
|
All countries |
-4.3*** |
-6.2*** |
-2.5** |
Note 1: This table was prepared using our second working definition of a “second generation migrant”, that is, where a native-born individual has a foreign-born father (see section 2.1).
Note 2: ***, ** and * indicate that the result is statistically different from zero at the 1%, 5% and 10% level of significance, respectively.
Source: Analysis based on ILO Harmonized Microdata collection (ILOSTAT), 2022 or the latest available year. See table A1 for more details.
Table A6. Effect of being a second-generation migrant (based on alternative definition) on monthly self-employment income (percentage)
|
Country |
All |
Men |
Women |
|---|---|---|---|
|
Europe |
|||
|
Austria |
-12.3 |
14.0 |
-57.8** |
|
Belgium |
-26.9 |
-39.6 |
9.1 |
|
Czechia |
-0.1 |
-4.0 |
12.9** |
|
Denmark |
-17.4 |
25.9 |
-72.9 |
|
France |
-27.8 |
-38.0 |
-20.5 |
|
Germany |
-17.8** |
-11.0 |
-23.3 |
|
Hungary |
61.3** |
77.4** |
48.2 |
|
Ireland |
-6.4 |
-12.2 |
20.5 |
|
Italy |
-32.5*** |
-48.5*** |
0*** |
|
Latvia |
-0.1 |
-9.5 |
-1.8 |
|
Lithuania |
44.3* |
59.4*** |
-43.0 |
|
Luxembourg |
-108.0 |
-114.8 |
-22.2 |
|
Netherlands |
-74.6* |
-39.3 |
-240.5** |
|
Poland |
11.4 |
-0.5 |
38.0*** |
|
Portugal |
-30.2** |
-19.3 |
-44.3 |
|
Serbia |
19.7 |
15.5 |
28.9 |
|
Slovenia |
-72.3 |
-68.9 |
-85.0* |
|
Spain |
-8.1 |
-12.9 |
3.3 |
|
Sweden |
4.7 |
0.9 |
15.7 |
|
Switzerland |
1.2 |
9.5 |
0.7 |
|
Europe |
-11.4** |
-2.3 |
-25.4*** |
|
Rest of the world |
|||
|
Australia |
3.1 |
-2.4 |
8.6 |
|
All countries |
-10.5** |
-2.4 |
-23.4** |
Note 1: This table was prepared using our second working definition of a “second generation migrant”, that is, where a native-born individual has a foreign-born father (see section 2.1).
Note 2: ***, ** and * indicate that the result is statistically different from zero at the 1%, 5% and 10% level of significance, respectively.
Source: Analysis based on ILO Harmonized Microdata collection (ILOSTAT), 2022 or the latest available year. See table A1 for more details.
References
Abramitzky, Ran, Leah Platt Boustan, and Katherine Eriksson. 2014. “A Nation of Immigrants: Assimilation and Economic Outcomes in the Age of Mass Migration”. Journal of Political Economy 122 (3): 467–506. https://doi.org/10.1086/675805.
Ahmad, Akhlaq. 2020. “Ethnic Discrimination against Second-Generation Immigrants in Hiring: Empirical Evidence from a Correspondence Test”. European Societies 22 (5): 659–681. https://doi.org/10.1080/14616696.2020.1822536.
Alba, Richard, and Nancy Foner. 2006. “The Second Generation from the Last Great Wave of Immigration: Setting the Record Straight”. Migration Information Source, 1 October 2006. https://www.migrationpolicy.org/article/second-generation-last-great-wave-immigration-setting-record-straight.
Alba, Richard, and Victor Nee. 1997. “Rethinking Assimilation Theory for a New Era of Immigration”. International Migration Review 31 (4): 826–874. https://doi.org/10.2307/2547416.
Algan, Yann, Christian Dustmann, Albrecht Glitz, and Alan Manning. 2010. “The Economic Situation of First and Second‐Generation Immigrants in France, Germany and the United Kingdom”. The Economic Journal 120 (542): F4–F30. https://doi.org/10.1111/j.1468-0297.2009.02338.x.
Amo-Agyei, Silas. 2020. The Migrant Pay Gap: Understanding Wage Differences between Migrants and Nationals. Geneva: ILO. https://www.ilo.org/resource/brief/migrant-pay-gap-understanding-wage-differences-between-migrants-and.
Arnoult, Émilie. 2023. “Les discriminations sur le marché du travail subies par les personnes d’origine maghrébine”. In Immigrés et descendants d’immigrés en France: Édition 2023, edited by the National Institute of Statistics and Economic Studies (INSEE), 49–57. https://www.insee.fr/fr/statistiques/6793310.
Åslund, Olof, and Oskar Nordström Skans. 2012. “Do Anonymous Job Application Procedures Level the Playing Field?” Industrial and Labor Relations Review 65 (1): 82–107. https://doi.org/10.1177/001979391206500105.
Aydemir, Abdurrahman, and Arthur Sweetman. 2007. “First- and Second-Generation Immigrant Educational Attainment and Labor Market Outcomes: A Comparison of the United States and Canada”. In Immigration (Research in Labor Economics, Vol. 27), edited by Barry R. Chiswick, 215–270. Leeds: Emerald Group Publishing. https://doi.org/10.1016/S0147-9121(07)00006-4.
Ballarino, Gabriele, and Nazareno Panichella. 2015. “The Occupational Integration of Male Migrants in Western European Countries: Assimilation or Persistent Disadvantage?” International Migration 53 (2): 338–352. https://doi.org/10.1111/imig.12105.
Bauböck, Rainer, Iseult Honohan, Thomas Huddleston, Derek Hutcheson, Jo Shaw, and Maarten Peter Vink. 2013. “Access to Citizenship and Its Impact on Immigrant Integration”. https://cadmus.eui.eu/bitstream/handle/1814/29828/AccesstoCitizenshipanditsImpactonImmigrantIntegration.pdf.
Beaman, Jean. 2017. Citizen Outsider: Children of North African Immigrants in France. Oakland: University of California Press. https://doi.org/10.1525/luminos.39.
Behrenz, Lars, Mats Hammarstedt, and Jonas Månsson. 2007. “Second‐Generation Immigrants in the Swedish Labour Market”. International Review of Applied Economics 21 (1): 157–174. https://doi.org/10.1080/02692170601035074.
Berggren, Niclas, Martin Ljunge, and Therese Nilsson. 2019. “Roots of Tolerance among Second-Generation Migrants”. Journal of Institutional Economics 15 (6): 999–1016. https://doi.org/10.1017/S1744137419000316.
Bhimji, Fazila. 2008. “Cosmopolitan Belonging and Diaspora: Second-Generation British Muslim Women Travelling to South Asia”. Citizenship Studies 12 (4): 413–427. https://doi.org/10.1080/13621020802184259.
Bijedić, Teita, and Alan T. Piper. 2018. “Different Strokes for Different Folks: Entrepreneurs’ Job Satisfaction and the Intersection of Gender and Migration Background”, SOEPpapers on Multidisciplinary Panel Research No. 1011. German Institute for Economic Research. https://hdl.handle.net/10419/191742.
Borjas, George J. 1992. “Ethnic Capital and Intergenerational Mobility”. The Quarterly Journal of Economics 107 (1): 123–150. https://doi.org/10.2307/2118325.
———. 1993. “The Intergenerational Mobility of Immigrants”. Journal of Labor Economics 11 (1): 113–135. https://doi.org/10.1086/298319.
Busetta, Giovanni, and Raffaele Staglianò. 2024. “Gender and Ethnic Discrimination: The Role of Institutional Context”. Migration Letters 21 (1): 636–645. https://doi.org/10.59670/ml.v21i1.5702.
Cadena, Brian C., Brian Duncan, and Stephen J. Trejo. 2015. “The Labor Market Integration and Impacts of US Immigrants”. In Handbook of the Economics of International Migration, Vol. 1, edited by Barry R. Chiswick and Paul W. Miller, 1197–1259. Kidlington and Amsterdam: Elsevier. https://doi.org/10.1016/B978-0-444-53768-3.00022-9.
Canada, Employment Equity Act Review Task Force. 2024. A Transformative Framework to Achieve and Sustain Employment Equity. https://www.canada.ca/content/dam/esdc-edsc/documents/corporate/portfolio/labour/programs/employment-equity/reports/act-review-task-force/EEA-Review-Task-Force-Report-2023-v2.pdf.
Card, David. 2005. “Is the New Immigration Really So Bad?” Working paper. University of California, Berkeley. https://davidcard.berkeley.edu/papers/new-immig.pdf.
CEACR (Committee of Experts on the Application of Conventions and Recommendations). 2013a. “Denmark – Direct request on the application of Convention No. 111”. https://www.ilo.org/dyn/normlex/en/f?p=1000:13100:0::NO:13100:P13100_COMMENT_ID,P11110_COUNTRY_ID,P11110_COUNTRY_NAME,P11110_COMMENT_YEAR:3059133,102609,Denmark,2012.
———. 2013b. “Germany – Direct request on the application of Convention No. 111”. https://www.ilo.org/dyn/normlex/en/f?p=1000:13100:0::NO:13100:P13100_COMMENT_ID,P11110_COUNTRY_ID,P11110_COUNTRY_NAME,P11110_COMMENT_YEAR:3058349,102643,Germany,2012.
———. 2016. “Denmark – Observation on the application of Convention No. 111”. https://www.ilo.org/dyn/normlex/en/f?p=1000:13100:0::NO:13100:P13100_COMMENT_ID,P11110_COUNTRY_ID,P11110_COUNTRY_NAME,P11110_COMMENT_YEAR:3258599,102609,Denmark,2015.
———. 2017. “Netherlands – Direct request on the application of Convention No. 122”. https://www.ilo.org/dyn/normlex/en/f?p=1000:13100:0::NO:13100:P13100_COMMENT_ID,P11110_COUNTRY_ID,P11110_COUNTRY_NAME,P11110_COMMENT_YEAR:3300760,102768,Netherlands,2016.
———. 2018. “Netherlands – Observation on the application of Convention No. 111”. https://www.ilo.org/dyn/normlex/en/f?p=1000:13100:0::NO:13100:P13100_COMMENT_ID,P11110_COUNTRY_ID,P11110_COUNTRY_NAME,P11110_COMMENT_YEAR:3337442,102768,Netherlands,2017.
———. 2019a. “General observation on discrimination based on race, colour and national extraction, in relation to Convention No. 111”. https://www.ilo.org/dyn/normlex/en/f?p=NORMLEXPUB:13100:0::NO::P13100_COMMENT_ID,P11110_COUNTRY_ID,P11110_COUNTRY_NAME,P11110_COMMENT_YEAR:3996050,,,2018.
———. 2019b. “Germany – Observation on the application of Convention No. 111”. https://www.ilo.org/dyn/normlex/en/f?p=1000:13100:0::NO:13100:P13100_COMMENT_ID,P11110_COUNTRY_ID,P11110_COUNTRY_NAME,P11110_COMMENT_YEAR:3957755,102643,Germany,2018.
———. 2019c. “Germany – Direct request on the application of Convention No. 111”. https://www.ilo.org/dyn/normlex/en/f?p=1000:13100:0::NO:13100:P13100_COMMENT_ID,P11110_COUNTRY_ID,P11110_COUNTRY_NAME,P11110_COMMENT_YEAR:3957759,102643,Germany,2018.
———. 2021a. “Germany – Direct request on the application of Convention No. 111”. https://www.ilo.org/dyn/normlex/en/f?p=1000:13100:0::NO:13100:P13100_COMMENT_ID,P11110_COUNTRY_ID,P11110_COUNTRY_NAME,P11110_COMMENT_YEAR:4059875,102643,Germany,2020.
———. 2021b. “Germany – Observation on the application of Convention No. 111”. https://www.ilo.org/dyn/normlex/en/f?p=1000:13100:0::NO:13100:P13100_COMMENT_ID,P11110_COUNTRY_ID,P11110_COUNTRY_NAME,P11110_COMMENT_YEAR:4059871,102643,Germany,2020.
———. 2022. “Republic of Moldova – Direct request on the application of Convention No. 122”. https://normlex.ilo.org/dyn/normlex/en/f?p=NORMLEXPUB:13100:0::NO::P13100_COMMENT_ID,P11110_COUNTRY_ID,P11110_COUNTRY_NAME,P11110_COMMENT_YEAR:4120311,102695,Republic%20of%20Moldova,2021.
———. 2023a. “Austria – Direct request on the application of Convention No. 122”. https://www.ilo.org/dyn/normlex/en/f?p=1000:13100:0::NO:13100:P13100_COMMENT_ID,P11110_COUNTRY_ID,P11110_COUNTRY_NAME,P11110_COMMENT_YEAR:4318125,102549,Austria,2022.
———. 2024a. “Netherlands – Observation on the application of Convention No. 111”. https://www.ilo.org/dyn/normlex/en/f?p=1000:13100:0::NO:13100:P13100_COMMENT_ID,P11110_COUNTRY_ID,P11110_COUNTRY_NAME,P11110_COMMENT_YEAR:4363632,102768,Netherlands,2023.
———. 2024b. “Netherlands – Direct request on the application of Convention No. 111”. https://www.ilo.org/dyn/normlex/en/f?p=1000:13100:0::NO:13100:P13100_COMMENT_ID,P11110_COUNTRY_ID,P11110_COUNTRY_NAME,P11110_COMMENT_YEAR:4363629,102768,Netherlands,2023.
Chiswick, Barry R. 1977. “Sons of Immigrants: Are They at an Earnings Disadvantage?” The American Economic Review 67 (1): 376–380. https://www.jstor.org/stable/1815933.
Collins, William J. 2003. “The Labor Market Impact of State-Level Anti-Discrimination Laws, 1940–1960”. Industrial and Labor Relations Review 56 (2): 244–272. https://doi.org/10.2307/3590937.
Constant, Amelie F., Annabelle Krause, Ulf Rinne, and Klaus F. Zimmermann. 2011. “Economic Preferences and Attitudes of the Unemployed: Are Natives and Second Generation Migrants Alike?” International Journal of Manpower 32 (7): 825–851. https://doi.org/10.1108/01437721111174776.
Corluy, Vincent, Joost Haemels, Ive Marx, and Gerlinde Verbist. 2015. “The Labour Market Position of Second-Generation Immigrants in Belgium”, National Bank of Belgium Working Paper No. 285. https://www.econstor.eu/handle/10419/144497.
Crul, Maurice, and Hans Vermeulen. 2003. “The Second Generation in Europe”. International Migration Review 37 (4): 965–986. https://doi.org/10.1111/j.1747-7379.2003.tb00166.x.
Devos, Louise, Louis Lippens, Dries Lens, François Rycx, Mélanie Volral, and Stijn Baert. 2025. “Labour Market Disadvantages of Citizens with a Migration Background in Belgium: A Systematic Review”. De Economist 173: 121–175. https://doi.org/10.1007/s10645-024-09443-5.
Duncan, Brian, and Stephen J. Trejo. 2018. “Socioeconomic Integration of U.S. Immigrant Groups over the Long Term: The Second Generation and Beyond”. In The Human and Economic Implications of Twenty-First Century Immigration Policy, edited by Susan Pozo, 33–62. Kalamazoo, MI: W.E. Upjohn Institute for Employment Research. https://doi.org/10.17848/9780880996570.ch3.
Efendic, Nedim, Fredrik W. Andersson, and Karl Wennberg. 2016. “Growth in First- and Second-Generation Immigrant Firms in Sweden”. International Small Business Journal: Researching Entrepreneurship 34 (8): 1028–1052. https://doi.org/10.1177/0266242615612533.
ENAR (European Network Against Racism). 2018. Racism & Discrimination in Employment in Europe 2013–2017. https://migrant-integration.ec.europa.eu/library-document/enar-shadow-report-racism-discrimination-employment-europe-2013-2017_en.
Eurofound. 2010. “Ethnic Entrepreneurship – Case Study: Vienna, Austria”. https://www.eurofound.europa.eu/system/files/2015-01/ef1121en2.pdf.
European Commission. 2021. “Denmark: Second-Generation Migrants Overtake Ethnic Danish in Higher Education”. 29 April 2021. https://migrant-integration.ec.europa.eu/news/denmark-second-generation-migrants-overtake-ethnic-danish-higher-education_en.
Eurostat. 2011. Migrants in Europe: A Statistical Portrait of the First and Second Generation – 2011 Edition. https://ec.europa.eu/eurostat/web/products-statistical-books/-/ks-31-10-539.
———. 2016. “First and Second-Generation Immigrants – Statistics on Employment Conditions”. September 2016. https://ec.europa.eu/eurostat/statistics-explained/SEPDF/cache/53475.pdf.
Falcke, Swantje, Christoph Meng, and Romy Nollen. 2020. “Educational Mismatches for Second Generation Migrants: An Analysis of Applied Science Graduates in the Netherlands”. Journal of Ethnic and Migration Studies 46 (15): 3235–3251. https://doi.org/10.1080/1369183X.2020.1738211.
Fehr, Ernst, and Simon Gächter. 2000. “Fairness and Retaliation: The Economics of Reciprocity”. Journal of Economic Perspectives 14 (3): 159–82. https://doi.org/10.1257/jep.14.3.159.
Fernández-Reino, Mariña, Jonas Radl, and María Ramos. 2018. “Employment Outcomes of Ethnic Minorities in Spain: Towards Increasing Economic Incorporation among Immigrants and the Second Generation?” Social Inclusion 6 (3): 48–63. https://doi.org/10.17645/si.v6i3.1441.
Fertig, Michael, and Christoph M. Schmidt. 2001. “First- and Second-Generation Migrants in Germany: What Do We Know and What Do People Think?” IZA Discussion Paper No. 286. IZA – Institute of Labor Economics. https://doi.org/10.2139/ssrn.267223.
Fleischmann, Fenella, and Jaap Dronkers. 2007. “The Effects of Social and Labour Market Policies of EU Countries on the Socio-Economic Integration of First- and Second-Generation Immigrants from Different Countries of Origin”. European University Institute Working Paper No. RSCAS 2007/19. https://cadmus.eui.eu/handle/1814/6849.
Fredman, Sandra, Meghan Campbell, Nomfundo Ramalekana, Rishika Sahgal, Max Harris, Toel Koyithara, and Alice Taylor. 2021. “Redressing the Race Pay Gap”. Oxford Human Rights Hub. https://ohrh.law.ox.ac.uk/wp-content/uploads/2021/04/Race-Pay-Gap.pdf.
Fugazza, Marco. 2003. “Racial Discrimination: Theories, Facts and Policy”. International Labour Review 142 (4): 507–541. https://doi.org/10.1111/j.1564-913X.2003.tb00542.x.
Galli, Fausto, and Giuseppe Russo. 2019. “Immigration Restrictions and Second-Generation Cultural Assimilation: Theory and Quasi-Experimental Evidence”. Journal of Population Economics 32: 23–51. https://doi.org/10.1007/s00148-018-0694-z.
Gans, Herbert J. 1992. “Second-Generation Decline: Scenarios for the Economic and Ethnic Futures of the Post-1965 American Immigrants”. Ethnic and Racial Studies 15 (2): 173–192. https://doi.org/10.1080/01419870.1992.9993740.
Gries, Thomas, Margarete Redlin, and Moonum Zehra. 2022. “Educational Assimilation of First-Generation and Second-Generation Immigrants in Germany”. Journal of International Migration and Integration 23: 815–845. https://doi.org/10.1007/s12134-021-00863-9.
Gupta, Nabanita Datta, and Lene Kromann. 2014. “Differences in the Labor Market Entry of Second-Generation Immigrants and Ethnic Danes”. IZA Journal of Migration 3: 16. https://doi.org/10.1186/s40176-014-0016-5.
Hammarstedt, Mats, and Mårten Palme. 2012. “Human Capital Transmission and the Earnings of Second-Generation Immigrants in Sweden”. IZA Journal of Migration 1: 4. https://doi.org/10.1186/2193-9039-1-4.
Haug, Werner. 2005. “Migrants and Their Descendants in Switzerland: An Overview”. Geographica Helvetica 60 (3): 162–169. https://doi.org/10.5194/gh-60-162-2005.
Heath, Anthony F., Catherine Rothon, and Elina Kilpi. 2008. “The Second Generation in Western Europe: Education, Unemployment, and Occupational Attainment”. Annual Review of Sociology 34: 211–235. https://doi.org/10.1146/annurev.soc.34.040507.134728.
Hull, Marie, and Jonathan Norris. 2020. “The Skill Development of Children of Immigrants”. Economics of Education Review 78: 102036. https://doi.org/10.1016/j.econedurev.2020.102036.
ILO. 2012. Giving Globalization a Human Face: General Survey on the Fundamental Conventions concerning Rights at Work in Light of the ILO Declaration on Social Justice for a Fair Globalization, 2008, Report III (Part 1B), International Labour Conference, 101st Session. ILC.101/III/1B. https://www.ilo.org/sites/default/files/wcmsp5/groups/public/@ed_norm/@relconf/documents/meetingdocument/wcms_174846.pdf.
———. 2016. Minimum Wage Policy Guide. https://www.ilo.org/publications/minimum-wage-policy-guide-full-chapters.
———. 2022. Pay Transparency Legislation: Implications for Employers’ and Workers’ Organizations. https://www.ilo.org/publications/pay-transparency-legislation-implications-employers-and-workers.
———. 2023. International Classification of Status in Employment (ICSE-18) Manual. https://webapps.ilo.org/ilostat-files/Documents/ICSE-18_manual.pdf.
Kunz, Johannes S. 2016. “Analyzing Educational Achievement Differences between Second-Generation Immigrants: Comparing Germany and German-Speaking Switzerland”. German Economic Review 17 (1): 61–91. https://doi.org/10.1111/geer.12062.
Kuptsch, Christiane, and Fabiola Mieres. 2021. “Who Is a ‘Migrant’ in Diverse Societies? Blurred Concepts and Their Policy Implications”. In The Future of Diversity, edited by Christiane Kuptsch and Éric Charest, 235–254. Geneva: ILO. https://researchrepository.ilo.org/esploro/outputs/995319482202676.
Laganà, Francesco, Julien Chevillard, and Jacques-Antoine Gauthier. 2014. “Socio-Economic Background and Early Post-Compulsory Education Pathways: A Comparison between Natives and Second-Generation Immigrants in Switzerland”. European Sociological Review 30 (1): 18–34. https://doi.org/10.1093/esr/jct019.
Lippi-Green, Rosina. 1997. “What We Talk about when We Talk about Ebonics: Why Definitions Matter”. The Black Scholar 27 (2): 7-11. https://www.jstor.org/stable/41068724.
Lo Iacono, Sergio, and Neli Demireva. 2018. “Returns to Foreign and Host Country Qualifications: Evidence from the US on the Labour Market Placement of Migrants and the Second Generation”. Social Inclusion 6 (3): 142–152. https://doi.org/10.17645/si.v6i3.1509.
Lüdemann, Elke, and Guido Schwerdt. 2013. “Migration Background and Educational Tracking”. Journal of Population Economics 26: 455–481. https://doi.org/10.1007/s00148-012-0414-z.
Luthra, Renee Reichl. 2010. “Enduring Inequality: Labour Market Outcomes of the Immigrant Second Generation in Germany”. Institute for Social and Economic Research Working Paper No. 2010-30. https://hdl.handle.net/10419/65947.
Luxembourg, STATEC (National Institute of Statistics and Economic Studies). 2023. Le Luxembourg en chiffres: Édition 2023. https://luxembourg.public.lu/fr/publications/statec-le-luxembourg-en-chiffres.html.
Maskileyson, Dina, Moshe Semyonov, and Eldad Davidov. 2021. “Economic Integration of First- and Second-Generation Immigrants in the Swiss Labour Market: Does the Reason for Immigration Make a Difference?” Population, Space and Place 27 (6): e2426. https://doi.org/10.1002/psp.2426.
Midtbøen, Arnfinn H. 2016. “Discrimination of the Second Generation: Evidence from a Field Experiment in Norway”. Journal of International Migration and Integration 17: 253–272. https://doi.org/10.1007/s12134-014-0406-9.
Monscheuer, Ole. 2023. “National Identity and the Integration of Second-Generation Immigrants”. Labour Economics 82: 102327. https://doi.org/10.1016/j.labeco.2023.102327.
Netherlands, Ministry of Social Affairs and Employment. 2014. “Actieplan arbeidsmarktdiscriminatie” [Action Plan against Labour Market Discrimination]. https://open.overheid.nl/documenten/ronl-archief-57d17dde-c850-4633-b84f-7e80242566cd/pdf.
Netherlands, Social and Economic Council. 2014. “Discriminatie werkt niet!” [Discrimination does not work!]. https://www.ser.nl/-/media/ser/downloads/adviezen/2014/discriminatie-werkt-niet.pdf.
Ochmann, Nico. 2024. “Wages of UK Immigrant Men across Generations: Who Catches Up?” Oxford Economic Papers 76 (2): 395–411. https://doi.org/10.1093/oep/gpad006.
OECD (Organisation for Economic Co-operation and Development). 2007. International Migration Outlook: Annual Report – 2007 Edition. https://www.oecd.org/en/publications/2007/06/international-migration-outlook-2007_g1gh7f69.html.
———. 2023. PISA 2022 Results (Volume I): The State of Learning and Equity in Education. https://doi.org/10.1787/53f23881-en.
Ours, Jan C. van, and Justus Veenman. 2003. “The Educational Attainment of Second-Generation Immigrants in the Netherlands”. Journal of Population Economics 16: 739–753. https://doi.org/10.1007/s00148-003-0147-0.
Pearson, Nina, and David Pritchett. 2023. “Understanding the Significance of Pay Equity and Navigating Compliance in 2023”. EDGE Certified Foundation, 13 September 2023. https://www.edge-cert.org/article/pay-equity-regulation-compliance/.
Pérez, Santiago. 2017. “The (South) American Dream: Mobility and Economic Outcomes of First- and Second-Generation Immigrants in Nineteenth-Century Argentina”. The Journal of Economic History 77 (4): 971–1006. https://doi.org/10.1017/S0022050717000808.
Portes, Alejandro, Patricia Fernández-Kelly, and William Haller. 2009. “The Adaptation of the Immigrant Second Generation in America: A Theoretical Overview and Recent Evidence”. Journal of Ethnic and Migration Studies 35 (7): 1077–1104. https://doi.org/10.1080/13691830903006127.
Ramakrishnan, S. Karthick. 2004. “Second-Generation Immigrants? The ‘2.5 Generation’ in the United States”. Social Science Quarterly 85 (2): 380–399. https://www.jstor.org/stable/42955949.
Rooth, Dan-Olof, and Jan Ekberg. 2003. “Unemployment and Earnings for Second Generation Immigrants in Sweden: Ethnic Background and Parent Composition”. Journal of Population Economics 16 (4): 787–814. https://doi.org/10.1007/s00148-003-0163-0.
Ruspini, Paolo. 2010. “Second Generation Migrants in Switzerland (Including an Exploratory Fieldwork in the Ticino Canton)”. Report prepared for the international research project “Bridge – Successful Pathways for the Second Generation of Migrants”. https://doi.org/10.13140/RG.2.1.3360.1121.
Schnell, Philipp. 2014. Educational Mobility of Second-Generation Turks: Cross-National Perspectives. Amsterdam: Amsterdam University Press. https://www.jstor.org/stable/j.ctt12877kn.
Schüller, Simone. 2015. “Parental Ethnic Identity and Educational Attainment of Second-Generation Immigrants”. Journal of Population Economics 28: 965–1004. https://doi.org/10.1007/s00148-015-0559-7.
Thwaytes, Rainer. 2017. “Report on Citizenship Law: Australia”, GLOBALCIT Country Report No. 2017/11. European University Institute. https://cadmus.eui.eu/handle/1814/46449.
Tubergen, Frank van. 2005. “Self-Employment of Immigrants: A Cross-National Study of 17 Western Societies”. Social Forces 84 (2): 709–732. https://www.jstor.org/stable/3598475.
United Kingdom, Commission for Racial Equality. 2005. Code of Practice on Racial Equality in Employment.
United Kingdom, Race Disparity Unit. 2023. “Standards for Ethnicity Data”. https://www.gov.uk/government/publications/standards-for-ethnicity-data.
United Nations. 2024. World Population Prospects 2024: Summary of Results. https://desapublications.un.org/publications/world-population-prospects-2024-summary-results.
Waldinger, Roger, Nelson Lim, and David Cort. 2007. “Bad Jobs, Good Jobs, No Jobs? The Employment Experience of the Mexican American Second Generation”. Journal of Ethnic and Migration Studies 33 (1): 1–35. https://doi.org/10.1080/13691830601043471.
Watermann, Henriette, Ulrike Fasbender, and Ute-Christine Klehe. 2023. “Withdrawing from Job Search: The Effect of Age Discrimination on Occupational Future Time Perspective, Career Exploration, and Retirement Intentions”. Acta Psychologica 234: 103875. https://doi.org/10.1016/j.actpsy.2023.103875.
Winkler, Anne. 2016. “Women’s Labor Force Participation”, IZA World of Labor, No. 289. https://doi.org/10.15185/izawol.289.
Acknowledgements
We are grateful to Fabiola Mieres, Anil Duman, Tahmina Karimova, Catherine Saget, and Caroline Fredrickson for their thoughtful comments and valuable insights, which significantly enriched this paper.