


Disruption without Dividend?
How the Digital Divide and Task Differences Split GenAI’s Global Impact
Abstract
This article examines how generative artificial intelligence (GenAI) could affect labor markets globally, with particular attention to the uneven distribution of risks and opportunities between advanced and developing economies. Cross-country differences in occupational structure suggest that developing economies face lower aggregate automation exposure than advanced economies but comparable potential for task augmentation. However, disparities in digital infrastructure create an asymmetry: workers in positions vulnerable to automation typically maintain sufficient internet connectivity to experience displacement effects even in low-income settings, while those who could benefit from GenAI augmentation face substantial digital infrastructure gaps that may prevent them from realizing productivity gains. This finding suggests that developing countries may experience the disruptive effects of GenAI faster than its productivity benefits. At the same time, conventional occupational exposure measures systematically overestimate the impact of GenAI in developing countries by assuming uniform task content across economies. Using data from skills surveys, the article demonstrates that workers in developing countries perform substantially fewer non-routine analytical tasks—the primary targets of GenAI—even within occupations classified as highly exposed. These findings highlight the importance of adapting GenAI exposure measures to reflect developing countries’ distance from the technology frontier.
JEL codes: J24, O33, J21, O15, L86
Keywords: Generative artificial intelligence, Automation, Digital divide, Occupational exposure, Task automation, Technological diffusion
Introduction
A rapidly growing body of literature documenting the potential labor market impacts of Generative Artificial Intelligence (GenAI) has emerged ever since the launch of ChatGPT in November 2022. While early experimental studies focused on specific occupational segments reveal substantial heterogeneity in impacts, 1the aggregate implications for labor demand, job quality, and earnings distribution remain highly uncertain. Estimates of broader labor market exposure suggest that GenAI’s distinctive capacity to impact high-skilled, cognitive work sets it apart from previous waves of automation2, with advanced economies facing both greater risks and opportunities compared to emerging markets.3 Yet a critical gap persists in our understanding of how technological capabilities translate into realized economic impacts across countries at different levels of economic development.
Our previous research on Latin America and the Caribbean (LAC) (Gmyrek et al., 2024) revealed a fundamental constraint for global AI diffusion: nearly half of the jobs that could theoretically benefit from GenAI augmentation are unable to realize this potential due to a lack of access to basic digital technologies at work. This underscores that the digital divide is not only a constraint on technology adoption but also a powerful amplifier of global inequality: when correcting for limited connectivity, income-related differences in countries’ total exposure to GenAI become even more pronounced.4
To further explore how digital infrastructure constraints interact with occupational exposure to GenAI to shape the distributional impacts of this technology across all income levels and geographic contexts, this study updates and extends our 2024 methodology, incorporating recent advances in GenAI capabilities and providing the first comprehensive, cross-regional analysis. In addition, we leverage skills surveys for 46 countries at varying levels of economic development to estimate the degree of task variability within occupations exposed to GenAI. This adds an additional layer for understanding whether standardized exposure measures can adequately capture the heterogeneous organization of work across the global economy.
This article yields four principal findings. First, a phenomenon that we described as “small buffer, big bottlenecks” in our earlier study concerning LAC (Gmyrek et al., 2024) is equally observed in the global context, demonstrating an inherent asymmetry of threats versus benefits of GenAI technologies in developing countries. Specifically, workers in roles susceptible to automation possess sufficient internet connectivity for relatively rapid displacement even within low-income contexts. In contrast, those positioned to benefit from GenAI-driven job augmentation confront substantial digital infrastructure deficits, including the lack adequate internet connectivity. This finding suggests that the disruptive impacts of GenAI may manifest more swiftly than its productivity benefits in developing nations.
Second, our analysis of detailed country-level data from multiple survey sources confirms a positive correlation between GenAI exposure and economic development, with high-income economies demonstrating higher average exposure rates (about 32 percent of total employment) than low-income economies (about 15 percent).5 We show that this correlation is mainly driven by occupations facing a higher risk of automation, since the share of jobs amenable to augmentation by GenAI is more equally distributed across countries.
Third, while low- and lower-middle-income countries exhibit lower aggregate automation risks due to their distinct employment structures, GenAI poses a considerable threat to office-based occupations, representing a disproportionate share of the “good” skilled jobs in these economies. This raises particular concerns, as such clerical positions have historically provided broad-based pathways to quality employment and facilitated women’s entry into the workforce in today’s advanced economies. These white-collar bypass dynamics risk closing off career pathways to upward mobility before they emerge, mirroring the logic of premature deindustrialization.
Fourth, we show that conventional measures of occupational exposure systematically overestimate GenAI’s influence in developing countries by presuming uniform task content across diverse economies. Using harmonized data from the PIAAC and STEP surveys, we show that workers in developing countries perform substantially fewer non-routine analytical (NRA) tasks — the primary targets for augmentation by GenAI — even within occupations classified as highly exposed. This suggests that, without accounting for cross-country differences in task composition, current global exposure estimates likely overstate the technology’s transformative potential in lower-income settings.
In the remainder of this paper, Section 2 outlines the methodological framework, Section 3 presents the empirical findings, and Section 4 concludes with a brief discussion.
Data and Methods
1.1 Occupations’ Exposure to GenAI
To model GenAI’s potential impact, we rely on the 2025 ILO–NASK Index of Occupational Exposure (Gmyrek et al., 2025), which offers the most recent and internationally harmonized tool for this purpose. Developed jointly by the International Labour Organization (ILO) and Poland’s National Research Institute (NASK), the index builds on the earlier 2023 ILO framework (Gmyrek et al., 2023) but incorporates several key methodological enhancements. It draws on nearly 30,000 tasks from Poland’s national 6-digit occupational classification — mapped directly to ISCO-08 and regularly updated by the national administration — and combines survey data from 1,640 workers across all major occupational groups with expert validation and generative AI modelling. The resulting scores reflect the perceived technical feasibility of tasks’ automation through GenAI-based tools, with tasks nested within a hierarchical structure of occupations.6
The revised index moves beyond the original binary approach of automation versus augmentation potential by introducing a more nuanced, gradient-based categorization that captures the spectrum of GenAI exposure across different occupational roles. The framework classifies ISCO-08 4-digit level occupations into six distinct categories based on two key dimensions: the mean exposure score (μ) and the standard deviation of task-level scores (σ) within each occupation.
The six categories of the index represent increasing levels of GenAI exposure and varying degrees of task-level variability. ‘Not Exposed’ occupations show minimal GenAI impact with low task variability and stable exposure scores. ‘Minimal Exposure’ occupations demonstrate limited overall exposure but contain some tasks with moderate automation potential. ‘Exposed’ occupations are classified into four gradients, which progress from Gradient 1 (low exposure, high task variability) through Gradient 4 (highest exposure, low task variability).7 This refined framework addresses the interpretative limitations of earlier binary classification systems, particularly the ‘big unknown’ category, by providing a continuous exposure measure that better reflects the nuanced ways GenAI can impact different occupations.
A recent comparative review by the Centre for European Policy Studies (CEPS) (Nurski et al., 2025, pp. 35–46; Annex E, pp. 108–118) underscores the diversity of existing AI exposure indices. Analysing twelve prominent studies, it shows that automation risk scores vary widely depending on the occupational task data used, the way technological capabilities are measured, and how these two dimensions are linked. Some indices provide broad measures of exposure, while others distinguish between automation and augmentation potential. Importantly, studies focusing on generative AI converge in finding that middle- and high-skilled occupations—clerical, professional, and managerial—are most exposed, in contrast with earlier or broader studies that emphasised lower-skilled manual jobs. Yet the review also highlights key limitations: most studies rely on U.S.-based O*NET data and fixed occupational descriptions, which constrains cross-country comparability, and very few account for task variation within occupations or across national contexts.
Against this backdrop, the ILO–NASK Index offers several advantages as a benchmark. First, it is one of the few indices constructed outside the U.S. context, drawing on nearly 30,000 tasks from a national classification system directly mapped to ISCO-08. This ensures both international comparability and sensitivity to national task variation. Second, it integrates multiple sources—worker survey data, expert validation, and GenAI modelling—rather than relying solely on static job descriptions. Third, it introduces a gradient-based framework that captures both the mean exposure level and within-occupation variability of task exposure, directly addressing one of the shortcomings identified in the CEPS review. For these reasons, we adopt the ILO–NASK Index as the most recent, harmonised, and globally applicable measure of GenAI exposure.8
Recent empirical evidence confirms that these exposure patterns are already manifesting in real labor market outcomes. Hampole et al. (2025) provide evidence that using task exposure’s mean and standard deviation helps predict job automation and augmentation. The authors apply this framework to U.S. online platform data and find that labor demand decreases with the average exposure of workers’ tasks to AI technologies, and that labor demand increases with the dispersion of task exposures to AI. Teutloff et al. (2025) show that following ChatGPT’s launch, labor demand increased exclusively among occupations that either complement GenAI capabilities or remain largely unexposed to the technology. Conversely, demand collapsed for roles highly susceptible to substitution—particularly writers and translators—validating the distinction between augmentation and automation pathways. These findings are reinforced by data from Upwork (2025), which reveal similar trends of differential impacts across augmentation and automation-exposed roles. Demirci et al. (2025) provide additional corroboration, documenting a 21 percent decline in postings for automation-exposed tasks like writing and coding relative to manual-intensive work. Parallel effects were observed for image creation following the introduction of GenAI visual tools. Furthermore, evidence from Brynjolfsson, Chandar, and Chen (2025) indicates that the adoption of generative AI in the US has disproportionately affected younger workers: employment among those aged 22–25 in the most exposed occupations fell by around 13 percent relative to less exposed peers, even after controlling for firm-level conditions. The study attributes this primarily to employment contraction, rather than wage adjustment, especially in occupations more vulnerable to automation than augmentation. These early market signals suggest that the distributional consequences of GenAI are unfolding rapidly and in ways that closely align with task-based predictions about complementarity versus substitutability.
1.2 Country-level GenAI Exposure
We combine information from multiple data sources with occupation-level information to estimate GenAI exposure across the largest possible number of countries. We use 50 countries with individual-level data and ISCO08 4-digit occupation from four different collections. First, we use LABLAC, a harmonized dataset of labor force surveys for countries in Latin America. Second, we use the Harmonized Survey on Households Living Standards for nine countries from the West African Economic and Monetary Union (WAEMU). Third, we use the second round of PIAAC surveys, covering mostly high-income economies. Finally, we use the Global Labor Database (GLD), a harmonized collection of labor force surveys from developing countries across various regions. The complete list of household surveys contained in these collections is described in Table A3 in the Appendix. To expand the country coverage, we also use employment tabulations at the ISCO08 2-digit from ILOSTAT for the latest year among countries not included in Table A1. The final sample includes 135 countries and represents 67 percent of global employment (see Table A2).
The next paragraphs describe the estimation steps. First, we merge the microdata that contains ISCO08 at the 4-digit level with the index of exposure to GenAI at the same occupation disaggregation.9 Second, we proceed to calculate more aggregated exposure measures at the 1-,2-, and 3-digit ISCO occupation levels for this group of countries. These aggregated averages serve as the foundation for imputing exposure values to countries lacking 4-digit occupation information.
When imputing the exposure measures to a country without 4-digit data, we need to select a ‘donor’ country from the pool of countries with 4-digit data. We do this by pairing similar countries across several dimensions correlated with GenAI exposure, using a k-Nearest Neighbors (kNN) algorithm. The algorithm uses each country’s employment share by ISCO08 1-digit occupation, internet penetration rate, World Bank region classification, log GDP per capita (PPP-adjusted), and total population (in log). Occupation shares come from ILOSTAT, while the remaining variables came from the World Development Indicators (WDI), each taken from the most recent year available per country. All variables are standardized to avoid differential influence in distance calculations. The imputation process prioritizes the highest available occupation code granularity: if a given country only has 3-digit occupation data, averages computed at this level are imputed accordingly.
1.3 Adjustment by Internet Access
To incorporate measures of internet access into national GenAI exposure averages, we use the microdata listed in Table A3 in the Appendix.10 For countries in the SEDLAC, WAEMU, and PIAAC collections, there are 32 surveys with household- and individual-level information on internet access. An initial step before modeling internet access probability involved harmonizing internet access variables across surveys. Particularly, while SEDLAC and WAEMU measure internet connectivity using a single variable at the household level, PIAAC measures internet access at the individual level using several dimensions. PIAAC contains information on ownership and frequency of use of electronic devices for various purposes that imply internet usage, such as communication, information access, entertainment, and online shopping. A list of potential internet access variables was thus constructed by combining information about the use and frequency of devices like computers, smartphones, and tablets for daily, non-work-related purposes. We compare these options for Chile against the estimate of internet access coming from SEDLAC, since this country is available in both datasets. We then selected the PIAAC measure of internet access, which gave an estimate closest to that of SEDLAC.11
In the second step, we harmonize and integrate both individual-level and country-level predictors into the model. Despite inherent differences among data sources, we chose predictors that leverage available survey information consistently. Individual-level predictors included gender, age group, education level, and the occupation and industry sector codes at 1-digit ISCO and ISIC aggregation for people employed. Age groups were harmonized following the classification used in PIAAC (16-25, 26-35, 36-45, 46-55, and 56-65). Consequently, since PIAAC’s youngest respondent is 16 years old, the samples from SEDLAC and WAEMU surveys were similarly restricted to individuals aged 16 years or older, ensuring the model predicted internet access probabilities specifically for working-age individuals. We harmonized education levels following the categorization used by GLD and WAEMU: no education, primary, secondary, and tertiary education (completed or incomplete). We use ISCO08 at the 1-digit for occupations, and classify sectors of economic activity in the 10 categories used by the GLD collection.
Country-level predictors include internet penetration rate, electricity access, urbanization rate, mobile subscriptions per 100 inhabitants, and GDP per capita (PPP-adjusted), all sourced from WDI for each country’s latest available year. Following Gmyrek et al. (2024), these data were used to estimate a logistic regression (logit) model predicting internet access probability in countries lacking direct information, enabling the inclusion of a broader number of countries in the analysis. The estimated logistic model predicting internet access probability at the individual level is described by Equation 1, where the dependent variable internet is a dummy equal to 1 if the individual has internet access and zero otherwise. The vector X comprises the individual and country-level characteristics described above. The unit of observation is the individual, indexed by i, nested within country c; all predictions are therefore expressed with respect to this two-level structure.
Furthermore, we include a set of interactions among individual characteristics—gender, age group, education level, and occupation—to capture heterogeneity in the relationship. We use a Lasso regularization approach due to the high number of predictors. Using a hyperparameter (λ) chosen through cross-validation, the Lasso algorithm penalizes irrelevant predictor coefficients, thereby mitigating overfitting risks.
Subsequently, predicted probabilities were used to construct an internet access dummy variable. Selecting an appropriate threshold to classify individuals as having or not having internet access based on predicted probabilities requires analyzing the ROC curve.12 This analysis indicated that probabilities above 66 percent imply internet access (internet = 1). This classification process enabled assessment of model predictive performance by comparing the predicted dummy variable to actual internet access information, where available. The overall percentage of correct model predictions was 83 percent.
We use the estimated model to adjust GenAI exposure calculations by internet access. First, for the 18 countries without actual data on internet access, the individual-level predicted probability of internet access and its complement (the predicted probability of not having internet access) were used to split each measure of exposure in two components. Second, for the 32 countries with actual data on internet access, the binary indicator was used in a similar fashion. In particular, overall exposure to GenAI was split into being exposed and having internet access, and being exposed and not having internet access.13
1.4 Task content of jobs measures
We develop measures of task content across occupations by combining data from two primary sources: the OECD’s Survey of Adult Skills—part of the Programme for the International Assessment of Adult Competencies (PIAAC)—and the World Bank’s STEP Skills Measurement Program (STEP).
PIAAC assesses adults’ proficiency in key information-processing skills such as literacy, numeracy, and problem-solving. It surveys individuals aged 16–65 about the frequency and intensity with which they perform broad categories of workplace tasks. The survey spans 39 middleand high-income countries across two cycles. The first cycle included three rounds of data collection between 2012 and 2017; the second cycle comprised one round between 2018 and 2023. We restrict our analysis to countries with available data on task-related variables and occupational classifications. We retain only the most recent data for countries included in both cycles, resulting in a final sample of 31 countries.
STEP captures skill requirements in urban labor markets across low- and middle-income countries. It surveys individuals aged 15–64 about whether they perform specific tasks at work. The survey covers 15 countries with complete data on task variables and occupational categories.
The PIAAC and STEP questionnaires are broadly similar in structure but differ notably in their response scales: PIAAC employs a more granular integer scale, while most STEP questions use binary responses. These differences can lead to systematic discrepancies in responses due to extreme response behavior, potentially compromising comparability between the two surveys (Caunedo et al., 2023). Another challenge arises from high non-response rates in STEP, particularly in lower-income countries.14 To address these issues, we adopt the approach proposed by Caunedo et al. (2023), leveraging questions on computer use at work, which are identical in wording and response scale across both surveys. These questions also exhibit the lowest non-response rates—less than 0.1 percent in both datasets.
We harmonize the PIAAC and STEP data in three steps. First, due to STEP’s urban sample frame, we exclude respondents in the occupational category Skilled agricultural, forestry, and fishery workers from both datasets. Second, to account for differences in national populations, we normalize individual survey weights to sum to one within each country. Third, we map 21 task-related questions in PIAAC into seven composite task categories by averaging responses within each group: Reading, Creative thinking, Personal interactions, Guiding and coaching, Structure and repetition, Controlling machines, and Hands/manual tasks. The Appendix details question groupings in Table A6.
For each of the seven composite task categories, we estimate its linear relationship with the answers to the computer use questions in PIAAC using worker-level data across countries and then use this estimated relationship and the actual answers to the computer use questions in STEP to predict values for each of the seven task categories. For each task category, we estimate from PIAAC:
Where Task is a task category (Reading, Creative thinking, Personal interactions, Guiding and coaching, Structure and repetition, Controlling machines, and Hands/manual tasks), i indexes workers and c countries. We then use the estimated α, β, and the actual Compic in STEP to predict the Taskic in the STEP sample for worker i in country c. The underlying assumption is that an occupation combines these detailed task categories, whose relationship with the computer use at work question is common across occupations and the STEP and PIAAC countries. Caunedo et al. (2023) conduct several robustness checks including a comparison with task-content measures constructed from the raw survey data in STEP (Table A7) and find that the latter are strongly correlated with the predicted measures.
We standardize the task measures using the U.S. workers’ mean and standard deviation in PIAAC. We then aggregate these standardized categories into five broader task content measures, following the framework of Autor et al. (2003): non-routine analytical (NRA), non-routine interpersonal (NRI), routine cognitive (RC), routine manual (RM), and non-routine manual (NRM). Specifically, NRA is the sum of the standardized scores for reading and creative thinking; NRI combines personal interaction and guiding/coaching; RC corresponds to structured/repetitive tasks; RM to machine control; and NRM to hands/manual tasks. These five composite measures are then again standardized using their respective means and standard deviations among U.S. workers in PIAAC.
Using these standardized worker-level task scores, we compute occupation-level task content measures by taking weighted averages within each occupation-country cell, using survey weights. For the 7 PIAAC countries with available 4-digit ISCO-08 occupation codes, we construct task measures at the 4-digit occupational level. To ensure broader comparability across PIAAC and STEP datasets, we also produce task content measures at the 2-digit ISCO level for all 46 countries.
Figure 1: Jobs’ Total Exposure to GenAI vs. GDP per capita
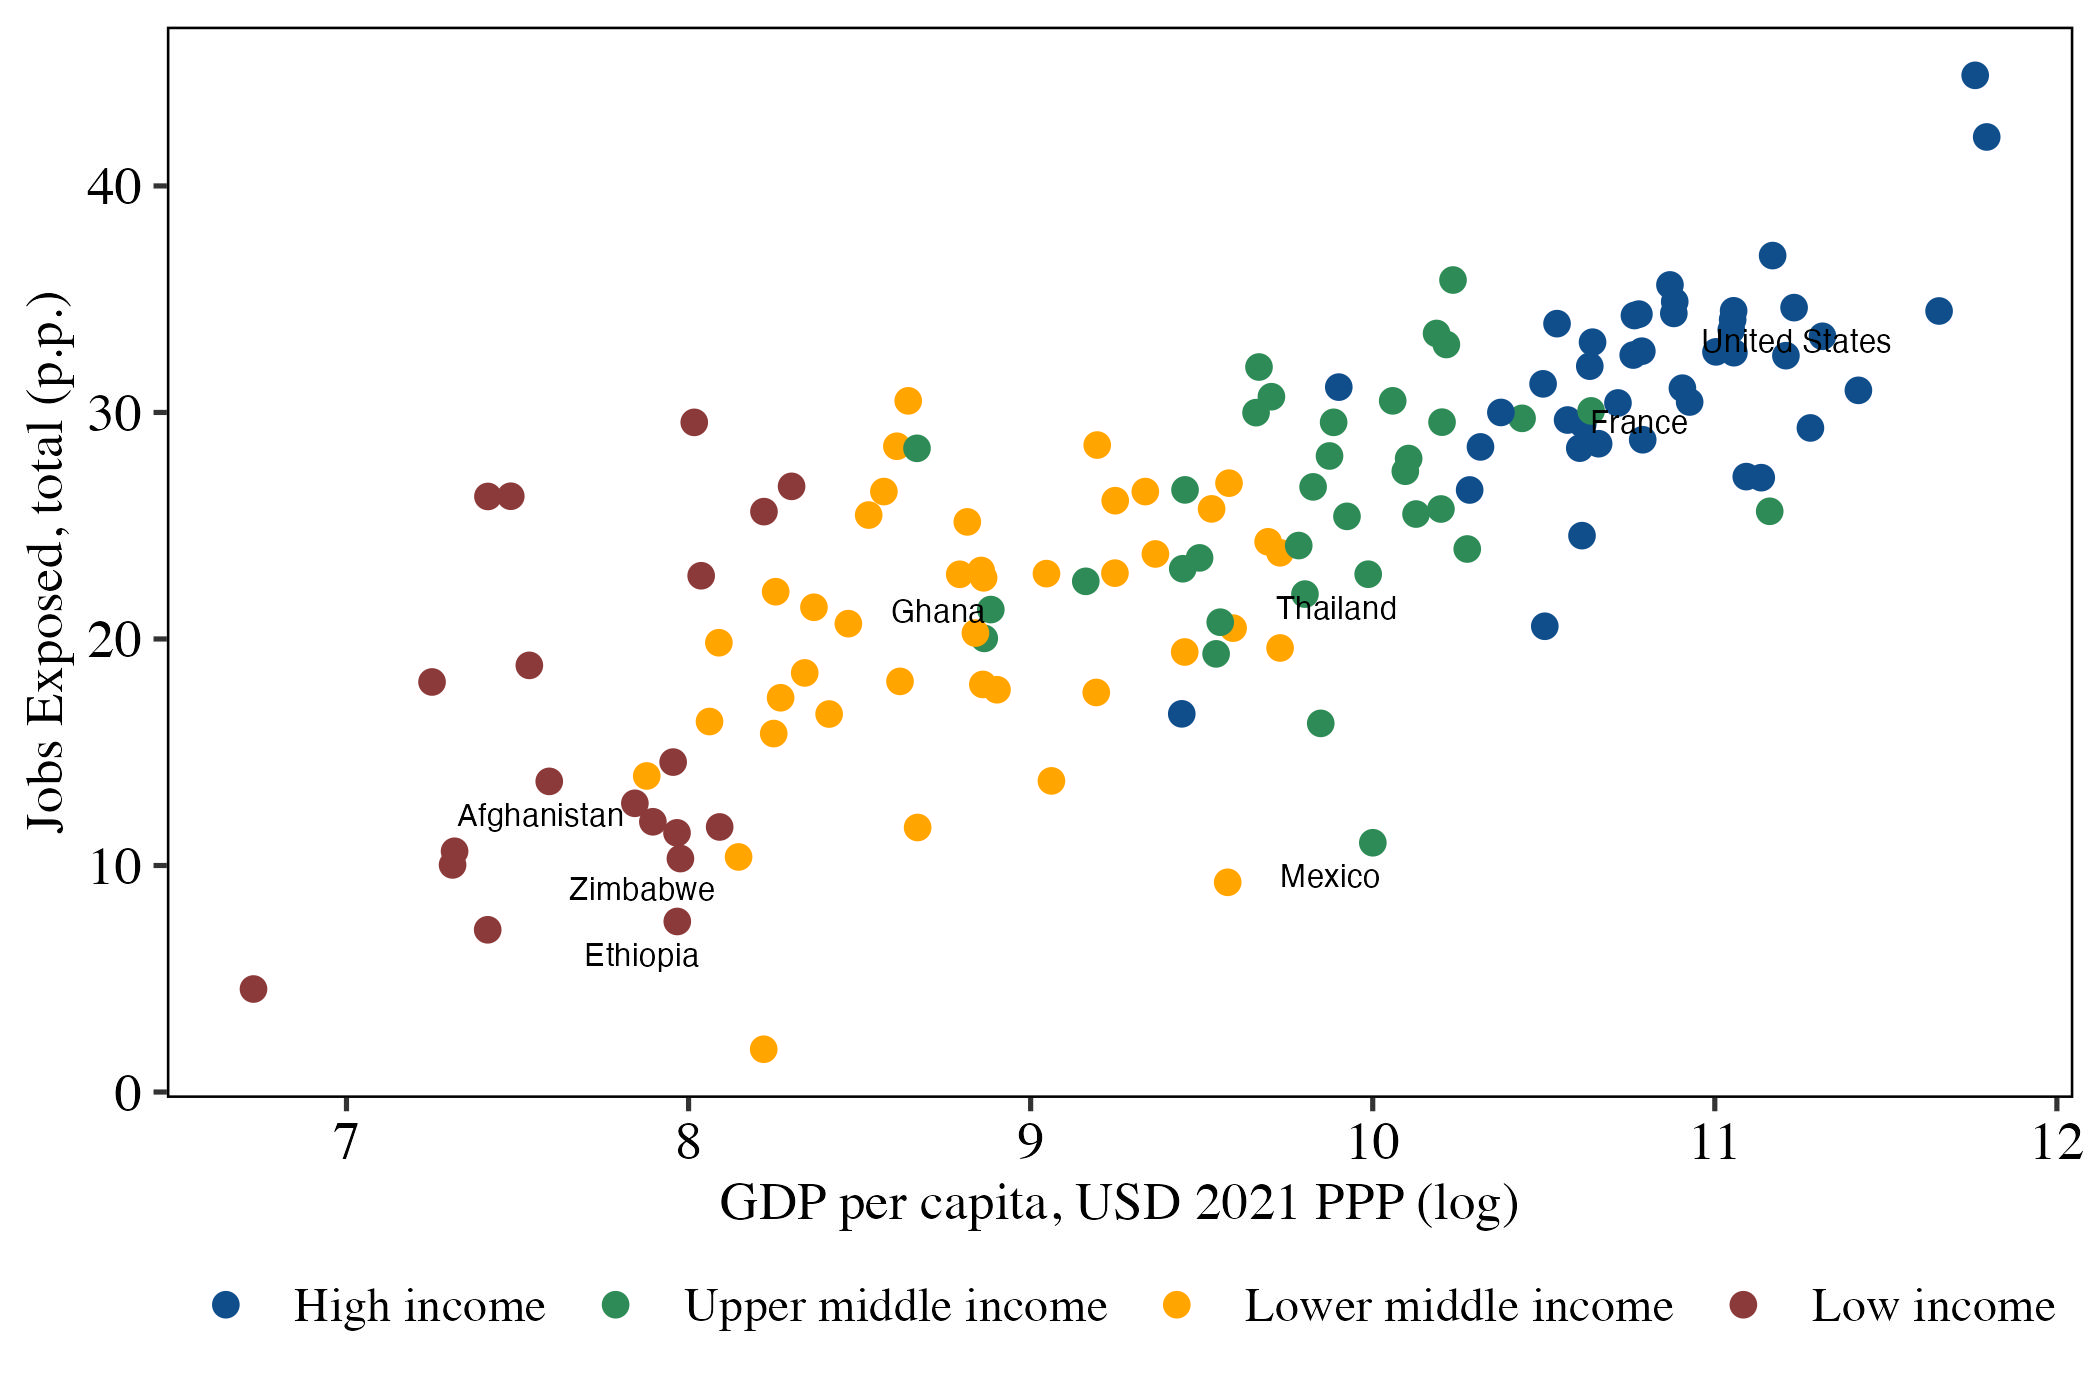
Notes: The vertical axis plots the country-level average (in percentage points (p.p.))
of occupations exposed to AI, where an occupation is defined as exposed if any gradient
equals one. The horizontal axis displays GDP per capita (PPP, constant 2021 U.S.
dollars), obtained from the WDI; GDP data correspond to 2024.
Results
2.1 Country-level jobs exposure to GenAI
Employment exposure to generative artificial intelligence positively correlates with economic development. Advanced economies exhibit the highest exposure rates, exemplified by the United States and France with 30 percent or more of employment exposed to GenAI. Conversely, lowerincome economies such as Ethiopia and Zimbabwe demonstrate substantially lower exposure levels, at 10 percent or less of employment.
The predominant category of exposed employment—about 17 percent globally—falls within moderate exposure levels (gradients 1 and 2) that favor job augmentation rather than substitution. In contrast, roughly 8 percent of employment lies within gradients 3 and 4, which correspond to jobs facing higher automation risks. Although substantial variation in automation exposure exists between poorer and wealthier nations, these disparities are much smaller for the augmentation-related gradients. This asymmetry suggests that, if occupational structure is the main driver of GenAI exposure, potential productivity gains from generative AI are more evenly distributed across countries than automation risks, which remain concentrated in high-income economies. In other words, based solely on theoretical occupational exposure, developing countries appear relatively better positioned to benefit from the adoption of these technologies compared with the automation risks they face.
Figure 2: Jobs’ Exposure to GenAI vs. GDP per capita, by exposure type
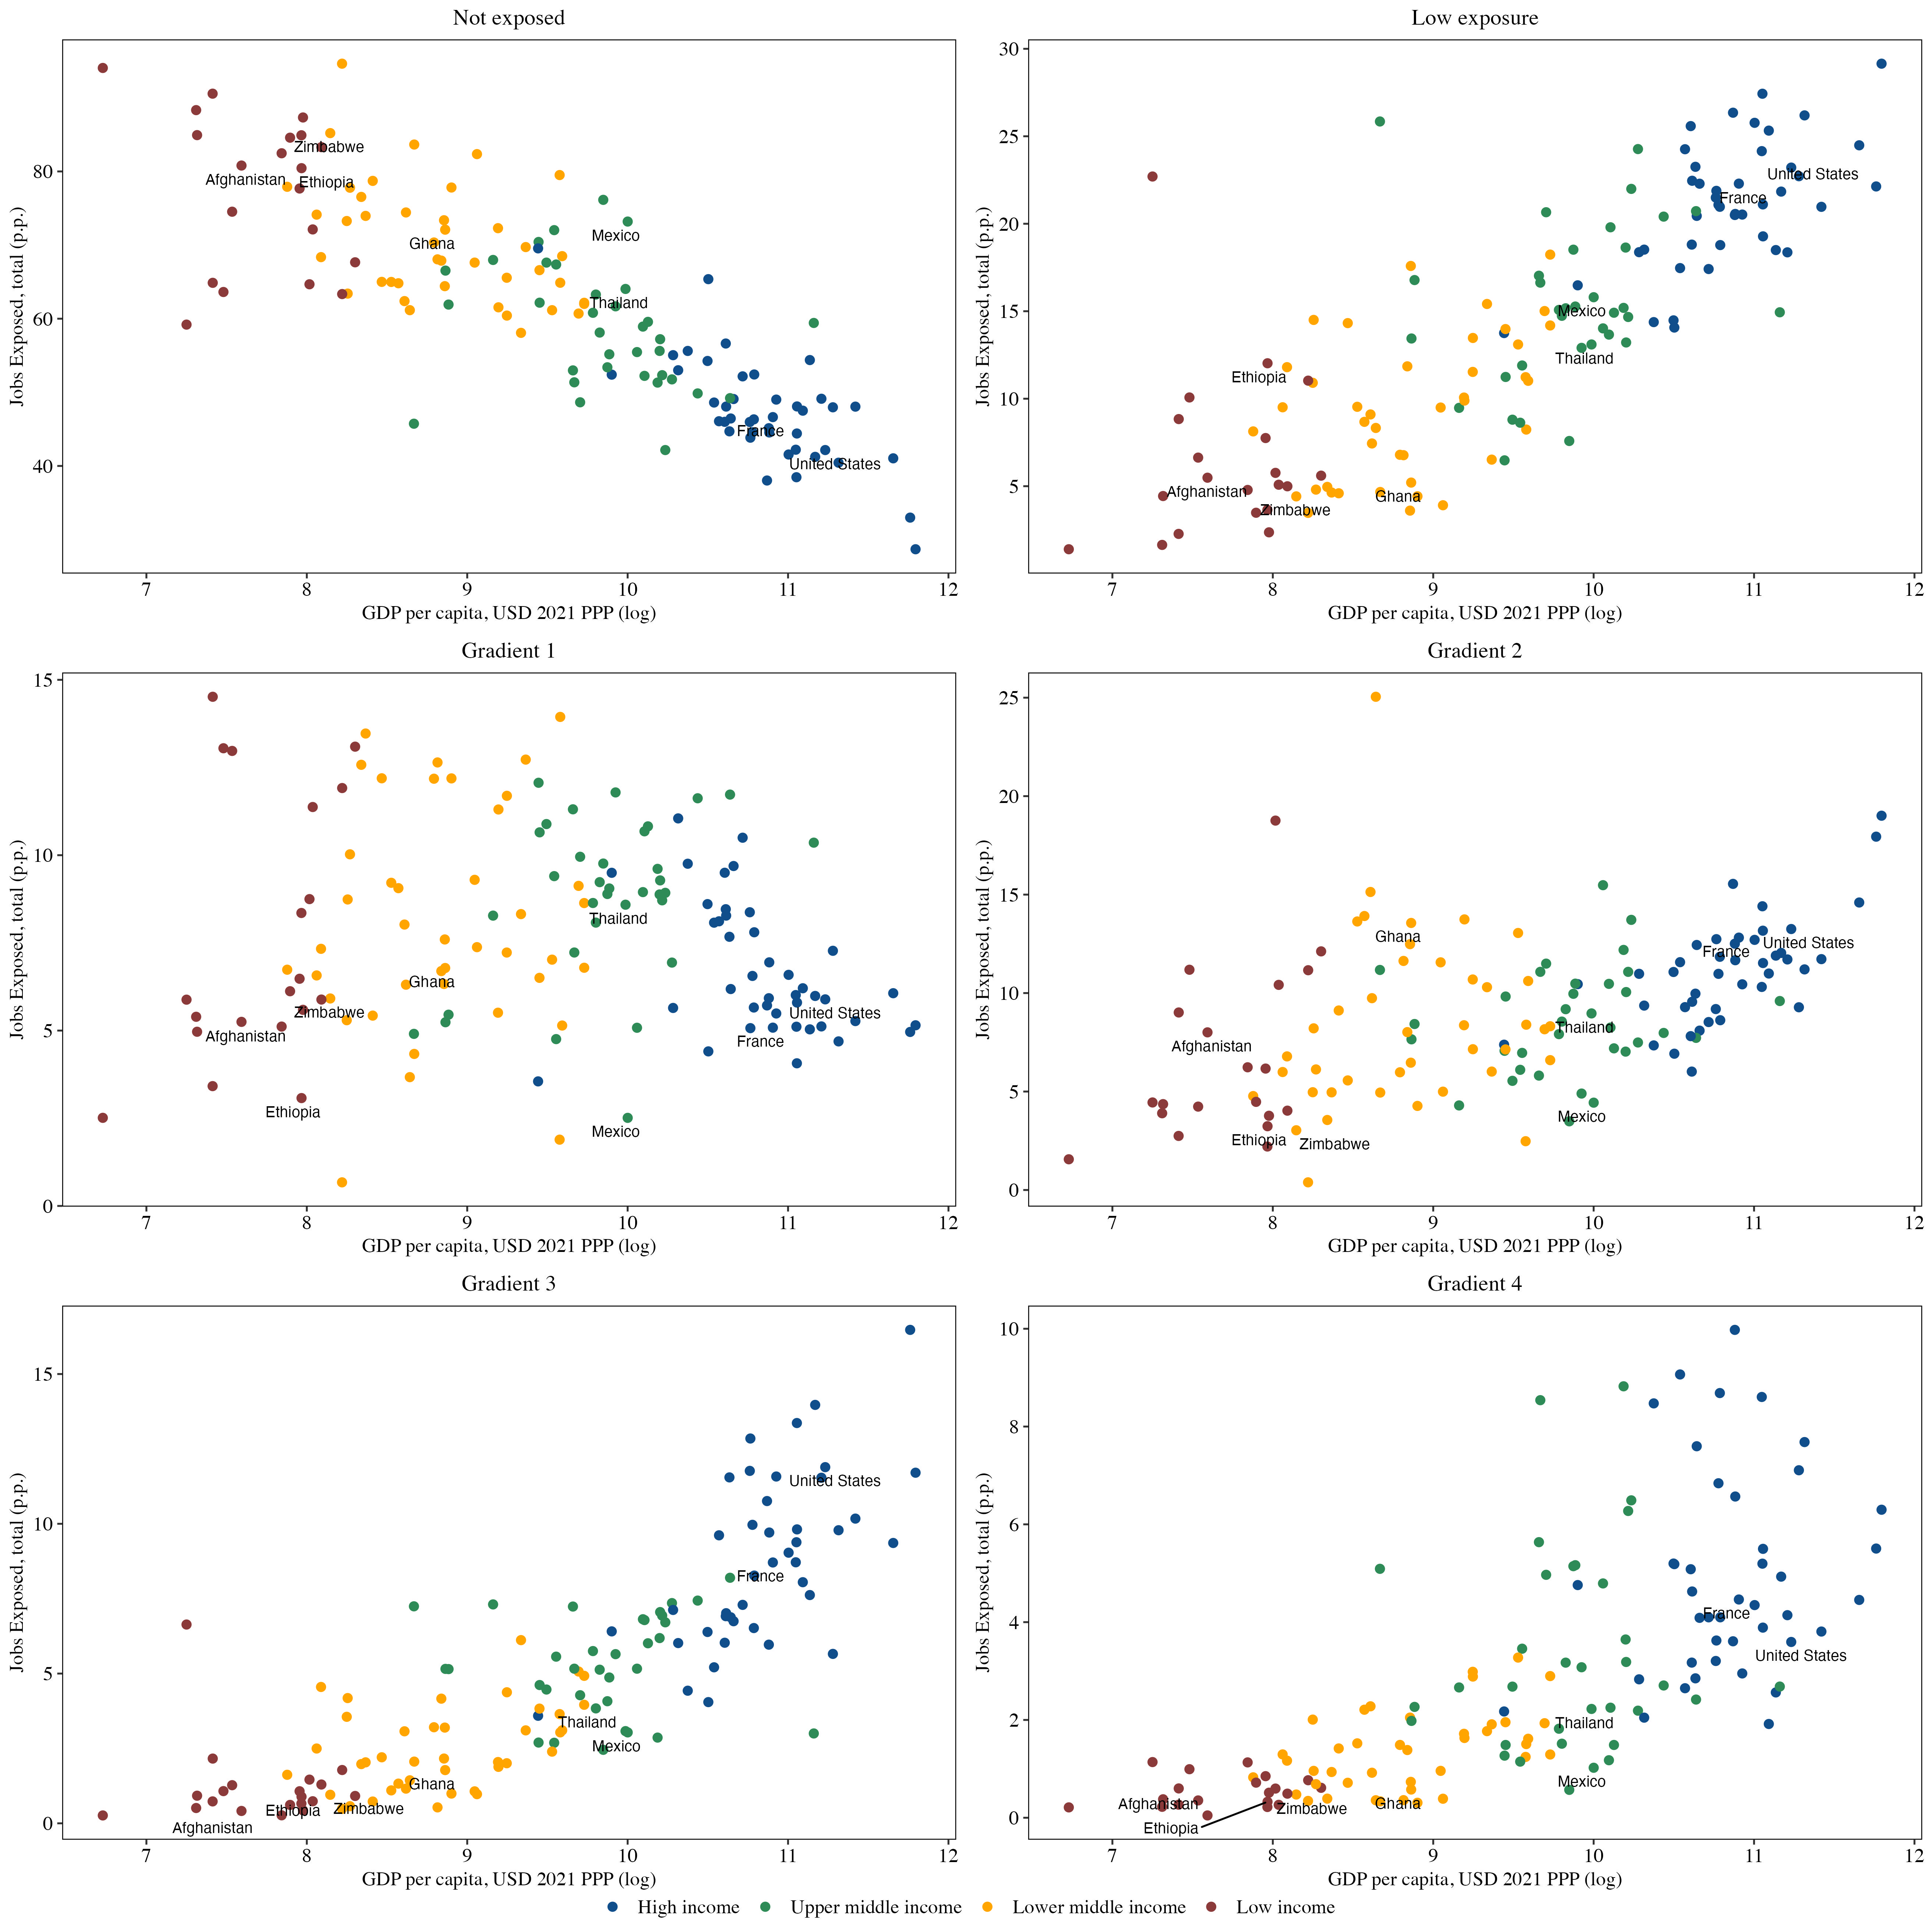
Notes: The vertical axis plots the country-level average (in p.p.) of occupations across six exposure categories: not exposed and low exposed at the top, followed by the four exposure gradients.
Realizing this optimistic scenario requires assuming equal implementation opportunities across countries at different income levels. To assess the plausibility of that assumption, the next section adjusts the exposure estimates by incorporating current access to the internet: a necessary condition for the effective adoption of GenAI.
2.2 GenAI exposure by Internet Access
The figures presented in this section are estimated using survey data for 49 countries representing 43 percent of global employment, as described in section 2.3 and Table A3. Despite these limitations, we achieve a satisfactory balance across most income level brackets and regions, with the exception of East Asia.15
Figure 3: Jobs exposed to GenAI, by internet access
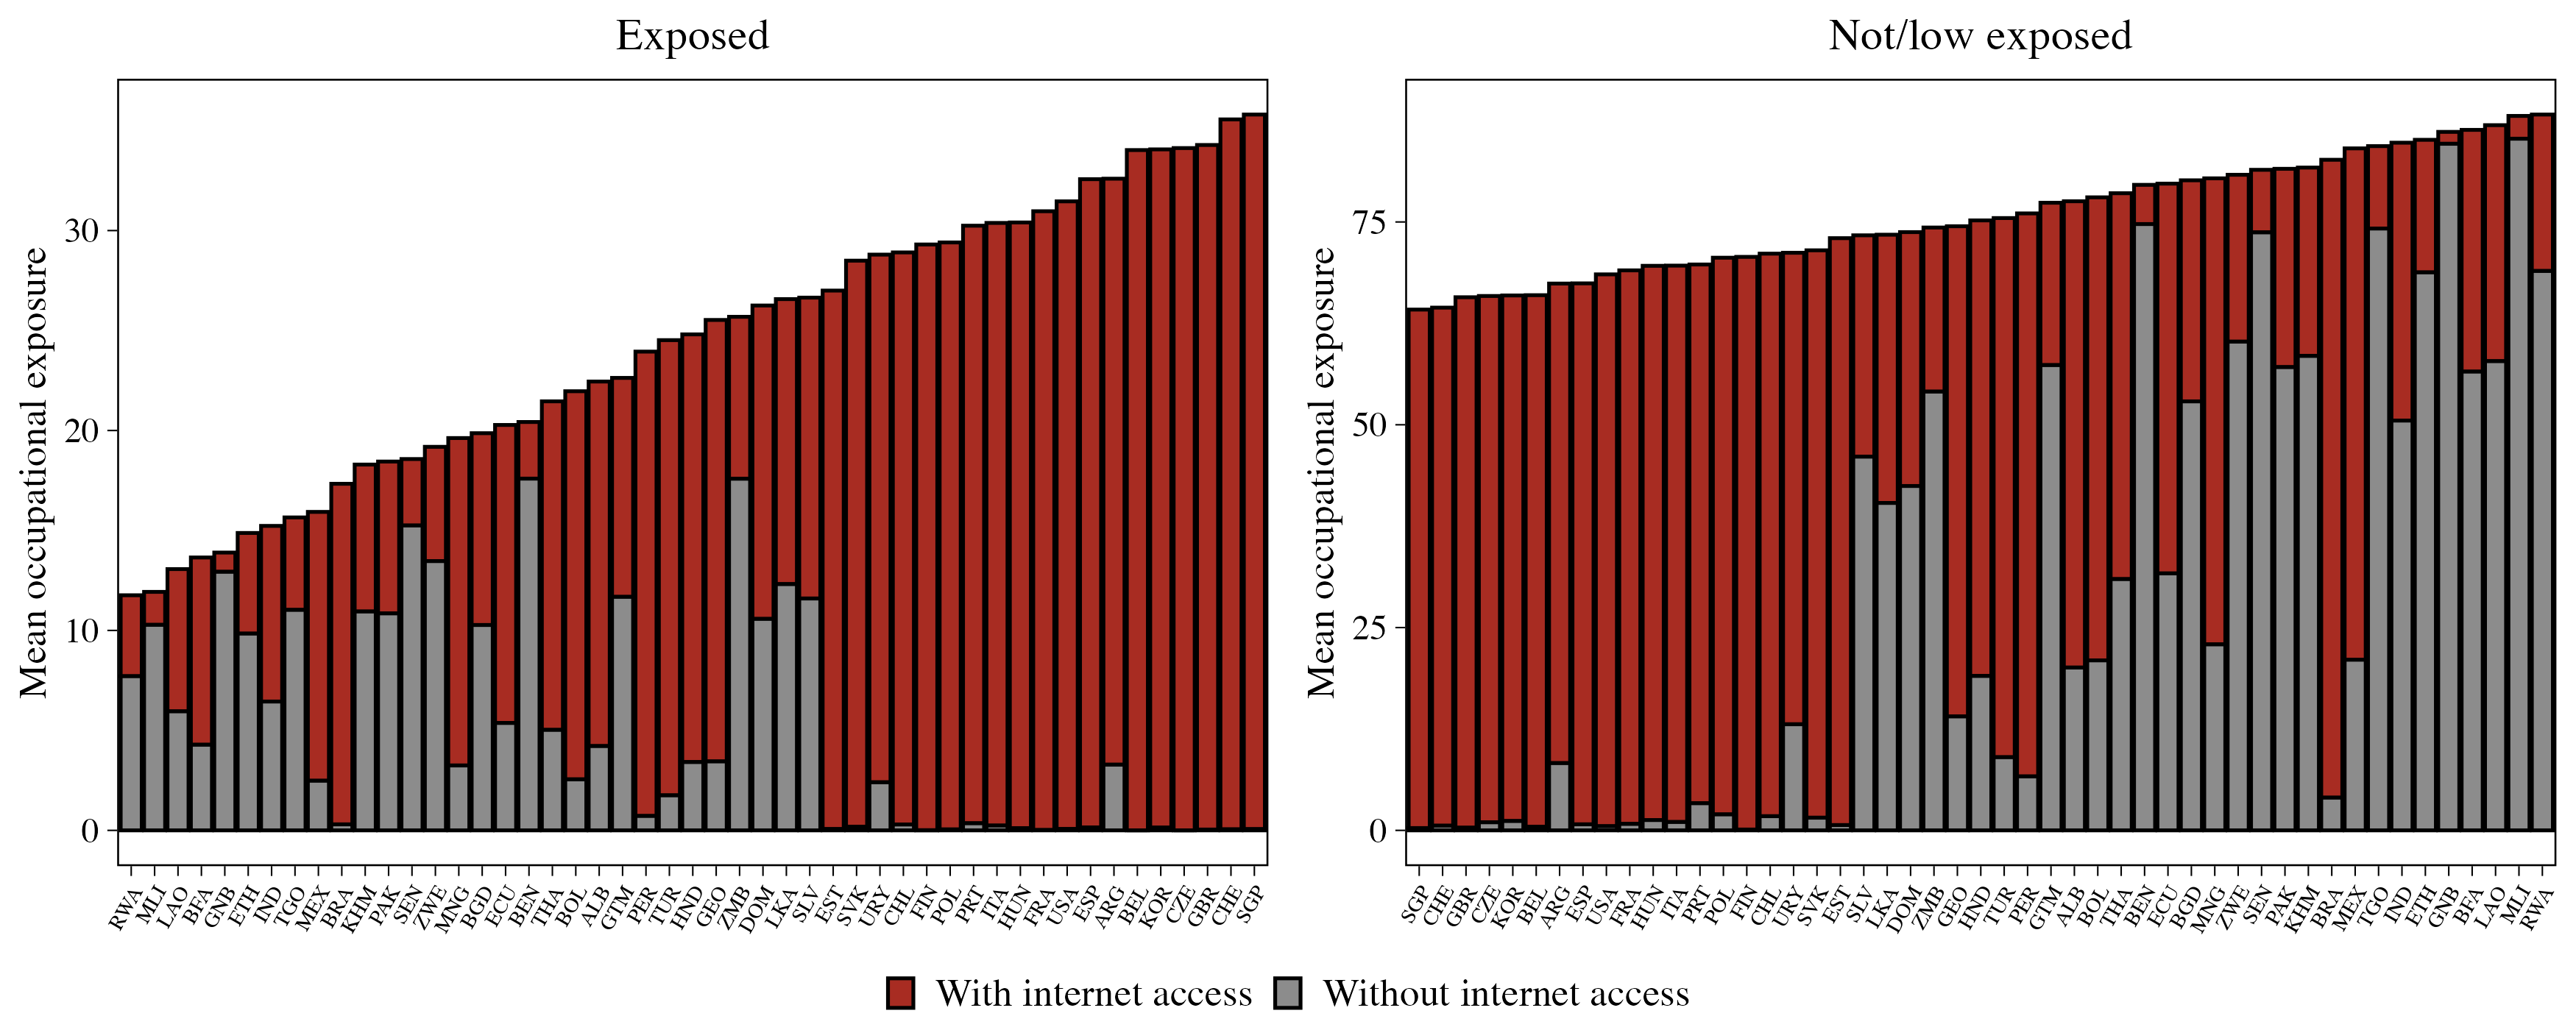
Notes: The vertical axis plots the country-level average (in p.p.) of occupations across occupations exposed (on the left) and low or non-exposed (on the right). An occupation is classified as ‘exposed’ if it falls within four exposure gradients. The horizontal axis includes all countries where internet access data are available, either obtained from household surveys or predicted by the model.
In broad terms, correcting for the digital divide amplifies the income-related differences in countries’ total exposure. As a starting point, developing countries have a smaller total share of occupations exposed to GenAI (see Subsection 3.1). Such low level of exposure falls even further in several countries where a significant fraction of such workers–in some countries the majority of them–do not have internet connectivity (Figure 3). Take the case of Mali, where just 12 percent of today’s jobs are exposed to GenAI, but only 10 percent of such workers have internet access. In other words, just 1.2 percent of workers in Mali hold jobs that are both exposed to GenAI and can make practical use of it. In comparison, about one out of three workers in Switzerland and Singapore have jobs exposed to GenAI, and all of them have access to the internet.
The implications of the digital gap become even more apparent when examining specific occupations. Take, for example, shop sales assistants—a common job type potentially exposed to GenAI augmentation through tools that support customer interaction, inventory management, or sales analytics. This occupation represents 6.7 percent of total employment in Poland and 5.1 percent in Guinea-Bissau. While nearly all workers in this occupation have internet access in Poland, only 4.3 percent do in Guinea-Bissau. This stark contrast highlights how differences in access to digital infrastructure can put workers in similar roles, but across different countries, in dramatically different positions to harness the potential benefits—or face the risks—of GenAI.16
Among all countries in the sample, there are 441.8 million jobs that fall within the Gradient 1 and 2 exposure categories, meaning that they could leverage GenAI for job augmentation. However, 66.9 million (15.1 percent) of those jobs do not have internet access. The broad occupational categories with in this category include managers, technicians, and service and sales workers (Figure 4). In low- and lower-middle-income countries, plant and machine operators are highly prominent in this group, with a large part of this results due to vehicle drivers. One has to keep in mind that we lack high quality labour force and internet data for many LICs, meaning that in reality this gap is likely significantly higher.
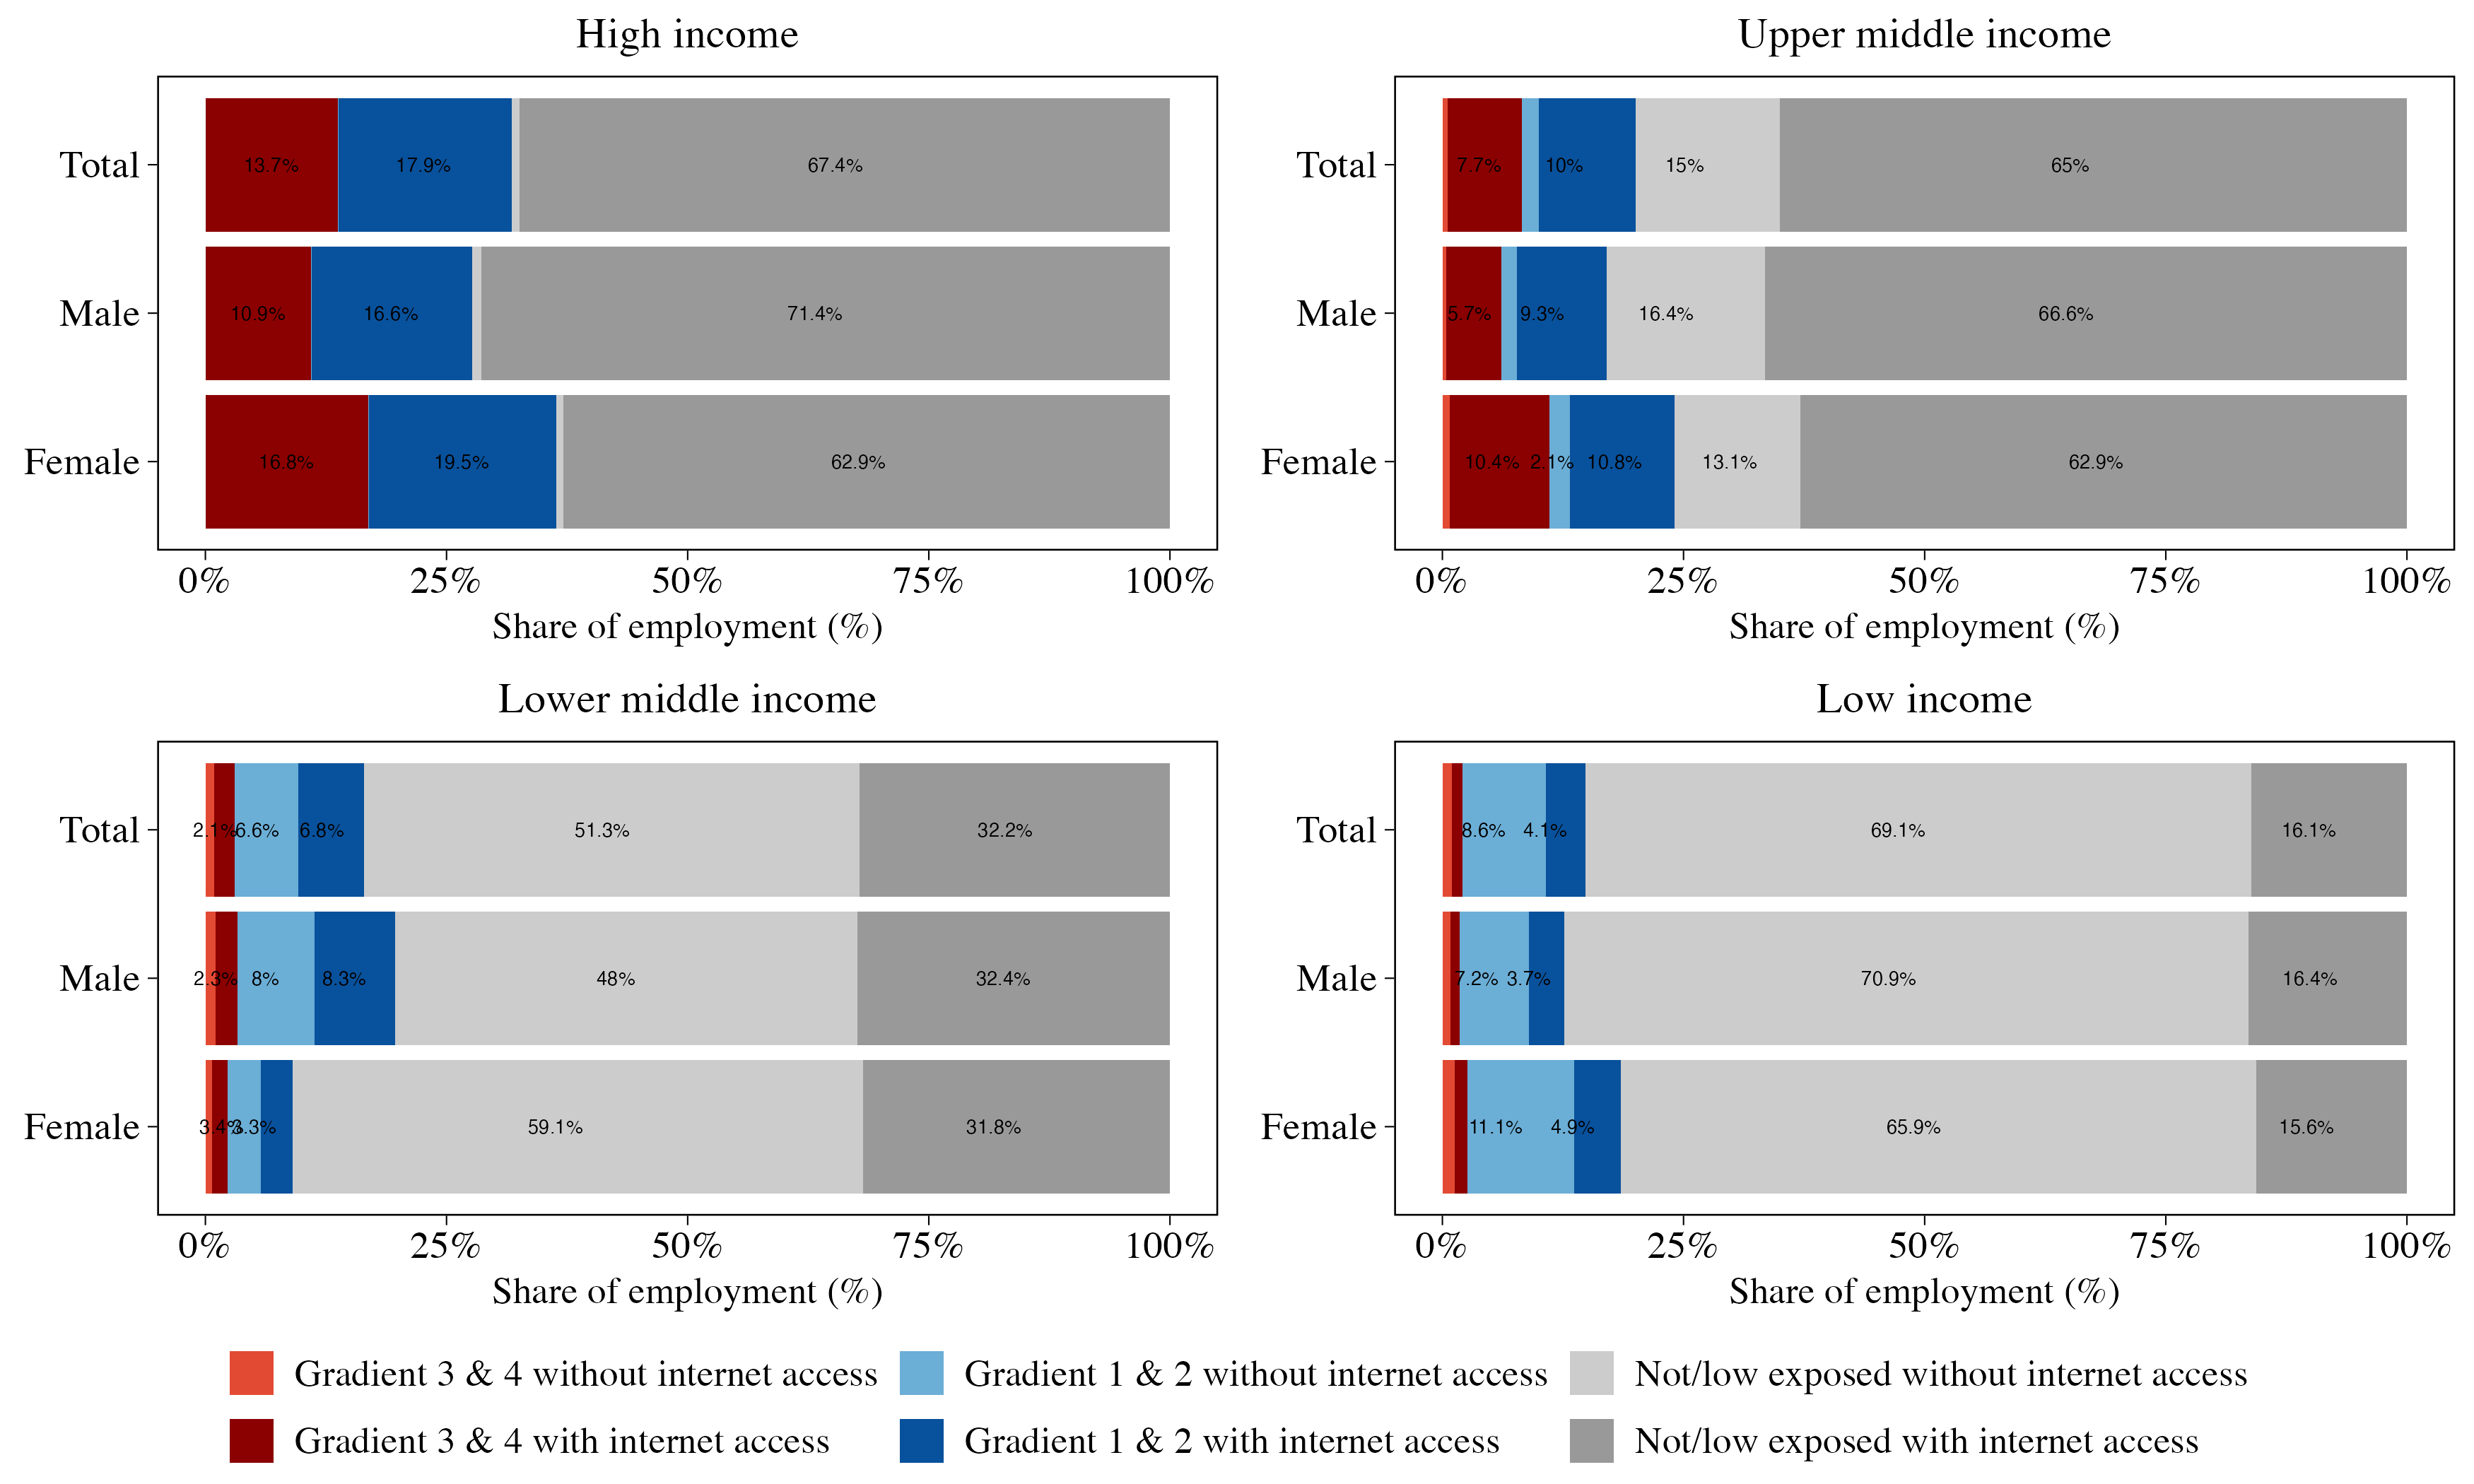
Figure 4: Workers exposed to GenAI and with internet access, by occupation
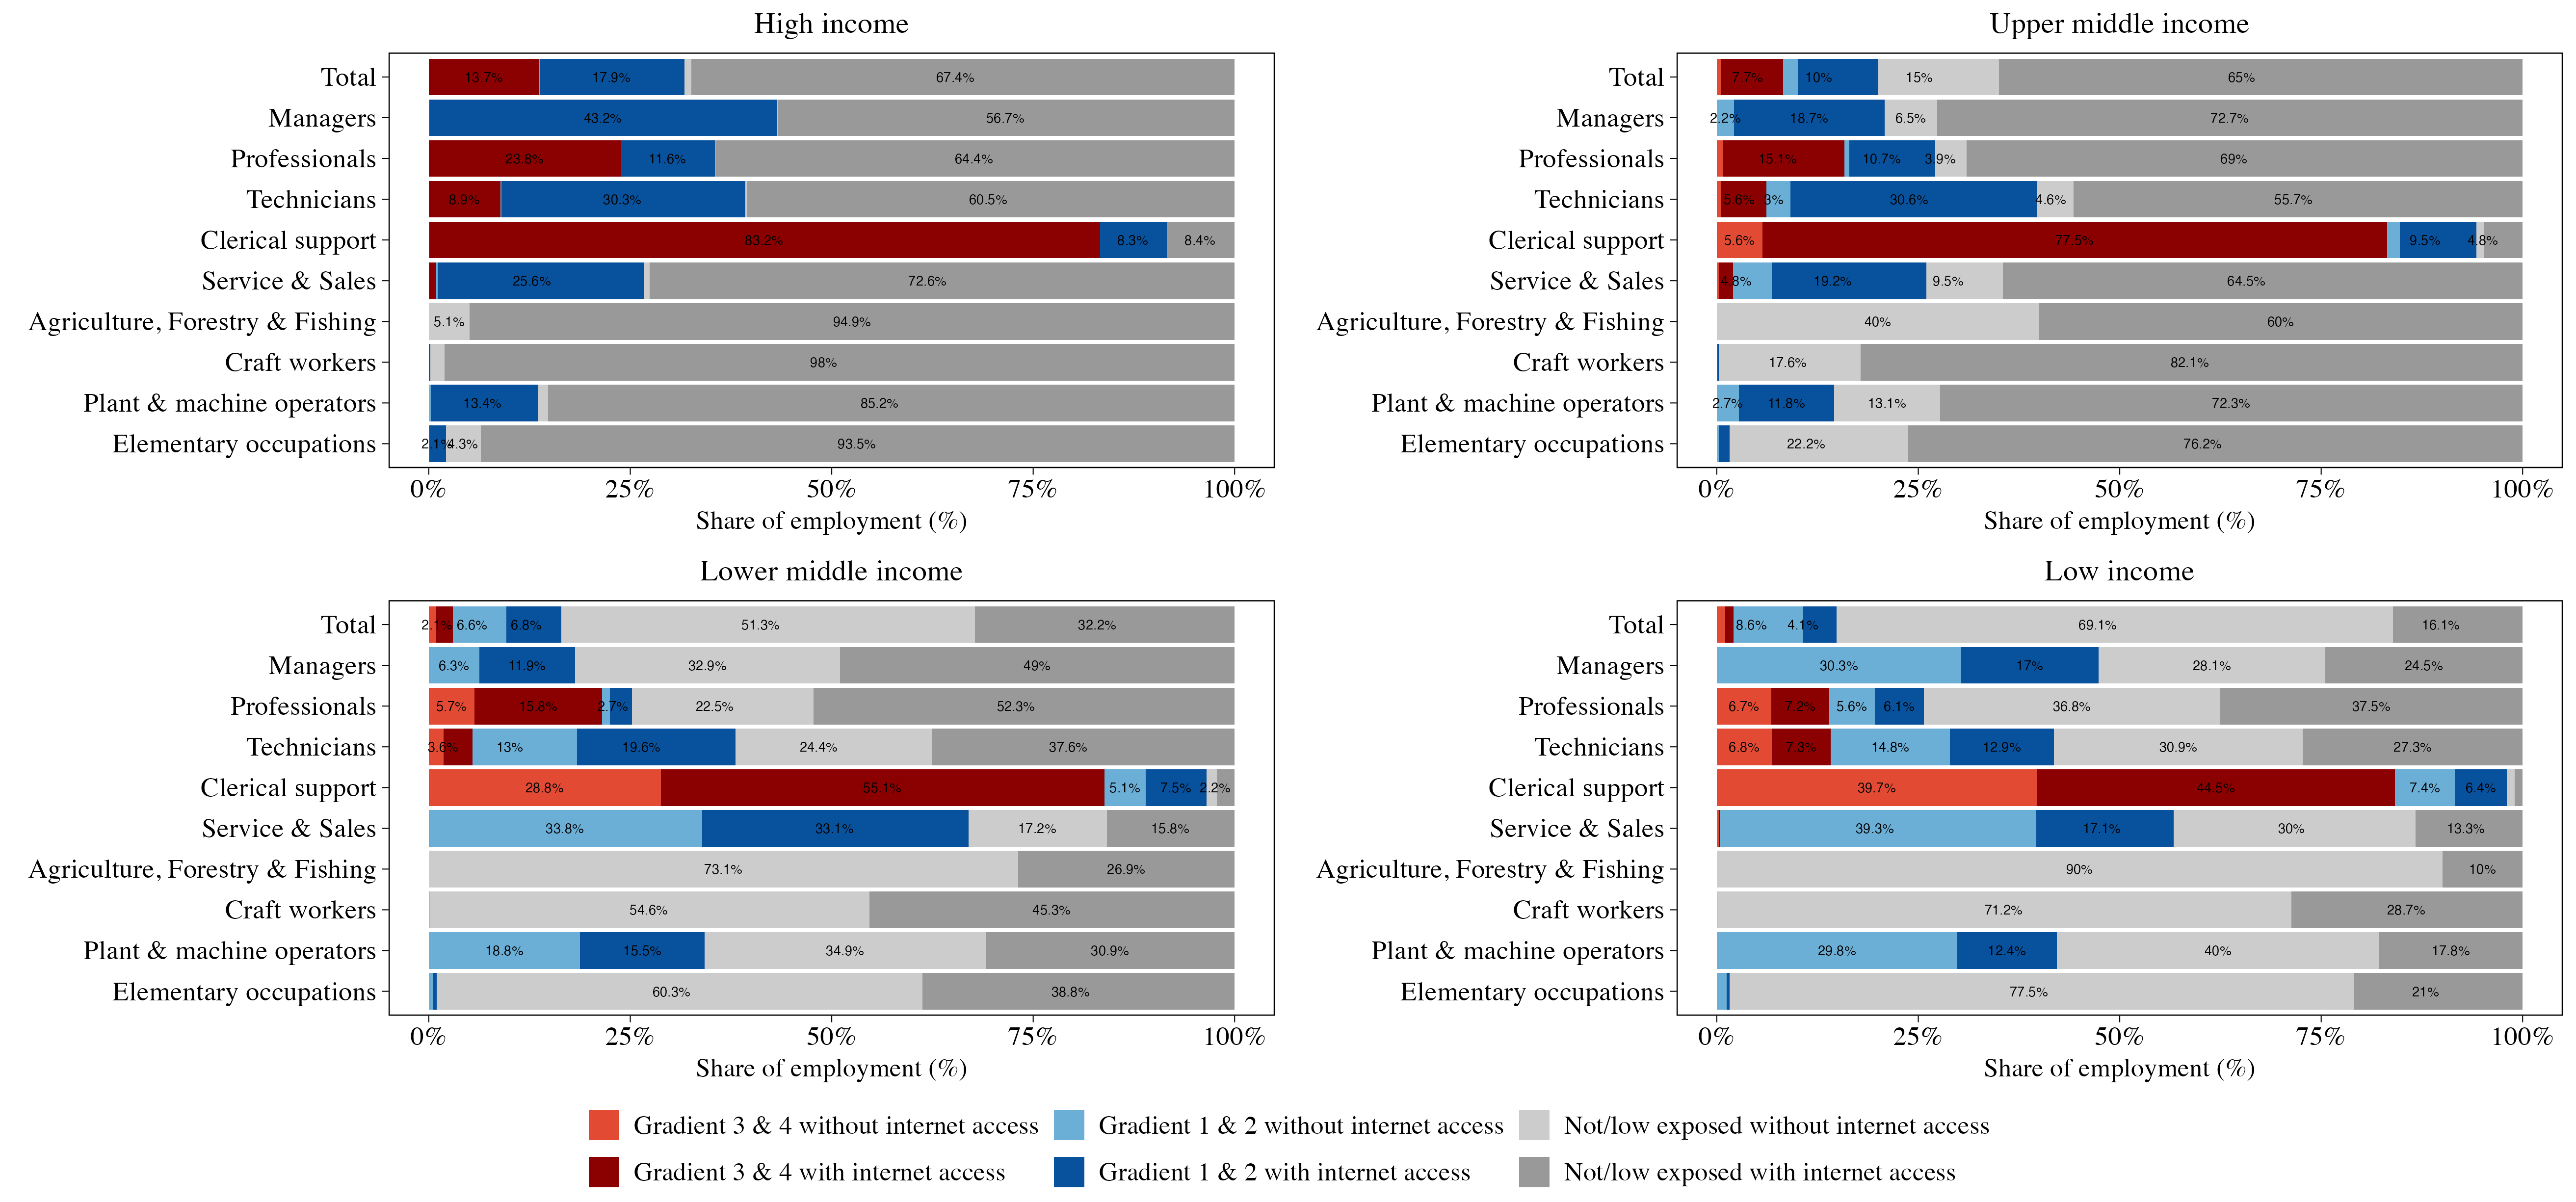
Notes: The plot shows the share of employment across three major exposure categories by income group: employment exposed under Gradients 3 & 4, Gradients 1 & 2, and those low or non-exposed, each disaggregated by internet access. Income groups follow the World Bank’s 2024 country income classification. This figure disaggregates results by 1-digit ISCO-08 occupation.
On the automation side, in the GenAI exposure index we applied, clerical support workers and, to a lesser extent, professionals are among the occupational categories with the highest exposure (gradients 3 and 4). This, in turn, translates directly into a strong link between exposure to GenAI automation and GDP per capita, given that the employment shares of these occupations are higher in prosperous economies. These vulnerable positions are disproportionately held by women and younger workers (Figures 5 and 6).17 On average, 17 and 10 percent of female workers in high and upper-middle-income countries face automation risk from GenAI, compared to approximately 11 and 6 percent of male workers, respectively. In LICs, exposure to GenAI automation is significantly smaller for both men and women, representing less than 3 percent of total employment. There are age disparities in exposure, particularly in upper-middle-income countries, where about 10.4 percent of workers aged 16-35 face automation risk, while only 4.3 percent of workers aged 56-65 are in that position. In contrast, exposure to GenAI job augmentation is more equally distributed across genders and age groups, indicating that GenAI’s productivity benefits may be more equitably shared than its displacement risks.
Figure 5: Workers exposed to GenAI and with internet access, by gender
Notes: The plot shows the share of employment across six major exposure categories by income group: employment exposed under Gradients 3 & 4, Gradients 1 & 2, and those low or nonexposed— each disaggregated by internet access. Income groups follow the World Bank’s 2024 country income classification. This figure disaggregates results by sex (male, female).
The intersection of automation exposure with internet access further exposes income-based differences among countries. In high- and upper-middle-income nations, workers most vulnerable to GenAI automation tend to have high internet access levels, suggesting that displacement effects could theoretically occur rapidly. In contrast, less developed nations, particularly lowincome countries, have minimal shares of employment exposed to potential GenAI automation as a starting point. However, where such jobs exist, they are mostly digitized, which means that the digital divide does not protect these jobs from potentially rapid negative effects.
Further distributional implications of GenAI emerge when examining patterns across the levels of education. A common feature across all countries is that GenAI exposure increases with educational attainment (Figure 7), which highlights the particular ability of this technology to interact with what is broadly understood as ”knowledge work”.17 Importantly, workers with comparable education levels exhibit remarkably similar exposure rates regardless of their country’s income level. For example, college graduates face exposure rates ranging from 32.5 percent in low-income countries to 37.7 percent in high-income countries, which represents a far narrower gap than the differences observed across the entire employed population.
In LICs and LMICs, internet connectivity is also disproportionally higher among more skilled workers and among those at risk of automation. For instance, among college graduates in LICs, 13.2 percent face GenAI automation exposure, and 72 percent of these workers already have internet access. This implies that initial displacement effects could concentrate among the narrow segment of skilled and digitally-connected workers currently holding some of the better jobs in those economies.
Figure 6: Workers exposed to GenAI and with internet access, by age
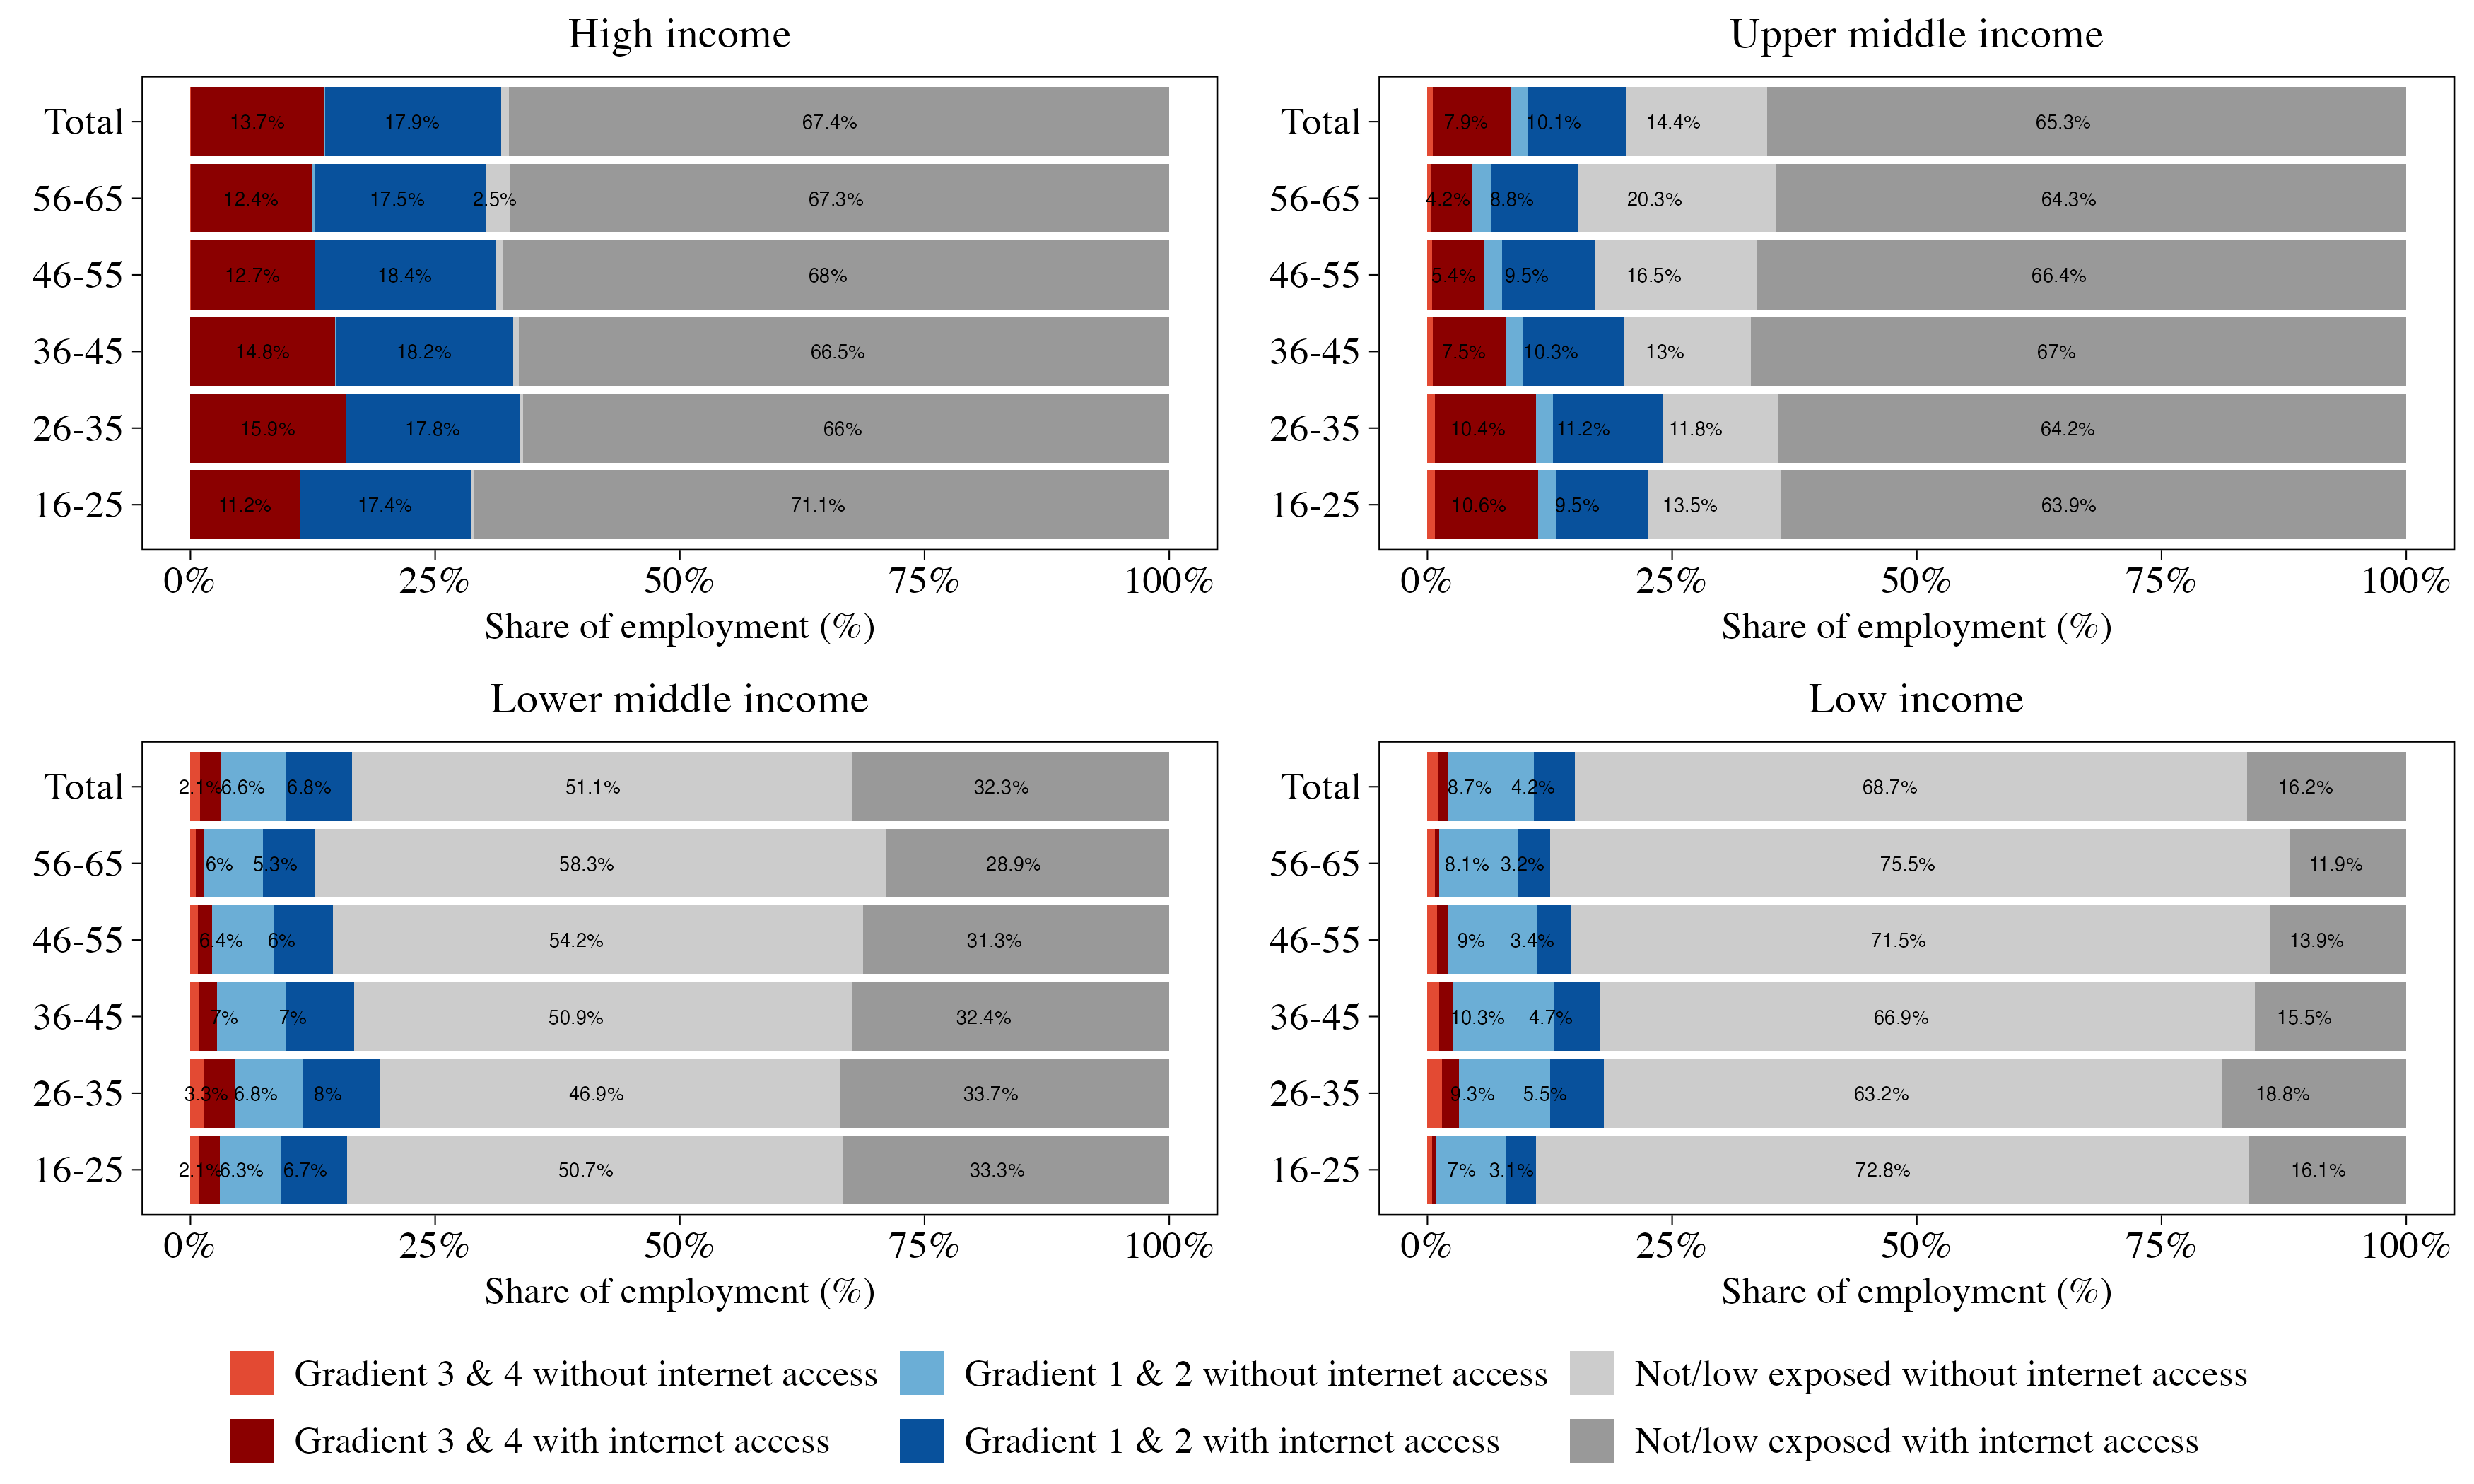
Notes: The plot shows the share of employment across six major exposure categories by income group: employment exposed under Gradients 3 & 4, Gradients 1 & 2, and those low or non-exposed—each disaggregated by internet access. Income groups follow the World Bank’s 2024 country income classification. This figure disaggregates results by age group (16–25, 26–35, 36-45, 46-55, 56-65)
Figure 7: Workers exposed to GenAI and with internet access, by educational attainment
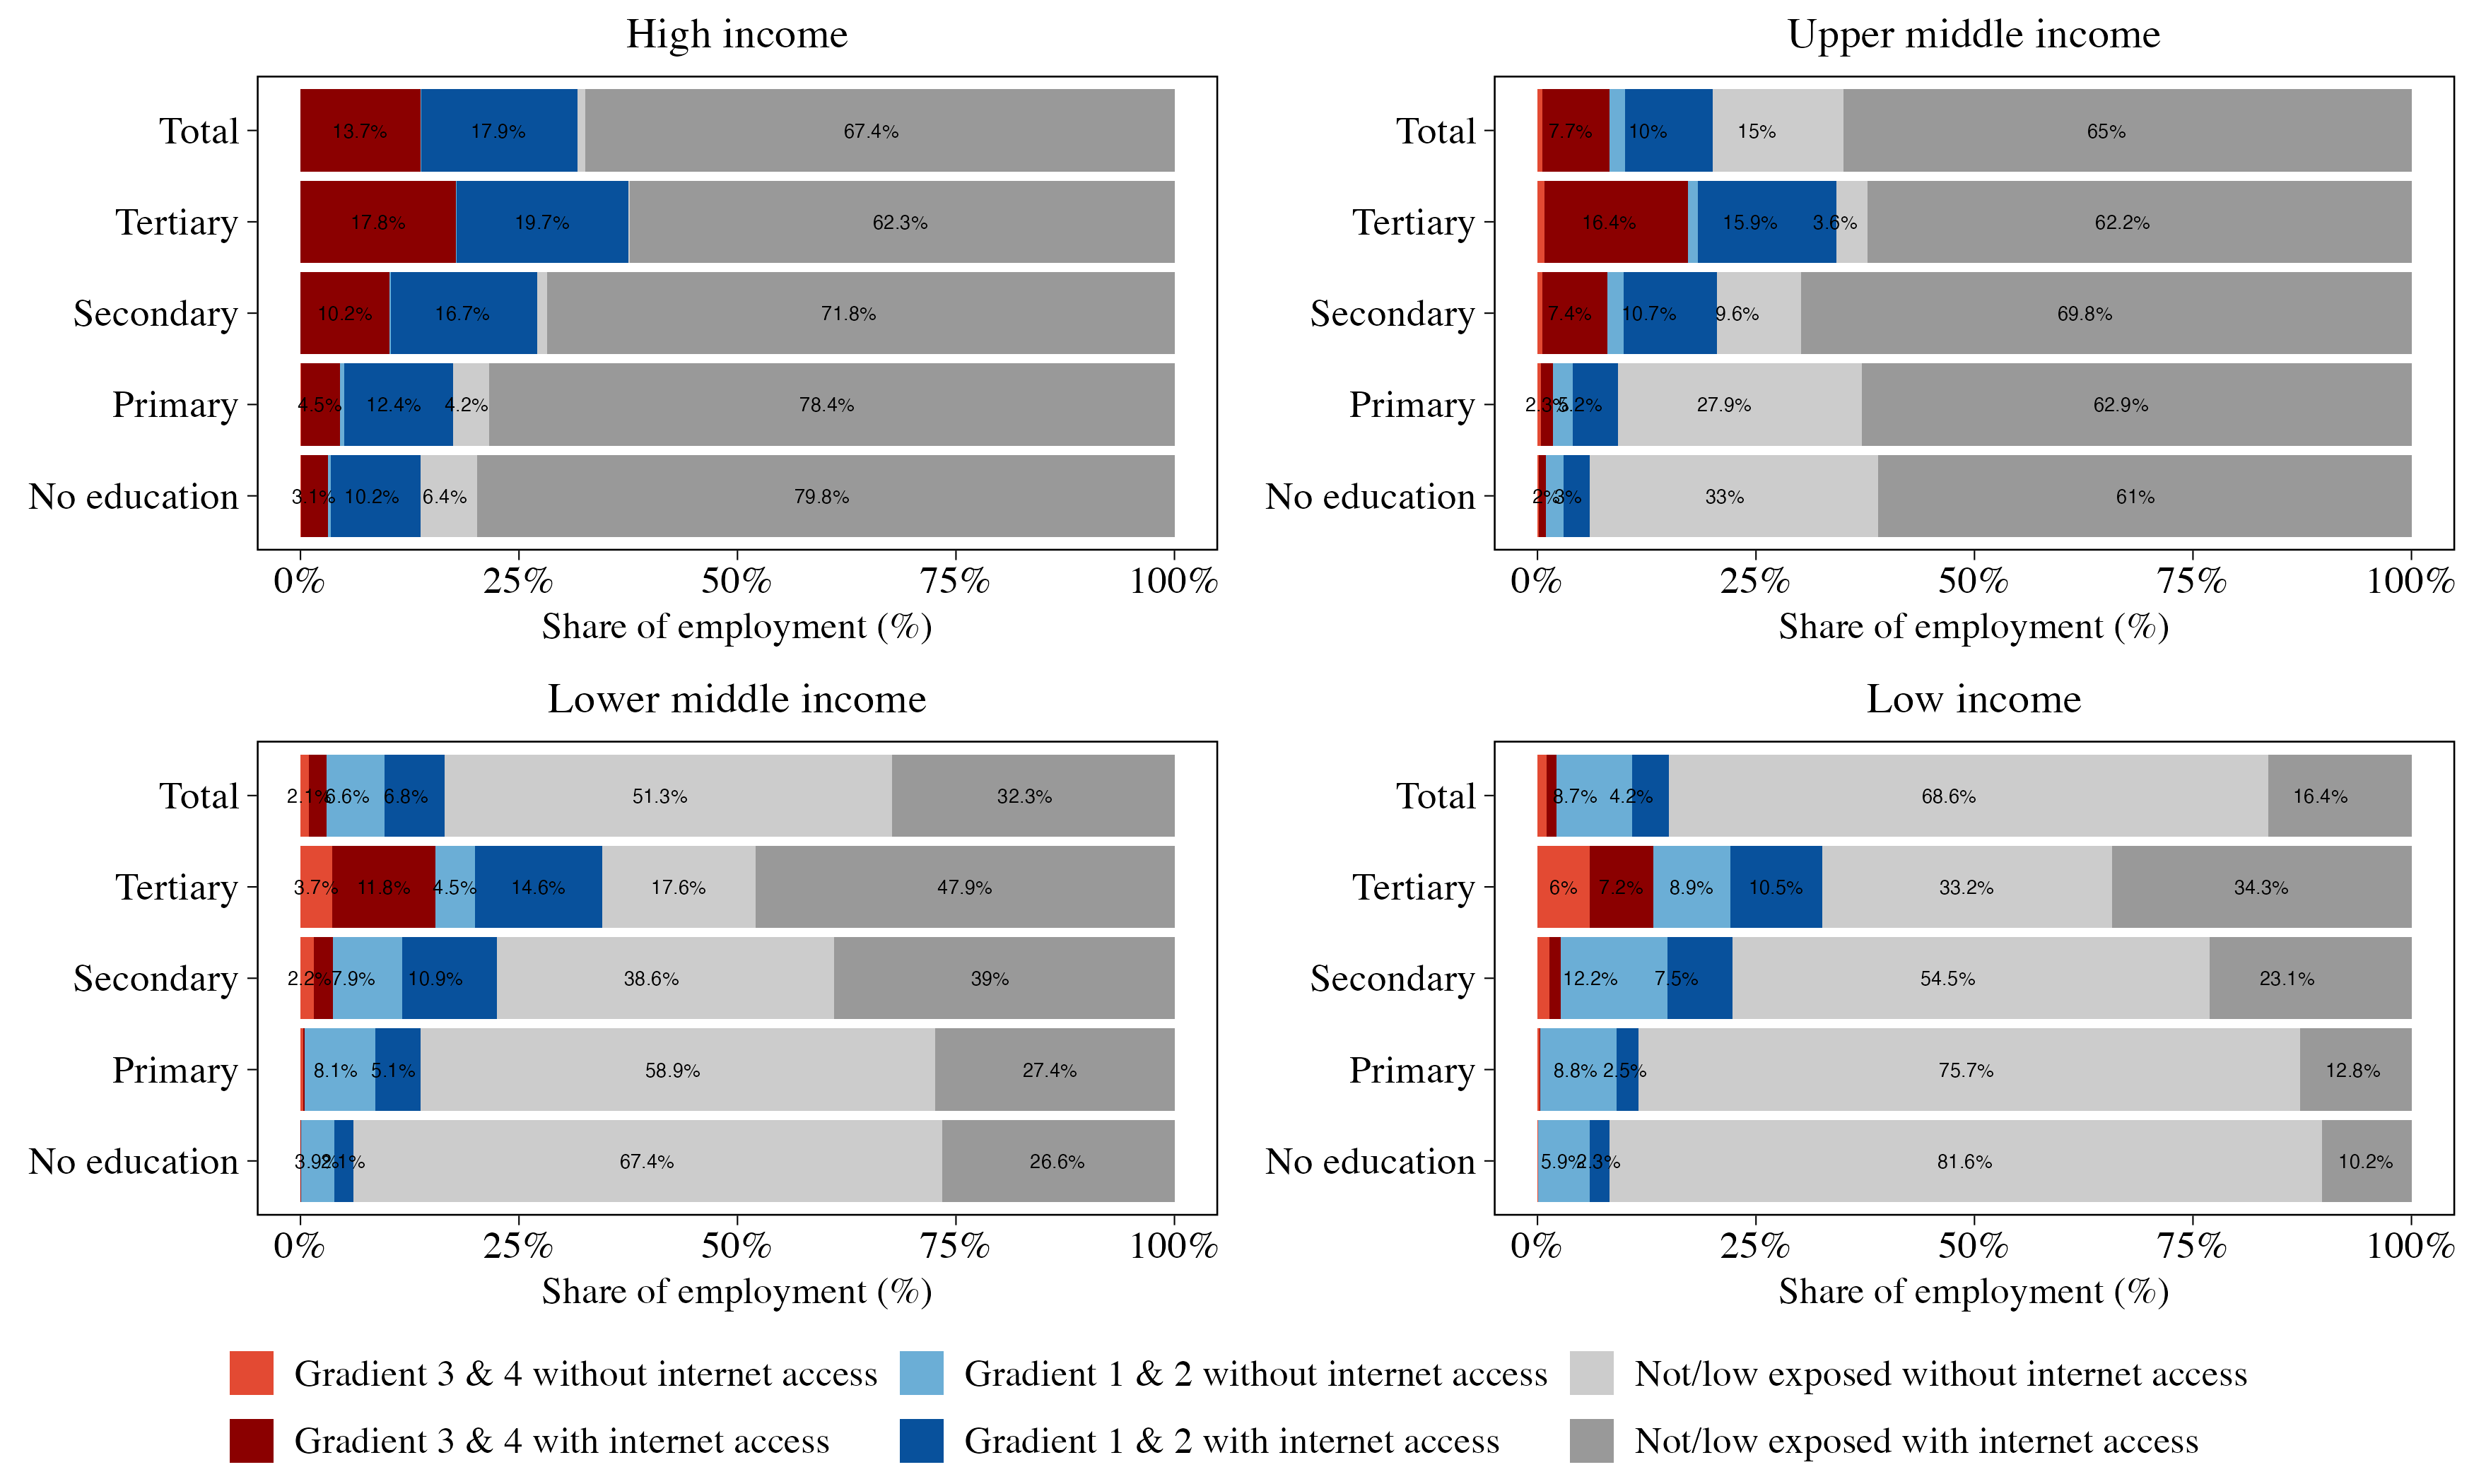
Notes: The plot shows the share of employment across six major exposure categories by income group: employment exposed under Gradients 3 & 4, Gradients 1 & 2, and those low or non-exposed, each disaggregated by internet access. Income groups follow the World Bank’s 2024 country income classification. This figure disaggregates results by the highest education level attained: no education, primary, secondary, and tertiary (complete or incomplete).
Figure 8: Workers exposed to GenAI and with internet access, by sector
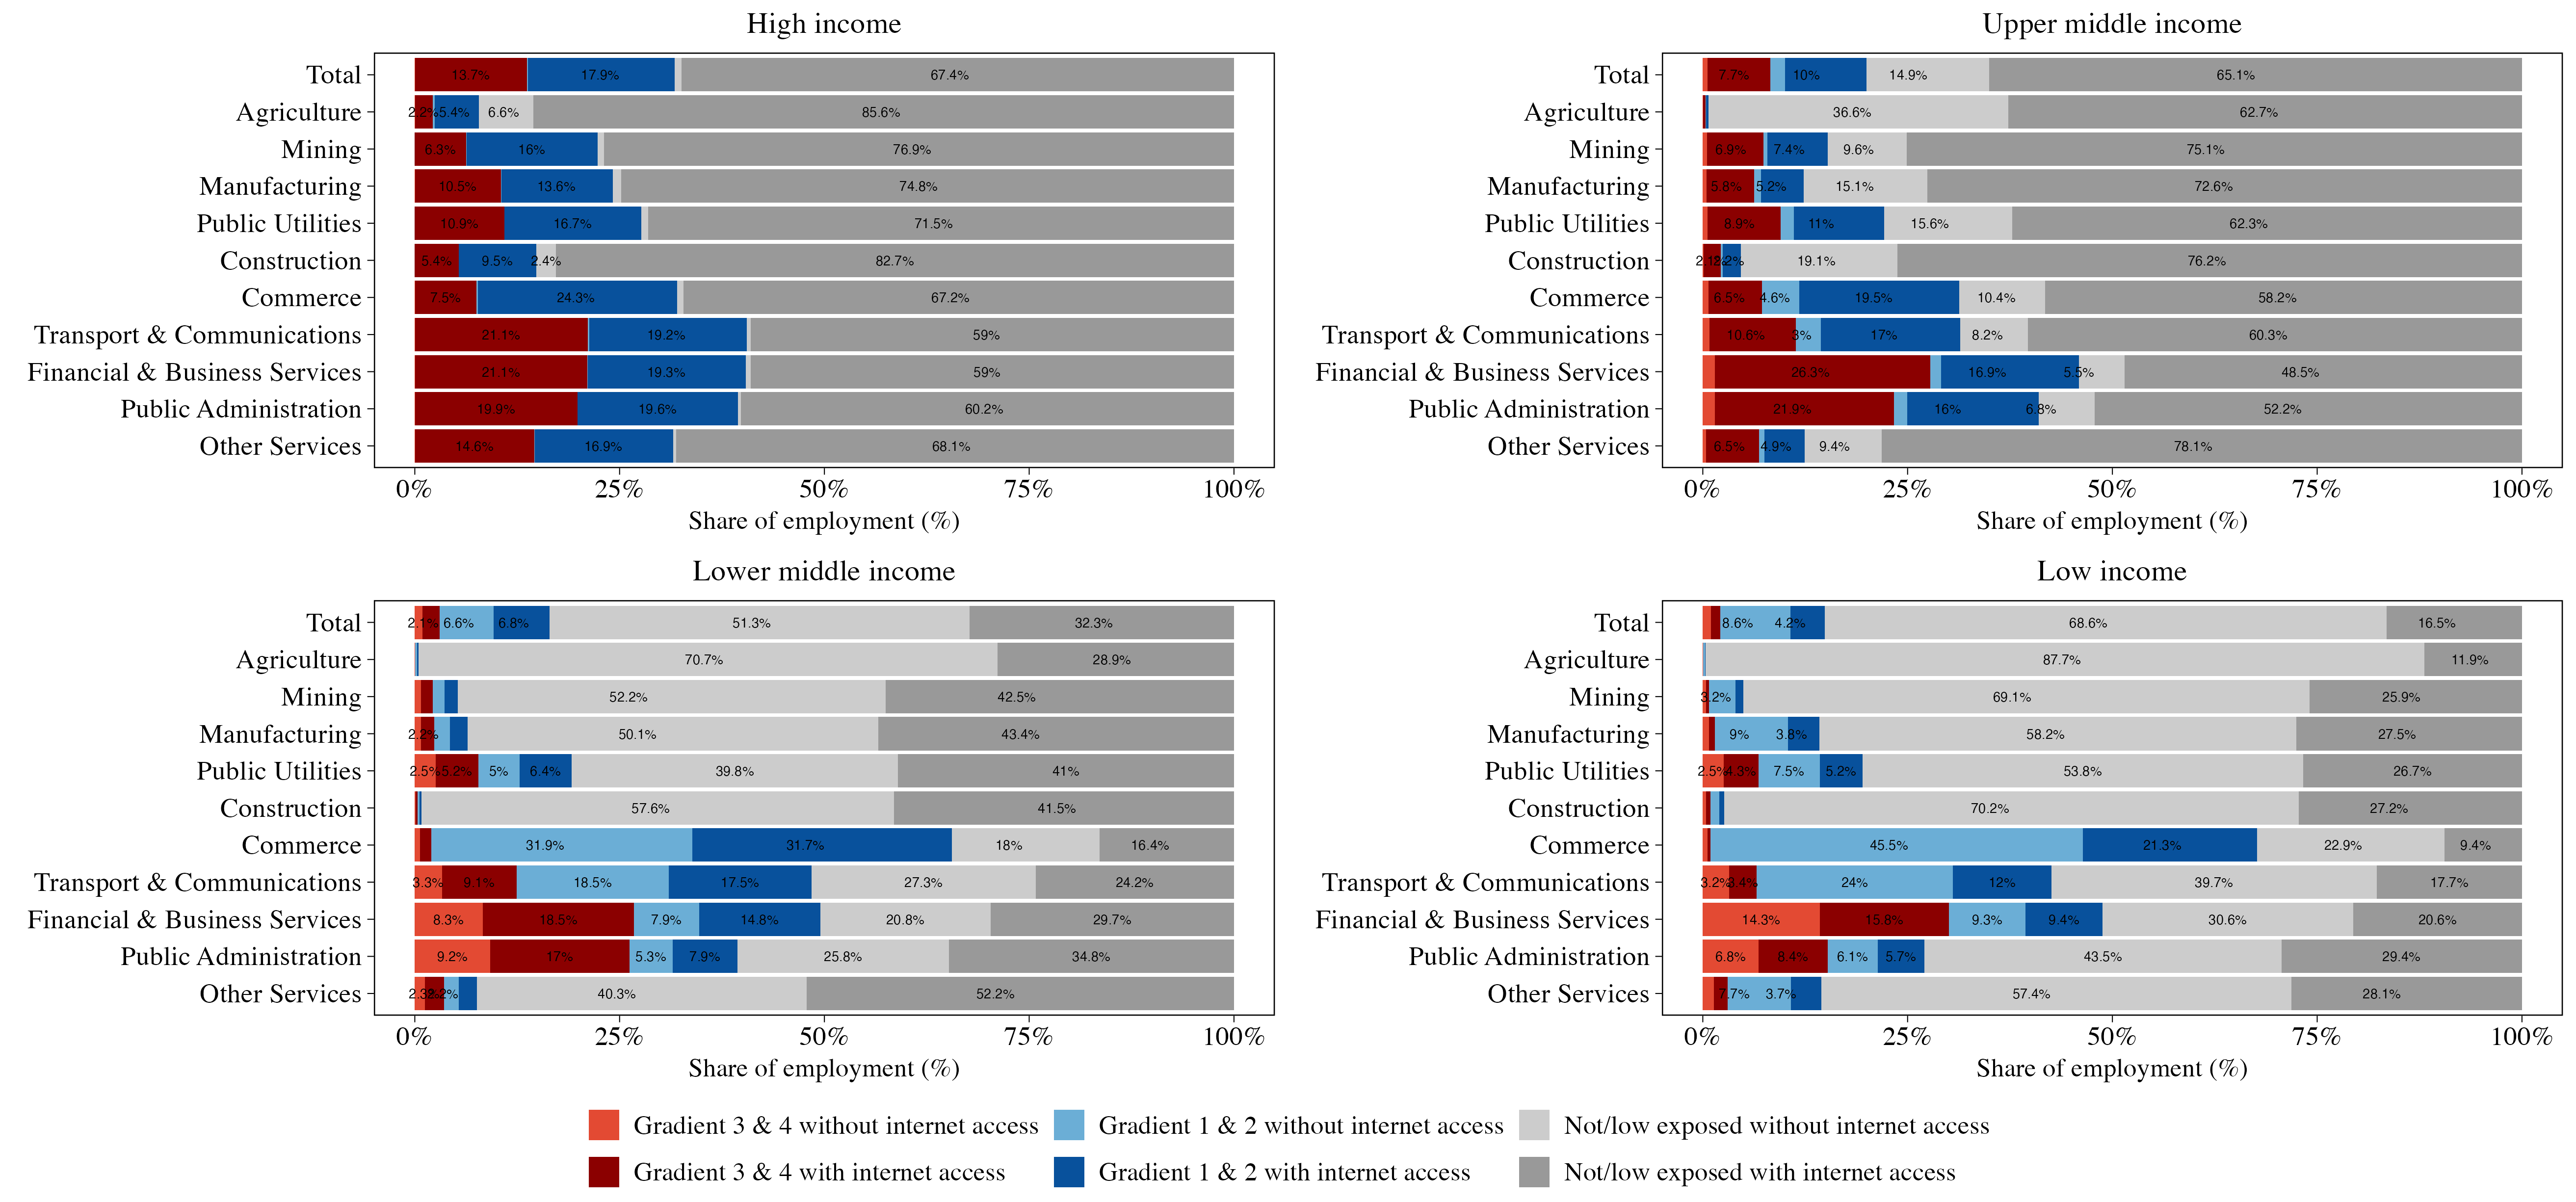
Notes: The plot shows the share of employment across six major exposure categories by income group: employment exposed under Gradients 3 & 4, Gradients 1 & 2, and those low or non-exposed, each disaggregated by internet access. Income groups follow the World Bank’s 2024 country income classification. This figure disaggregates results by sector, based on ISIC Rev. 4 sections as coded in the GLD data. For example, ”Agriculture” includes forestry and fishing; ”Public Utilities” includes electricity, gas, and water supply; ”Commerce” includes wholesale and retail trade; ”Transport & Communications” includes storage, and information services; ”Financial & Business Services” includes insurance activities and real estate and ”Other Services” includes education, health, recreation, and other community services.
The sectoral distribution of GenAI exposure also varies with countries’ income levels (Figure 8). In HIC, average exposure is relatively evenly distributed across sectors, with Financial and Business Services (41 percent), Transport and Communications (41 percent), and Commerce (32 percent) showing the highest rates. The pattern shifts in LMICs and LICs, where exposure becomes increasingly concentrated in specific sectors. Most notably, Financial and Business Services emerges as one of the sectors with highest GenAI exposure across all country groupings, but with significantly different connectivity profiles. While workers in this sector have nearuniversal internet access in HICs, nearly a third of their counterparts in LICs are not connected.
The gaps in connectivity in developing countries are worse when focusing on exposure in gradients 1 and 2, such as in the retail and wholesale sector (commerce). The sector accounts for the largest share of GenAI-exposed employment in low-income countries, particularly on gradients 1 and 2. Agriculture, while employing large shares of workers in lower-income countries, shows minimal GenAI exposure across all income groups. This is consistent with the technology’s current limitations in physical and location-specific tasks.
Finally, the breakdown of exposure by income suggests that GenAI’s first-order effects are likely to concentrate on middle-class occupations, although the magnitude and distributional direction of these effects remain uncertain. In Figure 9, we present a detailed picture of income and exposure across 16 countries, using household income per capita where available and household expenditure per capita otherwise.18
Figure 9: Workers exposed to GenAI, by household welfare and exposure gradient

Notes: Each dot represents a 2-digit occupation, with colour indicating the exposure gradient (1–4) and dot size reflecting the share of total employment in that country. The red horizontal line marks the country-level median income (or welfare, in African countries). Occupations below the median are primarily exposed in Gradient 1 (elementary occupations, drivers, handicraft workers, sales workers), while higher gradients of exposure are concentrated in above-median occupations. Some occupations, such as legal, social and cultural workers, fall below the median in certain countries, and others, such as ICT and business administration professionals, show high exposure (Gradients 3–4) at relatively high income levels.
Figure 10: Workers exposed to GenAI and with internet access, by household welfare quintiles
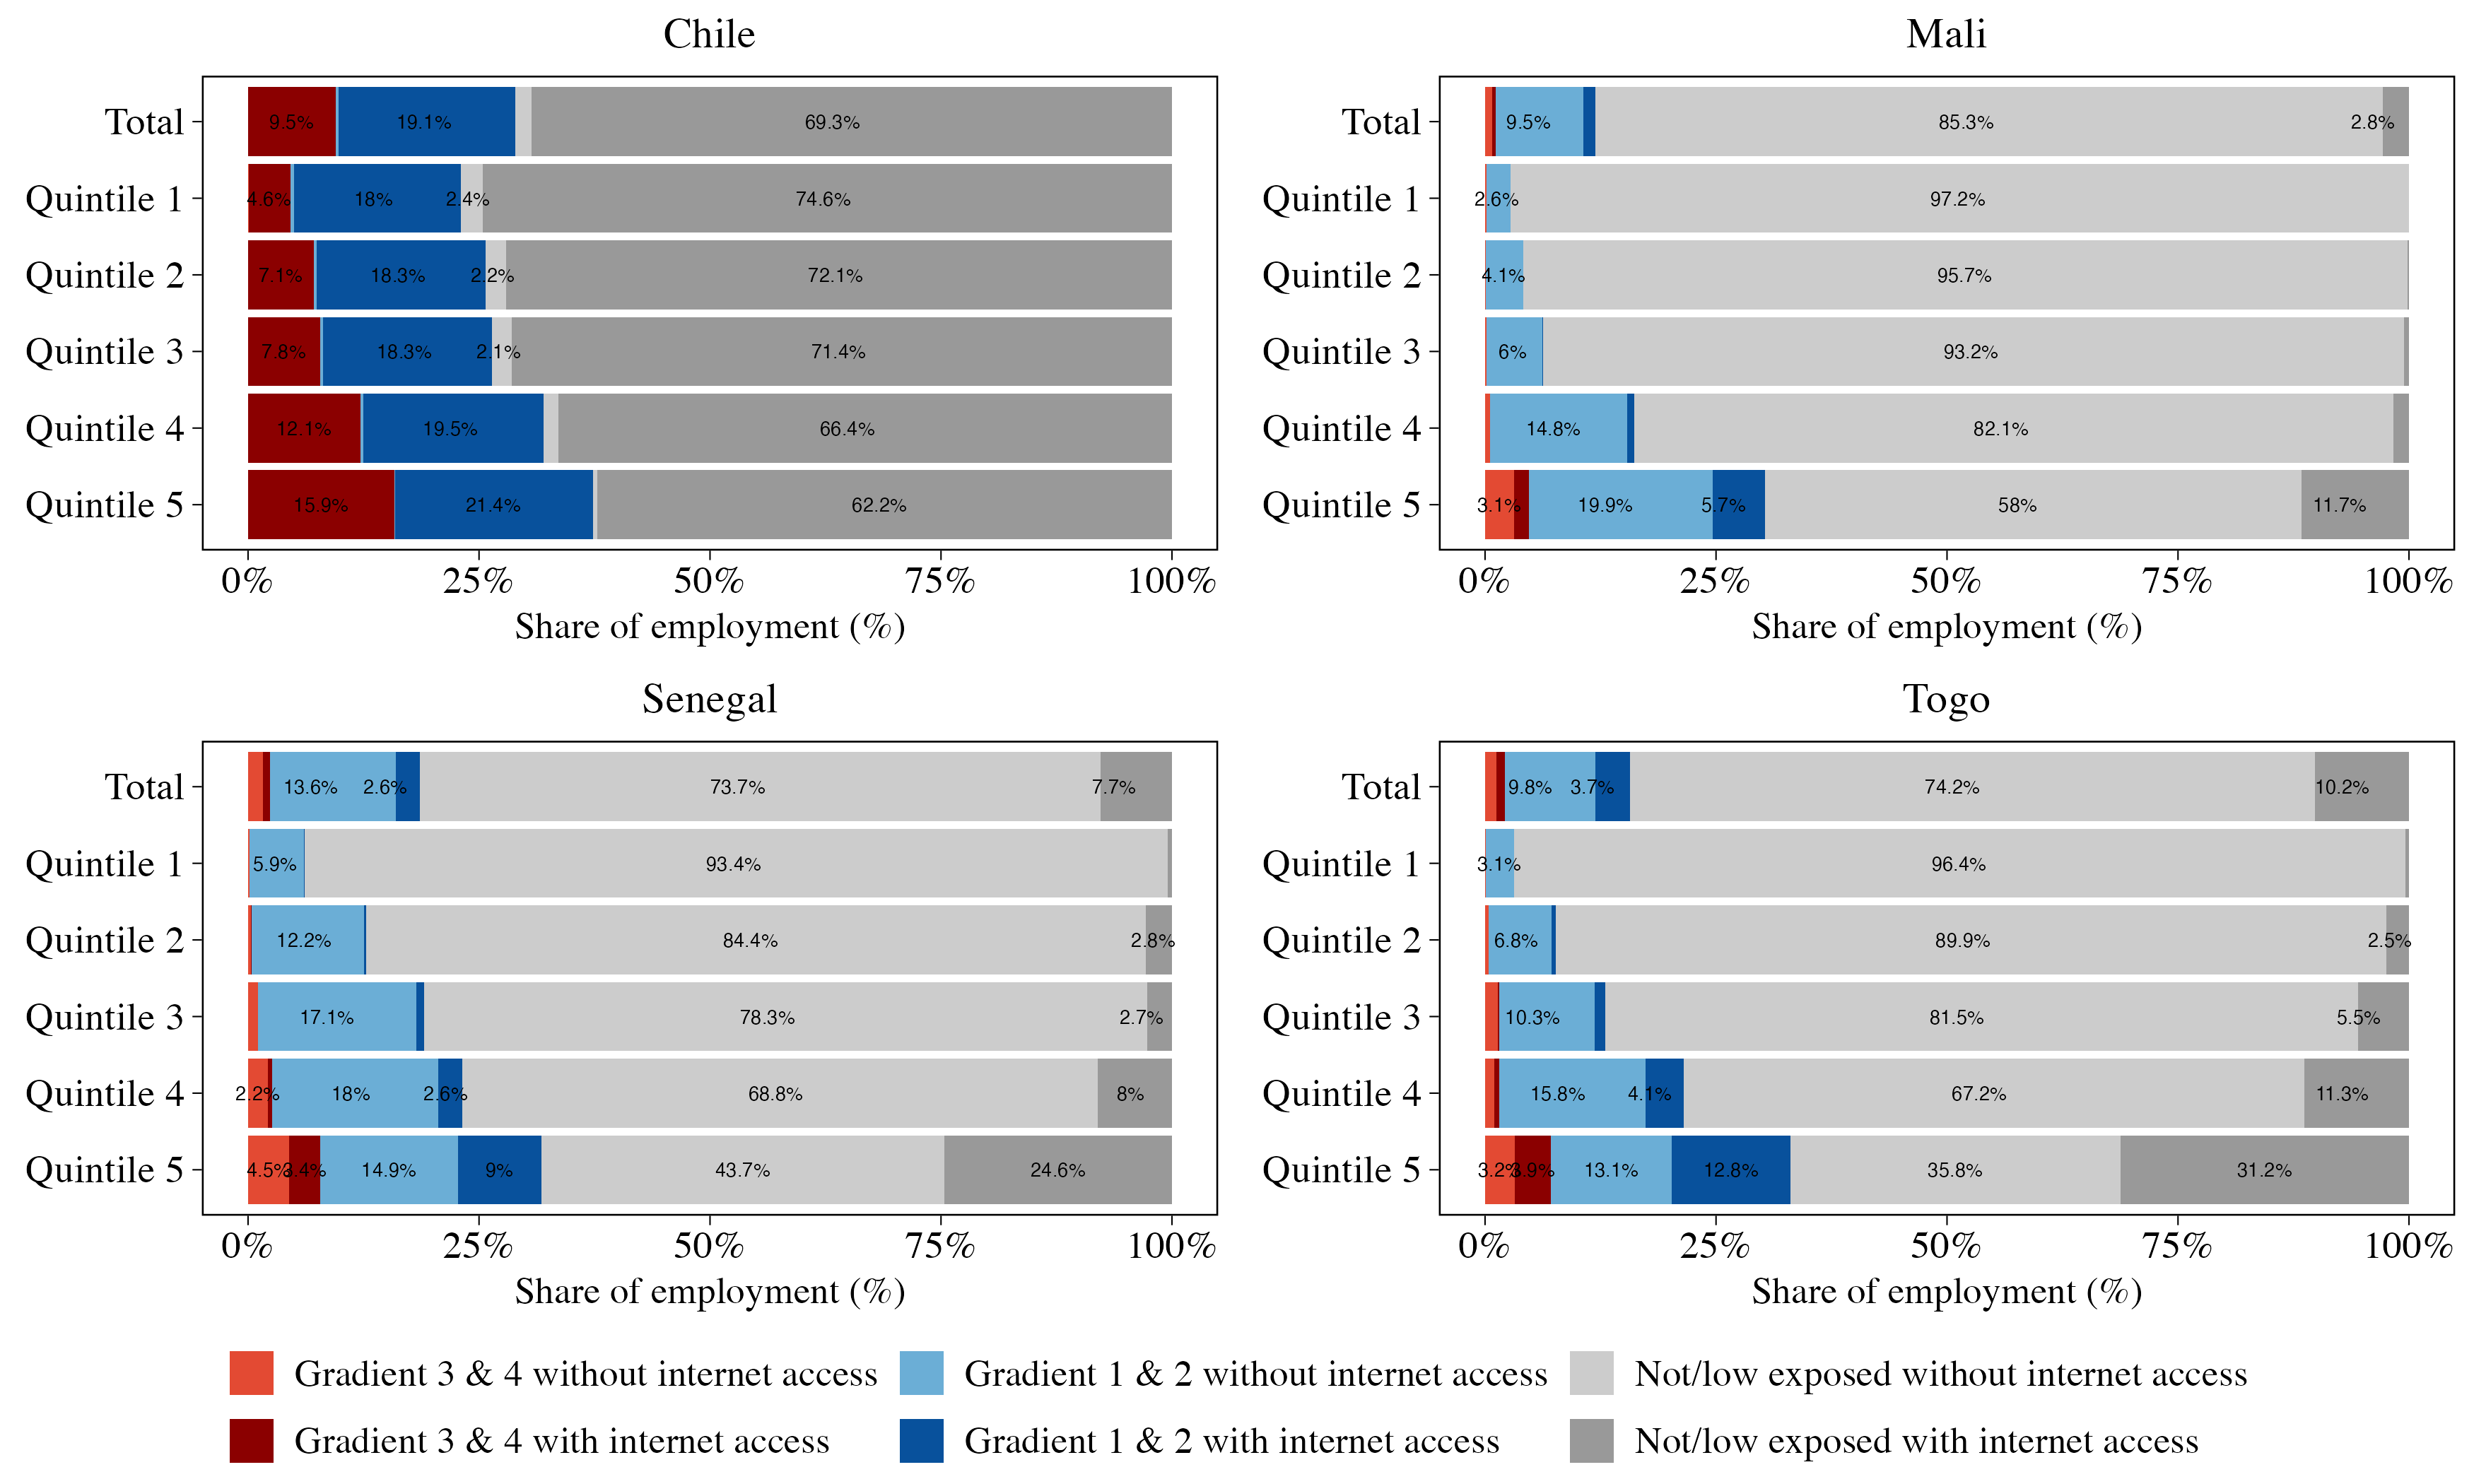
Notes: The plot shows the share of employment across six major exposure categories: employment exposed under Gradients 3 & 4, Gradients 1 & 2, and those low or non-exposed, each disaggregated by internet access. This figure disaggregates results by welfare quintiles. Welfare data are available only for countries in SEDLAC (household income per capita) and WAEMU (household expenditure per capita).
For these countries, we constructed a dataset at the 2-digit occupational level. The red horizontal line represents the country-level median, centred at zero, and each dot represents an exposed occupation (with colours corresponding to Gradients 1–4). Dot size reflects the share of total employment in each country. We observe that among occupations below the median income, exposure is limited to Gradient 1 jobs, clustered around some elementary occupations, drivers, handicraft workers, and sales workers. By contrast, exposure in higher gradients is more prevalent among occupations with above-median incomes across all countries, though with notable variation in some groups (for example, legal, social, and cultural workers fall below the median in certain cases). Many occupations in Gradients 3 and 4—which are more prone to automation effects—are close to the median, but some also have relatively high incomes (e.g. ICT and business administration professionals).
Within all countries in our sample, GenAI exposure correlates strongly with household income— in Senegal, for example, 30 percent of workers in the wealthiest quintile face GenAI exposure compared to only 6 percent in the poorest quintile (Figure 10). However, this exposure gradient flattens considerably in higher-income countries like Chile, reflecting more similar occupational structures across socioeconomic strata as economies develop.
The digital divide introduces an additional layer of distributional complexity (Figure 10), with internet access closely tied to household income. In Mali, for instance, while 26 percent of workers in the wealthiest households could theoretically benefit from GenAI augmentation, only 22 percent have the requisite internet access—and these proportions decline further in lowerincome groups. By contrast, in Chile, internet coverage is nearly universal among occupations in Gradients 1 and 2, with no dramatic differences across the income spectrum.
In summary, whether or not the digital divide is taken into account, these findings suggest that GenAI’s first-order effects are likely to reinforce inequality by disproportionately enhancing the productivity of jobs held by higher-income groups, while its displacement effects may compress differences by pushing some above-median income groups downward rather than lifting others up. Both channels of impact are likely to be amplified in poorer countries, where existing job and digital disparities across socioeconomic groups are wider. That said, in broader generalequilibrium terms, subsequent adjustments in wages and prices could alter these dynamics, making longer-term inequality effects less predictable.19
2.3 GenAI exposure and the task content of jobs
Considering jobs as bundles of tasks reflected in ISCO-08 technical documentation provides a useful foundation for a global index of exposure to GenAI, as this international standard serves as a common denominator harmonizing occupations across countries. However, a key limitation of this approach lies in the implicit assumption that task composition within occupations is homogeneous across countries. In fact, Lewandowski et al. (2025) shows that differences in task content can lead to a significant country-level variation in occupational AI exposure.
To further explore this aspect, we analyze variation in task content across occupations and countries by linking the ILO-NASK Exposure Index with microdata from PIAAC and STEP surveys. Our analysis draws on four job intensity constructs developed by Caunedo et al., 2023, derived from combinations of task-related indicators reported in PIAAC and STEP (as discussed in section 2.4). We focus on the use of computer at work (CU), routine manual tasks (RM), non-routine analytical (NRA) and non-routine interpersonal (NRI) tasks: four task dimensions that, while conceptually related, capture empirically distinct aspects of work activity. In particular, CU reflects the technological interface of work, whereas NRA captures the cognitive problem-solving dimension. These constructs are selected because they are well represented by corresponding survey questions and exhibit sufficient empirical separability for cross-country comparisons (see Table A6).
Since the latest round of PIAAC (2025) includes data at the ISCO-08 4-digit level, we match this data directly with the GenAI Exposure Index, which enables a more granular analysis across seven countries.20 While the full dataset contains 8,850 observations, we restrict this part of analysis to 4-digit occupations with a minimum of five observations per country (4,076 obs) to reduce noise and ensure comparability. This refined sample is visualized in Figure 11.
Occupations with higher GenAI exposure show a higher level of computer use at work, with the converse trend present for routine manual tasks dropping to the lowest levels among the most exposed occupations. These patterns are expected, since GenAI excels in highly digitized tasks but has no direct automation potential in manual work.21 For non-routine analytical and non-routine interpersonal tasks, the curve peaks around exposure gradients 2 and 3, with the trend more strongly visible for the latter. In fact, most occupations in gradient 4 (highest exposure) involve either clerical work or highly specialized and digitized roles (such as finance and insurance agents), where interpersonal tasks are often repetitive (linked to procedural steps) and analytical tasks frequently involve reading standard manuals or following set procedures. In contrast, occupations in gradients 1 and 2 include jobs such as public relations specialists, office managers, or psychologists, where the non-routine analytical and interpersonal components form the core of the underlying human abilities.
Figure 11: Mean GenAI exposure score (ILO, 2025) vs type of tasks (PIAAC)
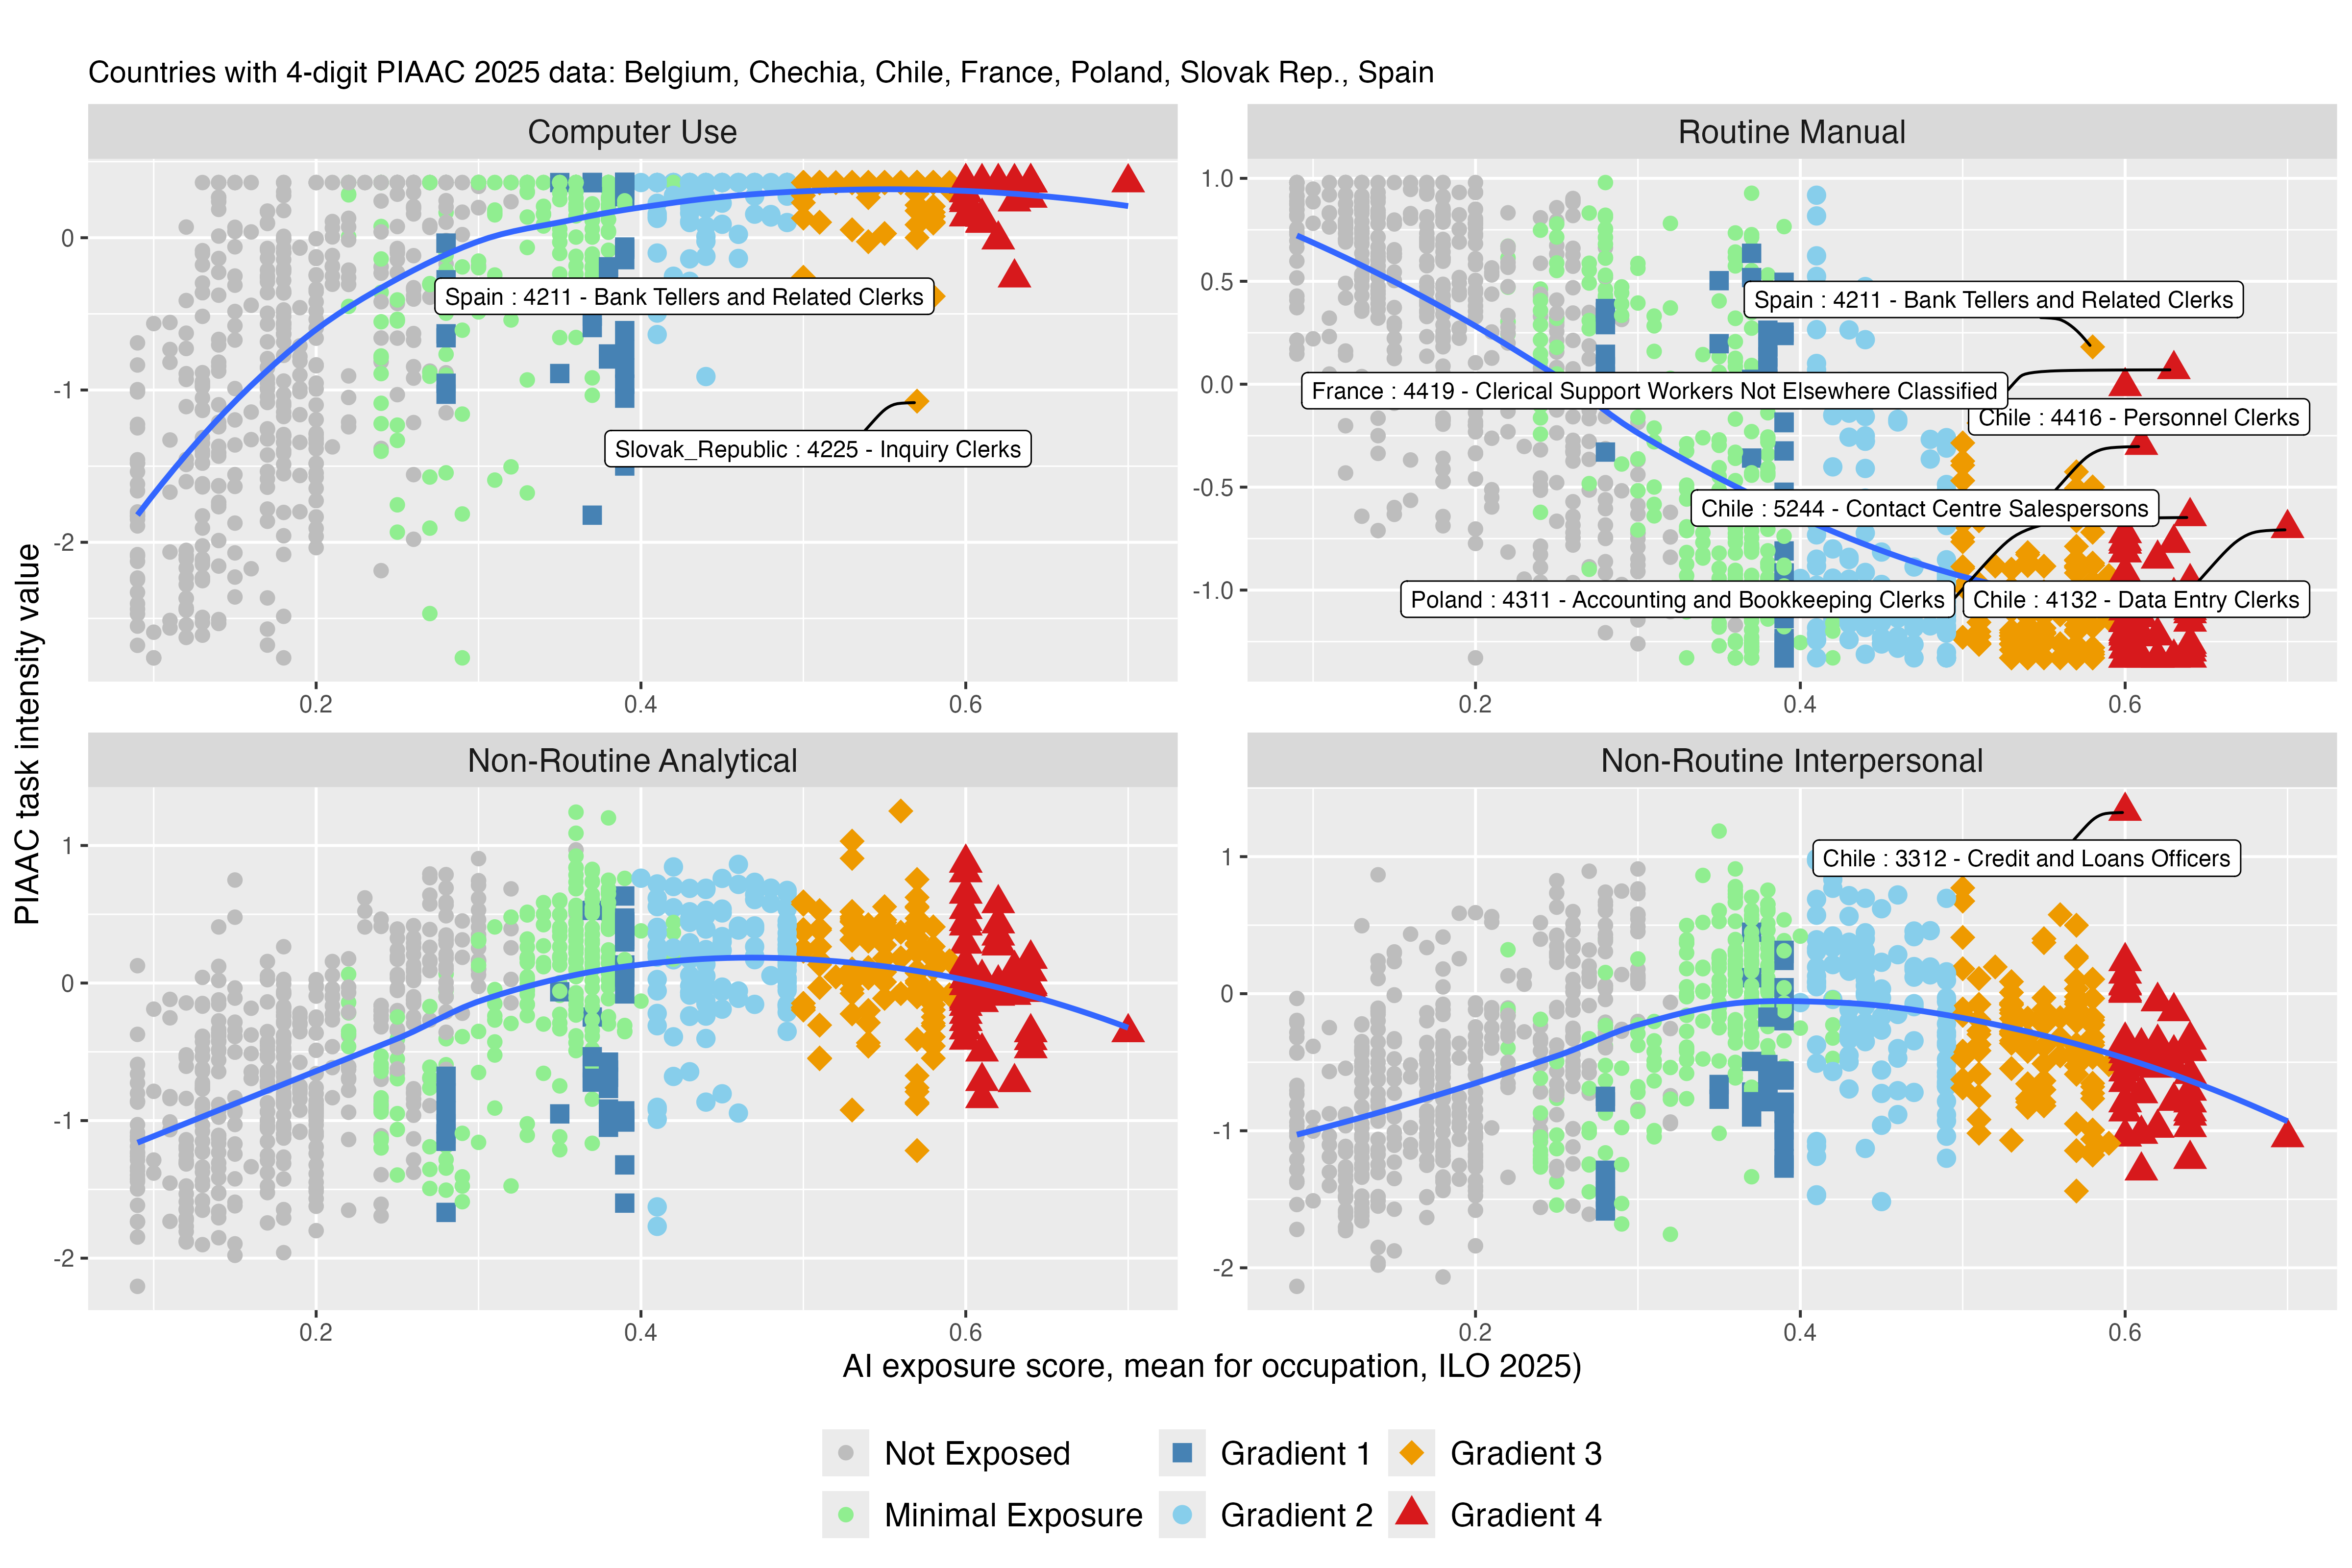
Notes: The figure illustrates the relationship between GenAI exposure (x-axis, based on mean exposure in Gmyrek et al., 2025) and four concepts of task intensity: 1. Use of computer, 2. Routine Manual work, 3. Non-Routine Analytical and 4. Non-Routine Interpersonal tasks based on questions in PIAAC are calculated as a relative value to the lowest value in each country (y-axis). Task measures are standardized and processed for cross-country comparability; values represent relative rather than absolute task intensities - see Section 2.4.
Figure 12: Predicted Task Intensity by AI Exposure Score and Country
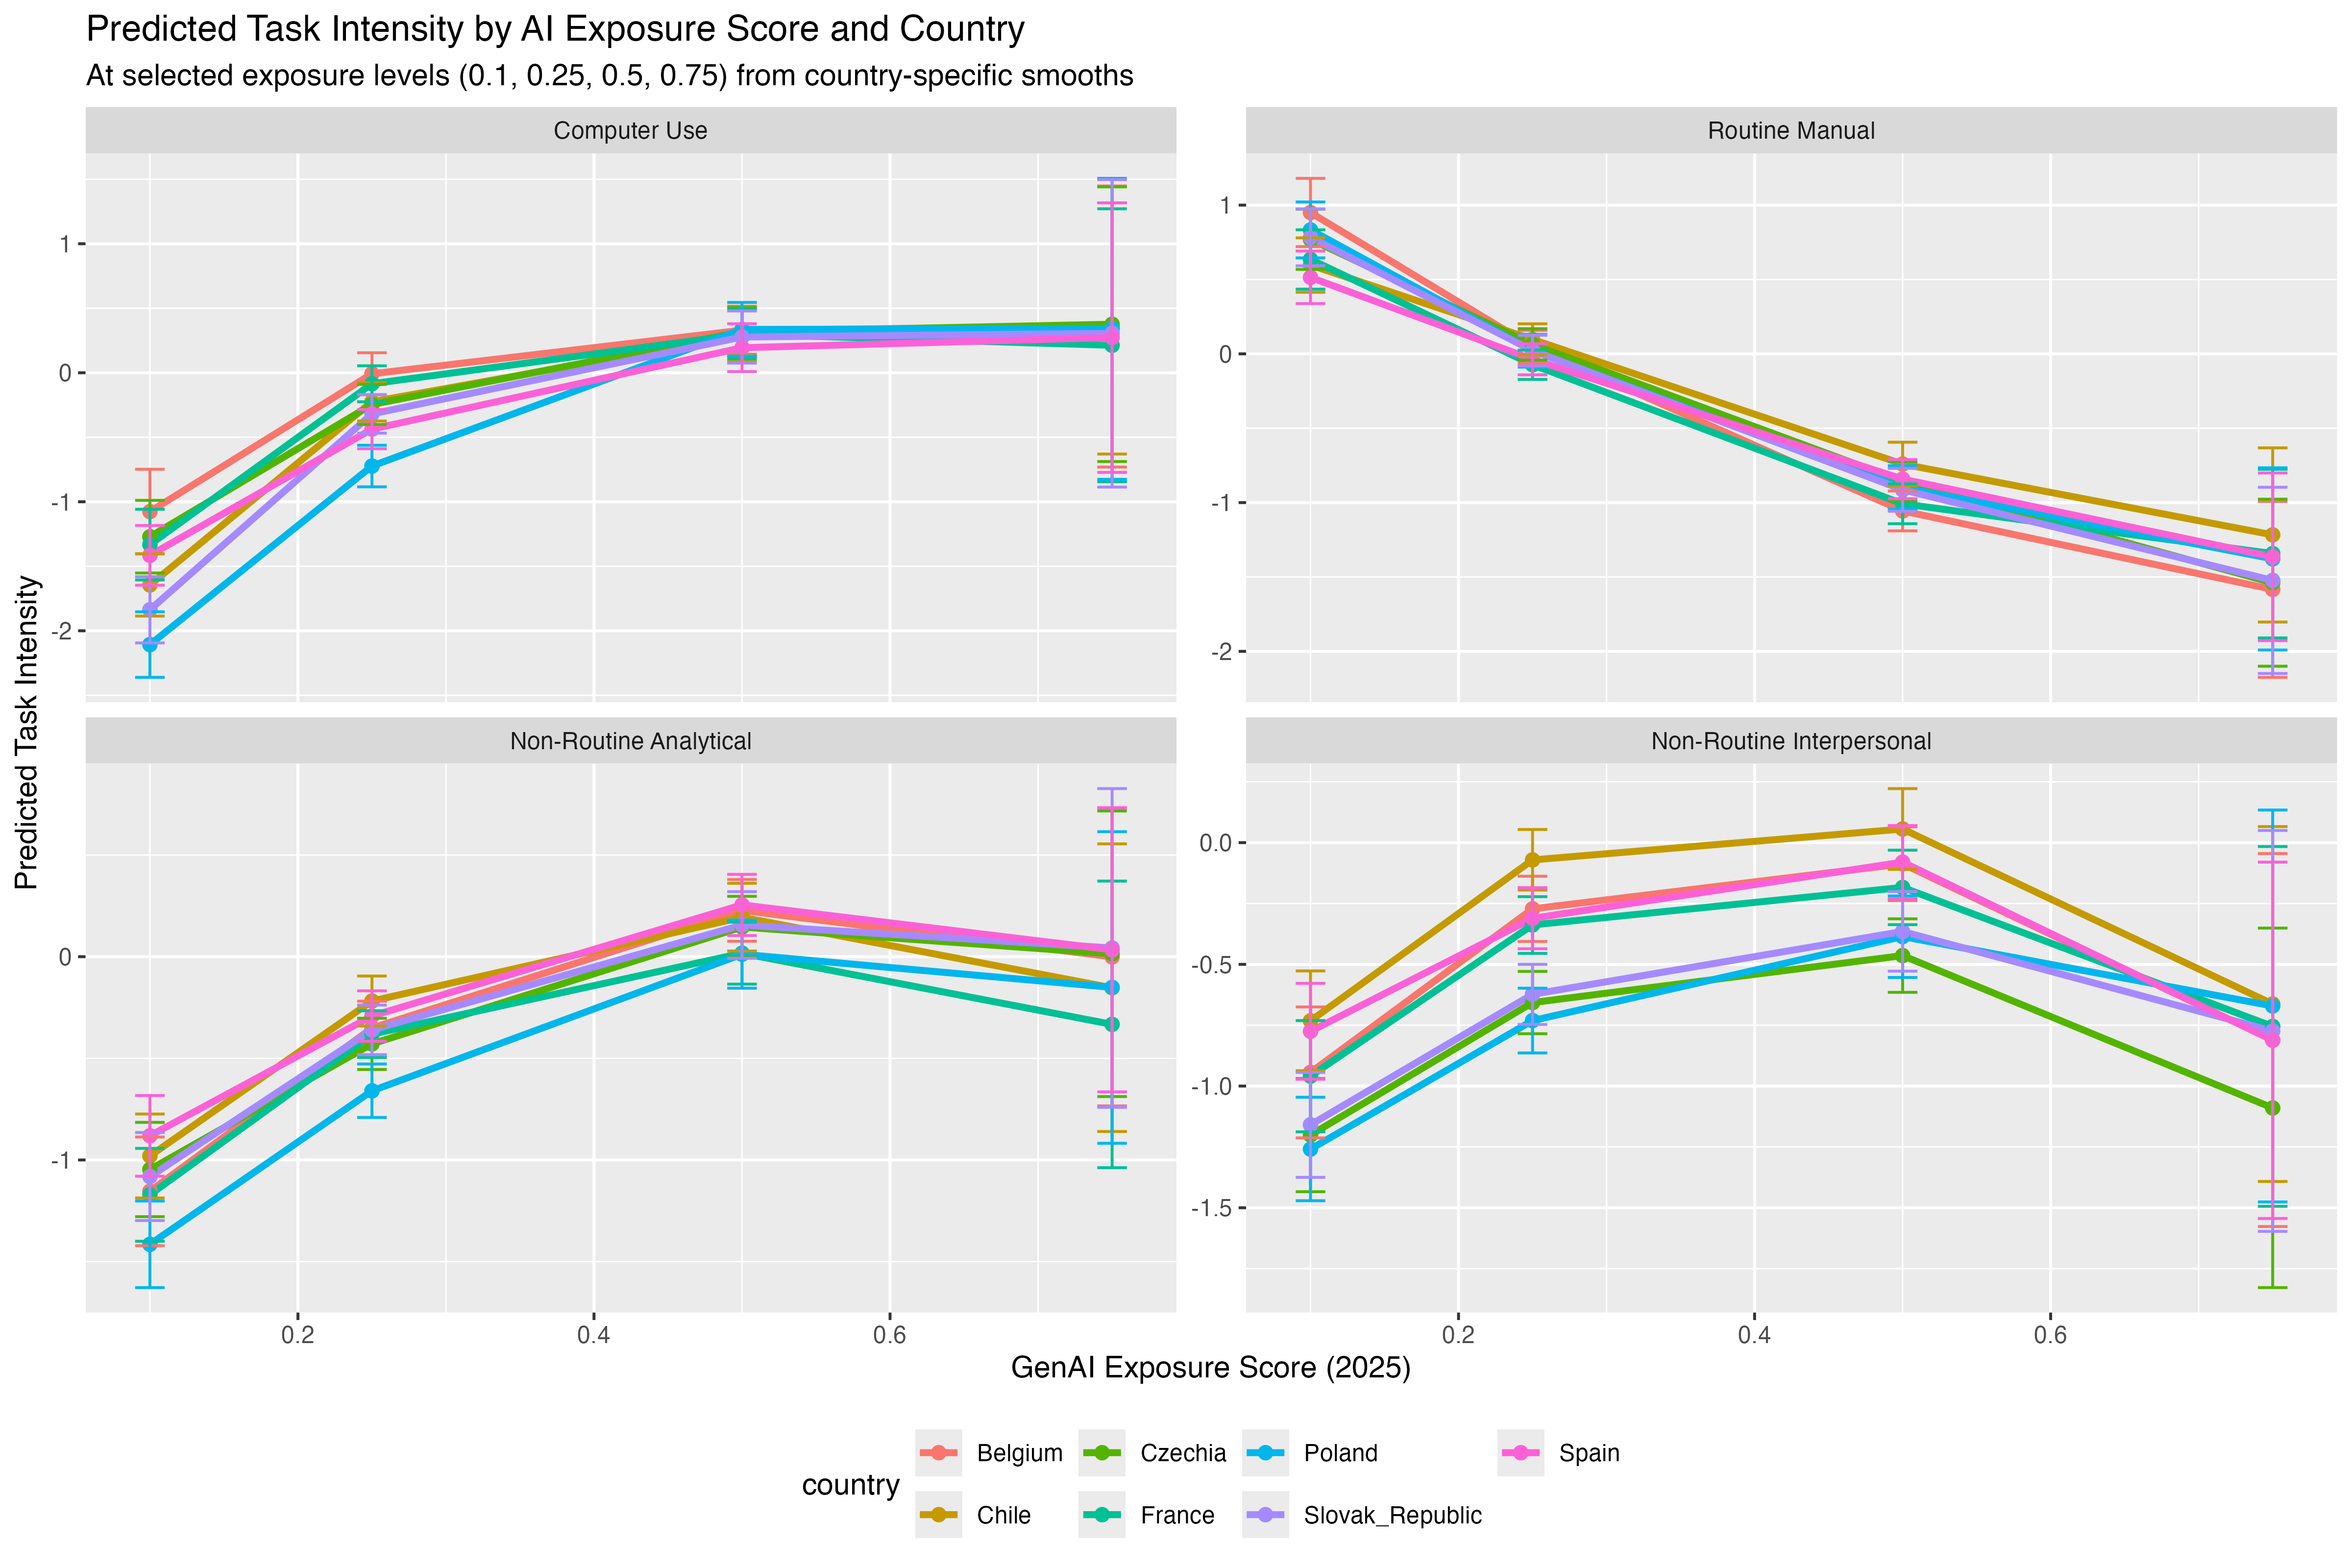
Notes: The figure displays predicted task intensity at four levels of GenAI exposure (0.1, 0.25, 0.5, 0.75) across countries, based on generalized additive models (GAMs) with country-specific smooth terms. Fitted values come from a flexible specification that allows each country to follow its own exposure–response curve. Including confidence intervals enables statistical significance assessment, helping to distinguish meaningful divergence from sampling variability. For the construction of task intensity values see Section 2.4.
To assess whether the relationship between AI exposure and task intensity differs across countries with 4-digit data, we use generalized additive models (GAMs) with country-specific smooths.22 We fit a separate smooth curve for each country, using a factor-smooth interaction that allows for country-specific flexibility while regularizing the curves to avoid overfitting.
We visualize how task composition varies by country along the GenAI exposure gradient by computing predicted task intensity values at four selected levels of exposure (0.1, 0.25, 0.5, 0.75), using country-specific smooths from the GAM (Figure 12). The resulting plot reveals several patterns. First, the shape and slope of the exposure–task relationship is quite similar across countries, with biggest dfferences visible for NRI tasks and CU. For instance, occupations in Poland report lower computer use than those in Belgium at low exposure levels. Still, this difference narrows as exposure increases, suggesting convergence in digital task use among highly exposed occupations. In contrast, Chile consistently shows significantly higher intensity of NRI tasks across the entire exposure curve, with confidence intervals that do not overlap with those of most other countries. This result points to a structurally different occupational task profile, where interpersonal work plays a more prominent role, regardless of exposure to GenAI.
To extend our analysis beyond the seven PIAAC countries with 4-digit occupational data, we incorporate 2-digit occupation-level information from an additional 39 countries using the first wave of PIAAC and three waves of STEP surveys (2012, 2013, and 2015/16). We merge these data with 4-digit GenAI exposure measures by aggregating to the 2-digit level. This requires assuming similar task intensity for all 4-digit occupations within a given 2-digit group—for example, treating Human Resource Managers, Sales and Marketing Managers, and Finance Managers as having comparable levels of Computer Use, Routine Manual (RM), Non-Routine Analytical (NRA), and Non-Routine Interpersonal (NRI) tasks. While this aggregation involves simplification, it enables us to regroup occupations into exposure gradients with greater country coverage, as a single 2-digit category can contain 4-digit occupations mapped to several different GenAI exposure gradients.
To examine how task intensity varies across levels of GenAI exposure and income groups, we estimate a series of generalized additive models (GAMs).23 These models include parametric interaction terms between GenAI exposure gradients and income level, estimated separately for each of the four task types (CU, RM, NRA, and NRI). GenAI exposure is treated as an ordered categorical variable, ranging from “Not Exposed” to “Gradient 4.” We use employment weights to reflect the relative importance of occupations and countries according to their employment size.24
Figure 13 deepens the analysis by comparing predicted task intensity levels across GenAI exposure gradients, stratified by country income levels. Several clear and interpretable patterns emerge. First, high-income countries (HICs) consistently exhibit the highest intensity of Computer Use (CU), Non-Routine Analytical (NRA), and Non-Routine Interpersonal (NRI) tasks, and the lowest levels of Routine Manual (RM) tasks, relative to upper-middle-income (UMC) and lower-middle-income countries (LMCs). The UMC and LMC curves tend to follow more similar trajectories to each other than to HICs, with task intensity increasing with income. These observed differences partly reflect underlying temporal and design variations between the PIAAC and STEP surveys, and also the fact that the task scores for the STEP sample are derived from a predictive model following Caunedo et al. (2023).25 In addition, computer use increased and RM tasks declined across successive waves of both PIAAC and STEP, reflecting trends toward digitalization and occupational upgrading over time. More recent collections (e.g., PIAAC wave 2) likely capture further advances. Nevertheless, the persistence of gaps across country groups suggests that underlying structural differences in task content remain.
Figure 13: Predicted Task Intensity by AI Exposure Score and Income Level
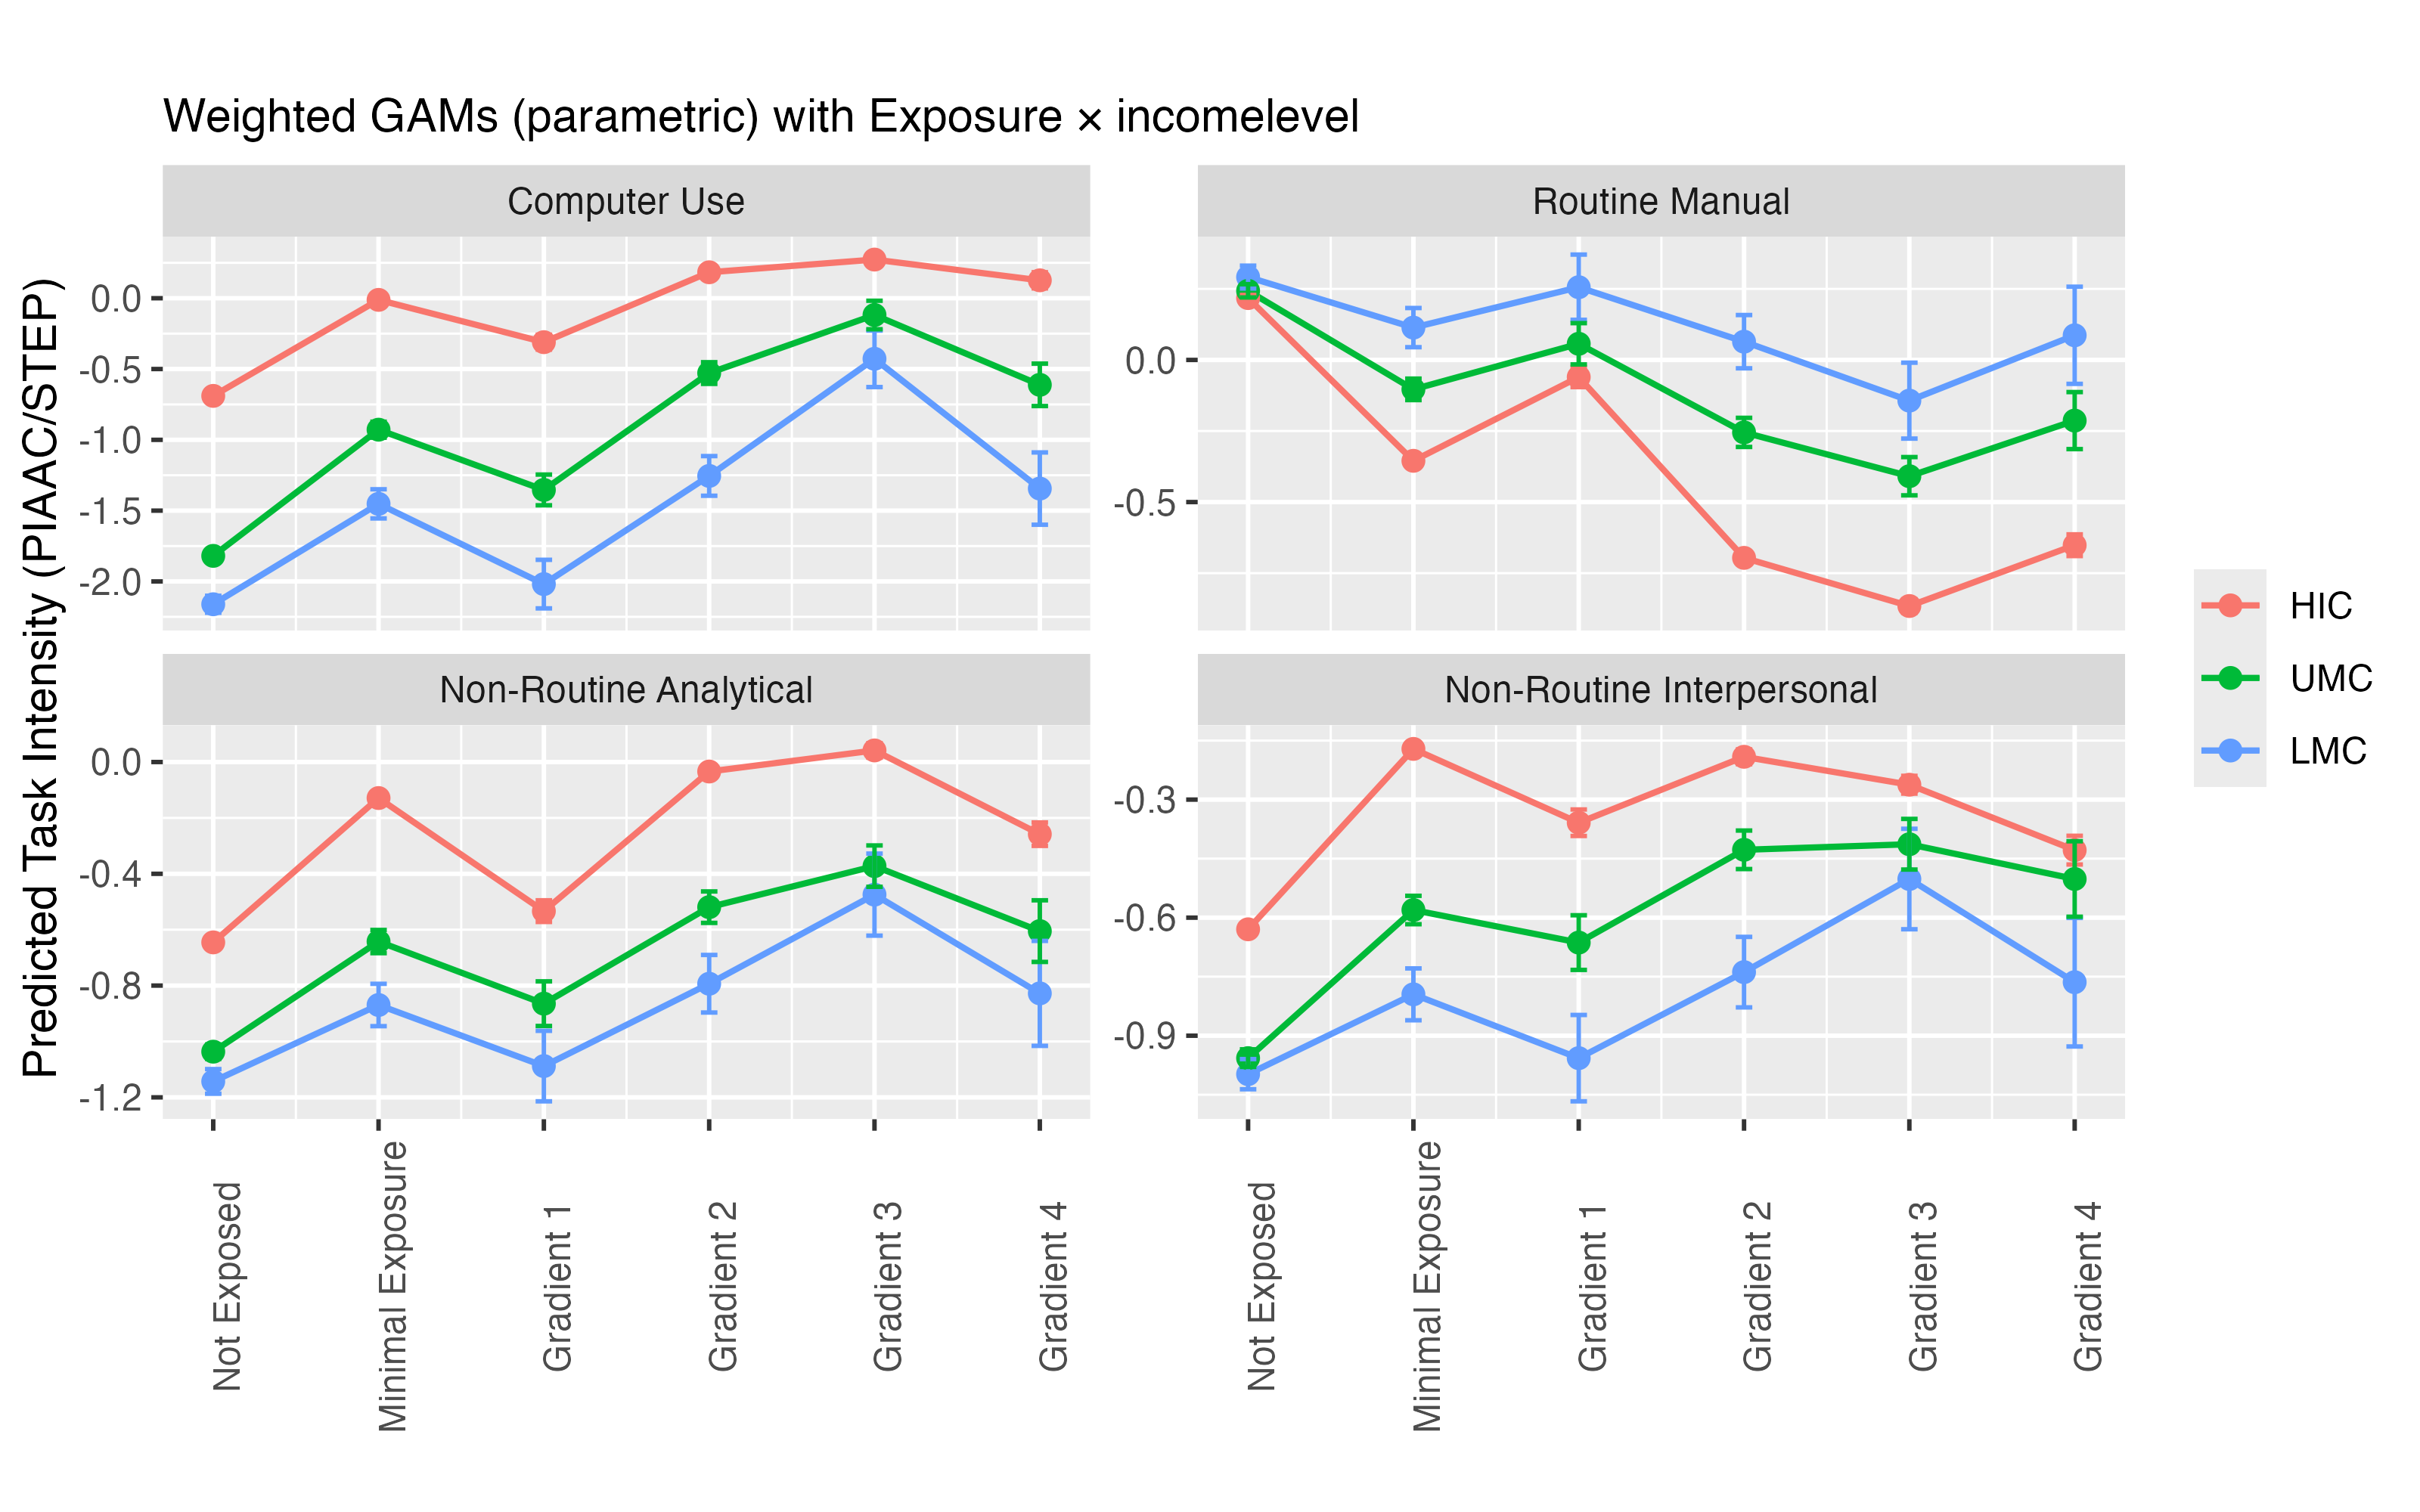
Notes: This figure shows the relationship between GenAI exposure (x-axis, based on mean exposure scores from Gmyrek et al., 2025) and four dimensions of task intensity: (1) Computer Use, (2) Routine Manual, (3) Non-Routine Analytical, and (4) Non-Routine Interpersonal tasks. Task scores are harmonized following Caunedo et al. (2023) and computed at the 2-digit ISCO-08 level across four data sources: STEP 2012, STEP 2013, STEP 2015/16, PIAAC first wave, and PIAAC second wave. Lines represent predicted task intensity by exposure level, stratified by country income groups.
Across all income groups, computer use increases with GenAI exposure, while routine manual tasks decline. However, in STEP countries—predominantly developing economies—the RM curve flattens earlier, indicating a higher baseline intensity of manual tasks and less change across exposure gradients. A notable feature is the dip in computer use in Gradient 4 occupations, which coincides with a rise in RM tasks. This is likely driven by the occupational composition of this group, which includes administrative and clerical jobs that, despite being GenAI-exposed, often involve more manual and physical components (e.g., document handling, event coordination) than digital knowledge work.
Divergences become more apparent in non-routine tasks. For NRA tasks, HICs show a rising trend across Gradients 1–3, reflecting the increasing analytical complexity of GenAI-exposed work. Middle-income countries, in contrast, display flatter trajectories at lower overall levels, which may reflect more limited embedding of analytical content in their occupational structures. A similar pattern emerges for NRI tasks: while HICs show a reverse-U shape—with peaks at moderate exposure levels (Gradients 2–3)—UMCs and LMCs exhibit lower and more stable NRI task intensity across exposure levels.
Taken together, the figure illustrates how the content of GenAI-exposed occupations is systematically shaped by national income levels. High-income countries not only have more workers in GenAI-exposed jobs, but those jobs are also more digitally intensive and cognitively demanding. In lower-income countries, the same exposure gradients are associated with occupations that lean more toward manual and routine tasks. This highlights that exposure alone may not reflect the full potential for GenAI integration. The actual impact of GenAI on work will depend heavily on the economic, technological, and institutional contexts in which it is applied. It will vary based on the differences in the composition of tasks withing the same occupations across different countries.
2.4 Adjusting Country-Level GenAI Exposure to Task Content Differentials
As the final step, we adjust country-level GenAI exposure scores to account for systematic differences in task content across countries, using observed patterns of task intensity in the full sample of 46 countries. We exclude fixed country effects in this specification, allowing the model to capture an average global relationship between task content and GenAI exposure.26 We use a generalized additive model (GAM) to account for non-linearities in how each task dimension relates to exposure, following the patterns documented in the preceding section.
Here, Exposure is the GenAI exposure score for occupation i at the 2-digit ISCO level. The variables CUi, RMi, NRAi, and NRIi represent standardized scores for Computer Use, Routine Manual, Non-Routine Analytical, and Non-Routine Interpersonal task intensity, respectively. The functions f1(·), . . . , f4(·) are smooth functions estimated using penalized splines, and εi is the residual.27
Using the fitted model, we generate a new adjusted exposure score for each country–occupation pair at the 2-digit level, reflecting predicted exposure based solely on observed task content. These predictions are then aggregated to the country level using employment weights to compute a mean adjusted exposure score for each country.
Figure 14: Adjusted Exposure Scores — Country Level
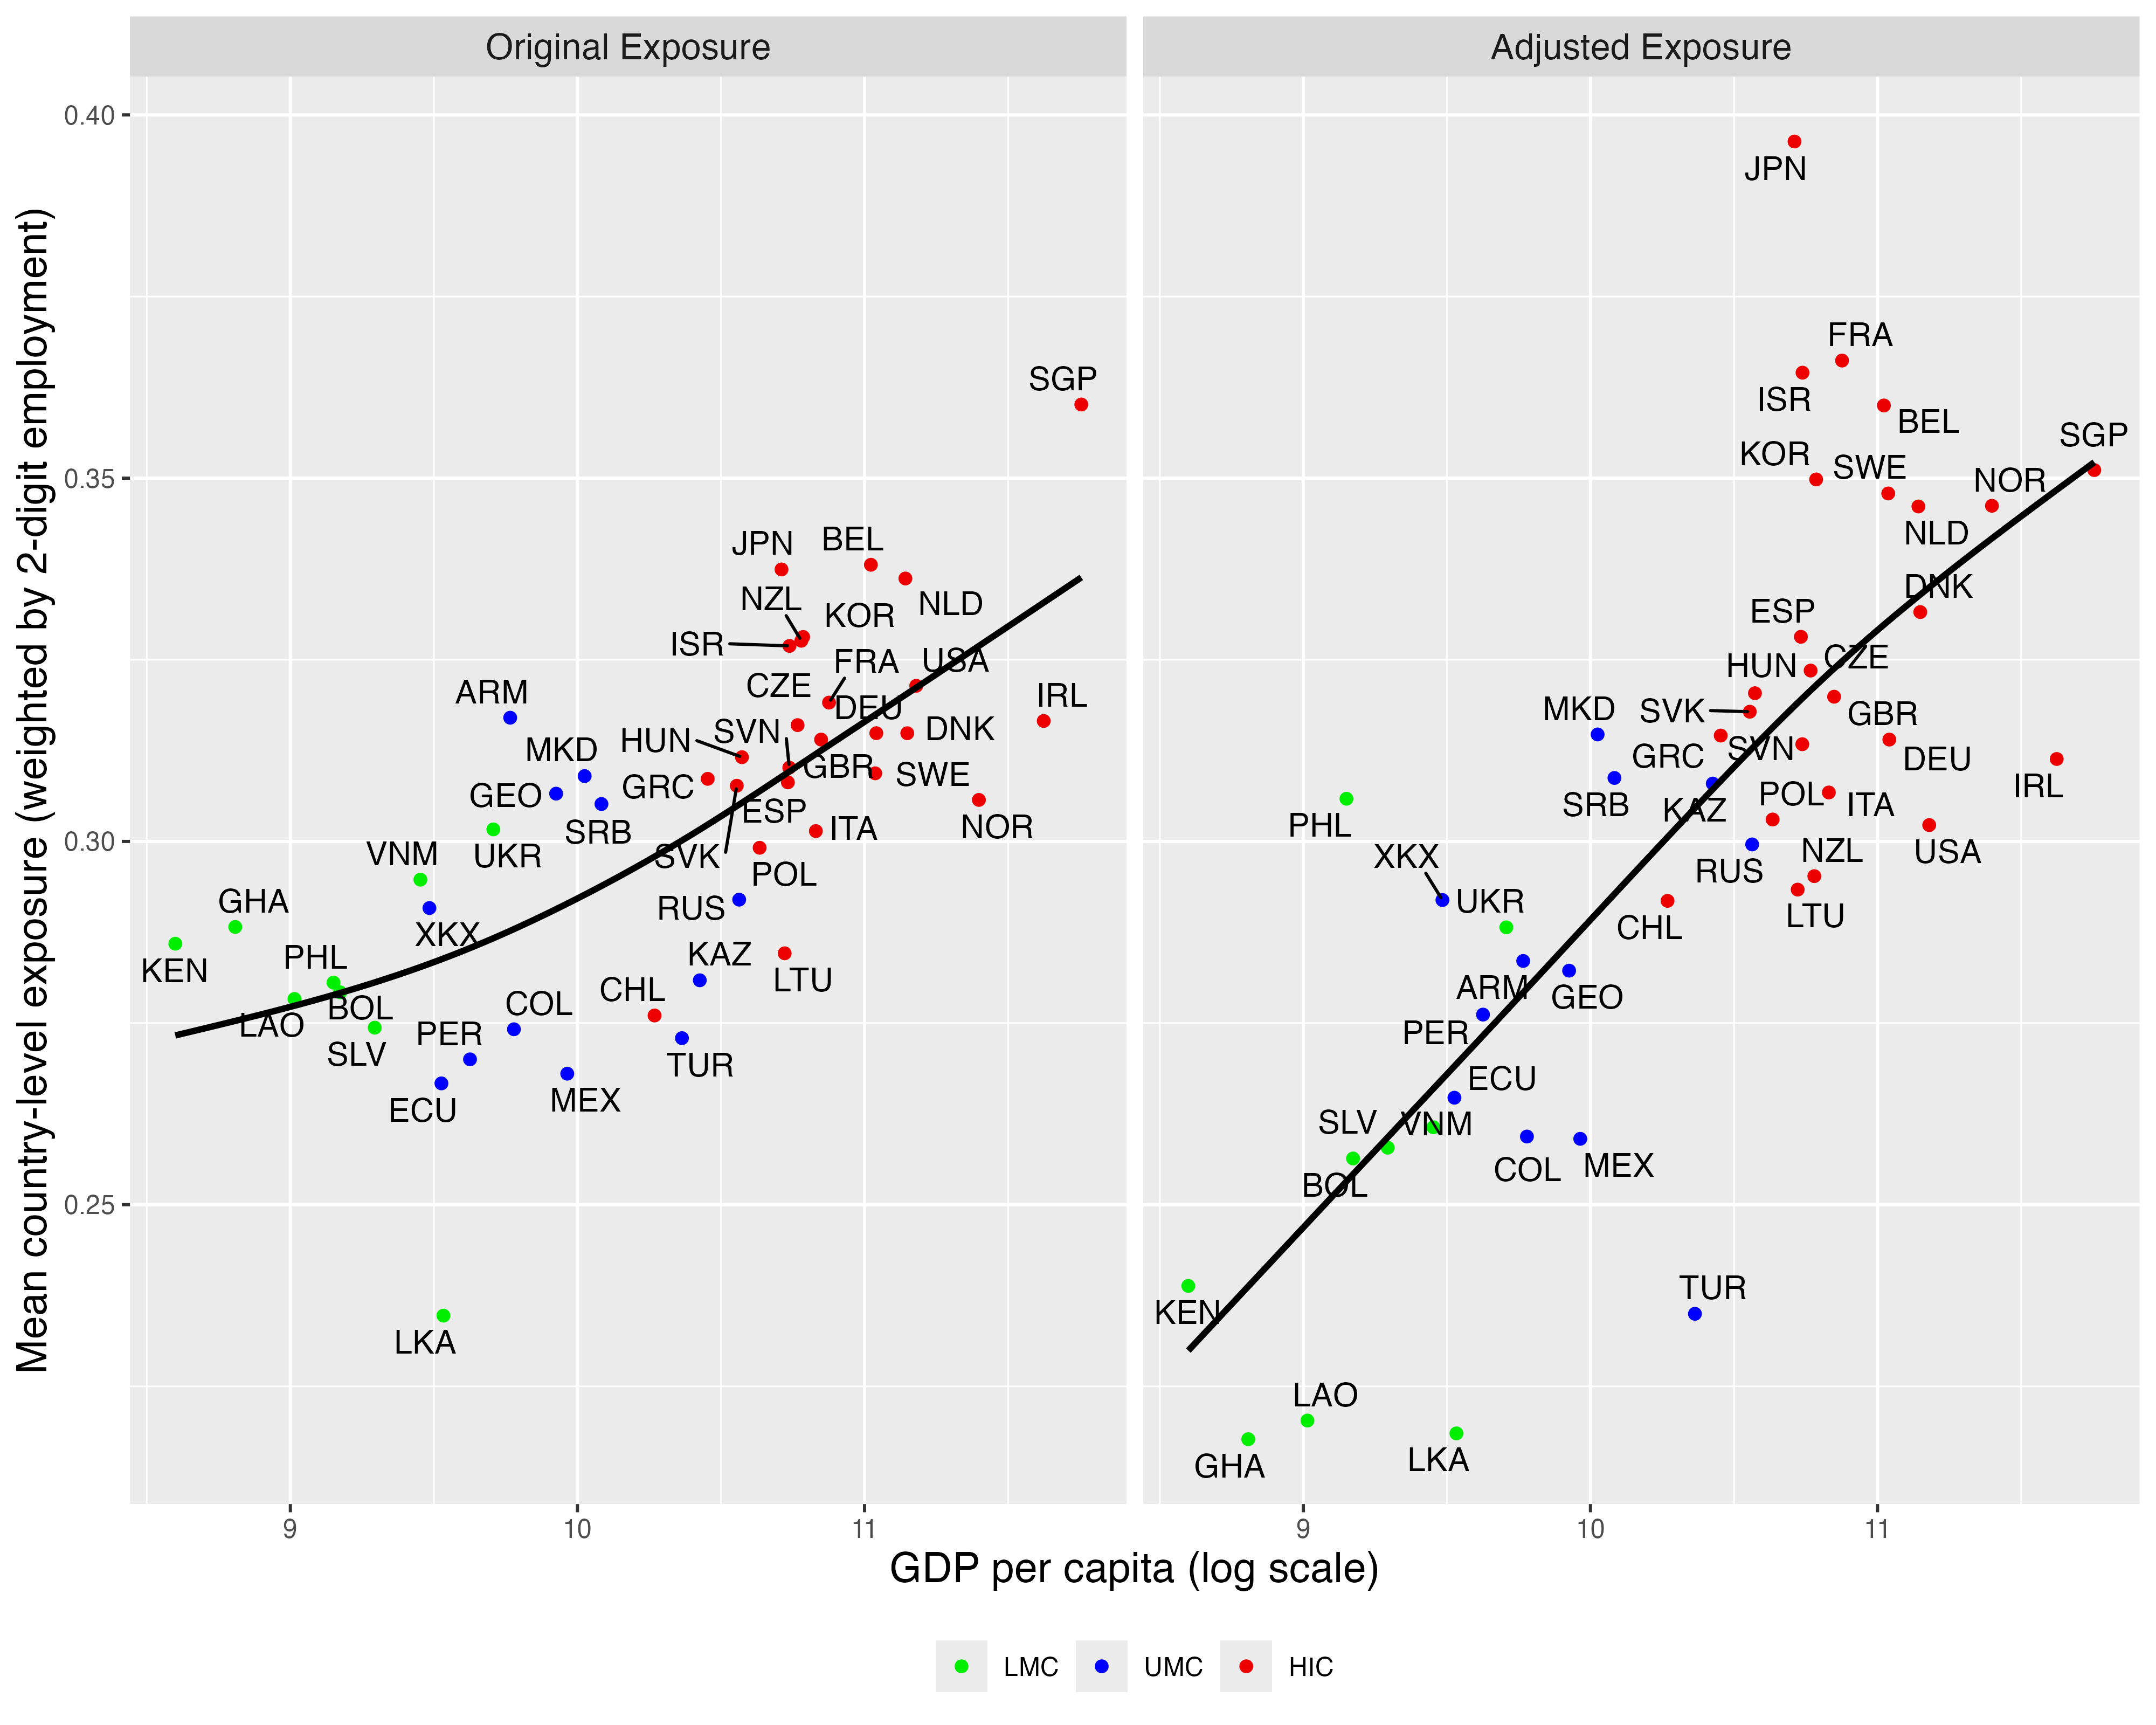
Notes: The figure compares the original (left) and task-adjusted (right) country-level exposure scores, plotted against log GDP per capita. Each point represents a country, with mean exposure weighted by 2-digit occupational employment.
Figure 14 compares the original and adjusted country-level exposure scores against (log) GDP per capita. The left panel shows the original scores; the right panel displays the adjusted scores, with income groups marked with colors, revealing several patterns.
First, the adjusted exposure scores exhibit a much stronger linear relationship with log GDP per capita. This reflects the fact that wealthier countries tend to concentrate employment in occupations with higher levels of computer use and non-routine tasks—especially analytical ones—which the model associates with higher GenAI exposure. In contrast, the original scores, in which the only differences between countries stem from occupational structures, are less dispersed and less strongly associated with income.
Second, the relative position of developing countries shifts markedly between the two measures. Several low- and middle-income countries (e.g., Ghana, Laos, Sri Lanka) drop significantly lower in the adjusted ranking, indicating that although they employ workers in occupations labeled as GenAI-exposed, the actual task content of those jobs makes them less susceptible to GenAIrelated transformation. In contrast, countries such as Japan and Singapore rank higher after adjustment, reflecting occupational structures more aligned with high-exposure tasks.
This adjustment illustrates that GenAI exposure is not solely determined by occupational titles but also by how tasks are performed across different contexts. As a result, standardized exposure indices likely overstate exposure in lower-income settings, where the same occupations often involve fewer digital and analytical tasks. Although we use a distinct exposure measure and estimation method from Lewandowski et al., 2025, our findings reinforce their conclusion that accounting for task content provides a more nuanced and context-sensitive understanding of exposure.28
Conclusion
In this paper, we investigate the potential impact of GenAI on the global labour market, focusing on the uneven distribution of risks and opportunities between advanced and developing economies. We explore three particular angles. First, we applied the ILO–NASK Index of occupational exposure to detailed micro data from 135 countries, covering 69 percent of global population. Second, building on our work in LAC, we examined the impact of the digital divide, combining occupational exposure with data on internet access in countries at different income levels, as a precondition for benefiting from technologies such as GenAI. Third, using PIAAC and STEP skills surveys across 46 countries and five waves of data collection since 2012, we linked GenAI exposure to the actual content of job tasks, based on constructs of task intensity: computer use, routine manual tasks, non-routine analytical tasks, and non-routine interpersonal work. Based on this information, we modelled the relationship between occupational exposure and task content across countries, adjusting exposure scores for differences in tasks between high- and lower-income settings.
Our analysis indicates that, in the global context, several asymmetric forces will shape GenAI’s impact on jobs.
Across countries, exposure correlates positively with development brackets: high-income economies have larger shares of employment in high-exposure gradients, especially on the automation side, while differences in augmentation potential are smaller across income groups. Correcting exposure by actual internet access widens income-based differentials and reveals an important “no buffer, big bottlenecks” dynamic: in lower-income countries, workers positioned for displacement are already sufficiently connected to experience the negative effects of rapid automation, while those who could productively augment their work face sizeable infrastructure gaps that delay benefits. For example, among the 441.8 million jobs globally in augmentation gradients in the countries covered by our study, roughly 66.9 million lack internet access: a concrete estimate of foregone near-term gains. This contrasts sharply with high-income countries (HICs), where both the workers at risk of automation and those positioned to benefit from productivity improvements through job transformation are in almost universally digitalized environments.
Despite the higher potential impact of automation in HICs, the consequences of these risks will vary across economies. In lower-income countries, the subset vulnerable to automation is small but strategically important: these are often higher-quality, higher-income jobs in formal services where early displacement could have outsized distributional effects. Such countries also have considerably less fiscal and institutional capacity to mitigate the negative consequences of automation or to provide public support during transitions.
In most countries, exposure rises with education and household income; within occupations, it often concentrates among younger and female workers in office-based roles. While immediate risks are partially mitigated by the digital divide, in the longer term this trend raises a more profound risk of a “white-collar bypass”. As GenAI becomes capable of performing many officebased tasks, the types of jobs that historically facilitated women’s entry into the workforce and offered pathways to quality employment in advanced economies may never fully emerge in today’s developing countries, or may appear in significantly reduced forms, with many core tasks ultimately performed by GenAI. This could prevent low-income countries from experiencing the type of transformation that office work once enabled in wealthier nations, particularly with respect to gender equality. The implications extend beyond gender: since entry-level office jobs have traditionally served as stepping stones for young workers entering the labour market, their absence could further hinder youth integration in developing countries, where young people already face substantial employment barriers.
Beyond theoretical exposure, we show that occupations differ significantly depending on income context. One one-size-fits-all exposure measures likely overstate GenAI’s impact in developing economies because they assume uniform task content within ISCO categories. Even within highly exposed occupations, workers in lower-income countries perform substantially fewer nonroutine analytical tasks and more routine/manual components than their counterparts in highincome economies. A task-content adjustment of the global exposure index shifts countrylevel rankings in intuitive ways: countries with digitally intensive, analytically demanding jobs move up, while those where exposed occupations involve fewer non-routine tasks move down. Exposure is therefore not simply an attribute of an occupational title; it is a function of how that occupation is organized, equipped, and performed locally.
With the right policies and adequate digital infrastructure in place, GenAI tools could help upgrade some occupations in lower-income countries, consistent with evidence that these technologies can redistribute expertise from more experienced workers to a wider group of professionals and improve performance within occupations (Autor and Thompson, 2025; Gmyrek and Winkler, 2026; Noy and Zhang, 2023; Peng et al., 2023). However, structural differences in tasks, with a lower non-routine analytical content and more manual tasks in the same occupations in developing countries, may limit the potential benefits of these technologies, while the digital divide could further exacerbating such disparities. Betai and Chen (2025) provide new evidence consistent with these hypotheses by using data from one of the largest online labor marketplaces, where labor demand mainly originates in high-income countries, and where developing countries are the leading talent suppliers. The study finds that GenAI was associated with a sharp decrease in the volume and value of international service outsourcing to developing countries, especially for skills considered more likely to be automated.29 While some workers benefited from a shift toward tasks that require higher value and complexity, they represented a relatively small group.
In short, while GenAI is often considered as a global phenomenon, its adoption and labourmarket impacts will be uneven. Without targeted investment and labour-market policies, productivity gains are likely to accrue where digital bottlenecks are smallest—mostly in richer economies and better-equipped firms—while displacement risks will not be similarly delayed for the connected subset of workers in poorer settings.
Appendix
Table A1: List of countries by income group
|
High income |
Upper middle income |
Lower middle income |
Low income |
|---|---|---|---|
|
Australia |
Albania |
Angola |
Afghanistan |
|
Austria |
Argentina |
Bangladesh |
Burkina Faso |
|
Bahamas |
Belarus |
Benin |
Burundi |
|
Barbados |
Belize |
Bhutan |
Congo - Kinshasa |
|
Belgium |
Bosnia & Herzegovina |
Bolivia |
Ethiopia |
|
Brunei |
Botswana |
Cambodia |
Gambia |
|
Chile |
Brazil |
Côte d’Ivoire |
Guinea |
|
Croatia |
Bulgaria |
Egypt |
Guinea-Bissau |
|
Cyprus |
Colombia |
El Salvador |
Liberia |
|
Czechia |
Costa Rica |
Eswatini |
Madagascar |
|
Denmark |
Dominican Republic |
Ghana |
Mali |
|
Estonia |
Ecuador |
Honduras |
Mozambique |
|
Finland |
Fiji |
India |
Niger |
|
France |
Georgia |
Indonesia |
Rwanda |
|
Germany |
Grenada |
Iran |
Sierra Leone |
|
Greece |
Guatemala |
Kenya |
Somalia |
|
Hungary |
Guyana |
Kiribati |
Sudan |
|
Iceland |
Iraq |
Kyrgyzstan |
Togo |
|
Ireland |
Jordan |
Laos |
Uganda |
|
Israel |
Kosovo |
Lebanon |
Zambia |
|
Italy |
Maldives |
Lesotho |
|
|
Latvia |
Marshall Islands |
Micronesia (Federated States of) |
|
|
Lithuania |
Mauritius |
Mongolia |
|
|
Luxembourg |
Mexico |
Myanmar (Burma) |
|
|
Nauru |
Montenegro |
Nepal |
|
|
Netherlands |
North Macedonia |
Nigeria |
|
|
Norway |
Palau |
Pakistan |
|
|
Panama |
Peru |
Papua New Guinea |
|
|
Poland |
Russia |
Philippines |
|
|
Portugal |
Serbia |
Samoa |
|
|
Romania |
Suriname |
São Tomé & Príncipe |
|
|
Seychelles |
Thailand |
Senegal |
|
|
Singapore |
Tonga |
Sri Lanka |
|
|
Slovakia |
Tuvalu |
Tajikistan |
|
|
Slovenia |
Tanzania |
||
|
Spain |
Timor-Leste |
||
|
Sweden |
Tunisia |
||
|
Switzerland |
Vanuatu |
||
|
United Arab Emirates |
Vietnam |
||
|
United Kingdom |
Palestinian Territories |
||
|
United States |
Zimbabwe |
||
|
Uruguay |
|||
Table A2: Total population and employment - ILO country list
|
Region |
Total population |
Total employment |
Income Group |
Total population |
Total employment |
|---|---|---|---|---|---|
|
World |
70.28% |
66.96% |
High income |
77.64% |
75.78% |
|
East Asia & Pacific |
31.05% |
29.56% |
Low income |
80.51% |
81.58% |
|
Europe & Central Asia |
78.95% |
84.83% |
Lower middle income |
95.63% |
99.24% |
|
Latin America & Caribbean |
89.33% |
90.5% |
Upper middle income |
33.54% |
31.45% |
|
Middle East & North Africa |
59.69% |
57.4% |
|||
|
North America |
89.16% |
88.65% |
|||
|
South Asia |
98.5% |
99.01% |
|||
|
Sub-Saharan Africa |
86.35% |
88.9% |
Figure A15: Internet users vs. GDP per capita
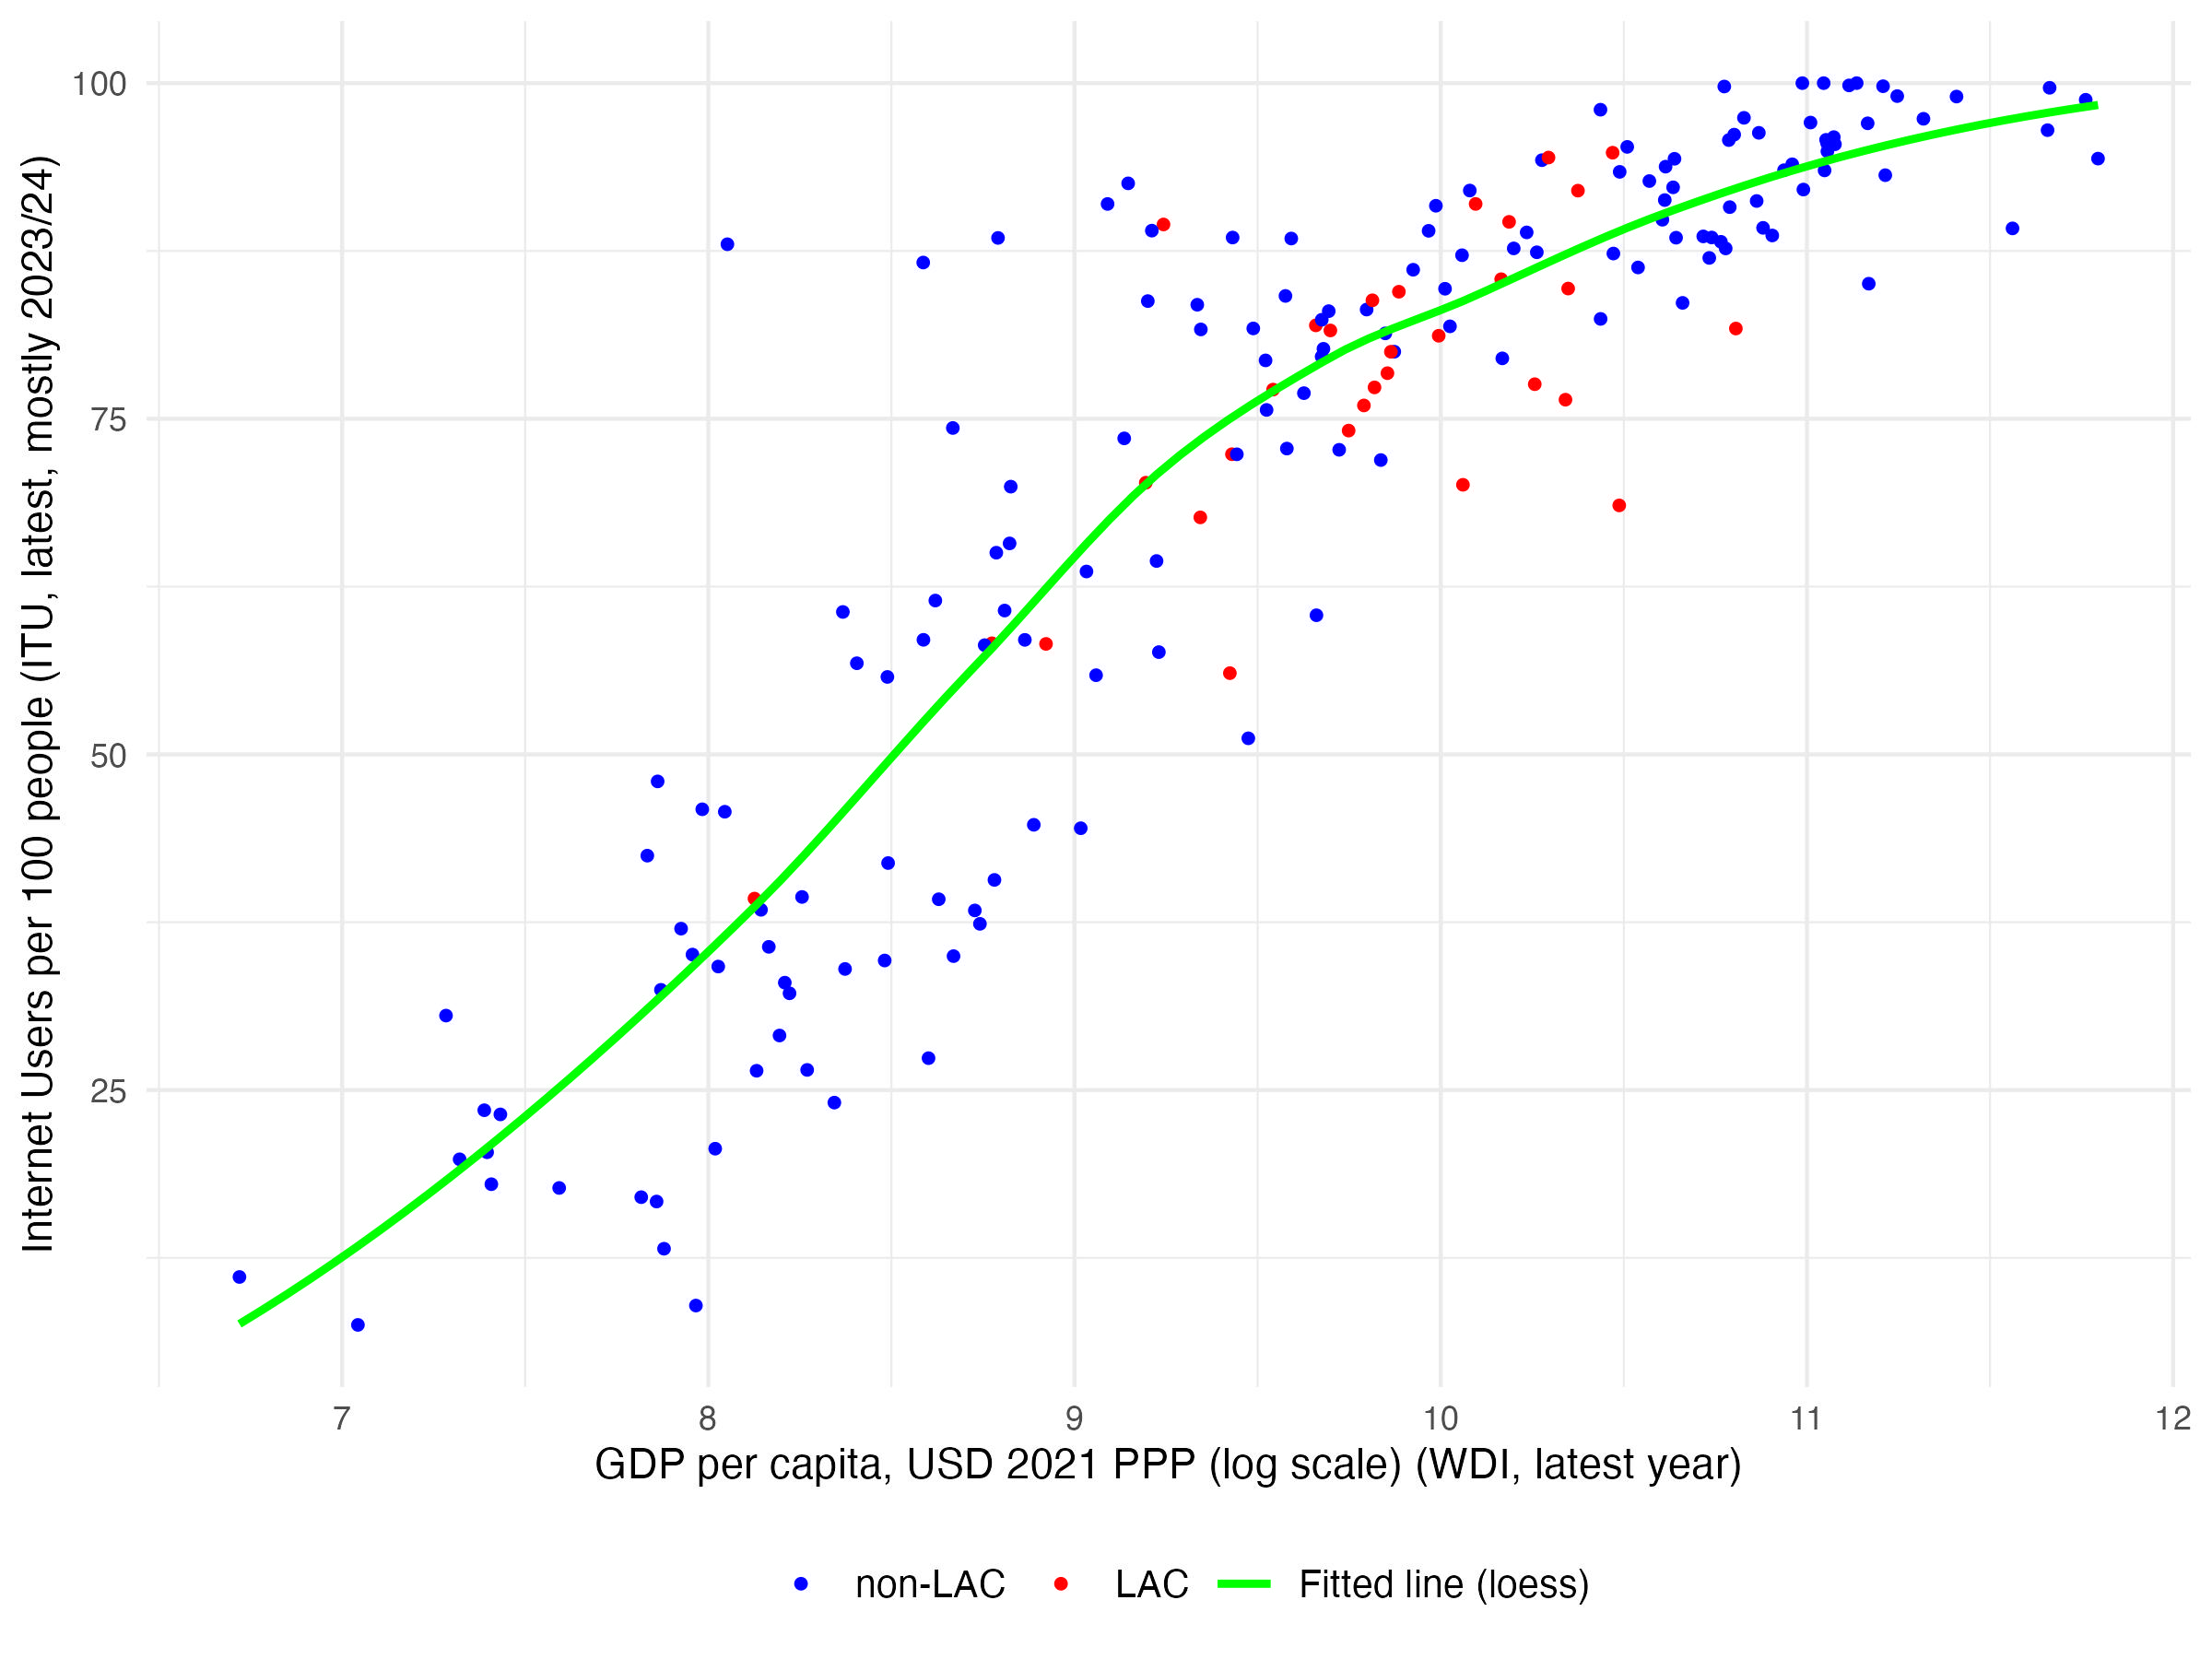
Table A3: List of countries by dataset and internet access
|
Country |
Year |
Observations |
From |
Internet variable |
ISCO-08 |
|---|---|---|---|---|---|
|
Albania |
2013 |
17,730 |
GLD |
No |
3-digit |
|
Argentina |
2023 |
74,742 |
SEDLAC |
No |
2-digit |
|
Bangladesh |
2022 |
188,221 |
GLD |
No |
4-digit |
|
Belgium |
2023 |
2,670 |
PIAAC |
Yes |
4-digit |
|
Benin |
2021 |
22,468 |
WAEMU |
Yes |
3-digit |
|
Bolivia |
2023 |
29,004 |
SEDLAC |
Yes |
2-digit |
|
Brazil |
2023 |
301,665 |
SEDLAC |
Yes |
2-digit |
|
Burkina Faso |
2021 |
24,542 |
WAEMU |
Yes |
4-digit |
|
Cambodia |
2021 |
30,222 |
EAPCE |
No |
1-digit |
|
Chile |
2022 |
163,674 |
SEDLAC |
Yes |
4-digit |
|
Czechia |
2023 |
3,654 |
PIAAC |
Yes |
4-digit |
|
Dominican Republic |
2023 |
13,114 |
SEDLAC |
Yes |
4-digit |
|
Ecuador |
2023 |
21,614 |
SEDLAC |
No |
4-digit |
|
El Salvador |
2023 |
42,311 |
SEDLAC |
Yes |
4-digit |
|
Estonia |
2023 |
5,077 |
PIAAC |
Yes |
1-digit |
|
Ethiopia |
2021 |
63,043 |
GLD |
No |
3-digit |
|
Finland |
2023 |
3,033 |
PIAAC |
Yes |
1-digit |
|
France |
2023 |
4,377 |
PIAAC |
Yes |
4-digit |
|
Georgia |
2022 |
26,223 |
GLD |
No |
4-digit |
|
Guatemala |
2023 |
29,624 |
SEDLAC |
Yes |
2-digit |
|
Guinea-Bissau |
2021 |
24,294 |
WAEMU |
Yes |
4-digit |
|
Honduras |
2023 |
14,069 |
SEDLAC |
Yes |
3-digit |
|
Hungary |
2023 |
3,416 |
PIAAC |
Yes |
1-digit |
|
India |
2022 |
163,575 |
GLD |
No |
3-digit |
|
Italy |
2023 |
2,753 |
PIAAC |
Yes |
1-digit |
|
Korea, Rep. |
2023 |
4,405 |
PIAAC |
Yes |
1-digit |
|
Lao PDR |
2018 |
27,125 |
EAPCE |
No |
1-digit |
|
Mali |
2021 |
12,644 |
WAEMU |
Yes |
4-digit |
|
Mexico |
2023 |
782,654 |
GLD |
No |
4-digit |
|
Mongolia |
2022 |
20,641 |
GLD |
No |
4-digit |
|
Pakistan |
2020 |
163,257 |
GLD |
No |
4-digit |
|
Peru |
2023 |
82,055 |
SEDLAC |
Yes |
4-digit |
|
Poland |
2023 |
3,187 |
PIAAC |
Yes |
4-digit |
|
Portugal |
2023 |
2,145 |
PIAAC |
Yes |
1-digit |
|
Rwanda |
2021 |
19,030 |
GLD |
No |
4-digit |
|
Senegal |
2021 |
19,585 |
WAEMU |
Yes |
4-digit |
|
Singapore |
2023 |
3,790 |
PIAAC |
Yes |
1-digit |
|
Slovak Republic |
2023 |
3,664 |
PIAAC |
Yes |
4-digit |
|
Spain |
2023 |
3,919 |
PIAAC |
Yes |
4-digit |
|
Sri Lanka |
2021 |
28,967 |
GLD |
No |
4-digit |
|
Switzerland |
2023 |
5,045 |
PIAAC |
Yes |
1-digit |
|
Thailand |
2021 |
448,963 |
GLD |
No |
4-digit |
|
Togo |
2021 |
15,493 |
WAEMU |
Yes |
4-digit |
|
Turkiye |
2019 |
160,380 |
GLD |
No |
2-digit |
|
United Kingdom |
2023 |
3,490 |
PIAAC |
Yes |
1-digit |
|
United States |
2023 |
2,591 |
PIAAC |
Yes |
1-digit |
|
Uruguay |
2023 |
45,502 |
SEDLAC |
Yes |
4-digit |
|
Zambia |
2022 |
7,608 |
GLD |
No |
4-digit |
|
Zimbabwe |
2022 |
33,069 |
GLD |
No |
2-digit |
Table A4: Total population and employment - internet access country list
|
Region |
Total population |
Total employment |
Income Group |
Total population |
Total employment |
|---|---|---|---|---|---|
|
World |
44.64% |
43.08% |
High income |
62.7% |
61.11% |
|
East Asia & Pacific |
7% |
7.52% |
Low income |
28.68% |
32.37% |
|
Europe & Central Asia |
47.79% |
48.56% |
Lower middle income |
58.31% |
58.79% |
|
Latin America & Caribbean |
79.44% |
80.66% |
Upper middle income |
25.19% |
23.93% |
|
North America |
89.16% |
88.65% |
|||
|
South Asia |
96.27% |
97.88% |
|||
|
Sub-Saharan Africa |
21.45% |
21.1% |
Table A5: Multinomial Logit estimates
|
Augmentation potential |
Automation potential |
|
|---|---|---|
|
Female |
0.175*** (0.007) |
0.855*** (0.010) |
|
Age group 26 - 35 |
0.227*** (0.010) |
0.162*** (0.015) |
|
36 - 45 |
0.307*** (0.010) |
0.006 (0.016) |
|
46 - 55 |
0.341*** (0.010) |
-0.093*** (0.017) |
|
56 - 65 |
0.424*** (0.011) |
-0.214*** (0.021) |
|
Urban area |
0.038*** (0.007) |
0.237*** (0.013) |
|
Education level |
||
|
Primary |
0.316*** (0.091) |
1.889*** (0.013) |
|
Secondary |
0.780*** (0.014) |
3.587*** (0.091) |
|
Tertiary |
1.268*** (0.014) |
4.674*** (0.091) |
|
Sector |
||
|
Mining |
3.015*** (0.061) |
2.623*** (0.070) |
|
Manufacturing |
3.404*** (0.035) |
2.412*** (0.047) |
|
Pub. Utilities |
4.164*** (0.046) |
3.317*** (0.059) |
|
Construction |
1.636*** (0.046) |
2.014*** (0.054) |
|
Commerce |
5.987*** (0.033) |
2.911*** (0.046) |
|
Transport & Comm. |
5.424*** (0.034) |
4.067*** (0.048) |
|
Financial & Bus. Serv. |
5.183*** (0.035) |
4.766*** (0.047) |
|
Pub. Admin. |
4.497*** (0.036) |
3.984*** (0.047) |
|
Other |
2.943*** (0.035) |
1.764*** (0.047) |
|
Constant |
-6.075*** (0.049) |
-8.834*** (0.118) |
|
Observations |
1,381,950 |
1,381,950 |
|
Standard errors in parentheses *** p<0.01, ** p<0.05, * p<0.1 |
||
Figure A16: Marginal effects on the probability of exposure outcomes
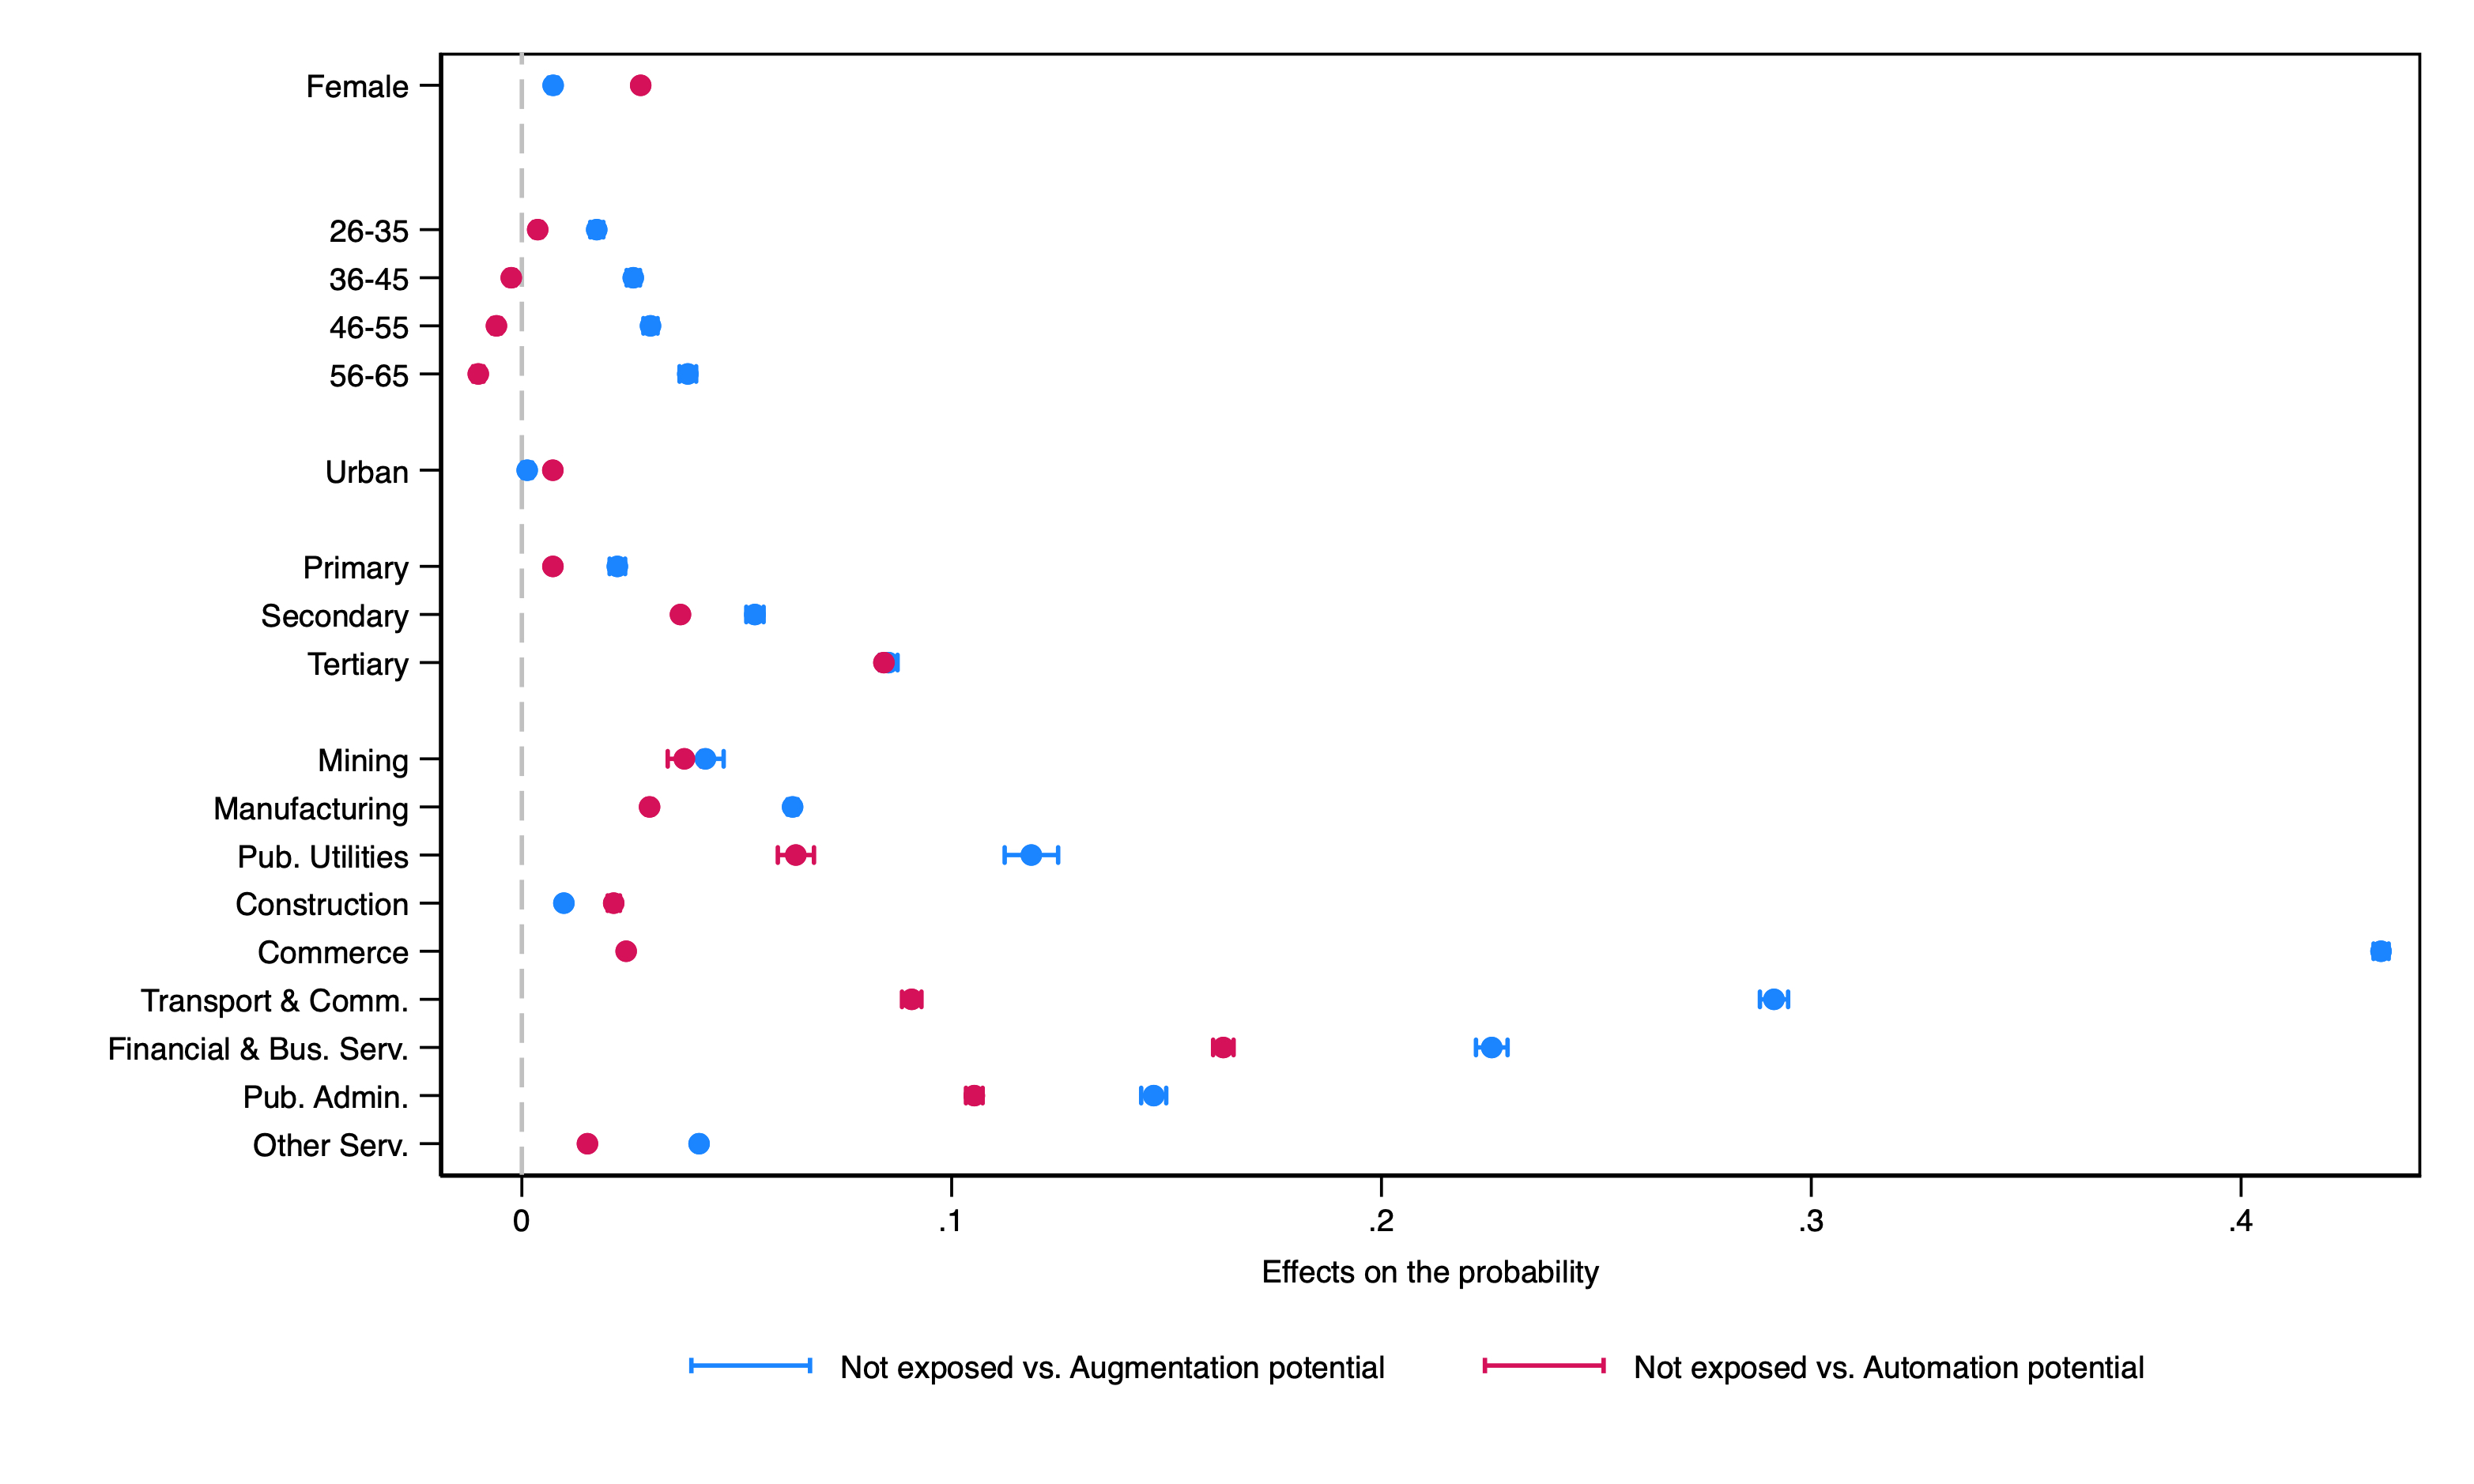
Table A6: PIAAC tasks-related questions
|
Task categories |
Task measures |
Questions |
|---|---|---|
|
NRA |
Read |
How often do you read directions or instructions? How often do you read letters, memos or e-mails? How often do you read articles in newspapers, magazines or newsletters? How often do you read articles in professional journals or scholarly publications? How often do you read books? How often do you read manuals or reference materials? How often do you read bills, invoices, bank statements or other financial statements? How often do you read diagrams, maps or schematics? |
|
Think creatively |
How often do you take at least 30 minutes to find a good solution? |
|
|
NRI |
Personal relationship |
How often do you share work-related information with co-workers? How often do you sell a product or a service? How often do you persuade or influence people? How often do you negotiate with people either inside or outside your firmor organization? |
|
Guiding/Coaching |
How often do you instruct, train or teach people, individually or in groups? How often do you advise people? How often do you plan the activities of others? |
|
|
RC |
Structured/Repetition |
How often do you plan your own activities? (inverse) How often do you organize your own time? (inverse) |
|
RM |
Controlling machines |
How often do you work physically for a long period? |
|
NRM |
Operating/Hands/Manual |
How often do you use skill or accuracy with your hands or fingers? |
Table A7: STEP tasks-related questions
|
Task categories |
Task measures |
Questions |
|---|---|---|
|
NRA |
Read |
Do you read anything at this work? Do you read forms? Do you read bills or financial statements? Do you read newspapers or magazines? Do you read instruction manuals/operating manuals? Do you read books (other than instruction/operating manuals)? Do you read reports? |
|
Think creatively |
How often do you have to undertake tasks that require at least 30 minutes of thinking? |
|
|
NRI |
Personal relationship |
Do you have any contact with people other than co-workers, for examplewith customers, clients, students, or the public? |
|
Guiding/Coaching |
Do you direct and check the work of other workers (supervise)? |
|
|
RC |
Structured/Repetition |
How much freedom do you have to decide how to do your work in your own way? (inverse) How often does this work involve carrying out short, repetitive tasks? (inverse) How often does this work involve learning new things? |
|
RM |
Controlling machines |
What number would you use to rate how physically demanding your work is? Do you operate or work with any heavy machines or industrial equipment? |
|
NRM |
Operating/Hands/Manual |
Do you drive a car, truck or three-wheeler? Do you repair/maintain electronic equipment? |
References
Acemoglu, D., & Johnson, S. (2023). Power and progress: Our thousand-year struggle over technology and prosperity. PublicAffairs.
Autor, D., Chin, C., Salomons, A., & Seegmiller, B. (2024). New frontiers: The origins and content of new work, 1940–2018. Quarterly Journal of Economics, 139, 1399–1465. https://doi.org/10.1093/qje/qjae008
Autor, D., & Thompson, N. (2025). Expertise. Journal of the European Economic Association, jvaf023.
Betai, N., & Chen, M. (2025). Automation without Borders: The Impacts of Generative AI on International Service Outsourcing.
Brynjolfsson, E., Mitchell, T., & Rock, D. (2018). What can machines learn, and what does it mean for occupations and the economy? AEA Papers and Proceedings, 108, 43–47. https://doi.org/10.1257/pandp.20181019
Brynjolfsson, E., Chandar, B., & Chen, R. (2025). Canaries in the coal mine? six facts about the recent employment effects of artificial intelligence. Stanford Digital Economy Lab. Published August.
Brynjolfsson, E., Li, D., & Raymond, L. (2025). Generative ai at work. The Quarterly Journal of Economics, 140 (2), 889–942.
Caunedo, J., Keller, E., & Shin, Y. (2023). Technology and the task content of jobs across the development spectrum. The World Bank Economic Review, 37 (3), 479–493.
Cazzaniga, M., Jaumotte, M. F., Li, L., Melina, M. G., Panton, A. J., Pizzinelli, C., Rockall, E. J., & Tavares, M. M. M. (2024). Gen-ai: Artificial intelligence and the future of work. International Monetary Fund.
Demirci, O., Hannane, J., & Zhu, X. (2025). Who is ai replacing? the impact of generative ai on online freelancing platforms. Management Science.
Eloundou, T., Manning, S., Mishkin, P., & Rock, D. (2023). Gpts are gpts: An early look at the labor market impact potential of large language models.
Engberg, E., G¨org, H., Lodefalk, M., Javed, F., L¨angkvist, M., Monteiro, N., Nord˚as, H., Pulito, G., Schroeder, S., & Tang, A. (2024). Ai unboxed and jobs: A novel measure and firmlevel evidence from three countries (tech. rep. No. 14/24). RF Berlin - CReAM Discussion Paper Series.
Felten, E. W., Raj, M., & Seamans, R. (2021). Occupational, industry, and geographic exposure to artificial intelligence: A novel dataset and its potential uses. Strategic Management Journal, 42, 2195–2217. https://doi.org/10.1002/smj.3286
Frey, C. B., & Osborne, M. A. (2017). The future of employment: How susceptible are jobs to computerisation? Technological Forecasting and Social Change, 114, 254–280. https://doi.org/10.1016/j.techfore.2016.08.019
Gmyrek, P., Berg, J., & Bescond, D. (2023). Generative ai and jobs: A global analysis of potential effects on job quantity and quality. SSRN Electronic Journal. https://doi.org/10.2139/ssrn.4584219
Gmyrek, P., Berg, J., Kami´nski, K., Konopczy´nski, F., Ladna, A., Nafradi, B., Ros laniec, K., & Troszy´nski, M. (2025). Generative ai and jobs: A refined global index of occupational exposure. ILO Working Paper 140.
Gmyrek, P., & Winkler, H. (2026). Technology, expertise and economic development (Working paper) [Forthcoming].
Gmyrek, P., Winkler, H., & Garganta, S. (2024). Buffer or bottleneck? employment exposure to generative ai and the digital divide in latin america. World Bank. https://doi.org/10.1596/1813-9450-10863
Hampole, M., Papanikolaou, D., Schmidt, L. D., & Seegmiller, B. (2025). Artificial intelligence and the labor market (tech. rep.). National Bureau of Economic Research.
Lass´ebie, J., & Quintini, G. (2022). What skills and abilities can automation technologies replicate and what does it mean for workers?: New evidence (tech. rep.). OECD Social, Employment and Migration Working Papers.
Lewandowski, P., Mado´n, K., & Park, A. (2025). Workers’ exposure to ai across development (IBS Working Paper No. 02/2025) (Accessed August 16, 2025). Institute for Structural Research (IBS). https://ibs.org.pl/en/publications/workers-exposure-to-ai-across-development/
Loaiza, I., & Rigobon, R. (2024). The epoch of ai: Human-machine complementarities at work. https://doi.org/10.2139/ssrn.5028371
Noy, S., & Zhang, W. (2023). Experimental evidence on the productivity effects of generative artificial intelligence. Science, 381 (6654), 187–192.
Otis, N., Clarke, R., Delecourt, S., Holtz, D., & Koning, R. (2024). The uneven impact of generative ai on entrepreneurial performance.
Peng, S., Kalliamvakou, E., Cihon, P., & Demirer, M. (2023). The impact of ai on developer productivity: Evidence from github copilot. arXiv preprint arXiv:2302.06590.
Prytkova, E., Petit, F., Li, D., Chaturvedi, S., & Ciarli, T. (2024). The employment impact of emerging digital technologies.
Teutloff, O., Einsiedler, J., K¨assi, O., Braesemann, F., Mishkin, P., & del Rio-Chanona, R. M. (2025). Winners and losers of generative ai: Early evidence of shifts in freelancer demand. Journal of Economic Behavior & Organization, 106845.
Tolan, S., Pesole, A., Mart´ınez-Plumed, F., Fern´andez-Mac´ıas, E., Hern´andez-Orallo, J., & G´omez, E. (2021). Measuring the occupational impact of ai: Tasks, cognitive abilities and ai benchmarks. Journal of Artificial Intelligence Research, 71, 191–236. https://doi.org/10.1613/jair.1.12647
Upwork. (2025, August). The state of ai: Key facts and statistics for 2025 [Accessed: 8/29/2025]. https://www.upwork.com/resources/state-of-ai
Webb, M. (2019). The impact of artificial intelligence on the labor market. https://doi.org/10.2139/ssrn.3482150
Acknowledgements
This study serves as a background paper for the World Development Report 2026: Artificial Intelligence for Development. We want to thank Hector Segura for outstanding research assistance. The authors thank Janine Berg, Caroline Fredrickson, Gaurav Nayyar, Sergei Soares, Sher Verick and Shu Yu for valuable comments and suggestions. The findings, interpretations, and conclusions expressed in this paper are entirely those of the authors. They do not necessarily represent the views of the International Labour Organization and the World Bank and its affiliated organizations, or those of the Executive Directors of the World Bank or the governments they represent.

