


Labour market concentration and wage inequality:
A cross-country descriptive analysis
Abstract
This paper examines the relationship between labour market concentration and wage inequality using global survey data for the period 2006–2022. The results show that higher labour market concentration is associated with higher wage inequality, especially in the top half of the wage distribution. However, labour market institutions such as trade unions, collective bargaining and minimum wages appear to mitigate this trend. Finally, the study finds that the association between labour market concentration and wage inequality is stronger in developing countries than in developed countries.
Keywords: Enterprises; Mergers; Remuneration; Inequality; Developing countries; Collective bargaining; Minimum wage.
Introduction
In its simplest definition, a labour market is considered concentrated when few firms have large market shares. 1 The few large firms operating in the market have significant bargaining power over individuals in the labour market due to the scarcity of outside employment options (Azar et al., 2019). This can lead to a number of distortions, ranging from sub-optimal levels of employment to wages that are kept below productivity. If new firms cannot enter the market, this situation will not be resolved without some form of public intervention. Public interventions to reduce labour market concentration can include measures targeted at firms and measures aimed at correcting market power imbalances between firms and workers, for example through the introduction of a minimum wage or support for collective bargaining.
Consistent with these theoretical predictions, a series of studies have found negative effects of labour market concentration on economic and social outcomes. In particular, studies have found a negative relationship between the degree of labour market concentration and average wages (Amodio et al., forth.; Bassanini et al., 2024; Benmelech et al., 2022; Qiu and Sojourner, 2023; Rinz, 2022). The negative wage effect is particularly large for new hires (Bassanini et al., 2023), for whom there is also a negative effect on employment probability (Marinescu et al., 2021). Similar results are found in studies that have exploited exogenous changes in the degree of labour market concentration, such as those that occur after mergers and acquisitions or after policy reforms (Arnold, 2019; Prager and Schmitt, 2021; Thoresson, 2024). Studies have also found that higher labour market concentration reduces job security (Bassanini et al., 2024) and increases income inequality (Rinz, 2022). Some studies find supportive evidence for the fact that the presence of trade unions mitigates the negative effects of labour market concentration (Benmelech et al., 2022; Qiu and Sojourner, 2023).
The contribution of the present paper is to provide cross-country descriptive evidence on the relationship between labour market concentration and wage inequality for a sample of more than 40 countries, with data between 2006 and 2022. In doing so, the paper aims to make the following contributions to the existing literature.
First, this study examines the relationship between labour market concentration and wages in a cross-country framework that includes developing countries. With the exception of Amodio et al. (forth.), all previous studies have analysed this issue in the context of developed economies, due to the greater availability of good quality data. However, the effect of labour market concentration can be greater in developing countries. This could for instance be due to high informality and lower compliance with the employment protection legislation, which may exacerbate the negative effect of labour market concentration on wages and employment. 2
Second, the paper examines the effect of labour market concentration on wage inequality, while most of the available papers have examined the effect on wages. Indeed, the study of labour market concentration should consider the possibility that labour market concentration has different effects at different points of the wage distribution. For instance, labour market concentration could be relatively beneficial for the wages of managers and executives, while lowering the wages of low-skilled workers. However, the presence of minimum wages, or other wage rigidities at the bottom of the distribution, could also mean that the wages of high-skilled workers are more affected by a reduction in workers’ labour market power.
Third, the paper explores the potential role of labour market institutions in shaping the wage effect of labour market concentration. While some papers have looked at the differential effect in unionized and non-unionized sectors (Benmelech et al., 2022; Qiu and Sojourner, 2023), the present contribution looks more comprehensively at the potential mediating role of (i) trade union density, (ii) collective bargaining coverage, and (iii) minimum wages. While the literature on these labour market institutions has traditionally examined the potential distortions they can create in the market, here the hypothesis is that these institutions can help address inefficiencies arising from firms’ market power.
Methodologically, we follow previous contributions and capture labour market concentration with the Herfindahl–Hirschman Index (HHI), which measures the size of firms in relation to the size of the industry. 3 For each available country, we measure HHI indexes at the sectoral level using the World Bank Enterprise Surveys (WBES). 4 This is a firm-level survey conducted by the World Bank in more than 150 countries. We then match this measure of labour market concentration to a set of wage inequality indicators computed from surveys available from the ILO Microdata collection. Finally, we obtain information on labour market institutions (i.e. trade union density, collective bargaining coverage and the level of the minimum wage) from complementary sources.
Literature review
The effects of labour market concentration
A number of studies have estimated the level of labour market concentration in a particular market and studied the effects of labour market concentration on wages and other working conditions. While the methodological details of these studies differ, most of them use administrative data sources to compute an index of labour market concentration that is specific to (i) a given geographical area, and (ii) a given industry or occupation. The main rationale behind this approach is that jobseekers in a country are not exposed to the same level of labour market concentration, but rather to a specific one that is jointly determined by their location and their occupation and/or industry of employment.
Most of the papers that follow this definition of labour market concentration aim to estimate its effects on wages and other working conditions. The main intuition behind this approach is that higher levels of labour market concentration could lead to lower wages by giving employers more bargaining power. These papers are generally based on extremely rich data with precise information on both the location of individuals and firms and the detailed occupation of employment or sector of activity. Using this information, these papers argue that the observed correlation between the degree of labour market concentration and wages is causal in nature.
Most of these studies measure labour market concentration using the HHI. The HHI is calculated by taking the square of each firm’s market share in the industry and summing the resulting shares over all existing firms. The market share of a given firm is usually computed using information on either its number of employees or the number of job vacancies that the firm is posting. As such, the HHI can range from 0 to 1, with higher values associated with a higher level of labour market concentration. Generally speaking, a labour market is considered highly concentrated if the HHI is above 0.18. 5
One of the first studies of this type is conducted by Azar et al. (2022), who use information on job postings on an employment website to calculate labour market concentration for over 8,000 US labour markets defined as the intersection of commuting zones and six-digit occupations. Based on this definition, they find that most labour markets are highly concentrated. In addition, they find that vacancies advertised in more concentrated labour markets tend to be associated with relatively lower wage offers, a result confirmed in both a standard ordinary least squares (OLS) analysis and in an instrumental variable (IV) approach.
These results are confirmed by a number of studies in the United States (Azar et al. 2019; Azar et al., 2020; Azar et al., 2022). By contrast, the results from Portugal are partly different. Using a methodology similar to Azar et al. (2022), Martins and Melo (2024) confirm the existence of a link between higher labour market concentration and lower wages, but much weaker than in the United States. The author interprets this finding in the light of the potential role of labour market institutions, in particular collective bargaining coverage, in reducing the negative effect of employer market power.
Nevertheless, a number of studies across European countries confirm a negative relationship between firms’ market power and wages (Arquié and Bertin, 2021). In particular, Bassanini et al. (2023) and Marinescu et al. (2021) find that in France there is a negative relationship between concentration and wages, and that this is stronger for new hires compared to incumbents, possibly because the former are more likely to negotiate their wages. Bassanini et al. (2024) also conduct a comparative analysis of labour market concentration in some European countries (Denmark, France, Germany, Italy, Portugal and Spain). They find that, after controlling for product market concentration, the magnitude of the effect of labour market concentration on wages is remarkably similar across countries. They also find that higher labour market concentration reduces job security, although the effect varies across countries. Dodini et al. (2024) demonstrate that workers affected by mass lay-offs in more concentrated labour markets experience lower earnings subsequently compared to those in less concentrated markets. These findings point to the presence of employer market power stemming from the concentration of skill demand among firms.
A few studies directly test for the mediating role of labour market institutions in shaping the relationship between concentration and wages. In the United States, Benmelech et al. (2022) find that labour market concentration reduces the positive relationship between productivity and wages, while the presence of strong trade unions mitigates this effect. Qiu and Sojourner (2023) find that the negative effect of labour market concentration on wages is weaker in labour markets characterized by a relatively high share of trade union coverage. In the United Kingdom, using establishment survey data from the private sector between 1998 and 2018, Abel, Tenreyro and Thwaites (2020) highlight an association between lower levels of pay and higher labour market concentration for workers not covered by a collective bargaining agreement (CBA). However, this negative correlation disappears for those who are covered by a CBA.
Some studies examine the effect of labour market concentration on income inequality. Results in this area are still preliminary. Lipsius (2018) observes that average labour market concentration in the United States has declined over time, and that the negative relationship between labour market concentration and wages has also weakened. This implies that labour market concentration alone cannot explain the observed decline in the labour income share in recent decades. 6 However, Rinz (2022) finds that higher labour market concentration is associated with an increase in income inequality in the United States, suggesting that, while labour market concentration cannot explain the increases in income inequality over time, higher concentration at any point in time is associated with higher income inequality.
To our knowledge, the only available evidence on labour market concentration from outside of developed economies comes from Amodio et al. (forth.). Using data from Peru, they document the existence of a wage premium in the economy. Specifically, individuals earn only 70 cents for every dollar that they produce, meaning that 30 cents go to companies. Moreover, the size of this markdown is larger in markets with higher levels of labour market concentration, consistent with the fact that firms have monopsony power and use it to offer lower wages. Finally, the study also finds that the markdown decreases with the rate of self-employment in the labour market. This could suggest that the possibility of working as a self-employed person reduces the market power of firms vis-à-vis workers.
Quasi-experimental evidence
Another stream of the literature examines the effects of changes in labour market concentration on employment, wages and other working conditions. While the research questions in these papers are often similar to those reviewed above, the main differences relate to (i) the focus on the effects of changes in the level of labour market concentration rather than on the effects of a given level of concentration, and (ii) the presentation and discussion of an explicit identification strategy that exploits changes in policy regulation, or mergers between competing firms in the same industry.
The first group of studies in this area includes papers that have examined the effects of the entry of Walmart retail stores in the United States since the 1970s, as the entry of new and large retail outlets can indeed lead to the exit of smaller outlets and thus increase the degree of concentration in the labour market. The available evidence shows that the entry of Walmart into a given market is associated with a reduction in prices paid by consumers (Hausman and Leibtag, 2007). However, increased competition also causes smaller stores to exit the market (Basker, 2005). As a result, the opening of a Walmart superstore is associated with lower employment levels and lower wages (Dube et al., 2007; Neumark et al., 2008; Wiltshire, 2023), consistent with Walmart exercising monopsony power (Dube et al., 2022).
A more recent wave of studies examines the effects of changes in the degree of labour market concentration in a given labour market. Arnold (2019) examines the effects of mergers and acquisitions on the level of labour market concentration and the employment outcomes of workers. He finds that mergers reduce wages for workers, with the range of individuals affected depending on the size of the merger relative to the overall market.
Prager and Schmitt (2021) look at the effects of mergers involving hospitals, whose employees have more limited outside employment options. The authors find that employees’ wages decrease after a merger. However, the effect is not homogeneous across the population. In particular, unskilled workers see no wage effect from the merger, possibly because the existence of minimum wages prevents downward wage adjustments for this population. Instead, highly skilled workers experience a drop in wages, but only when the merger leads to a large increase in labour market concentration. The authors also find that the effects of the merger are mitigated when there is a high level of unionization or pro-labour regulation.
Finally, Thoresson (2024) looks at the effect of a change in policy regulation that entailed a reduction in the level of labour market concentration in the pharmaceutical industry in Sweden. Wages rose after the reform, in line with the fact that employers lost part of their monopsony power. These positive effects were particularly large for relatively more mobile workers, such as young workers and immigrants.
Data sources, definitions and descriptive statistics
World Bank Enterprise Survey
The WBES is a firm-level survey administered in a large number of countries. The survey is answered by business owners and/or top managers who report information on their firms’ performance, including information on the number of individuals employed in the firm, workers’ compositions, investments, costs of inputs and annual sales.
The WBES are generally conducted in coordination with national authorities and/or with the support of the main employers’ organizations in the country. The survey samples private-sector companies with five or more employees in manufacturing and services sectors (see below for details on the covered industries). The number of observations varies between countries, ranging from around 1,800 respondents at each wave in large economies, to 150 interviews in small countries. The survey uses a stratified random sampling methodology, with strata corresponding to firms’ size (5–19, 20–99 or 100 and above employees), sector of activity (manufacturing, retail and other services) and geographical region (varying across countries), and includes weights to adjust the number of establishments in the sample to the actual population size of the strata.
This study uses the WBES to estimate a measure of labour market concentration for each country and year for which the survey is available. This corresponds to a total number of 305 observations from 153 different countries. The first available surveys are from 2006, while the most recent surveys at the time of the analysis are from 2022.
The main measure of labour market concentration constructed using the WBES is the HHI. This is calculated in three steps. First, for each enterprise in the database, the share of employees in the enterprise relative to the total market is calculated. Second, the squares of these shares are obtained. Finally, the HHI is derived by summing these squared market shares across all firms in the economy. By construction, the HHI can range between 0 and 1, with larger values being associated with higher levels of labour market concentration. For each country and year, the empirical analysis uses measures of the HHI for two broad sectors, namely services, and manufacturing and construction. 7 This is because the level of concentration that is relevant to a particular worker is likely to be that of the sector in which he or she is employed, rather than the economy-wide level of the indicator. 8
Computing the HHI with the WBES raises two additional issues. The first is that without information on the exact location of the enterprise or the specific sector of economic activity, we can only compute an HHI which simply differs between two main sectors. Therefore, in this study, HHIs reflect sectoral employment concentration at the national level. However, not all jobs within a specific sector represent realistic employment options for the individuals. Rather, the measure of concentration we obtain only imperfectly captures the degree of concentration that individuals face, given that they might navigate in a labour market within their geographical area of residence and in a specific sector of economic activity. For these reasons, the literature normally uses much narrower sectoral definitions (for example at the four- or five-digit levels) and overlaps these with exact information on the area of residence (for example ZIP codes in the United States). The second is that the World Bank Survey has a small sample size, while computing the HHI requires large samples. Even under random sampling of firms as well as accurate information on the region of residence and the sector of economic activity, it is likely that HHI calculated in small samples will be measured with error. Previous studies have shown that the resulting HHI will be upward biased (Abel, Tenreyro and Thwaites, 2020). 9
We do not see any immediate solution to these problems, and regard them as the price to pay for conducting a cross-country analysis that spans across a large group of economies over time. This means that the estimates presented below, as clarified later in the text, should not be seen as identifying causal relationships, but, rather, only descriptive trends based on the information provided by the WBES.
Bearing these caveats in mind, the HHI calculated according to the steps outlined above measures concentration in terms of employment levels. An alternative approach would be to measure concentration in terms of how concentrated hiring is in a given labour market. This second approach would have the advantage of capturing more accurately the bargaining power that workers face when they are looking for a job. In the context of the present study, the choice of the HHI definition based on employment headcounts is mainly motivated by data availability considerations.
Looking at the descriptive statistics of the constructed HHI measure, we see that the overall HHI in the sample is 0.023, a rather low level (table 1) compared to the benchmark of 0.18 that defines a highly concentrated labour market. Low levels of concentration may be due to (i) the large country coverage, and (ii) the focus on whole economies. Indeed, higher levels of concentration are likely to be observed in relatively narrow industries and in relatively narrow geographical areas. Looking at differences in the level of labour market concentration across the sample, developing countries appear to have relatively higher levels of labour market concentration. 10 This may in part reflect the focus of the WBES on registered enterprises only. In developing countries, where informal employment is often prevalent, the few registered enterprises appear to represent a relatively high share of the formal labour market. However, the average for developed countries may be estimated with less precision than that for developing countries, since it is based on fewer observations (59 v. 246).
In line with this, the highest levels of HHI are observed in Africa and the Arab States (0.031). All the other regions show comparable levels of concentration, with the average HHIs ranging from 0.018 to 0.023. Looking at the evolution of labour market concentration, it appears that the level of concentration has slightly decreased over the period under consideration. In particular, the average HHI was equal to 0.026 between 2006 and 2010, while it fell to 0.022 between 2011 and 2022. However, it is important to keep in mind that the sample composition of the WBES is not constant over time, so this trend may partly capture differences in the countries covered between these two periods. Finally, the level of labour market concentration is similar across two broad sectors considered in the analysis (HHI equal to 0.024 in the manufacturing and construction sector and 0.023 in the services sector).
Table 1: Descriptive statistics of the HHI
|
|
mean |
SD |
N |
|
Overall |
0.023 |
0.025 |
305 |
|
Income group: Developing countries |
0.025 |
0.027 |
246 |
|
Income group: Developed countries |
0.016 |
0.014 |
59 |
|
Region: Africa and Arab States |
0.031 |
0.025 |
96 |
|
Region: Americas |
0.018 |
0.016 |
58 |
|
Region: Asia and the Pacific |
0.023 |
0.034 |
51 |
|
Region: Europe and Central Asia |
0.020 |
0.023 |
100 |
|
Years: 2006–2010 |
0.026 |
0.028 |
129 |
|
Years: 2011–2022 |
0.022 |
0.022 |
176 |
|
Sector: Manufacturing and construction |
0.024 |
0.031 |
305 |
|
Sector: Services |
0.023 |
0.031 |
270 |
Note: The table reports the mean and standard deviation of the HHI computed for different countries and years using information from the WBES. Developed countries refers to high-income countries according to the World Bank classification. Developing countries refers to low- and middle-income countries.
The number of observations (N) corresponds to the number of WBES surveys used to compute the HHIs and depends on both the number of countries covered by the WBES and the number of years in which surveys were conducted in each country.
Source: Author’s calculations based on data from the WBES.
While the World Bank Enterprise Survey is one of the best available sources of comparable information on enterprises across countries and over time, it still has some limitations. Importantly, it only samples registered enterprises, which may represent a substantial caveat especially in those countries where a large share of enterprises operates informally. 11 Additionally, the survey reports only a rather broad sectoral definition and it does not report the exact firms’ location. Finally, the survey sample size is rather small and this will lead to measurement error when computing the HHI, as also reviewed above.
ILO Microdata collection
Information on wage inequality is obtained from the household surveys included in the ILO Microdata collection. This collection currently contains more than 11,700 surveys from over 160 countries, mainly labour force surveys, and includes variables harmonized by the ILO Department of Statistics.
Labour force surveys are designed with the specific objective of obtaining detailed information on the labour force status of the respondent. For employed persons, labour force surveys generally provide information on the status in employment (i.e. wage employee or self-employed) and labour earnings, as well as other characteristics of the employment relationship.
In the context of the present study, the data from the ILO Microdata repository are primarily used to construct a set of measures of wage inequality. These are constructed based on the variable measuring monthly earnings of wage employees. In particular, for each country and year for which data are available, each decile of the wage distribution is calculated. From this we can derive the ratio between the ninth and the first decile of the wage distribution (D9/D1), the ratio between the ninth and the fifth decile (D9/D5) and the ratio between the fifth and the first decile (D5/D1). These different measures capture different dimensions of inequality. The D9/D1 ratio provides a measure of wage inequality between the two ends of the wage distribution. The D9/D5 ratio instead focuses only on the top half of the wage distribution, while the D5/D1 ratio measures the gap between middle- and low earners. Looking at these different dimensions separately is key, as labour market concentration may have different effects on wages at different points of the wage distribution. Finally, we calculate the Gini and the Theil indexes based on monthly wages. All these measures of wage inequality are computed at the same sectoral level as for the data from the World Bank Enterprise Survey data (services and manufacturing and construction).
Table 2 presents descriptive statistics for these measures of wage inequality, for the sample as a whole and then separately for the same groups presented in table 1. The focus is on those countries and years for which HHI data are also available, as these are the observations on which the empirical analysis will be carried out.
Noticeably, wage inequality appears to be higher in developing countries than in developed countries. From a geographical point of view, wage inequality is higher in Africa and Arab States as well as in the Americas than in other regions. Wage inequality is also slightly higher in the services sector than in manufacturing and construction, possibly reflecting the fact that a larger share of manufacturing jobs is held by people with relatively homogenous levels of education. However, sectoral differences in the level of wage inequality are small.
Table 2: Descriptive statistics on measures of wage inequality
|
|
Gini |
Theil |
D9/D1 |
D9/D5 |
D5/D1 |
|
Overall |
0.307 |
0.185 |
3.971 |
2.002 |
1.955 |
|
Income group: Developing countries |
0.336 |
0.235 |
4.570 |
2.143 |
2.093 |
|
Income group: Developed countries |
0.292 |
0.158 |
3.652 |
1.927 |
1.881 |
|
Region: Africa and Arab States |
0.387 |
0.324 |
5.955 |
2.703 |
2.148 |
|
Region: Americas |
0.349 |
0.229 |
4.081 |
2.507 |
1.628 |
|
Region: Asia and the Pacific |
0.329 |
0.228 |
4.430 |
1.939 |
2.238 |
|
Region: Europe and Central Asia |
0.291 |
0.157 |
3.609 |
1.926 |
1.860 |
|
Years: 2006–2010 |
0.329 |
0.220 |
4.087 |
2.087 |
1.939 |
|
Years: 2011–2022 |
0.300 |
0.174 |
3.935 |
1.975 |
1.959 |
|
Sector: Manufacturing and construction |
0.299 |
0.183 |
5.528 |
1.998 |
2.358 |
|
Sector: Services |
0.317 |
0.203 |
5.530 |
2.095 |
2.155 |
Note: The table reports the mean of different measures of wage inequality for the sample for which data on the HHI is available from the WBES. All measures are obtained using information on monthly earnings of wage employees. See footnote 10 for details on how we create country groups by geographical regions and levels of economic development. Developed countries refer to high-income countries according to the World Bank classification. Developing countries refer to low- and middle-income countries.
Source: Author’s calculations based on data from the ILO Microdata collection.
Additional data sources
Data on trade union density and collective bargaining coverage come from the ILO Industrial Relations database. Trade union density captures the share of dependent employees who are members of a trade union. Data are available between 2000 and 2020 (but with gaps), for a total of 76 countries. Collective bargaining coverage captures instead the share of dependent employees whose employment relation is, at least partially, governed by a CBA. It is particularly relevant in the analysis of wage inequality, as it offers a proxy for the extent to which wages of wage employees are determined by the negotiations between trade unions and employers’ organisations, rather than by bilateral negotiations between individual employers and workers. Even in this case, data are available from 2000 to 2020, but only for 64 countries.
Finally, we also use information on minimum wages, which has been gathered by the ILO and covers a shorter period of time (2008 to 2022). Most countries have full-time series with minimum wage information over this time period. Information on minimum wages refers to the main minimum wage in the country. If other minimum wages exist (for example for certain regions, sectors or groups of workers such as youth), only the main one is taken into account. Countries where there is no statutory minimum wage will not be included in this part of the analysis. We use information on the minimum wage to compute the Kaitz index, which corresponds to the ratio between the minimum wage and the median wage in the country. In comparison to the absolute value of the minimum wage, the Kaitz index is likely to be a better indicator to measure the ability of the minimum wage to reduce inequality, as it reflects the position of the minimum wage in the overall wage distribution of the country. The median Kaitz index in the sample is equal to 0.6.
Methodology
Main specification
The purpose of the analysis is to study the relationship between the level of labour market concentration and different measures of wage inequality. The analysis presents two main specifications. The first model takes the following form:
(1)
Where is the outcome of interest for country i in sector S in year t (for example the Gini index), is the measure of labour market concentration in that same year, sector and country. is a set of variables that aim at controlling for cross-country heterogeneity and time-varying shocks.
Two different specifications are used throughout the analysis for . In the first one, is defined by yearly and country dummies, respectively and , that are interacted ( *). The yearly dummies are meant to control for any time-varying shock that can similarly affect countries in the sample. Country dummies are instead meant to account for any cross-country heterogeneity that is constant within countries over our sample period. The interaction of yearly and country dummies also allows accounting for possible errors in the measurement of inequalities across a country’s labour markets on a specific year. This is the ideal approach, but only a few countries have a large number of observations in our database, with data available across two or more years. This may limit the capacity of the model to efficiently control for cross-country heterogeneity. For this reason, in our second approach, we control for cross-country heterogeneity by including a set of country-level controls that reflects the relative characteristics of each country. As the rather large sample of countries included in the analysis limits the availability of harmonized variables across countries, we choose to control for the countries’ world ranking in terms of population, country size, and GDP levels (all measured in 2021). 12 This allows to account for the fact that the countries included in the analysis are different from each other along a number of dimensions (for example size, level of economic development), that are also likely to have an impact on both wage inequality and labour market concentration. We also interact the country’s ranking in terms of GDP levels with the yearly dummies, to account for the fact that the effect of countries’ economic size might vary over time (for example, as a result of a recession that affects only certain segments of the world economy). 13
To study the mediating role of labour market institutions, we augment the baseline sector-level specification in the following way:
(2)
Where measures one of the three studied labour market institutions (i.e. trade union density, collective bargaining coverage or minimum wages) in country i and year t. The interaction term between the HHI index and the labour market institution captures whether labour market concentration has a differential impact on wage inequality, depending on the magnitude of the considered labour market institution. All models are estimated with OLS with robust standard errors.
Different sources of bias could affect the estimates. In particular, estimates might be biased due to reverse causality. This refers to a situation in which the studied outcome variable affects the regressor of interest, rather than the other way around. This can possibly take place in our context, as wage inequality can also impact the level of labour market concentration. For instance, more unequal countries are more likely to observe the emergence of large companies or business groups headed by few connected individuals, thus increasing the level of labour market concentration. Other potential problems could arise in case of omitted variables or measurement error. For these reasons, we interpret the findings below as descriptive in nature.
Databases matching
Finally, to construct the working database for the empirical analysis, the WBES data and the data from the ILO Microdata collection are matched at the country*year*sector level, using the sectoral aggregation in two main sectors as defined in the previous section (services, and manufacturing and construction).
As the World Bank Enterprise Survey has relatively few observations per country, the final number of observations available for the analysis, when matched with the inequality indicators from the ILO Microdata collection, is limited. This means that most countries appear only once in the sample. Table 3 shows the countries and years for which information on both the HHI and the measures of wage inequality are available. This corresponds to 72 country-year observations.
Table 3: List of countries and years included in the baseline specification
|
Afghanistan |
2014 |
Latvia |
2019 |
|
Austria |
2021 |
Lithuania |
2009 |
|
Bangladesh |
2013 |
Lithuania |
2013 |
|
Belgium |
2020 |
Lithuania |
2019 |
|
Brazil |
2009 |
Luxembourg |
2020 |
|
Bulgaria |
2009 |
Malta |
2019 |
|
Bulgaria |
2013 |
Mauritius |
2009 |
|
Bulgaria |
2019 |
Mongolia |
2009 |
|
Cambodia |
2016 |
Mongolia |
2013 |
|
Chad |
2018 |
Mongolia |
2019 |
|
Croatia |
2013 |
Netherlands |
2020 |
|
Croatia |
2019 |
Pakistan |
2007 |
|
Cyprus |
2019 |
Pakistan |
2013 |
|
Czechia |
2009 |
Philippines |
2015 |
|
Czechia |
2013 |
Poland |
2009 |
|
Czechia |
2019 |
Poland |
2013 |
|
Denmark |
2020 |
Poland |
2019 |
|
Egypt |
2020 |
Portugal |
2019 |
|
Estonia |
2009 |
Romania |
2009 |
|
Estonia |
2013 |
Romania |
2013 |
|
Estonia |
2019 |
Romania |
2019 |
|
Eswatini |
2016 |
Serbia |
2013 |
|
Finland |
2020 |
Serbia |
2019 |
|
France |
2021 |
Slovakia |
2009 |
|
Gambia |
2018 |
Slovakia |
2013 |
|
Germany |
2021 |
Slovakia |
2019 |
|
Greece |
2018 |
Slovenia |
2009 |
|
Hungary |
2009 |
Slovenia |
2013 |
|
Hungary |
2013 |
Slovenia |
2019 |
|
Hungary |
2019 |
Spain |
2021 |
|
Indonesia |
2009 |
Sweden |
2014 |
|
Indonesia |
2015 |
Sweden |
2020 |
|
Ireland |
2020 |
United Republic of Tanzania |
2006 |
|
Italy |
2019 |
Timor-Leste |
2021 |
|
Latvia |
2009 |
Viet Nam |
2009 |
|
Latvia |
2013 |
Viet Nam |
2015 |
Note: The table reports the list of countries and years for which information on both the HHI and the measures of wage inequality is available. This constitutes the main sample over which the analysis is run.
Results
This section presents the main results of the analysis examining the effect of labour market concentration on wage inequality. First, we present the baseline results obtained for the overall sample, with also some robustness tests (first subsection). Second, we explore the potential mediating role played by labour market institutions in shaping the effect of labour market concentration on wage inequality (second subsection). Third, we present heterogeneous analysis by development status (third subsection).
Baseline results
Table 4 presents the baseline results. The specifications presented in each column differ based on whether we control for cross-country heterogeneity using country-level controls (columns (1) to (5)) or by using both country and yearly fixed effects ((6)-(10)). In each case, we present results for five different outcomes. These are the Gini index of income inequality, the Theil index and the ratios between deciles of the wage distribution.
The results show that higher labour market concentration is associated with higher income inequality. Starting from the upper panel and column (1), where the outcome of interest is the Gini index, the results show that the coefficient for HHI is positive and statistically significant. To illustrate its meaning, one can say that a 0.01 increase in HHI is associated with a 0.5 percentage point Gini increase (=0.499 x 0.01). The same pattern is observed when the outcome of interest is the Theil index (column (2)). Similar results are obtained with the D9/D1 ratio (column (3)), although the coefficient loses statistical significance. Looking at differences in the effects of labour market concentration on wage inequality at different points of the wage distribution, some interesting findings emerge. In particular, the overall increase in wage inequality seems to be driven by an increase in inequality at the upper half of the wage distribution (i.e. the coefficient of HHI is positive and significant when the outcome of interest is the D9/D5 ratio, see column (4)). By contrast, no significant association between labour market concentration and wage inequality is found at the bottom half of the wage distribution: the coefficient presented in column (5), when the outcome of interest is the D5/D1 ratio, is very small in magnitude and not significant.
This finding can be rationalized by the fact that higher labour market concentration can generate earnings opportunities for highly skilled individuals, with for instance managers earning higher salaries if their companies control a relatively large share of the market. This will impact the wage distribution relatively more at the top of the wage distribution, compared to any other change it can generate lower down in the distribution. While we cannot rule out alternative mechanisms, this one would be consistent with the results obtained in many previous studies that have shown that managers’ compensation increases with firms’ size (Ali et al., 2015; Kostiuk, 1990). An alternative explanation relates to the potentially asymmetric negative effects of labour market concentration on wages. In particular, the evidence discussed in section 1 has shown that labour market concentration reduces wages, with the negative effects being particularly large on some categories such as labour market entrants. Since these individuals are less likely to be in the upper part of the wage distribution, an increase in labour market concentration will reduce wages of lower-paid individuals relatively more than wages of high-paid individuals, thus contributing to higher inequality on average. Comparing these results with those obtained from specifications with both country and yearly fixed effects (columns (6) to (10)), we note that coefficients are generally of the same sign but become much smaller in magnitude. The estimations also lose precision as we include a large number of dummies.
Table 4: Baseline results of the effects of labour market concentration on wage inequality
Note: The table reports coefficient estimates and robust standard errors for different models that use as the outcome of interest different measures of wage inequality, and where the main regressor of interest is the HHI. The analysis is conducted using sector-level data, see section 3 for details. *,** and *** denote statistical significance at 10%, 5% and 1%, respectively. FEs x FEs indicate that country and year fixed effects are interacted.
Source: Author’s calculations based on data from the ILO Microdata collection and the WBES.
The limited number of observations on which the estimates rely risks limiting the statistical power of the analysis and could explain why only one coefficient is statistically significant in the specification with fixed effects (columns (6)-(10) of table 4). We therefore test the robustness of the results by imputing labour market concentration based on linear interpolation only for those countries that report some years with missing values, but only for those years that lie between years for which information is instead available. This approach is justified by the intuition that labour market concentration, despite being highly heterogeneous across countries and sectors, evolves relatively slowly. 14
We present this exercise only for the specification with country-level data and with country fixed effects, as this is where the need to increase sample size is the largest, as discussed above. Reassuringly, most results are confirmed when using also the imputed values of the HHI (table 5). In particular, all coefficients are positive in sign. Additionally, coefficients are statistically significant for the Gini index and the D9/D5 ratio. Estimates with the imputed values of HHI constitute a useful robustness test, but our preferred model for the rest of the analysis is the one with only non-imputed HHI values, as it is based on fewer assumptions.
Table 5: Baseline results at the country level using also imputed values of HHI
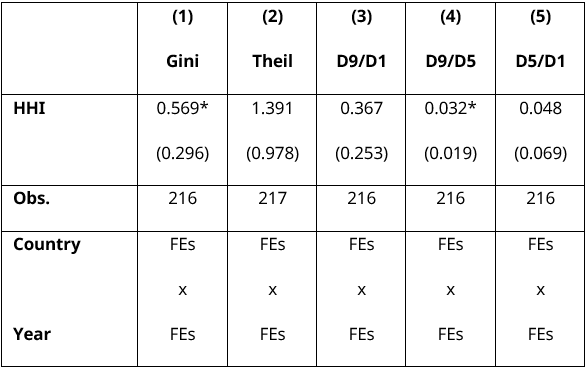
Note: The table reports coefficient estimates and robust standard errors for different models that use as the outcome of interest different measures of wage inequality, and where the main regressor of interest is the HHI. The analysis is conducted using country-level data, see section 3 for details. Compared to the baseline results, the specifications presented in this table also include imputed data points, following the imputation procedure described in the first subsection of section 4 in the paper. *,** and *** denote statistical significance at 10%, 5% and 1%, respectively. FEs x FEs indicate that country and year fixed effects are interacted.
Source: Author’s calculations based on data from the ILO Microdata collection and the WBES.
The role of labour market institutions
The next question we seek to answer is what role labour market institutions can play in reducing this mechanism?
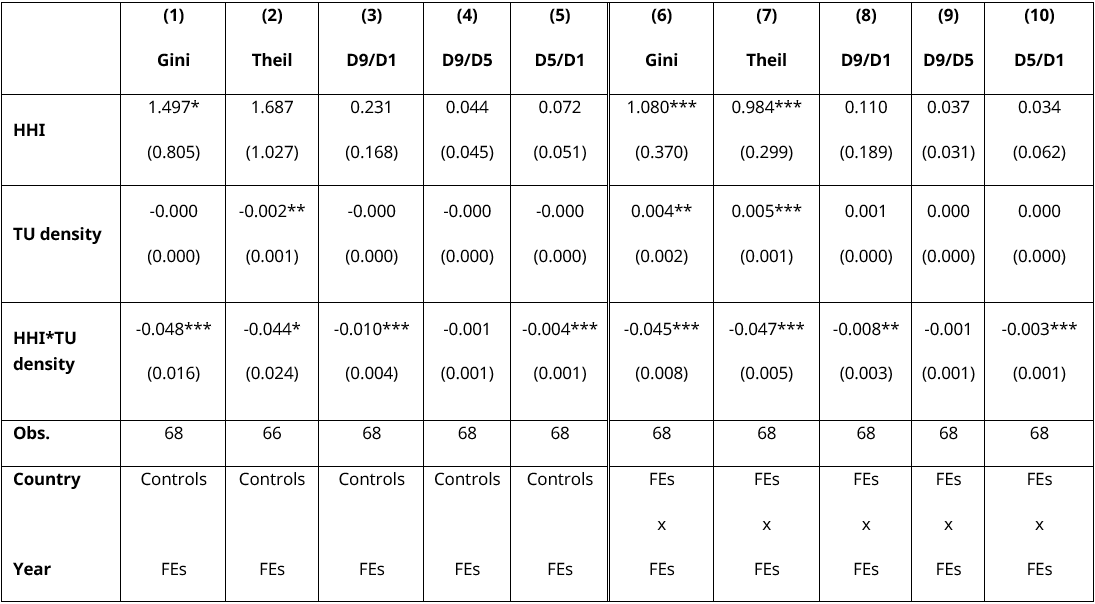
We start by looking at the role of trade union membership (table 6). Following equation (2), we augment the baseline specification by adding the indicator of trade union membership, as well as its interaction with the HHI. This last term measures the differential role that labour market concentration plays in affecting wage inequality, depending on the strength of trade union membership. However, we present all three coefficients in this and the following tables. We note that the coefficient for the interaction term between trade union coverage and the HHI is negative. This suggests that higher trade union coverage mitigates labour market concentration’s contribution to wage inequality. The effect is always statistically significant under both types of approaches (i.e. with country controls or with country fixed effects), with the exception of when the outcome of interest is the D9/D5 ratio. This can be interpreted by the fact that trade union membership is generally higher in sectors and occupations that report on average lower wages (Bureau of Labor Statistics, 2023), and trade unions generally focus their attention relatively more on wages of the low-skilled (ILO, 2022). Instead, the coefficient for the indicator of trade union membership, when examined in isolation (i.e. not interacted with the HHI measure), is always small in magnitude and generally not statistically significant for this sample.
Table 6: The mediating role of trade union membership
Note: The table reports coefficient estimates and robust standard errors for different models that use as the outcome of interest different measures of wage inequality, and where the main regressor of interest is the interaction term between the HHI and the measure of trade union membership. The analysis is conducted using sector-level data, see section 3 for details. *,** and *** denote statistical significance at 10%, 5% and 1%, respectively. FEs x FEs indicate that country and year fixed effects are interacted.
Source: Author’s calculations based on data from the ILO Microdata collection and the WBES.
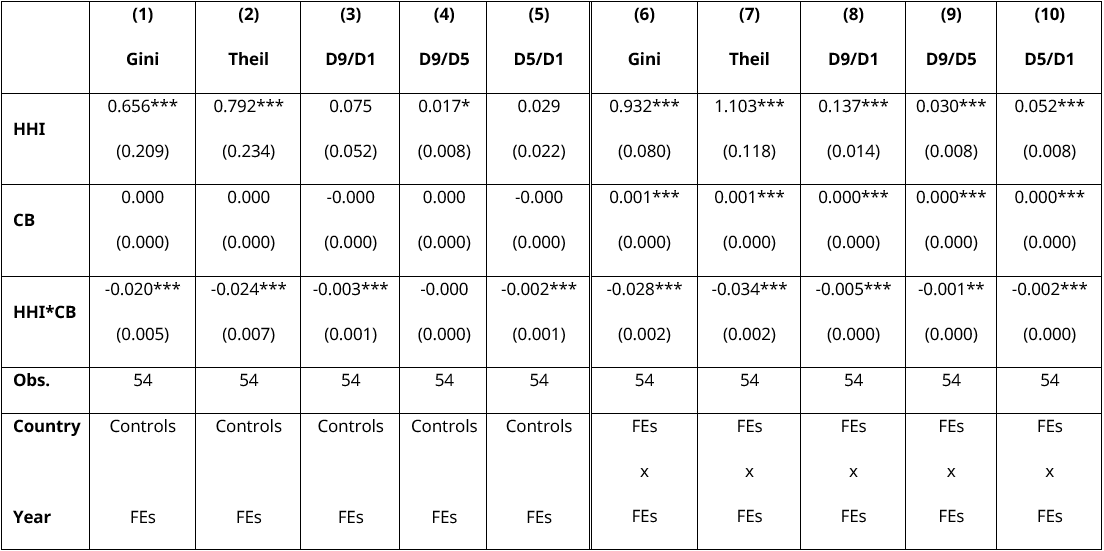
Table 7 presents the results of the same exercise but now using collective bargaining coverage.
The results show that higher collective bargaining coverage mitigates labour market concentration’s contribution to wage inequality. The coefficients of the interaction term between collective bargaining coverage and labour market concentration are always negative, and they are statistically significant in nine out of the ten specifications. Similar to trade union membership, the strongest effects are obtained when the outcomes of interest are (i) the overall measures of wage inequality (i.e. the Gini index, the Theil indicators and the D9/D1 ratio), and (ii) the measure of wage inequality in the bottom half of the wage distribution (i.e. the D5/D1 ratio). The coefficient of the regressor of interest is instead negative, but smaller in magnitude and not always statistically significant, when the outcome of interest is the D9/D5 ratio. This can be explained by the fact that collective bargaining coverage plays a more important role in mitigating wage inequalities at the bottom of the wage distribution. Instead, the coefficients for collective bargaining coverage (i.e. when considered in isolation, rather than interacted with HHI) are very small in magnitude.
Table 7: The mediating role of collective bargaining
Note: The table reports coefficient estimates and robust standard errors for different models that use as the outcome of interest different measures of wage inequality, and where the main regressor of interest is the interaction term between the HHI and the measure of collective bargaining coverage (CB). The analysis is conducted using sector-level data, see section 3 for details. *,** and *** denote statistical significance at 10%, 5% and 1%, respectively. FEs x FEs indicate that country and year fixed effects are interacted.
Source: Author’s calculations based on data from the ILO Microdata collection and the WBES.
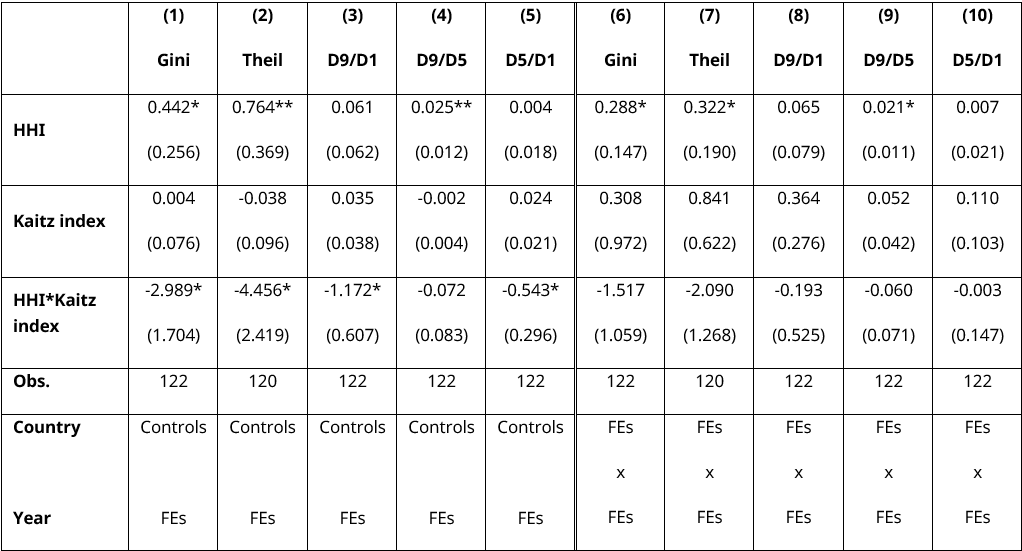
Finally, we look at the effects of minimum wages on the relationship between labour market concentration and wage inequality.
Also in this case, we note that the sign of the interaction term is negative in all specifications (table 8). This suggests that higher minimum wages, relative to the median wages, can mitigate labour market concentration’s effect on wage inequality. In the specifications without country fixed effects, results are statistically significant when the outcomes of interest are the Gini index as well as the Theil indicator and the D9/D1 and D5/D1 ratios (but not the D9/D5 ratio). This means that minimum wages attenuate the increase in wage inequalities generated by higher labour market concentration, mostly by reducing wage inequalities in the bottom half of the wage distribution. This is intuitive, given that minimum wages will have direct and immediate effects on wages in the bottom of the wage distribution.
However, estimates are no longer statistically significant when including the country fixed effects (columns (6)-(10)), even though their signs are consistent with those obtained with country-level controls. Also, the coefficients for the Kaitz index, considered in isolation rather than interacted with the HHI measure, are not statistically significant across specifications.
Table 8: The mediating role of minimum wages
Note: The table reports coefficient estimates and robust standard errors for different models that use as the outcome of interest different measures of wage inequality, and where the main regressor of interest is the interaction term between the HHI and the Kaitz index. The analysis is conducted using sector-level data, see section 3 for details. *,** and *** denote statistical significance at 10%, 5% and 1%, respectively. FEs x FEs indicate that country and year fixed effects are interacted.
Source: Author’s calculations based on data from the ILO Microdata collection and the WBES.
Heterogeneous analysis across countries
Finally, we draw a comparison of the effects of labour market concentration on wage inequality according to countries’ level of economic development.
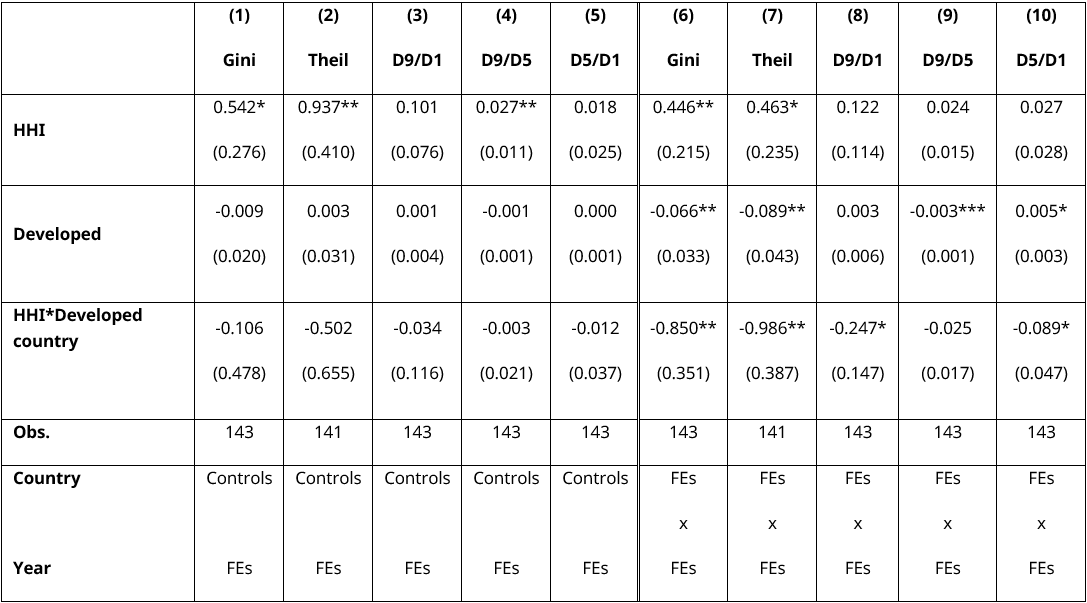
Similar to the analysis for labour market institutions, the analysis here is conducted by extending the baseline equation with an interaction term between the HHI level and a dummy equal to one if the country belongs to the group of developed countries (defined as high-income country in the World Bank classification).
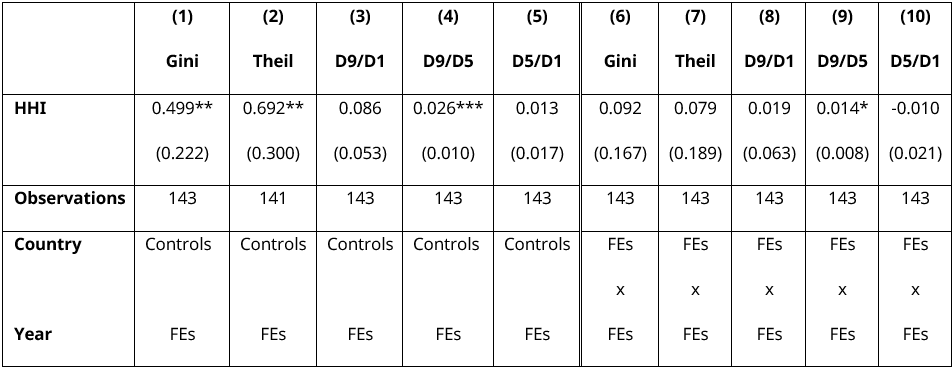
The results suggest that labour market concentration increases wage inequality relatively more in developing countries than in developed countries (table 9). In particular, the coefficient of the interaction term between the HHI and the high-income countries dummy is negative in all the specifications. The coefficients of the interaction term also become statistically significant in four out of the five specifications that include country fixed effects (columns (6), (7), (8), (10)). Hence, it appears that the positive effect of labour market concentration on wage inequality documented in the baseline results presented in table 4 above materializes mainly in the developing countries in the sample. This can be seen by looking at the coefficients of the HHI indicator (i.e. HHI, not interacted), which captures the effect of HHI on wage inequality when the developed country dummy is equal to zero (i.e. among developing countries). This coefficient is always positive and generally statistically significant. The effect of HHI on wage inequality in developed countries can instead be obtained by summing the HHI coefficient with the one of the interaction term between HHI and the developed country dummy. In many specifications, this sum is either close to zero or not statistically significant.
Annex table A1 replicates this part of the analysis, but substituting the developed country dummy with the logarithm of the country’s per capita GDP (measured in 2021). The results of the analysis are very similar, as they show a negative interaction between the HHI and the logarithm of per capita GDP, indicating that the effect of labour market concentration on wage inequality is lower in relatively richer countries.
Table 9: Differences in treatments effects by development status
Note: The table reports coefficient estimates and robust standard errors for different models that use as the outcome of interest different measures of wage inequality, and where the main regressor of interest is the interaction term between the HHI and the dummy equal to one if the country is a developed economy (rather than a developing one). The analysis is conducted using sector-level data, see section 3 for details. Developed countries refers to high-income countries according to the World Bank classification. Developing countries refers to low- and middle-income countries. *,** and *** denote statistical significance at 10%, 5% and 1%, respectively. FEs x FEs indicate that country and year fixed effects are interacted.
Source: Author’s calculations based on data from the ILO Microdata collection and the WBES.
Conclusion
By creating asymmetries in bargaining power between workers and employers, a concentrated labour market can contribute to lower employment and wages. While the academic debate has long neglected the causes and consequences of labour market concentration, a new wave of studies has begun to shed light on the issue in the last decade. These studies have confirmed many of the theoretical predictions. In particular, studies have shown that higher levels of labour market concentration depress wages, especially for certain groups of workers. In addition, there is evidence that some labour market institutions, and in particular trade unions, can mitigate the negative relationship between labour market concentration and wages.
In this context, the contribution of the present study is threefold. First, we focus on the effects of labour market concentration on wage inequality, rather than wages as in most previous studies. Additionally, we include developing countries within the scope of the study, while most previous papers have focused on developed economies only. Finally, along with trade unions, we look at the mediating role played by collective bargaining coverage and minimum wages.
The results that we obtain have important policy implications. The first one is to call for the inclusion of the effects of labour market concentration on wage inequality as part of the welfare analysis when thinking about labour market concentration and its consequences. Second, the findings also confirm that labour market institutions can play an important role in addressing inequalities, including those arising from higher labour market concentration. Third, the analysis shows that policymakers from both developed and developing countries should pay attention to labour market concentration. While the debate so far has been mostly restricted to developed economies, the results indicate that the effects of labour market concentration can be larger in developing countries.
Annex
Table A1: Differences in treatments effects by level of GDP per capita
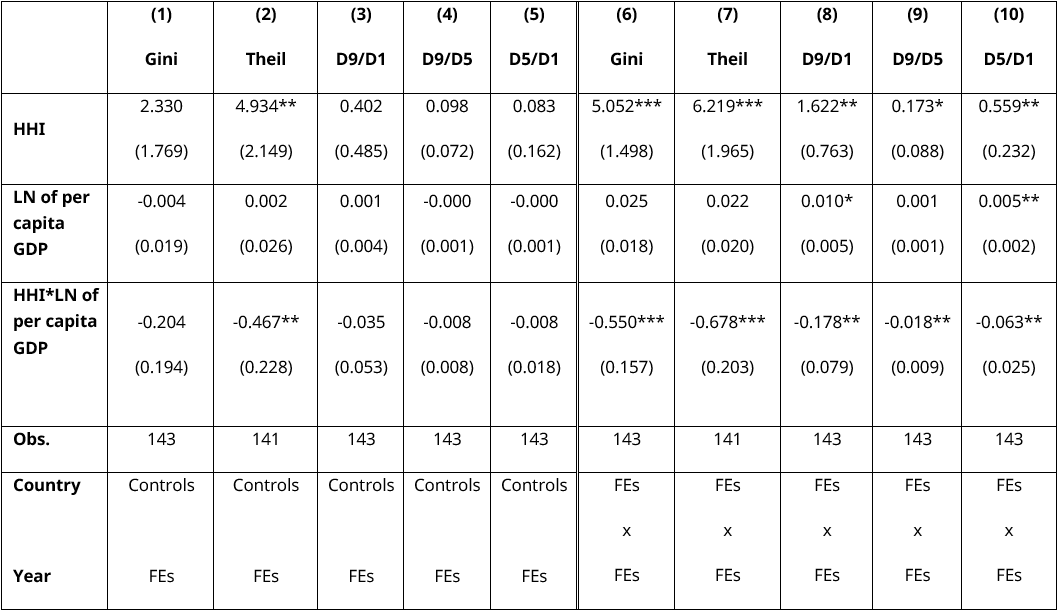
Note: The table reports coefficient estimates and robust standard errors for different models that use as the outcome of interest different measures of wage inequality, and where the main regressor of interest is the interaction term between the HHI and the logarithm of the country’s GDP per capita (measured in 2021). The analysis is conducted using sector-level data, see section 3 for details. *,** and *** denote statistical significance at 10%, 5% and 1%, respectively. FEs x FEs indicate that country and year fixed effects are interacted.
Source: Author’s calculations based on data from the ILO Microdata collection and the WBES.
References
Abel, Will, Silvana Tenreyro, and Gregory Thwaites. 2020. The Balance of Power: Monopsony, Unions and Wages in the United Kingdom. Discussion Paper.
Aga, Gemechu, Francisco Campos, Adriana Conconi, Elwyn Davies, and Carolin Geginat. 2021. Are Firm Capabilities Holding Back Firms in Mozambique? World Bank, Washington, DC. https://doi.org/10.1596/1813-9450-9724
Ali, Usman, Muhammad Noor, Muhammad Kashif Khurshid, and Akhtar Mahmood. 2015. “Impact of Firm Size on Earnings Management: A Study of Textile Sector of Pakistan”. European Journal of Business and Management 7 (28).
Amodio, Francesco, Pamela Medina, and Monica Morlacco, (forth.). “Labor market power, self-employment and development”. forthcoming in the American Economic Review.
Amin, Mohammad. 2021. Does Competition from Informal Firms Impact R&D by Formal Smes? Evidence Using Firm-Level Survey Data. World Bank, Washington, DC. https://doi.org/10.1596/1813-9450-9868
Arnold, David. 2019. “Mergers and Acquisitions, Local Labor Market Concentration, and Worker Outcomes”. Available at SSRN: https://papers.ssrn.com/sol3/papers.cfm?abstract_id=3476369
Arquié, Axelle, and Julia Bertin. 2021. « La concentration des emplois, une source négligée de disparités territoriales et d’inégalités salariale », La lettre du CEPII No. 419. Paris: Centre d’Etudes Prospectives et d’Informations Internationales.
Azar, José, Ioana Marinescu, and Marshall Steinbaum. 2019. “Measuring Labor Market Power Two Ways." AEA Papers and Proceedings, 109: 317-21.
Azar, José, Ioana Marinescu, and Marshall Steinbaum. 2022. “Labor Market Concentration," Journal of Human Resources, 57$(S): 167–199.
Azar, José, Marinescu, Ioana, Steinbaum, Marshall and Taska, Bledi. 2020. “Concentration in US labor markets: Evidence from online vacancy data”. Labour Economics 66 (C), number S0927537120300907.
Basker, Emek. 2005. “Job Creation or Destruction? Labor Market Effects of Wal-Mart Expansion”. The Review of Economics and Statistics, 87 (1): 174-183.
Bassanini, Andrea, Giulia Bovini, Eve Caroli, Jorge Casanova Ferrando, Federico Cingano, Paolo Falco, Florentino Felgueroso, Marcel Jansen, Pedro S. Martins, António Melo, Michael Oberfichtner, and Martin Popp. 2024.“Labor Market Concentration, Wages and Job Security in Europe.” In: Journal of Human Resources, Online First.
Bassanini, Andrea, Cyprien Batut, and Eve Caroli. 2023. “Labor Market Concentration and Wages: Incumbents versus New Hires”. Labour Economics 81 (C), article 102338.
Benmelech, Efraim, Nittai K. Bergman, and Hyunseob Kim. 2022. “Strong Employers and Weak Employees: How Does Employer Concentration Affect Wages?” Journal of Human Resources, 57 (S): 200–250.
Cortes, Guido Matias, and Jeanne Tschopp. 2024. ‘Rising Concentration and Wage Inequality’. The Scandinavian Journal of Economics 126 (2): 320–54. https://doi.org/10.1111/sjoe.12547
Dodini, Samuel, Michael Lovenheim, Kjell Salvanes, and Alexander Willén. 2024. ‘Monopsony, Job Tasks and Labour Market Concentration’. The economic Journal 134 (661): 1914-49. https://doi.org/10.1093/ej/ueae002
Dube, Arindrajit, T. William Lester, and Barry Eidlin. 2007. “Firm Entry and Wages: Impact of Wal-Mart Growth on Earnings Throughout the Retail Sector” Institute for Research on Labor and Employment Working Paper Series No. qt22s5k4pv. UC Berkeley: Institute of Industrial Relations.
Dube, Arindrajit, Suresh Naidu, and Adam D. Reich. 2022. “Power and Dignity in the Low-Wage Labor Market: Theory and Evidence from Wal-Mart Workers”. NBER Working Papers No. 30441. Cambridge, MA: National Bureau of Economic Research.
Ernst, Ekkehard, and Jorge Dávalos. 2021. “How Has Labour Market Power Evolved? Comparing Labour Market Monopsony in Peru and the United States”. SSRN Electronic Journal. https://doi.org/10.2139/ssrn.3813903
Hausman, Jerry and Ephraim Leibtag. 2005. “Consumer Benefits from Increased Competition in Shopping Outlets: Measuring the Effect of Wal-Mart”, NBER Working Papers No. 11809. Cambridge, MA: National Bureau of Economic Research.
ILO. 2020. Global Wage Report 2020–21: Wages and minimum wages in the time of COVID-19. Geneva: International Labour Office.
———2022. Social Dialogue Report 2022: Collective bargaining for an inclusive, sustainable and resilient recovery. Geneva: International Labour Office.
Kostiuk, Peter F. 1990. “Firm Size and Executive Compensation”. The Journal of Human Resources 25(1): 90–105. https://doi.org/10.2307/145728
Lipsius, Ben. 2018. “Labor Market Concentration does not Explain the Falling Labor Share”. Available at SSRN: https://papers.ssrn.com/sol3/papers.cfm?abstract_id=3279007
Marinescu, Ioana, Ivan Ouss, and Louis-Daniel Pape. 2021. “Wages, hires, and labor market concentration," Journal of Economic Behavior & Organization 184 (C): 506–605.
Martins, Pedro S. and António Melo. 2024. “Making Their Own Weather? Estimating Employer Labour-Market Power and Its Wage Effects.” In: Journal of Urban Economics 139, No. 103614.
Neumark, David, Junfu Zhang, and Stephen Ciccarella. 2008. “The effects of Wal-Mart on local labor markets”, Journal of Urban Economics, 63 (2): 405–430.
Prager, Elena, and Matt Schmitt. 2021. “Employer Consolidation and Wages: Evidence from Hospitals”. American Economic Review 111 (2): 397–427.
Qiu, Yue, and Aaron Sojourner. 2023. “Labor-Market Concentration and Labor Compensation”. ILR Review 76 (3): 475–503.
Rinz, Kevin. 2022. “Labor Market Concentration, Earnings, and Inequality”. Journal of Human Resources 57 (S): 251–283.
Thoresson, Anna. 2024. “Employer Concentration and Wages for Specialized Workers”, AMERICAN ECONOMIC JOURNAL: APPLIED ECONOMICS 16 (1): 447–79.
Wiltshire, Justin C. 2023. “Walmart Supercenters and Monopsony Power: How a Large, Low-Wage Employer Impacts Local Labor Markets”. Mimeo. Available at https://static1.squarespace.com/static/5e0fdcef27e0945c43fab131/t/658e09c4c7f8563efb2a60fe/1703807458668/JustinCWiltshire_JMP.pdf
Acknowledgements
The authors would like to thank the participants of the ILO Research Department’s Technical Issues Discussion for their valuable comments and suggestions. They are also grateful to colleagues from the ILO Department of Statistics for their support in the calculation of the inequality indicators used in this paper. The authors further thank all reviewers of the working paper for their helpful comments and feedback. Any remaining errors are the sole responsibility of the authors.

