Global Wage Report 2022–23
The impact of inflation and COVID-19 on wages and purchasing power
3. Wage trends in the context of the COVID-19 crisis and rising price inflation
While previous editions of the Global Wage Report focused on presenting annual wage trends, this year’s edition provides, in addition, an analysis of wage and employment trends based on quarterly survey data that cover a period from before the COVID-19 pandemic up to the most recent dates available. In a context of rapid change, quarterly data can offer a more detailed picture of the evolution of wages and employment, also revealing how the current inflation crisis has impacted on wage growth in the first half of 2022. The use of quarterly survey data, moreover, helps in identifying the factors behind the wage trends observed for women and men and for different groups of wage employees.
.3.1. Global wage trends
This report’s detailed analysis of wage trends begins with gross monthly average wages, which consider the monthly average earnings obtained by a wage employee from his or her main job over a given calendar year.1 According to ILO estimates, although the COVID-19 crisis destroyed many wage and salaried jobs during the first full year of the pandemic, with global wage employment dropping from 1.75 billion in 2019 to 1.69 billion in 2020, the number of wage and salaried workers had almost recovered to pre-pandemic levels by the end of 2021, reaching 1.74 billion, or 53 per cent of global employment. The remaining 47 per cent are employers, own-account workers (that is, independent workers without employees) and contributing family workers, many of whom operate in the informal economy.2 Applying a longer-term perspective, ILO estimates indicate that wage and salaried employment rose by 36 per cent between 2005 and 2021, compared with a 16 per cent increase in total global employment over the same period (ILO 2022b). The increase in wage employment, which was especially pronounced in low- and middle-income countries, shows that this form of employment continues to gain ground and is becoming an increasingly important factor in shaping households’ income and, therefore, income inequality. It is for this reason that the regular and rigorous analysis of global and regional wage trends should be considered a key empirical tool by policymakers around the world.
Global monthly wages fell in real terms to –0.9 per cent in the first half of 2022 – the first negative global wage growth recorded since the first edition of the Global Wage Report in 2008.
Figure 3.1 below displays annual average global real wage growth from 2006 to mid-2022. The striking fall in real wages in the last year of the series (2022) is mainly due to the increase in inflation that start- ed in 2021 and has continued during 2022. The re- port estimates that global monthly wages fell in real terms to –0.9 per cent in the first half of 2022 – the first negative global wage growth recorded since the first edition of the Global Wage Report in 2008. If China, where wage growth is typically higher than the global average, is excluded from the computa- tions, global real wage growth during the first half of 2022 is estimated to fall to –1.4 per cent. In view of these developments, a cost-of-living crisis could well dominate wage trends until the end of 2023, as will be examined in detail in subsequent sections.
A cost-of-living crisis could well dominate wage trends until the end of 2023.
Another significant finding shown in figure 3.1 is that global wage growth slowed down from 2.0 per cent in 2019 to 1.5 per cent in 2020, the first year of the pandemic. This decrease, which seems surprisingly modest, may be explained by the restrictions implemented in 2020 to contain the coronavirus, which led to a reduction in the number of hours worked and to frozen or reduced nominal wages in many places. However, the pandemic’s relatively limited impact on average wages – and indeed the fact that global wage growth was positive at all in 2020 – may largely be ascribed to a change in the composition of employment, particularly in some big countries. As already pointed out in the last edition of the Global Wage Report (ILO 2020a), in many countries a large proportion of wage employees who lost their jobs (and hence their earnings), particularly at the onset of the crisis, were low-paid wage employees, whereas their higher- paid counterparts remained employed. This change in the composition of employment increased the estimated average wage through a “composition effect”. Box 3.1 provides a detailed explanation of this effect, illustrating the phenomenon with quarterly data from a variety of countries.
The pandemic’s relatively limited impact on average wages was largely a result of changes in the composition of employment.
In 2021, global wage growth rebounded and was estimated at 1.8 per cent, which is quite close to the estimate for 2019, the year immediately before the pandemic. However, when China is excluded from the global computation, real wage growth in 2021 was estimated at 0.9 per cent, that is, 0.5 per- centage points less than in 2019. This comparative- ly lower growth rate may to some extent reflect the fact that during 2021 the average number of hours worked by employees had not yet fully recovered to pre-pandemic levels (ILO 2022a).3 In addition, though, the lower rate in 2021 is also likely to be a consequence of inflation having already started to erode real wage growth during that year. This trend has gained momentum since then, causing global real wage growth to plummet into negative num- bers in 2022, as previously discussed.
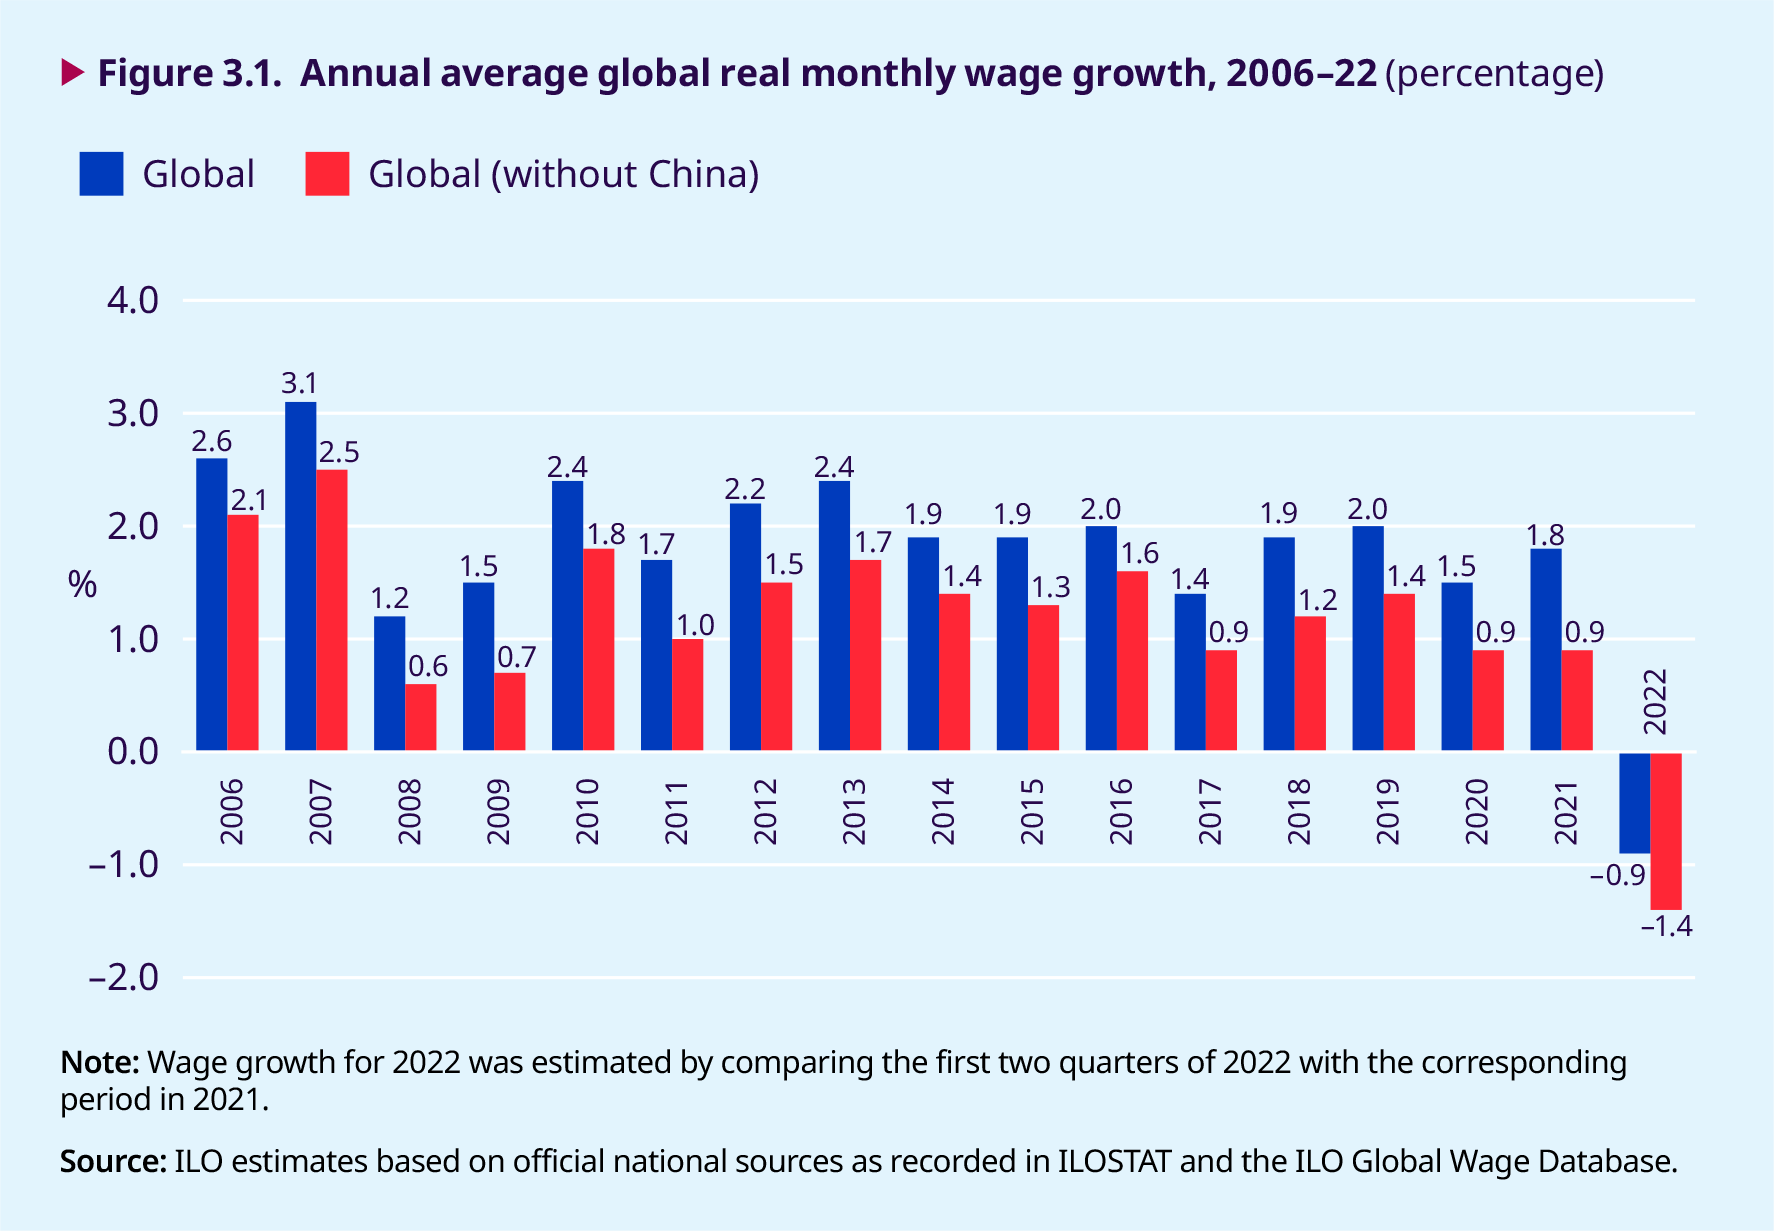
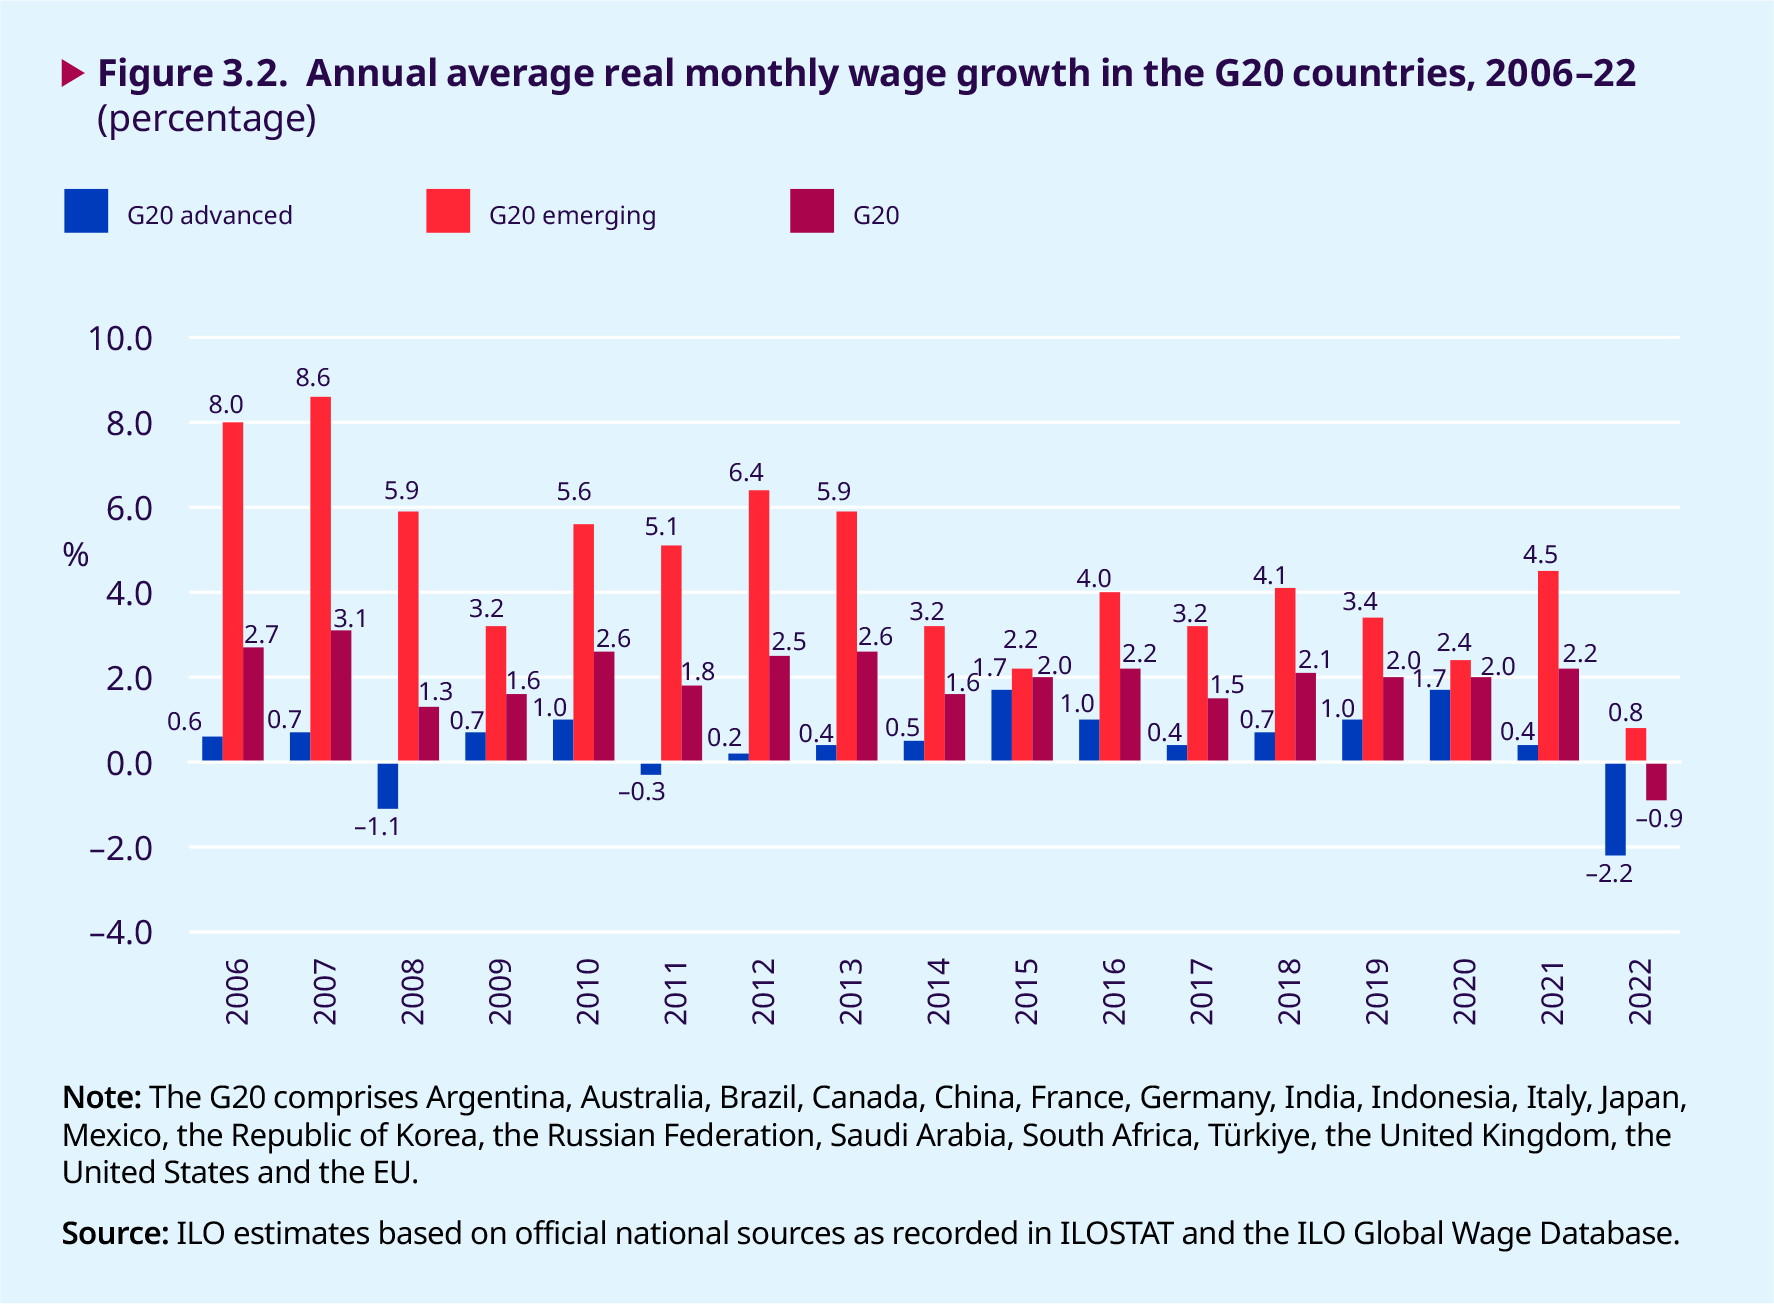
Figure 3.2 presents estimates similar to those in figure 3.1 but for the G20 economies, distinguishing between advanced and emerging economies in that group. For the years before the COVID-19 pandemic, estimates of wage growth in the G20 countries are very similar to the global estimates in figure 3.1, which is not surprising since, taken together, these countries account for some 60 per cent of the world’s wage employees and produce about three quarters of global GDP. Likewise, for 2021 and 2022, the global estimates in figure 3.1 and those for the G20 countries in figure 3.2 display strong similarities. However, it is worth noting that although inflation impacted on real wage growth in both advanced and emerging economies, the growth rate in the first half of 2022 remained positive in emerging economies but became negative in advanced ones. This is consistent with the fact that inflation in the first half of 2022 was rising proportionately faster in high-income countries than in low- and middle- income countries (see figure 2.3 in Chapter 2).
The year 2020 stands out as anomalous in figure 3.2. In the advanced G20 economies, wage growth reached 1.7 per cent in 2020, which represents an increase of 0.7 percentage points from the last pre-pandemic year (2019) and the highest wage growth recorded in several years. This increase in average wages points to the interaction of the employment composition effect (explained and illustrated in box 3.1) in some of the large advanced G20 economies with the way in which fiscal stimulus policies helped to preserve employment and wages in some of the other advanced G20 economies. As discussed in more detail later on, while a strong composition effect was noticeable in countries such as the United States and Canada (where employment fell dramatically in 2020 and average wages jumped by about 4 per cent and 6 per cent, respectively), wages in certain other countries
Box 3.1. The effect of employment composition on wages
Wage statistics, such as the mean or median wage reported by national statistical offices, provide a summary measure of the wage distribution. These summary measures “hide” information that underlies and determines wages at different points of the distribution, such as the number of hours worked per wage employee, wage differentials between employees due to differences in their characteristics and those of their workplace (for example, regional differences), and the wage differential between top and bottom wage earners in the population.
As long as the underlying characteristics of wage employees remain stable over time, wage statistics will also remain stable, changing smoothly at regular intervals to reflect nominal increases (or real ones if a nominal increase is greater than an increase in the general price level). In the long run, changes in the relative value of wages across the wage distribution can also shape trends in wage statistics to reveal structural changes. For example, a gradual but permanent decline in union membership in the United States in the 1980s seems to be behind the increase in the spread of the wage distribution and the consequent increase in wage inequality in the early 1990s (DiNardo, Fortin and Lemieux 1996).
During labour market shocks, the rapid destruction of employment, together with a reduction of hours worked, can distort the composition of wage employees in that such shocks have a greater effect on specific sectors or occupations and among wage employees with specific characteristics. This was the case in the COVID-19 crisis, where low-paid jobs, especially those requiring physical presence in a workplace, were the first to be destroyed, especially in countries where job retention schemes were not implemented to any significant extent. When labour market shocks destroy low-paid jobs on a massive scale, estimates of the mean and median wage can increase significantly compared with earlier periods. This is because such estimates take into account only those higher-paid employees who remain in paid wage employment during the crisis. This skewing of wage statistics owing to the selective nature of job destruction during a crisis is what is referred to as a “composition effect”.
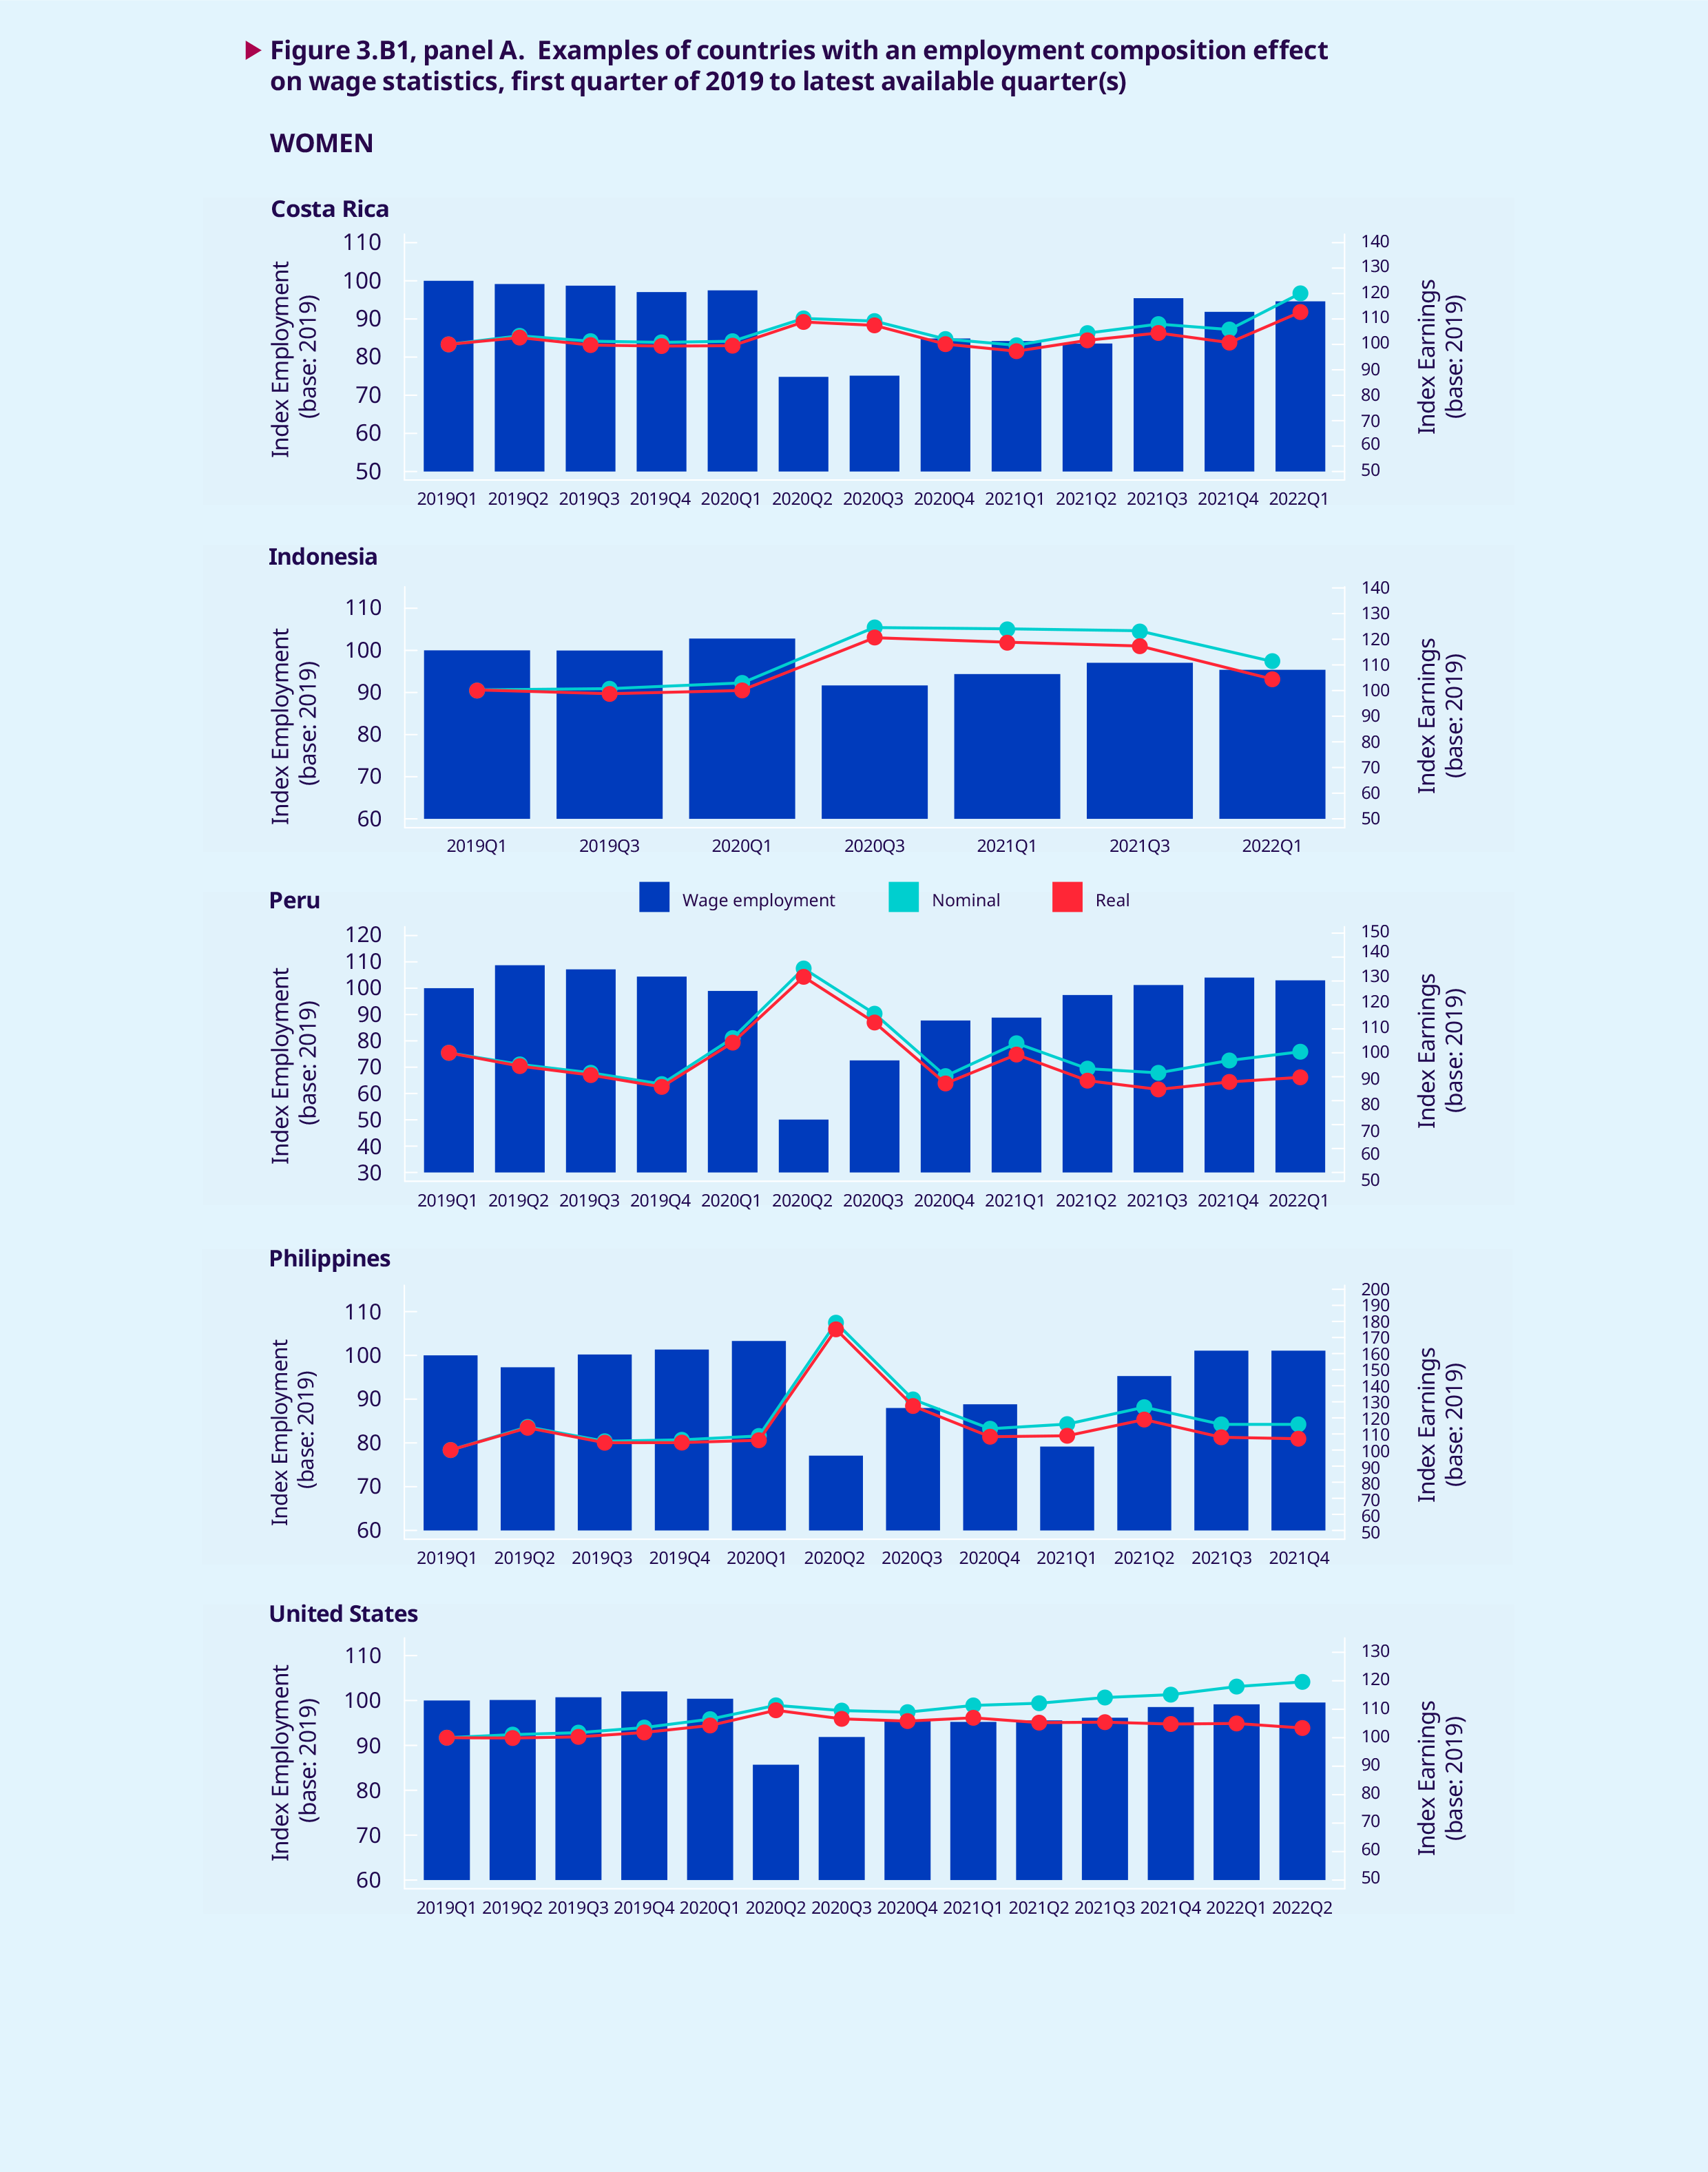
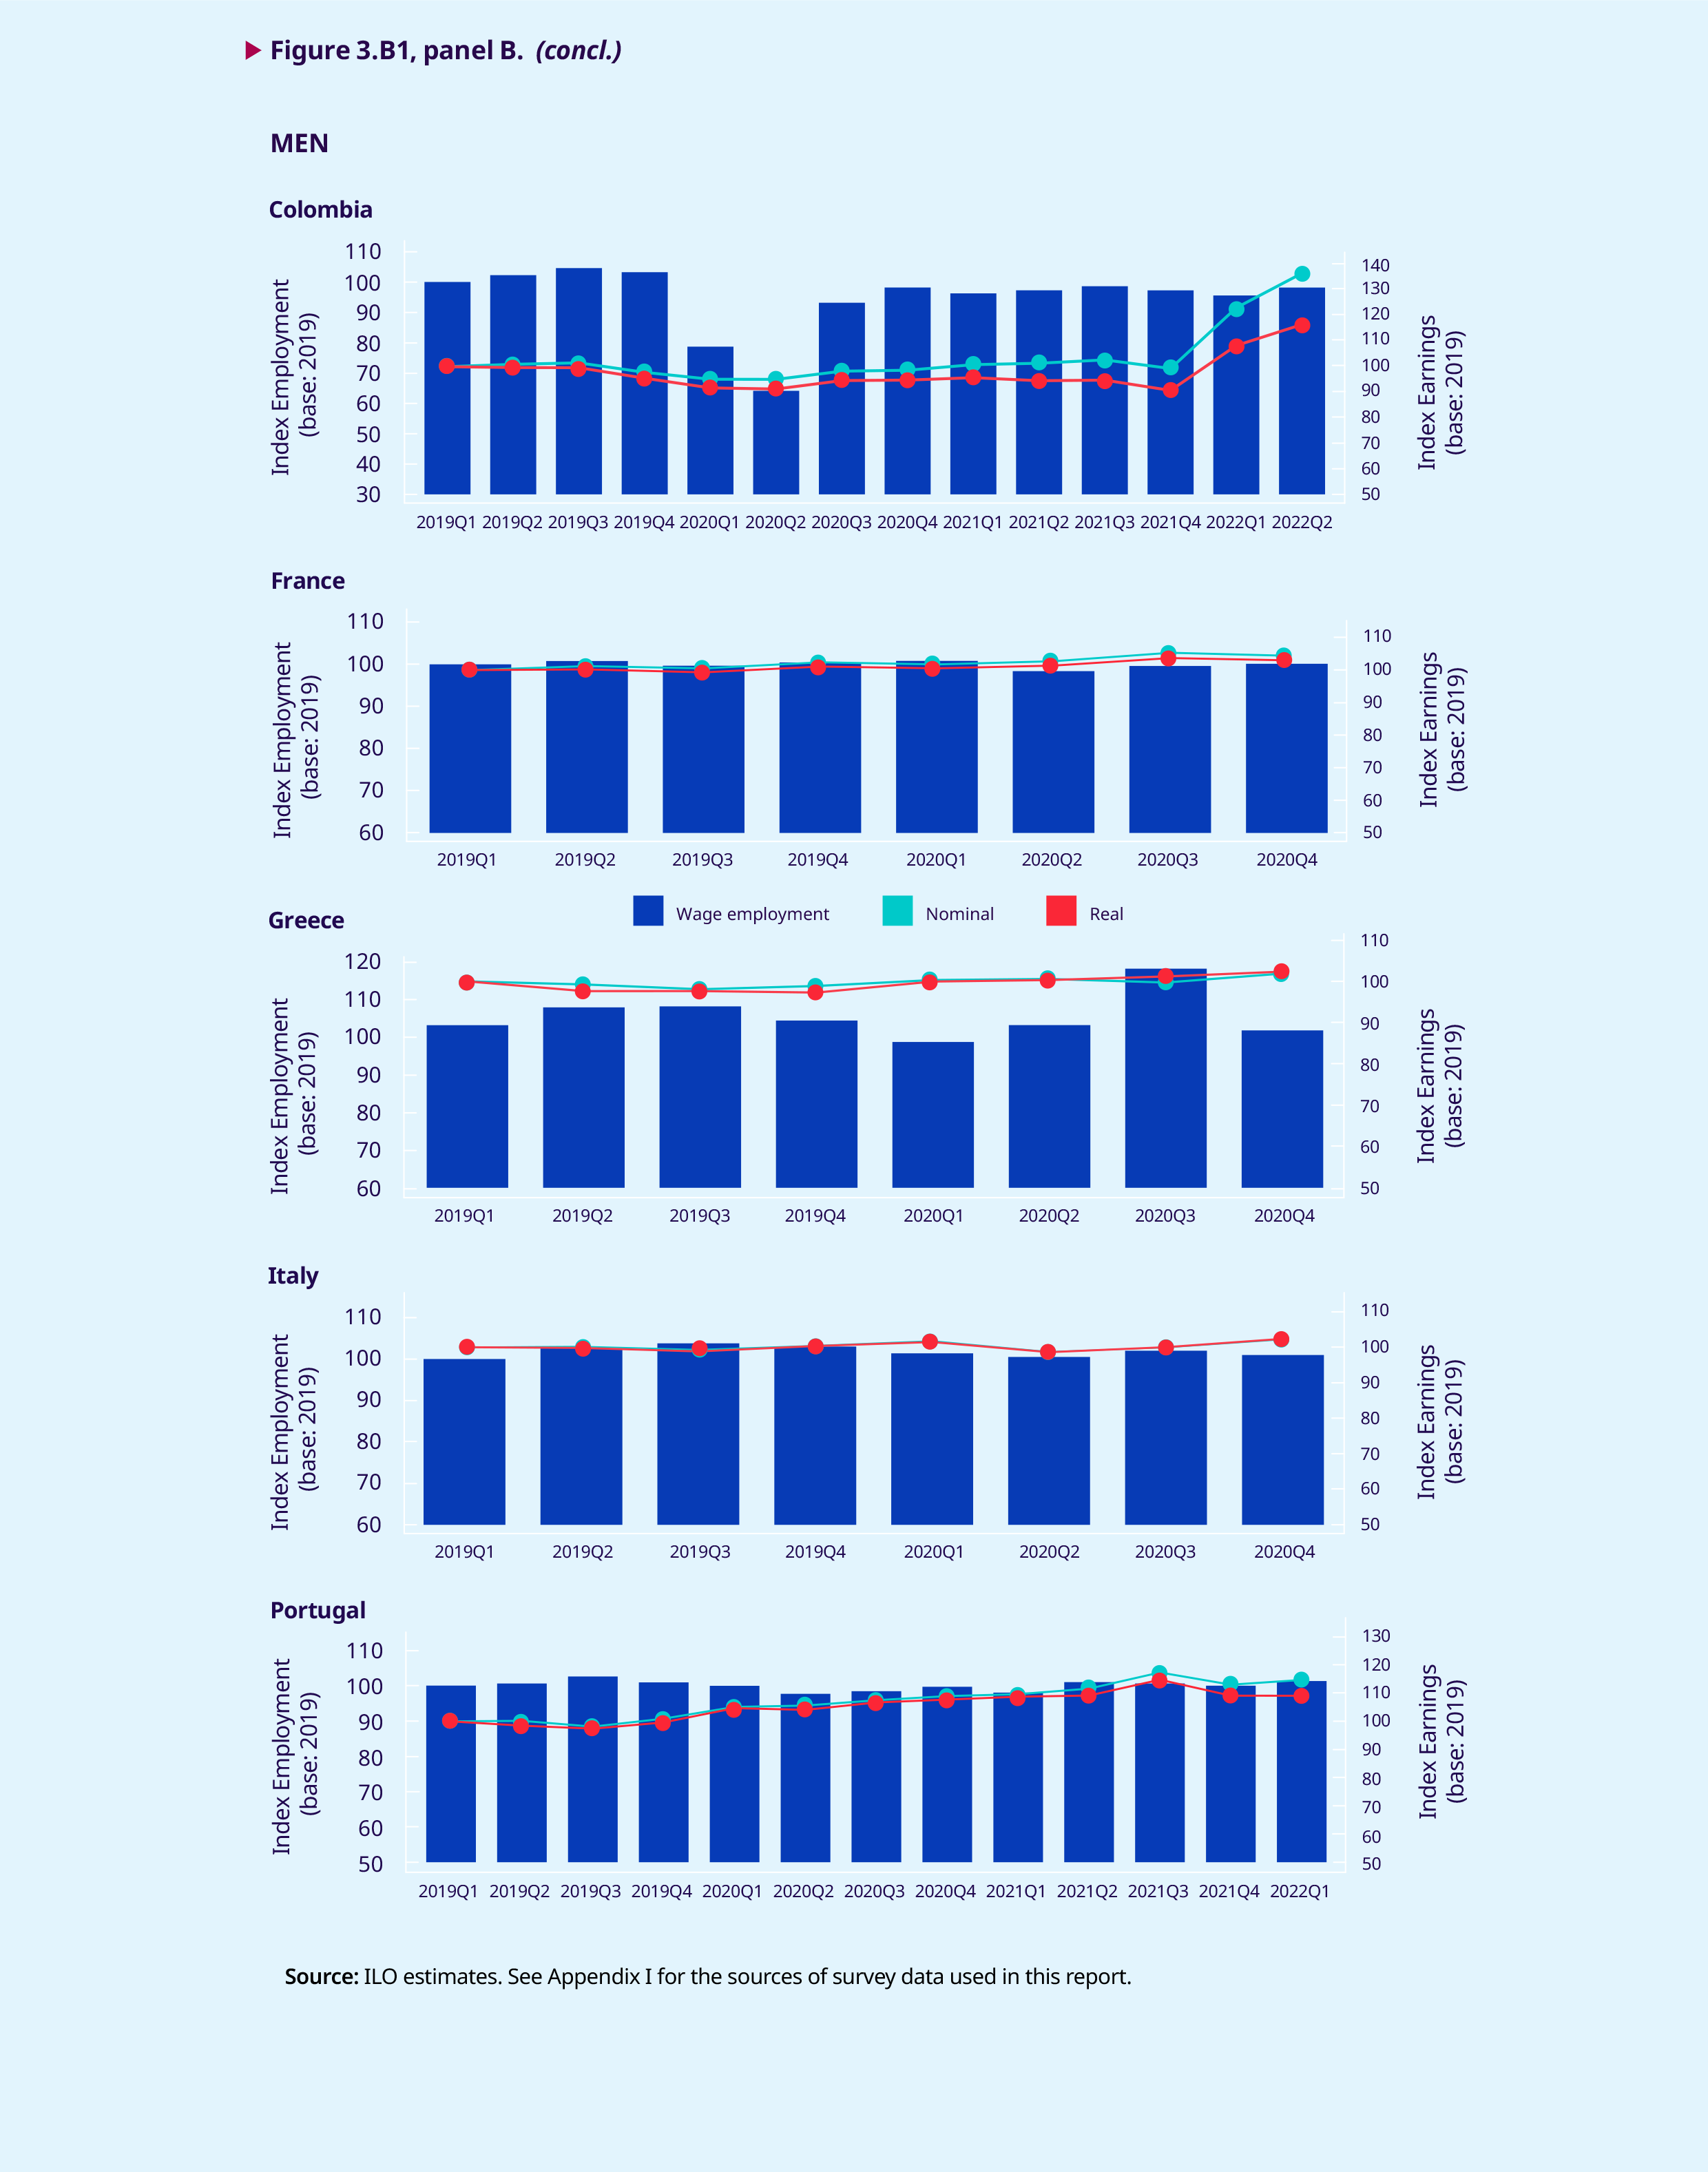
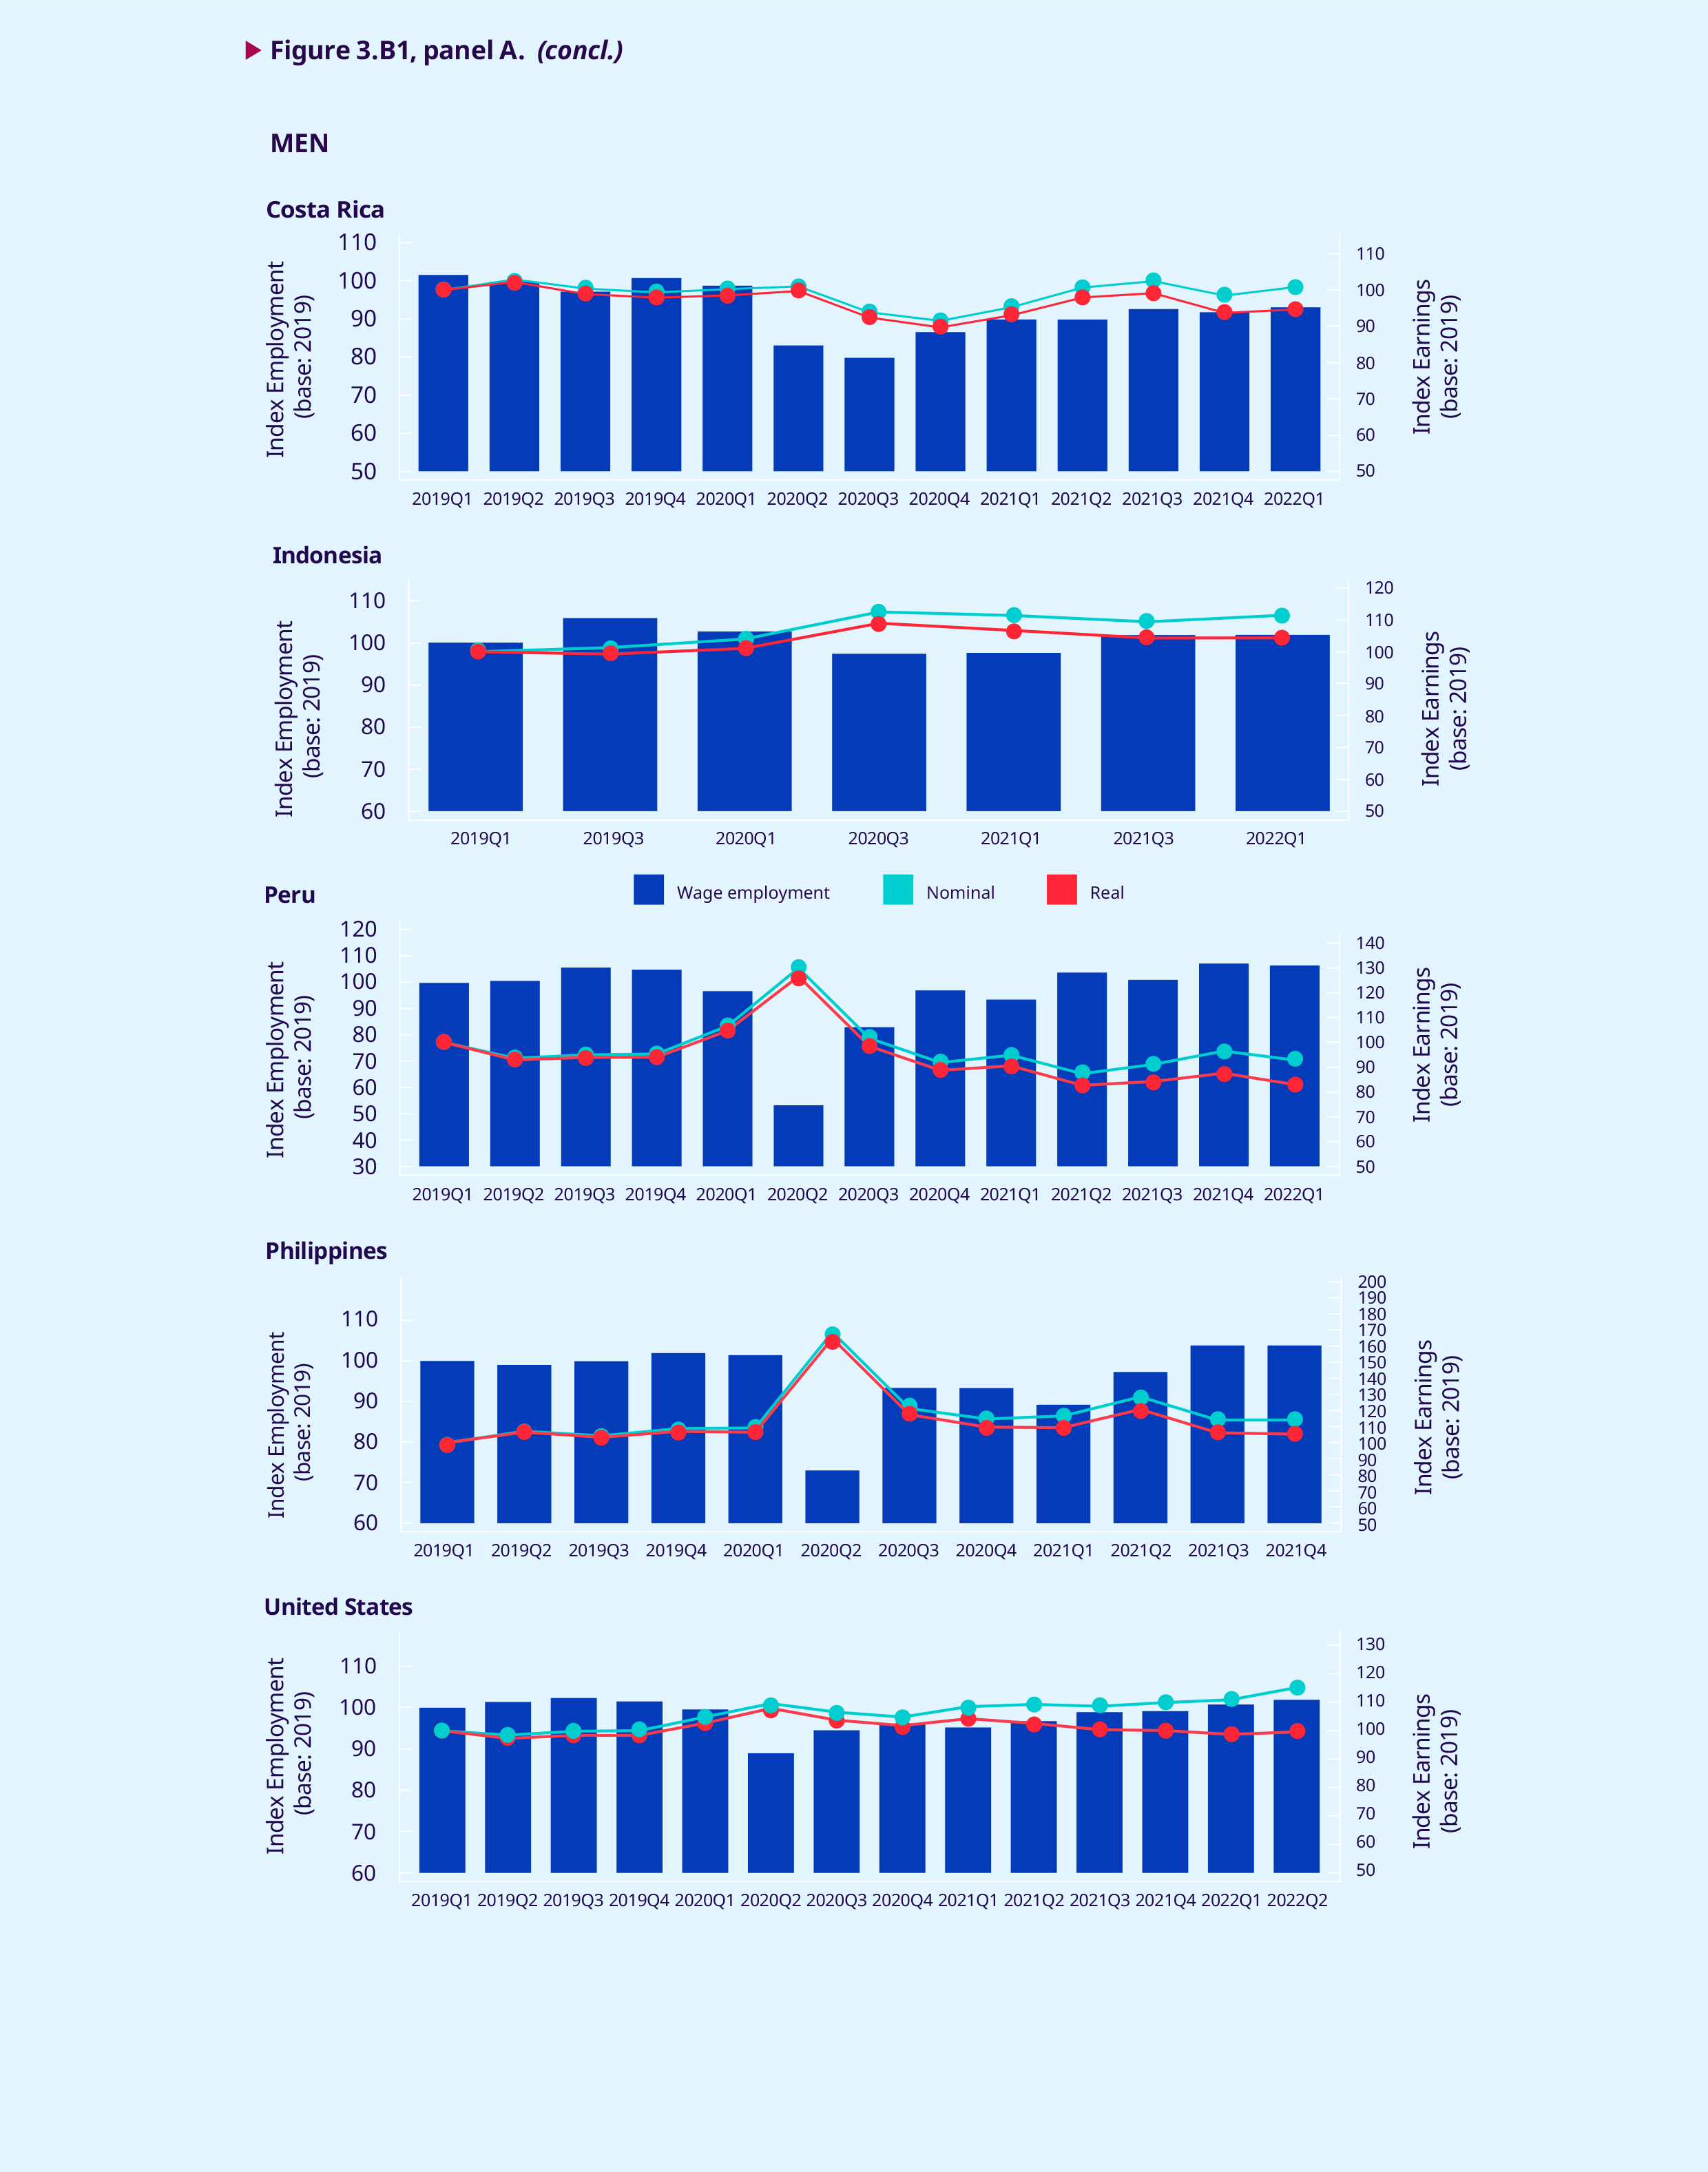
The charts in figure 3.B1 show examples of wage and employment trends, before and during the COVID-19 crisis, to illustrate the composition effect in relation to wage statistics for both women and men. The examples in panel A correspond to countries with a distinct composition effect (average wages go up as employment goes down), while the examples in panel B are of countries with no obvious composition effect. All the charts present separate estimates for women and men. In all countries in figure 3.B1, panel A, the second quarter of 2020, that is, the onset of the COVID-19 crisis, coincides with a sudden dip in wage employment together with an increase in real and nominal wages. Except for Costa Rica, this is observed in all countries for both women and men. In general, women, who are more likely to be clustered at the bottom of the wage distribution, lost more employment than men (see also section 3.8).
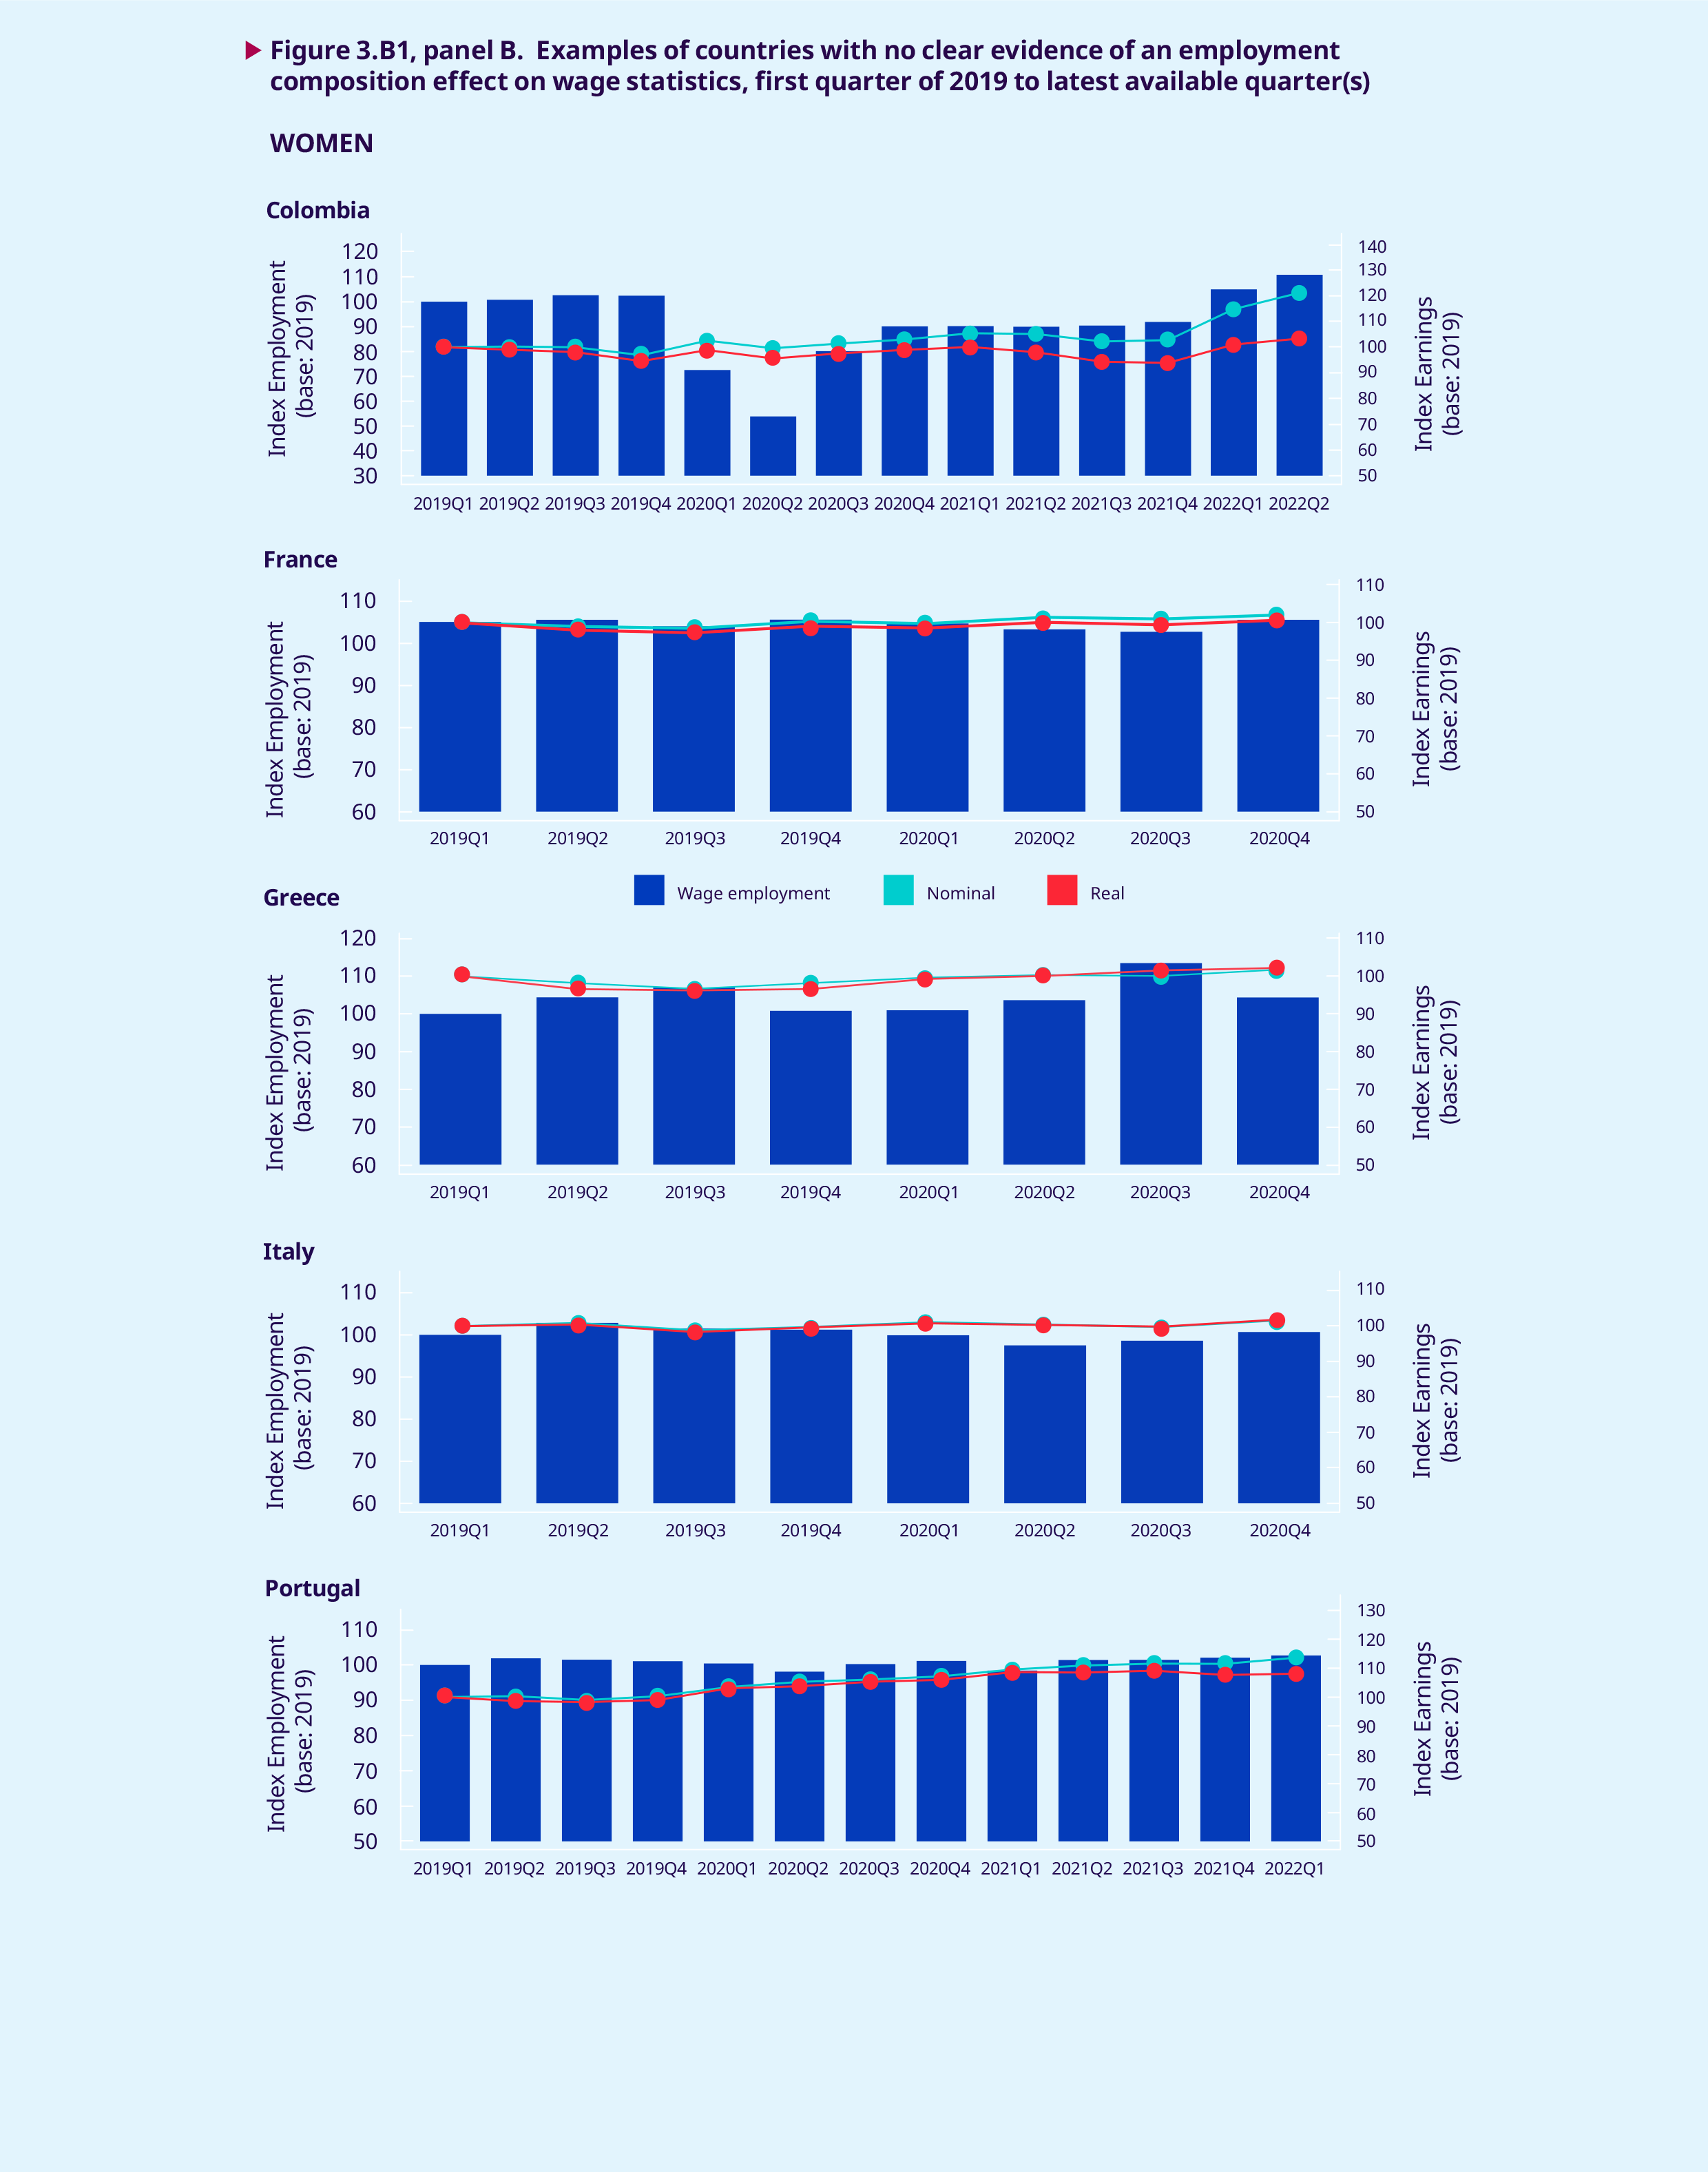
Figure 3.B1, panel B, shows countries where there was no very obvious composition effect on average wages. Most of them are countries in Europe where stimulus packages, wage subsidies and job retention schemes kept wage employees in employment. Greece and Italy display a slight decline in wage employment near the second quarter of 2020, although there is no impact on average wages. Colombia is an interesting case: wage employment declines together with wages for both women and men. It is likely that wage employment in that country was destroyed across the wage distribution, and that those who remained in wage employment reduced their number of hours worked. This translated into a reduction in average wages at around the second quarter of 2020.
For all countries in figure 3.B1, panels A and B, as wage employment gradually returns to its pre-pandemic level, especially after the second quarter of 2021, wage statistics exhibit a tendency to return to the trend that they had displayed in 2019. For countries with data up to the first quarter of 2022, these trends show how inflation started to take a hefty bite out of real wages at the end of 2021 and during 2022. The cost-of-living crisis is discussed in detail throughout this report.
 declined but not by very much, partly owing to the massive use of temporary wage subsidies, which are generally included in wage statistics,4 and job retention schemes to save jobs and mitigate the adverse impact of the crisis on wages. In Germany and the United Kingdom, for example, real average wages declined by less than 1 per cent in 2020. In some countries, particularly European ones, collective bargaining played an important role in saving jobs, ensuring business continuity and protecting earnings.
In the emerging G20 economies, real wage growth declined from 3.4 per cent in 2019 to 2.4 per cent in 2020. This overall trend masks some very heter- ogeneous situations, including falling real wages in some countries, such as Indonesia, South Africa and Türkiye; slower but still positive wage growth in China (+4.6 per cent in 2020); and a large jump in average wages in Brazil and Mexico, which prob- ably reflects, at least in part, a strong composition effect, and which in both countries was followed by falling real wages in 2021.
.3.2. Regional wage trends
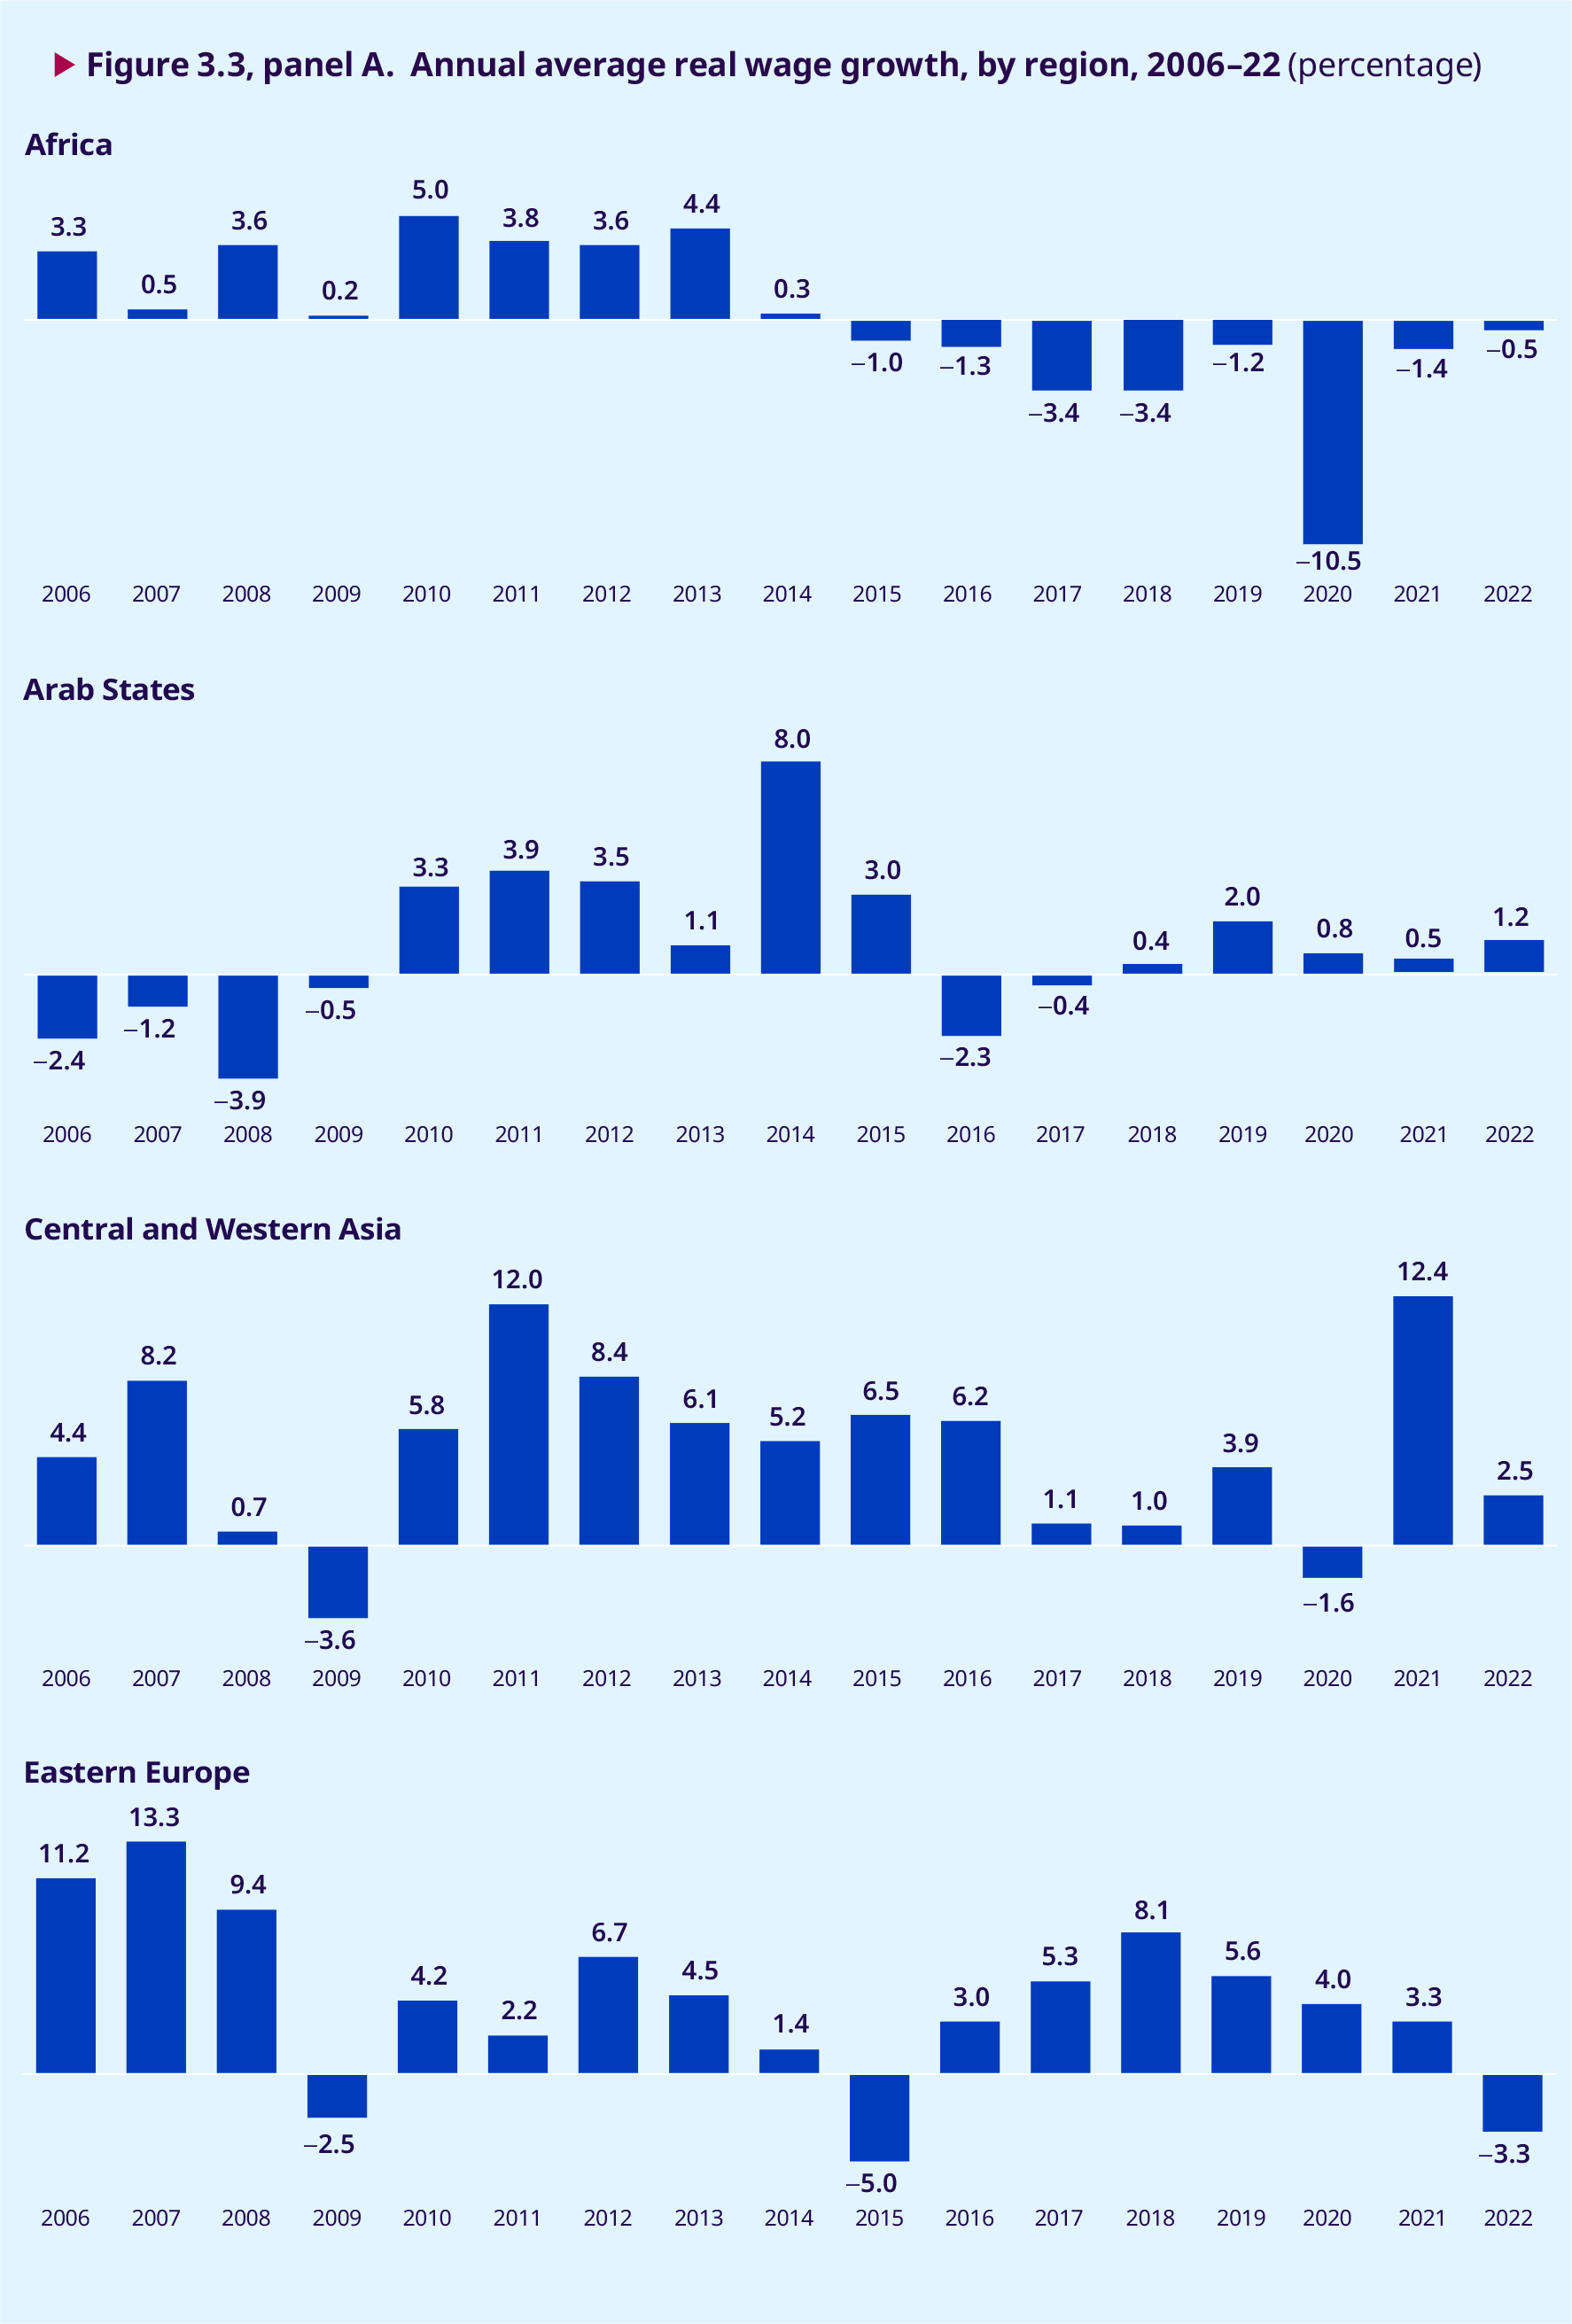
Figure 3.3 presents regional data to complement the global analysis presented in section 3.1, while figure 3.4 displays some country-specific data, in both cases based on official wage statistics. The charts in figure 3.3 show the extent to which the global wage trends are replicated or not at the regional level.5 The regional picture is marked by considerable heterogeneity in the impact of the COVID-19 crisis in 2020, with higher-than- usual average wages in Northern America and Latin America and the Caribbean due to strong employment composition effects, since many low- paid workers lost their jobs during the pandemic; frozen wage growth in the EU, reflecting to a great extent the widespread use of wage subsidies; and declining wage growth in other regions. Consistently across regions, though, one can observe a decline in estimated real wage growth during the first half of 2022 due to the acceleration of price inflation.6
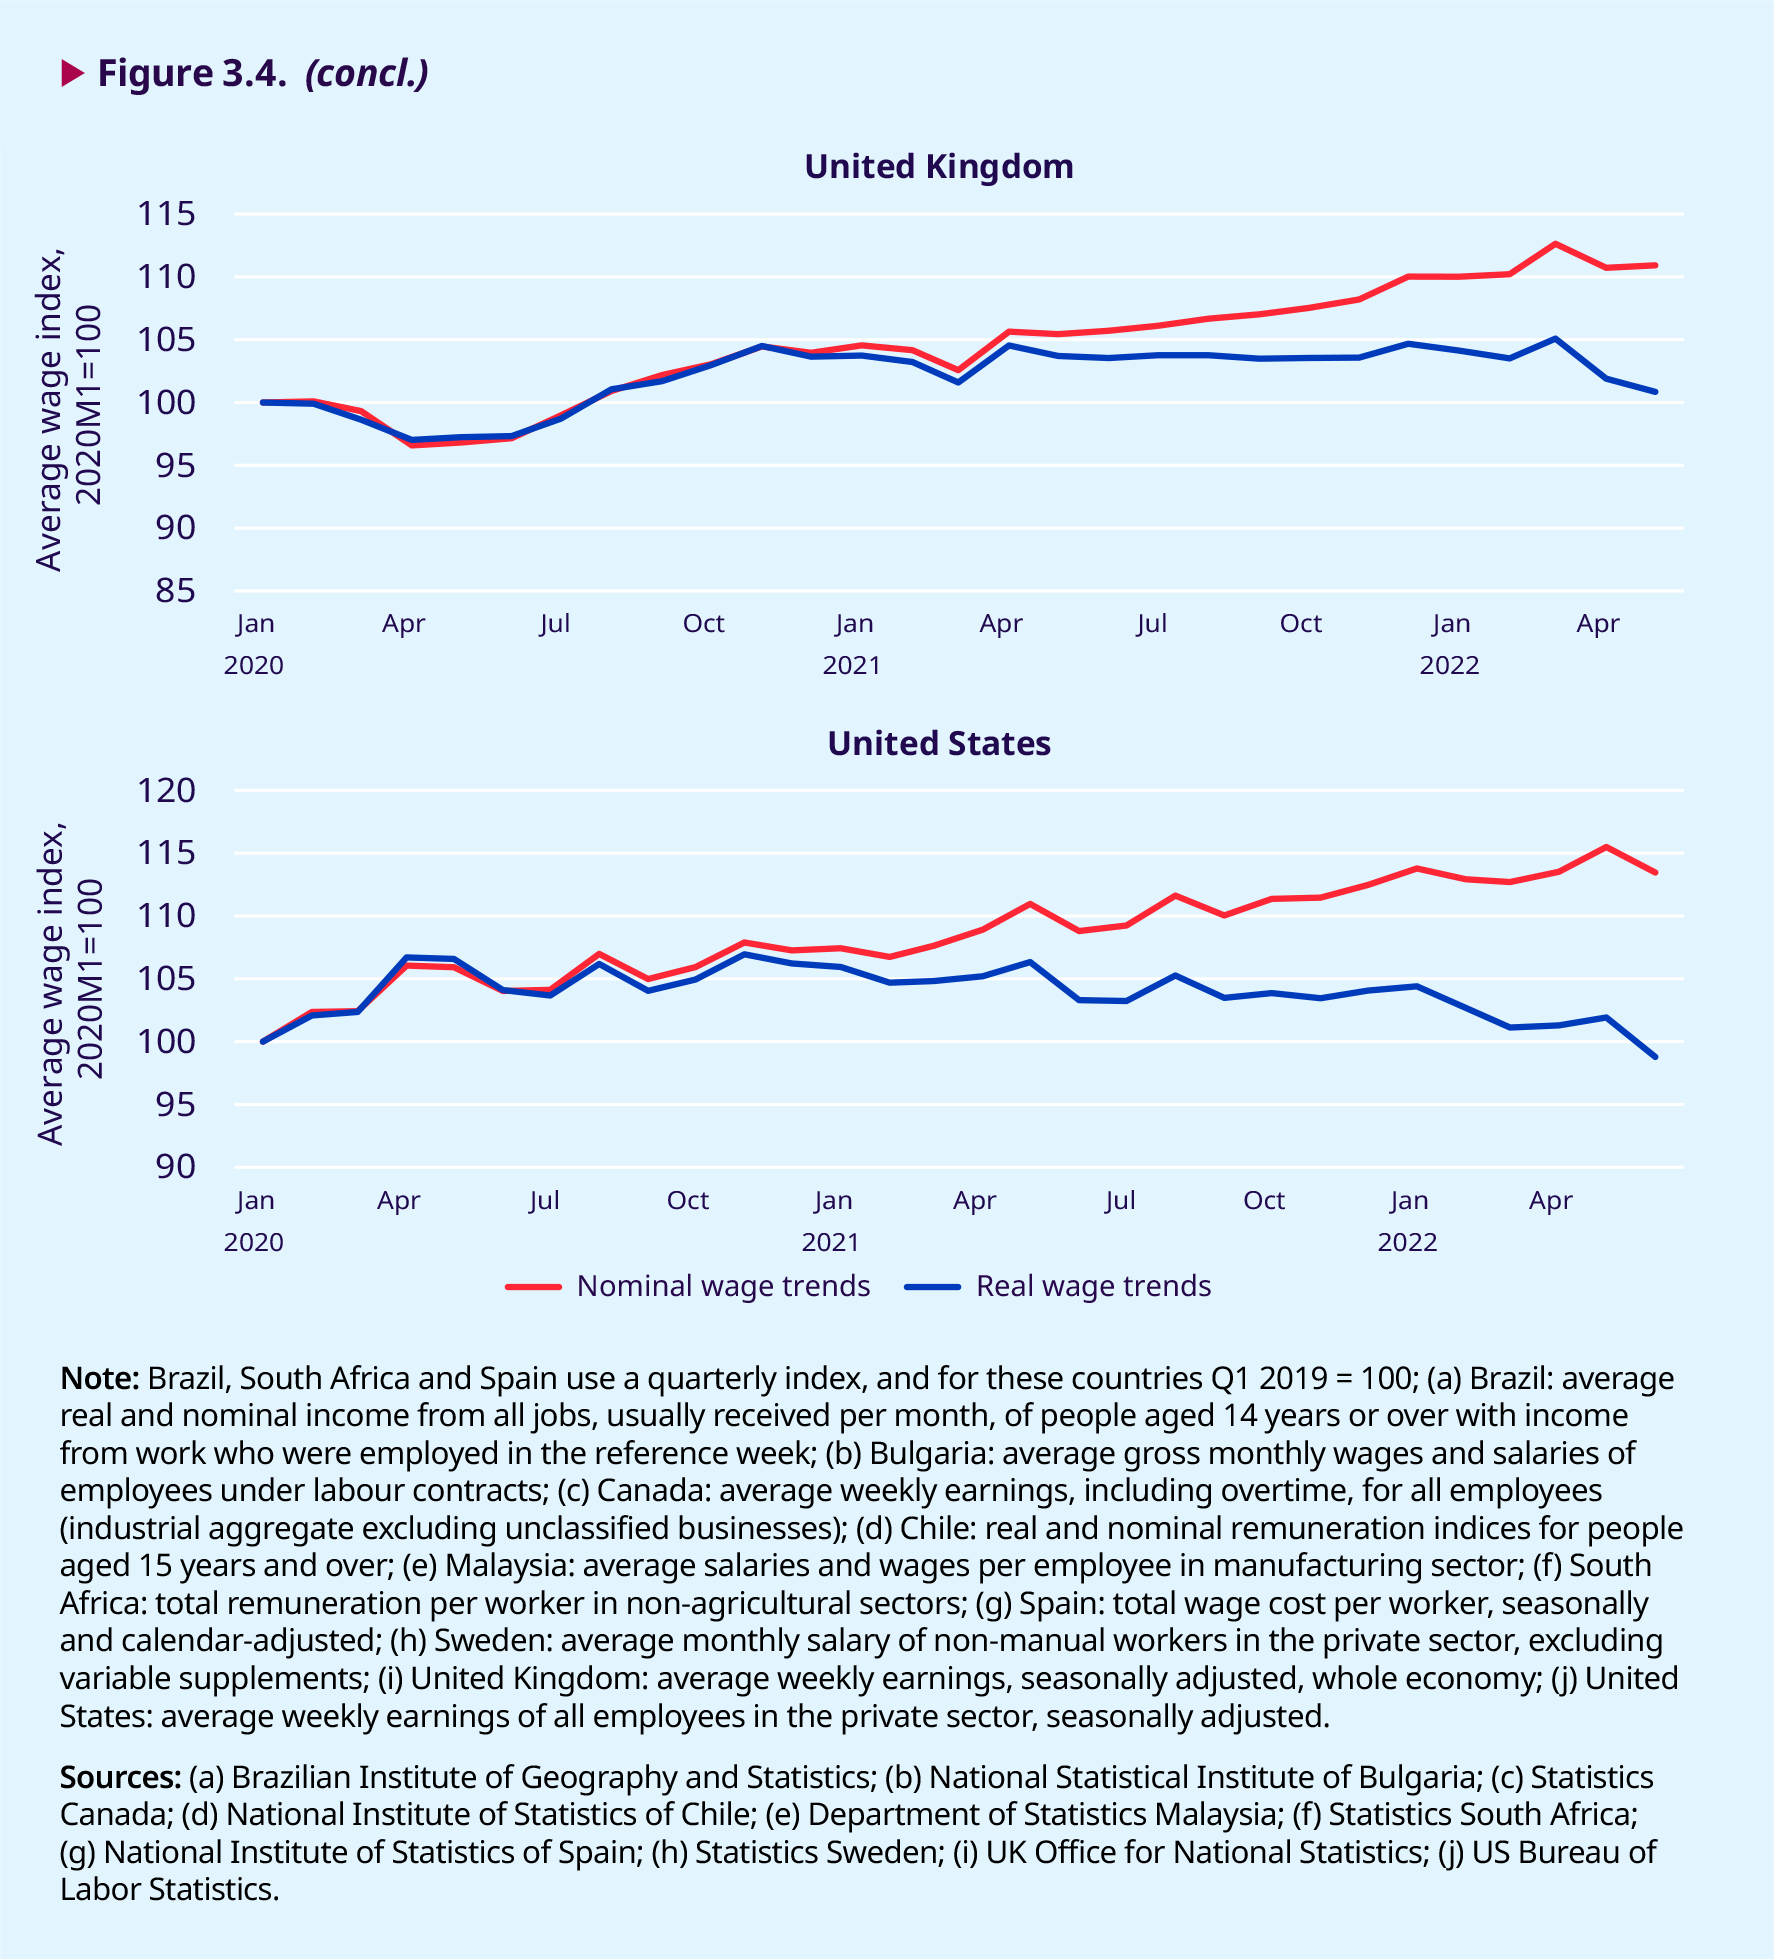
In Northern America (Canada and the United States), real wage growth fluctuated between 0 and 1 per cent in most years between 2006 and 2019, including the years immediately before the outbreak of the pandemic. In 2020, as the pandemic destroyed the jobs of millions of low-wage workers, the composition effect manifested itself clearly, with average real wage growth suddenly rising to 4.3 per cent. The subsequent decline in real wage growth, first to 0 per cent in 2021 and then to –3.2 per cent in the first half of 2022, is due to the composition effect fading away after 2020 (that is, from the moment that low-paid workers returned to the labour market) and the rise in inflation which eroded real wages in 2021 and especially in the first months of 2022. Figure 3.4 displays monthly trends in average nominal and real wages in both Canada and the United States, where one can again see an initial jump in average real wages in the early months of 2020 and a progressive decline since late 2020 and early 2021.
In Latin America and the Caribbean, the composition effect – reflecting the fall in low-wage employment during the pandemic – was clearly observable, with real wage growth jumping to 3.3 per cent in 2020 a much higher increase than in any of the pre- pandemic years, when real wage growth fluctuated at very low rates. In 2021, the collapse in real wage growth to –1.4 per cent was driven largely by a sharp decline in real wages in Brazil, estimated at –7.0 per cent in 2021. Figure 3.4 displays monthly wage data for Brazil, showing the fall in average real wages between the third quarter of 2020 and the last quarter of 2021. Although real wages in Brazil increased somewhat during the first half of 2022, they declined on average across the region as inflation started to make itself felt. The data for Chile, for example, show that real wages have been trending modestly downwards since January 2022.
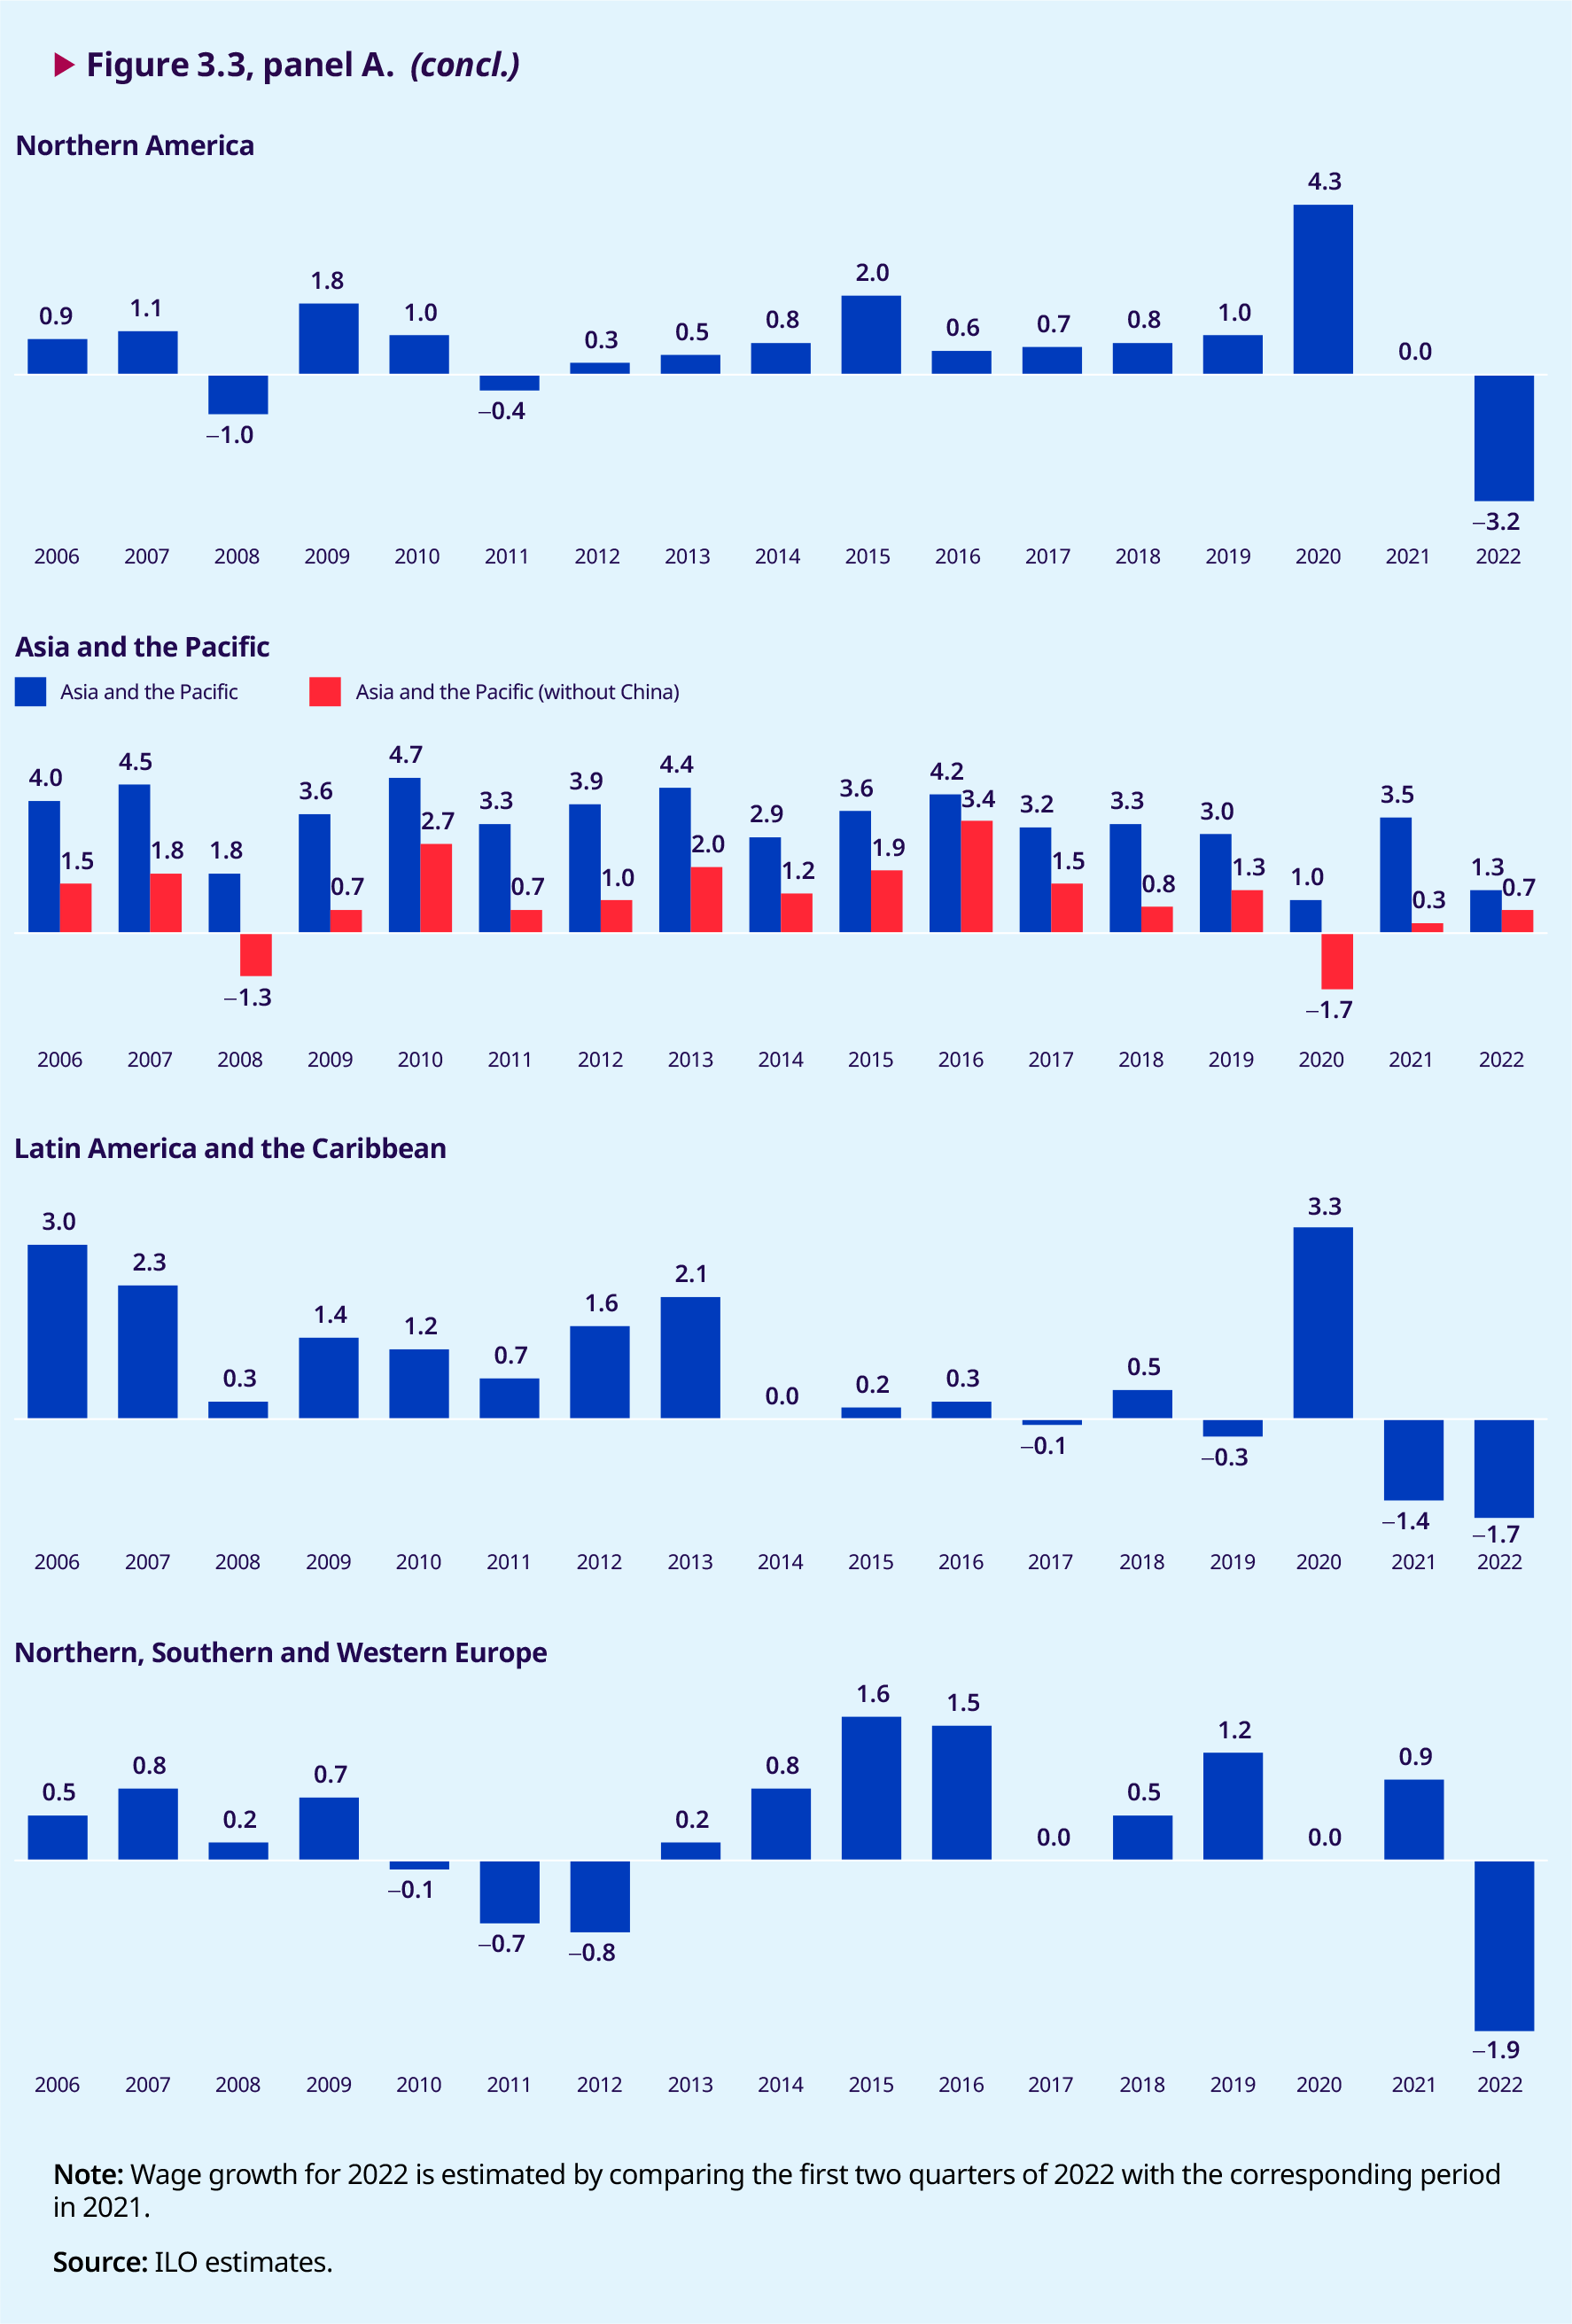
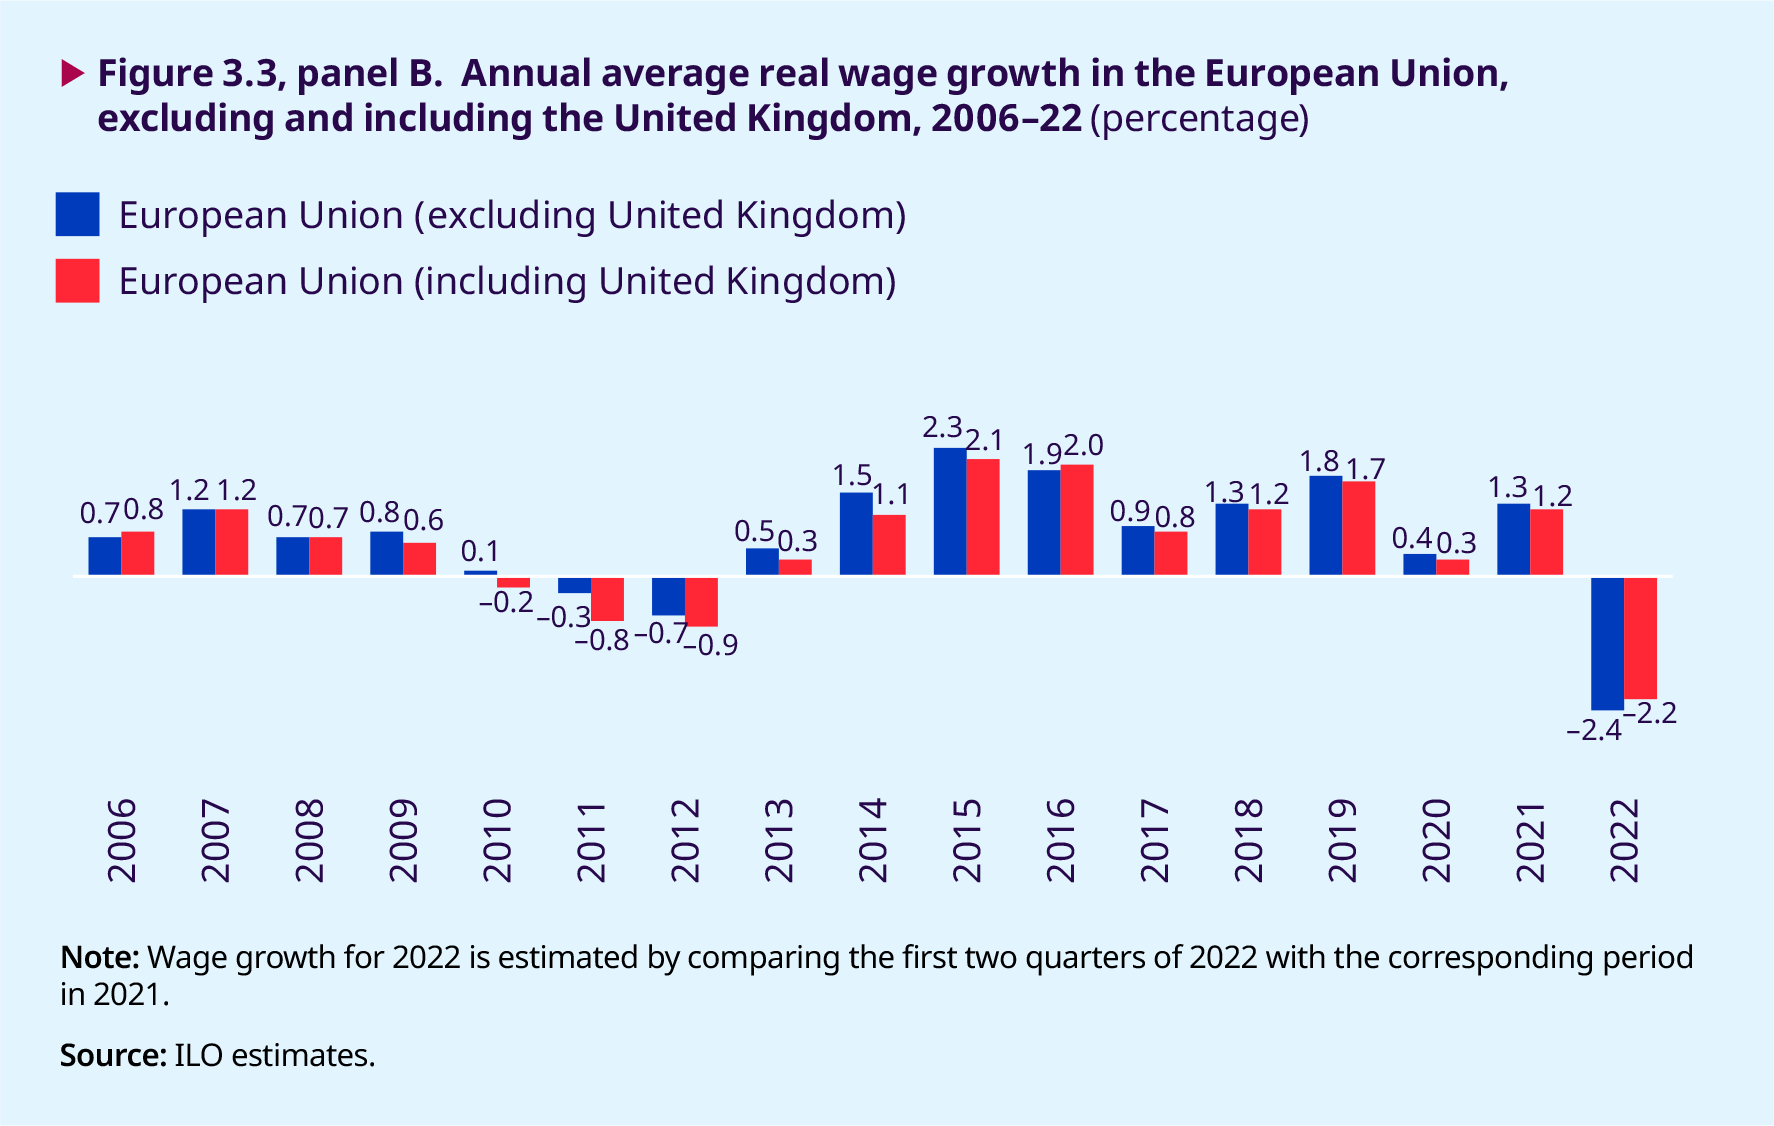
In the European Union, real wage growth fluctuated between approximately 1 and 2 per cent before the outbreak of the pandemic (figure 3.3, panel B). In 2020, real wages froze – but did not decline on aggregate – most likely as a result of a combination of forces pulling in different directions, including: (a) declining wages for some workers; (b) the massive use of temporary wage subsidies to maintain the wages of millions of workers, even though their hours of work declined; and (c) composition effects pushing average wages up, since even moderate employment losses disproportionately affected low- paid workers. After a temporary recovery of wage growth in 2021, real wages fell to –2.4 per cent in the first half of 2022 (to –2.2 per cent if the United Kingdom is included) as inflation cut into the value of wages. In the somewhat broader but overlapping region of Northern, Southern and Western Europe (figure 3.3, panel A), trends are similar to those in the EU.7 In figure 3.4, wage trends are illustrated by monthly wage data from Sweden and the United Kingdom, both of which display relatively stable average real wages in 2020 and declining real wage trends since late 2021 and early 2022. The two countries also reflect the heterogeneity of situations in 2020, since a composition effect (and hence increasing wages due to falling employment among low-paid workers) is discernible in the United Kingdom but no such effect manifests itself in the data from Sweden.
In Eastern Europe, real wages increased relatively fast before the pandemic, growing at rates above 5 per cent between 2017 and 2019, and even above 8 per cent during 2018. The outbreak of the pandemic slowed down real wage growth to to 4.0 per cent in 2020 and 3.3 per cent in 2021, whereas in the first six months of 2022 accelerating price inflation caused real wage growth to decline to –3.3 per cent. Significantly, the composition effect was not a dominant factor in wage statistics in this region in 2020. Furthermore, the moderate increase in wage growth in 2021 could to some extent be ex- plained by inflation rates remaining rather low dur- ing 2021, especially in comparison with the rest of the world. The data from Bulgaria in figure 3.4 are representative of the region as a whole, with mod- erate wage growth across both 2020 and 2021 and declining real wages since December 2021.
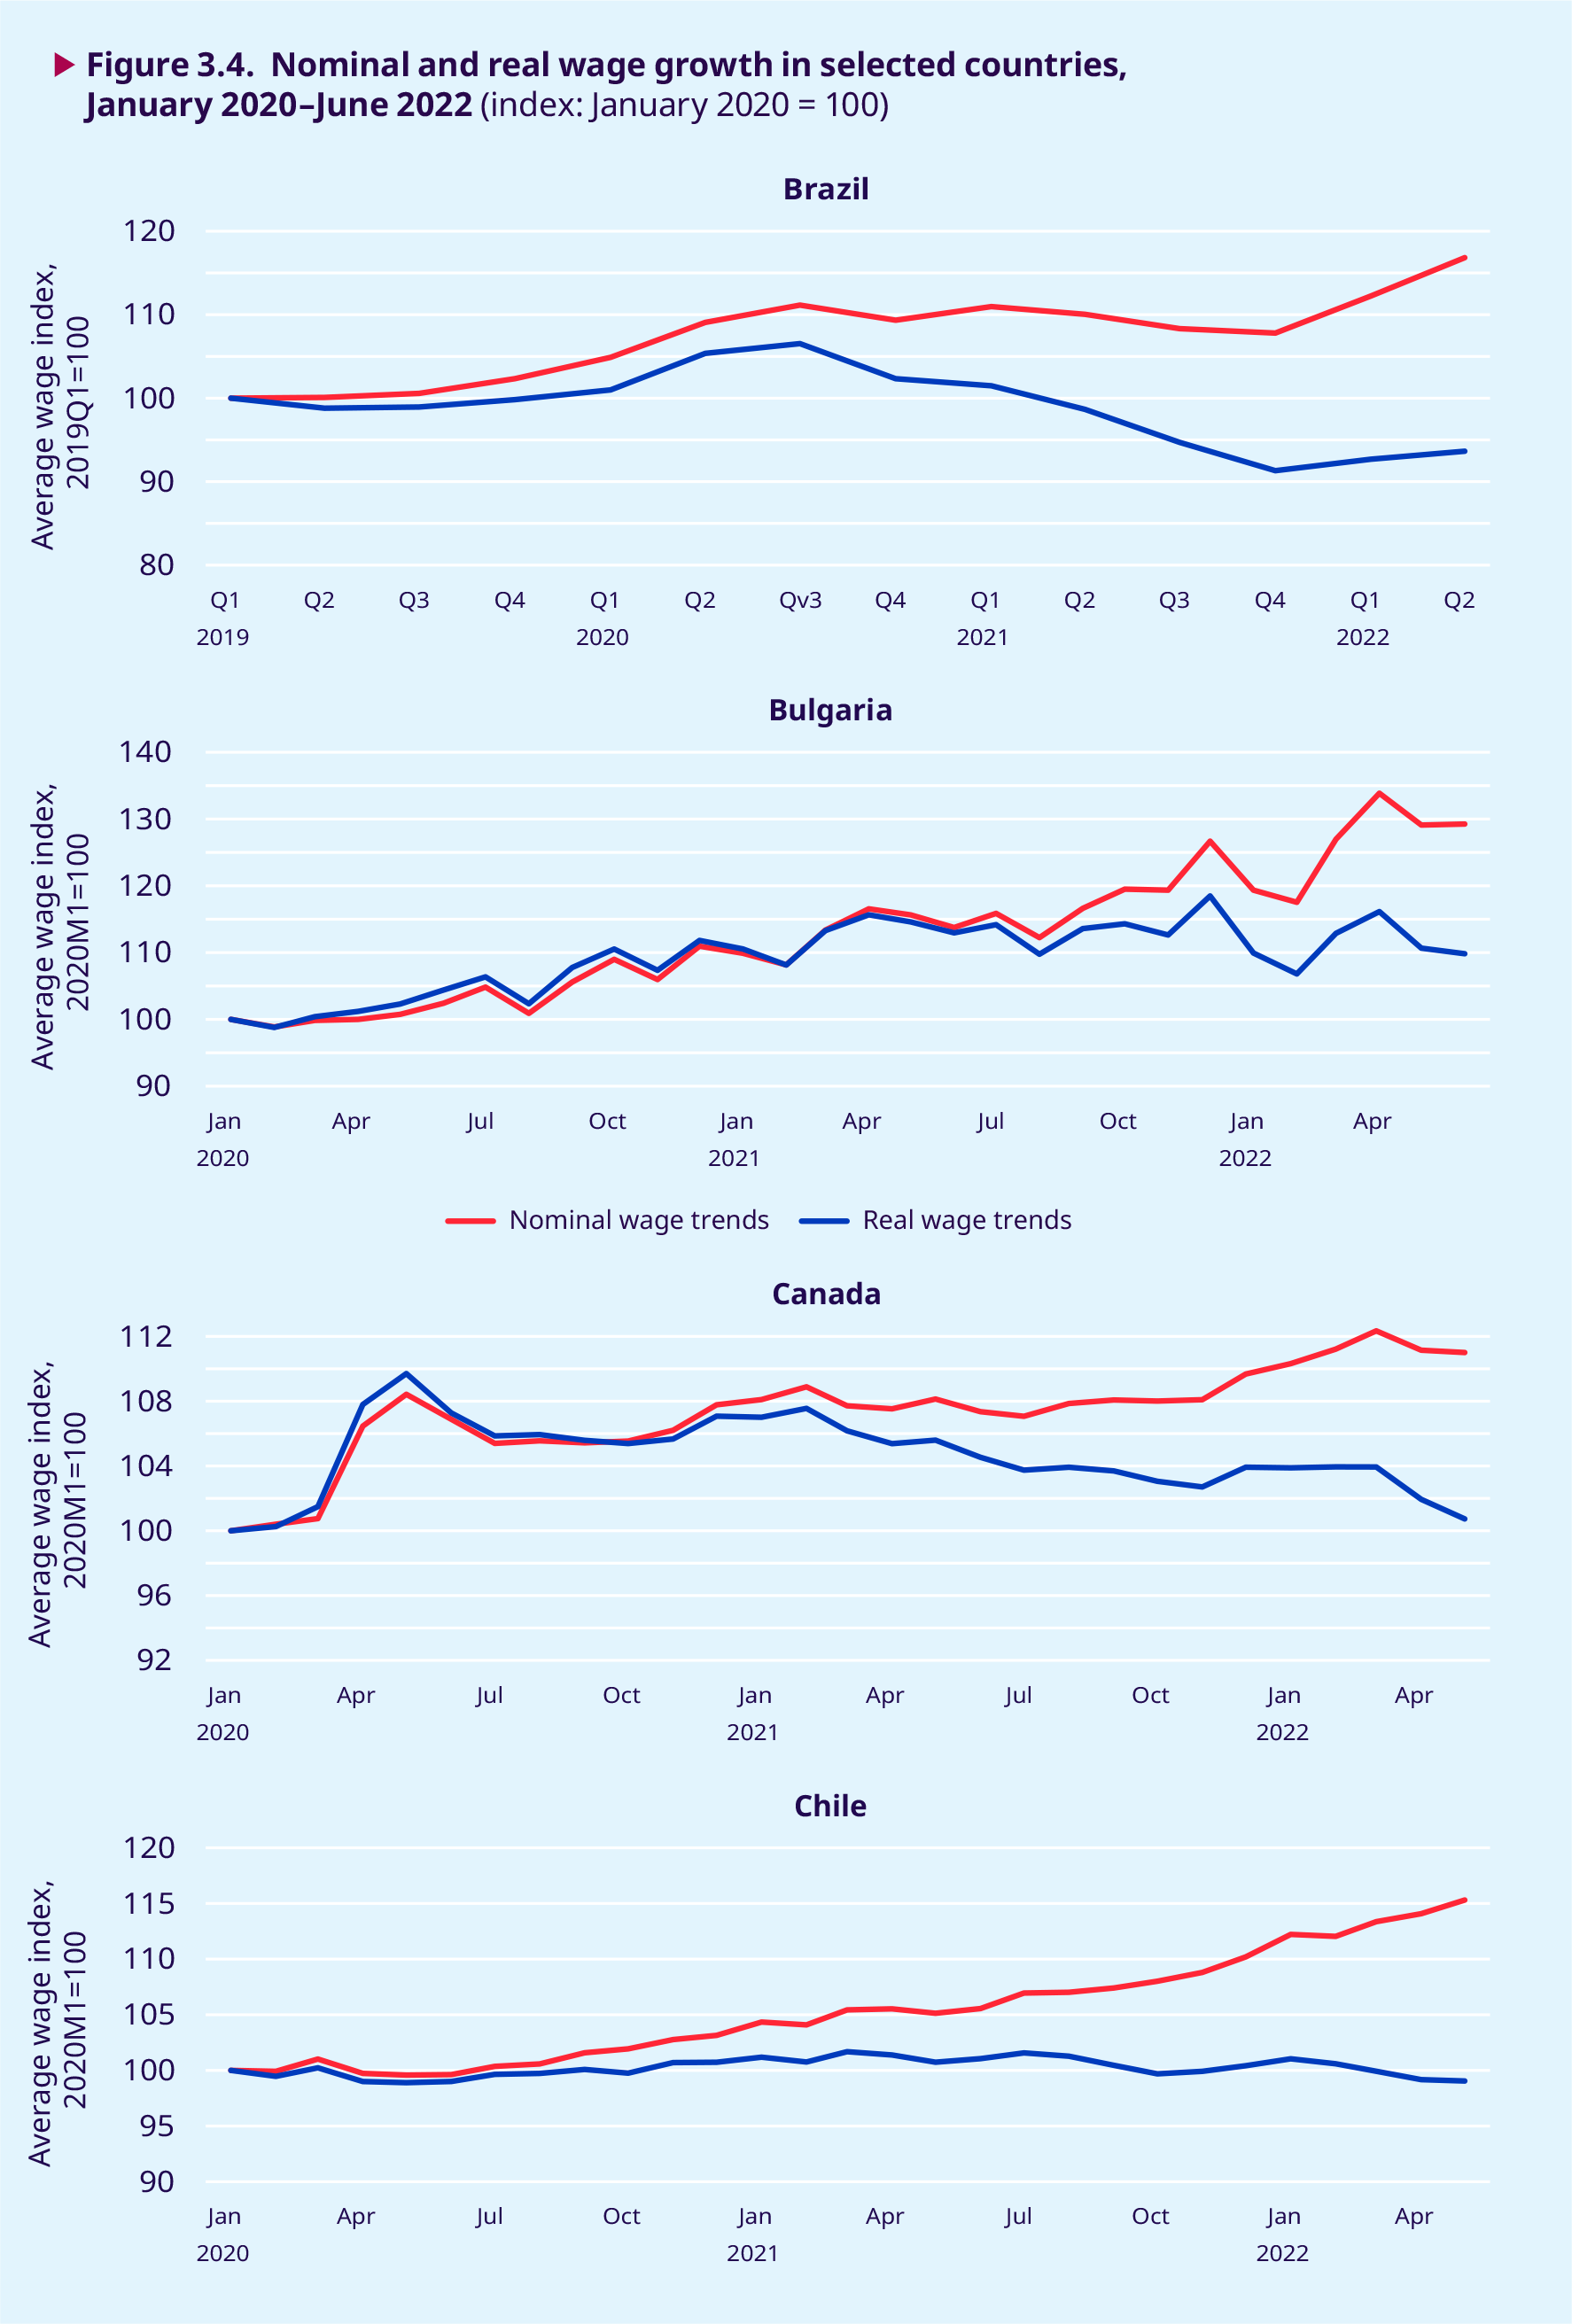
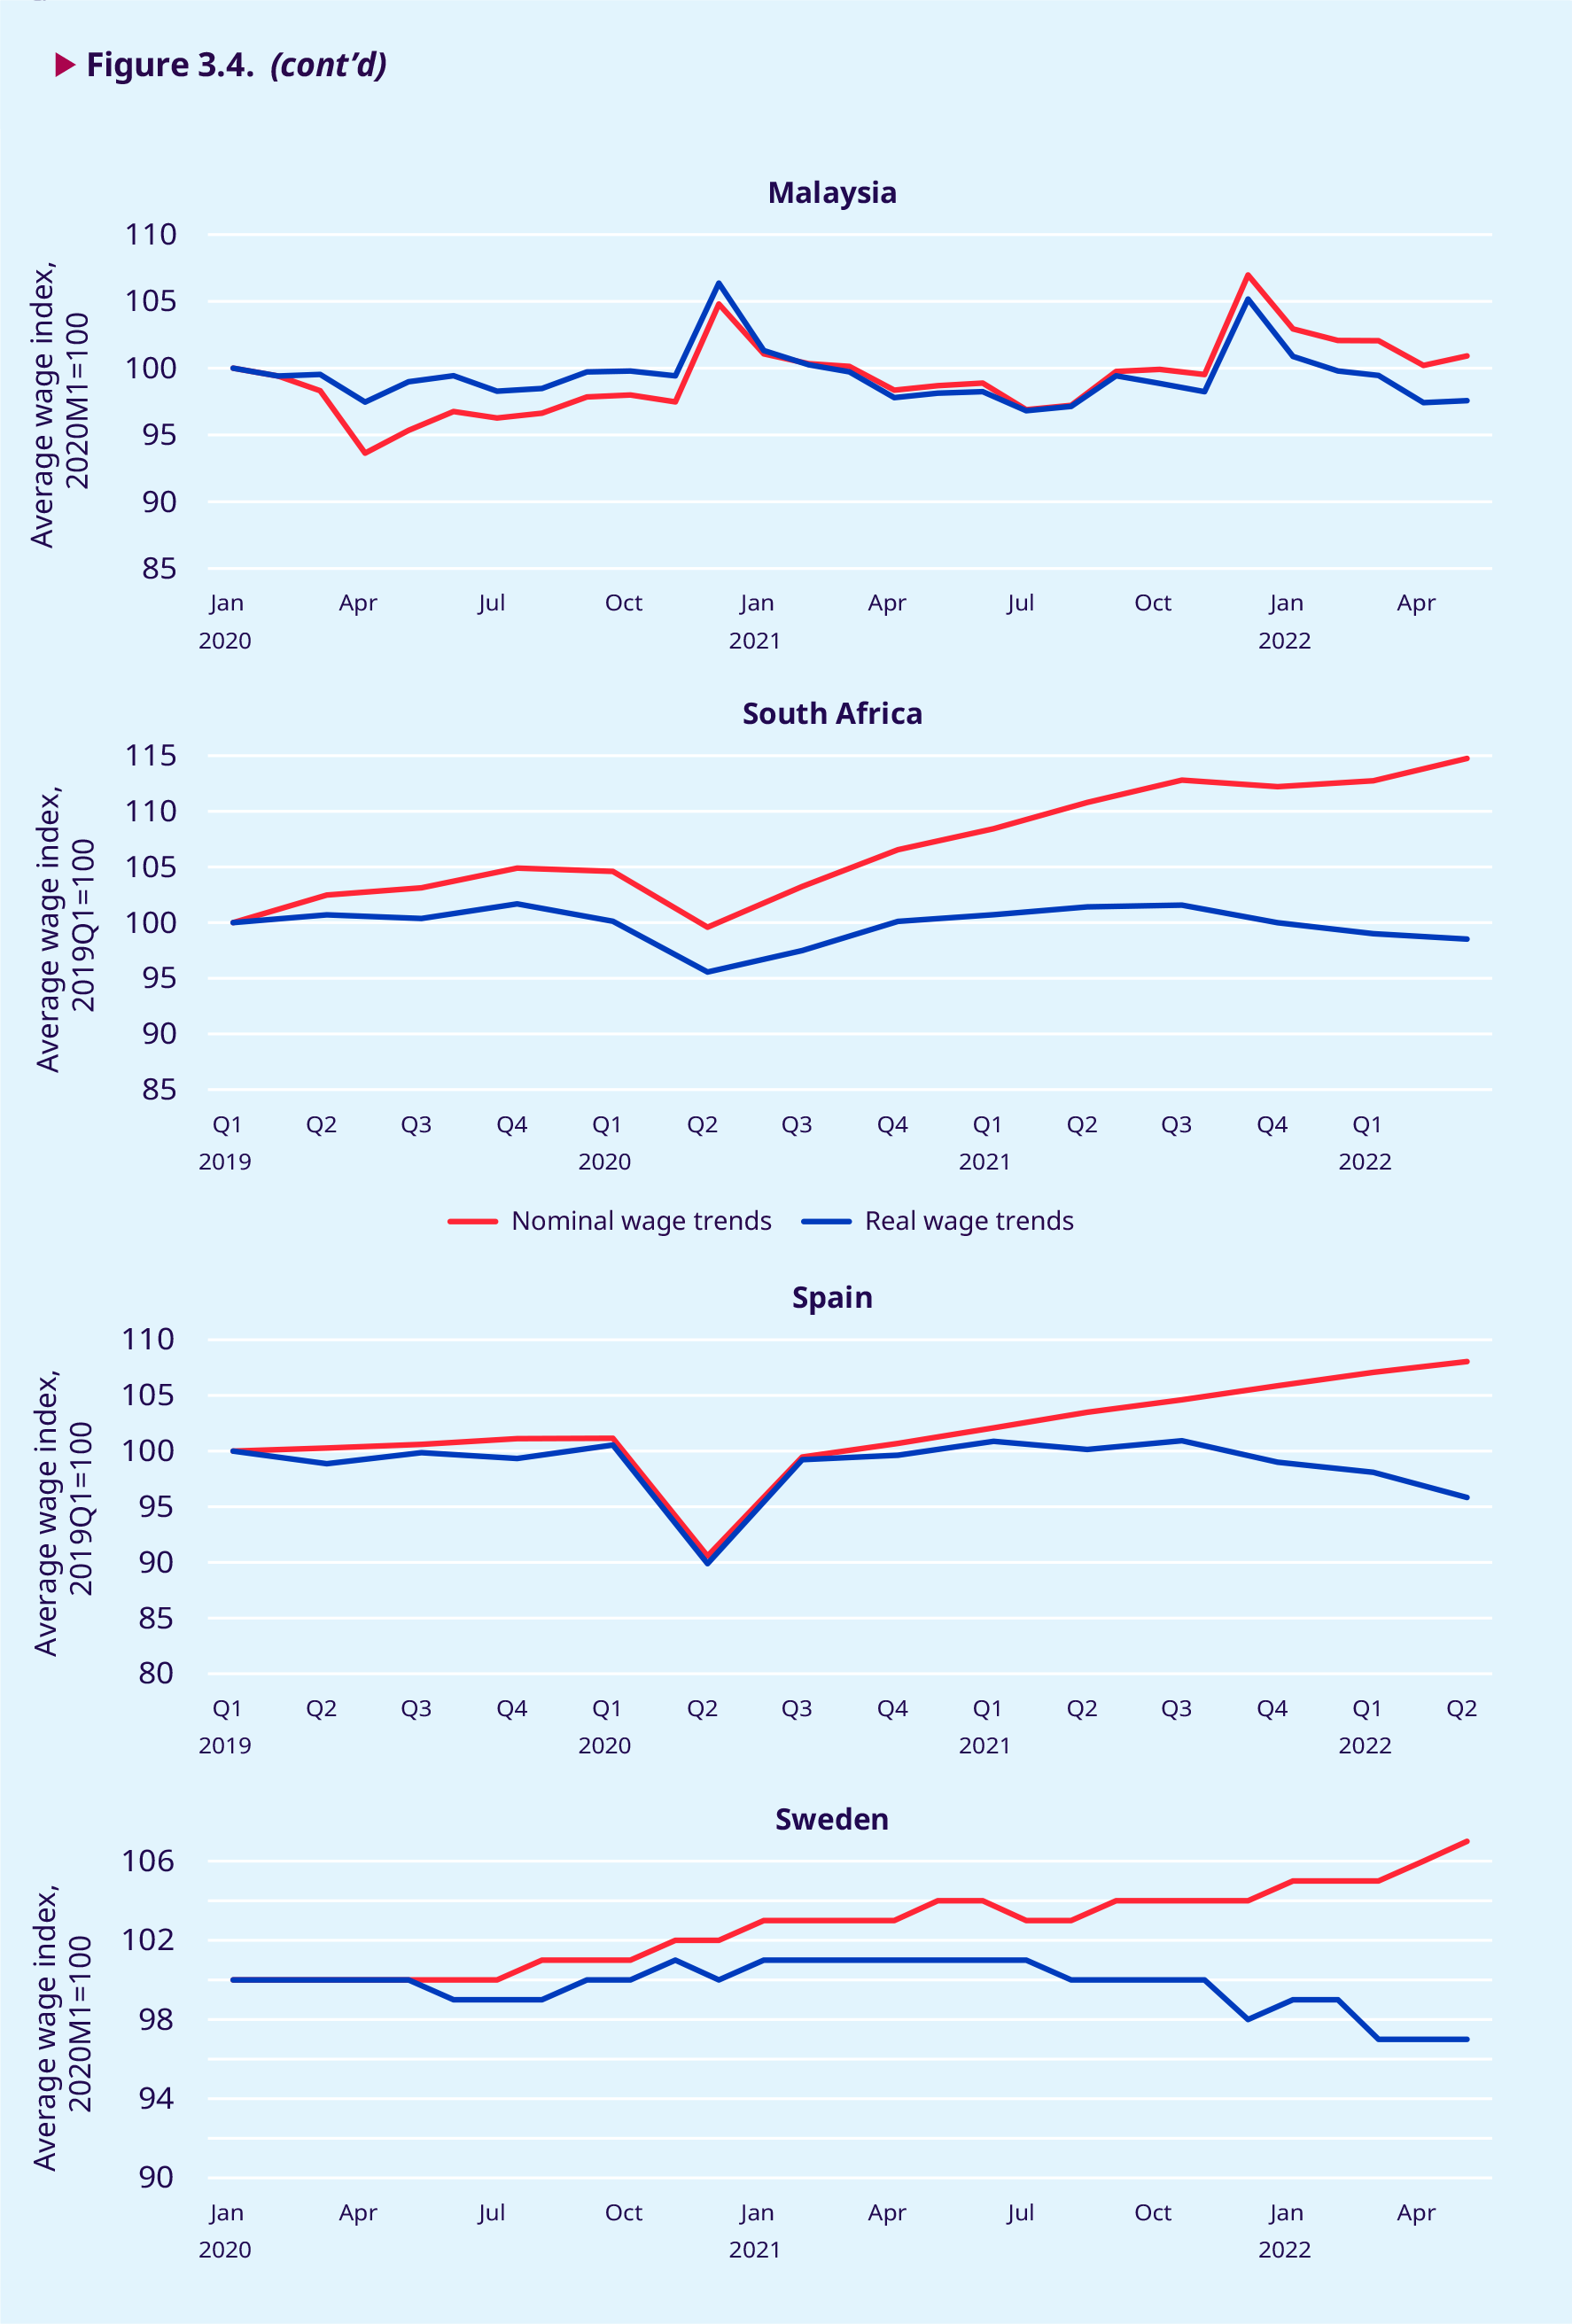
In Asia and the Pacific, the impact of high wage growth in China before the pandemic is significant, with real wage growth in the three years before the pandemic ranging from 3.0 to 3.3 per cent in the region when China is included, and reaching even higher rates in some of the earlier years. However, when China is excluded, regional wage growth in the three years before the pandemic drops to 1.5 per cent or less. In 2020, wage growth in the region falls to 1 per cent, and even turns negative when China is excluded. After a recovery in 2021, wage growth declined again but remained positive at 1.3 per cent as inflation began to rise in 2022. The monthly data for Malaysia shown in figure 3.4 illus- trate not only the seasonality of wage growth in that country (with typically higher pay in December than in other months) but also the slow wage growth since early 2020.
In Central and Western Asia, real wages grew at a relatively fast pace in the two years before the pandemic, as well as more generally between 2006 and 2019. In 2020, the first year of the pandemic, real wages fell to –1.6 per cent before rebounding very strongly in 2021. Estimates for 2022 show that in this region, too, real wage growth is being eroded by rising inflation.
In Africa, wage statistics remain patchy in many countries and sometimes display surprisingly large fluctuations. Regional estimates are there- fore merely tentative. The available data suggest slow real wage growth (if any) in the years before the pandemic, a sharp fall in real wage growth of –10.5 per cent in 2020 and thereafter real wage growth of –1.4 per cent in 2021 and –0.5 per cent in the first half of 2022. The quarterly wage data for South Africa presented in figure 3.4 show a decline in average real wages at the height of the pandemic in the second quarter of 2020, followed by a recov- ery in the last two quarters of 2020, flat real wages during 2021 and a tendency to decline in the first quarters of 2022.
In the Arab States, wage statistics likewise remain patchy and their coverage is limited. Regional wage growth estimates are thus tentative at best. The scanty available data suggest low positive wage growth of 0.8 per cent in 2020, 0.5 per cent in 2021 and 1.2 per cent in 2022.
.3.3. Wage indices in the G20 economies
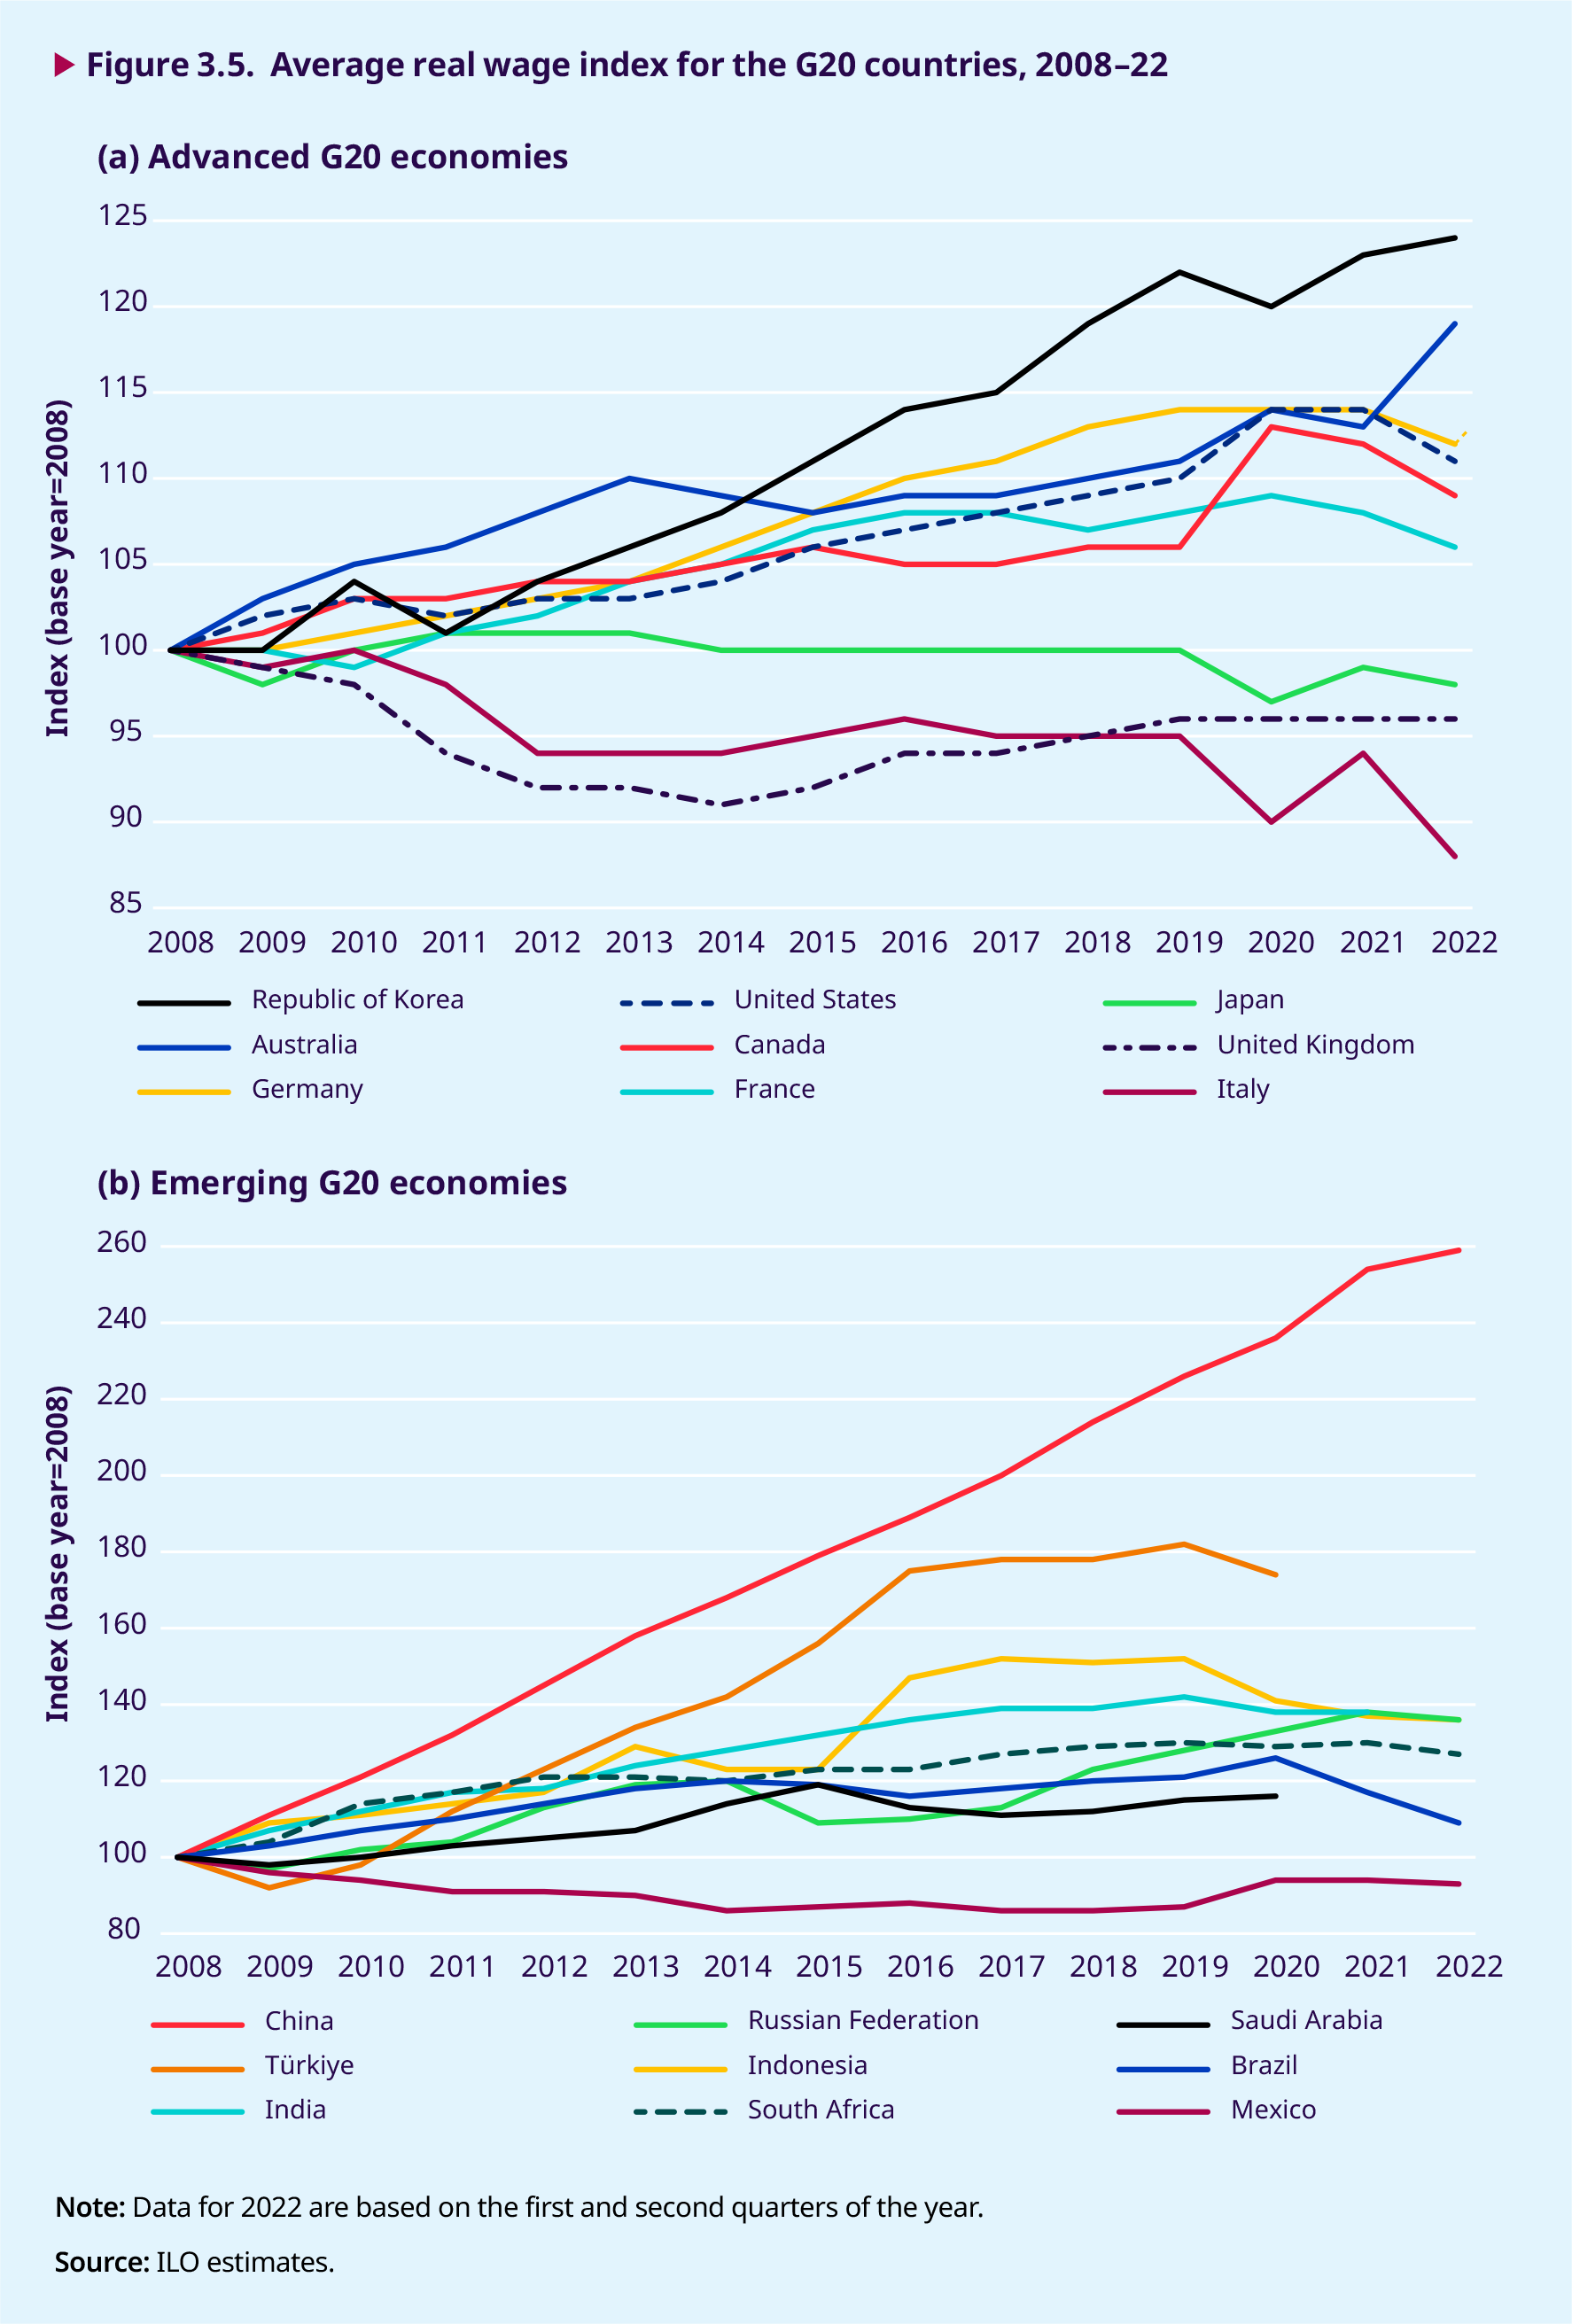
Figure 3.5 shows the evolution of real wage indices since 2008 in some advanced and emerging G20 economies. Among the former, a combination of, on the one hand, composition effects during 2020, which faded away in 2021, and, on the other, a rapid rise in inflation (2021–22) has resulted in sharp jumps in the index value for several of these countries. Together, Australia and the Republic of Korea exhibit strongly rising real wage growth during 2008–22, whereas Italy, Japan and the United Kingdom are the only countries in the sample of advanced G20 economies where wages in 2022 are below their real value in 2008. Real wages in 2022 were worth 12 per cent, 2 per cent and 4 per cent less than in 2008 in Italy, Japan and the United Kingdom, respectively.
Among the emerging G20 economies, China con- tinues to dominate the ranking in real wage growth, with estimates showing that monthly wages there in 2022 were about 2.6 times their real value in 2008. Except for Mexico, in 2022 all emerging G20 economies exhibit average monthly wages that are higher in real terms than the baseline (2008). In Mexico, real wages continue to trend at 7 per cent below their real value in 2008.
Despite more rapid wage growth among emer- ging G20 economies, there is still a significant gap between their average level of real wages and that of advanced G20 economies. Conversion of all the G20 countries’ average wages into US dollars using exchange rates based on purchasing power parity yields a simple average wage of about US$4,000 per month in the advanced economies and about US$1,800 per month in the emerging economies.
.3.4. Wages and productivity trends in high-income countries
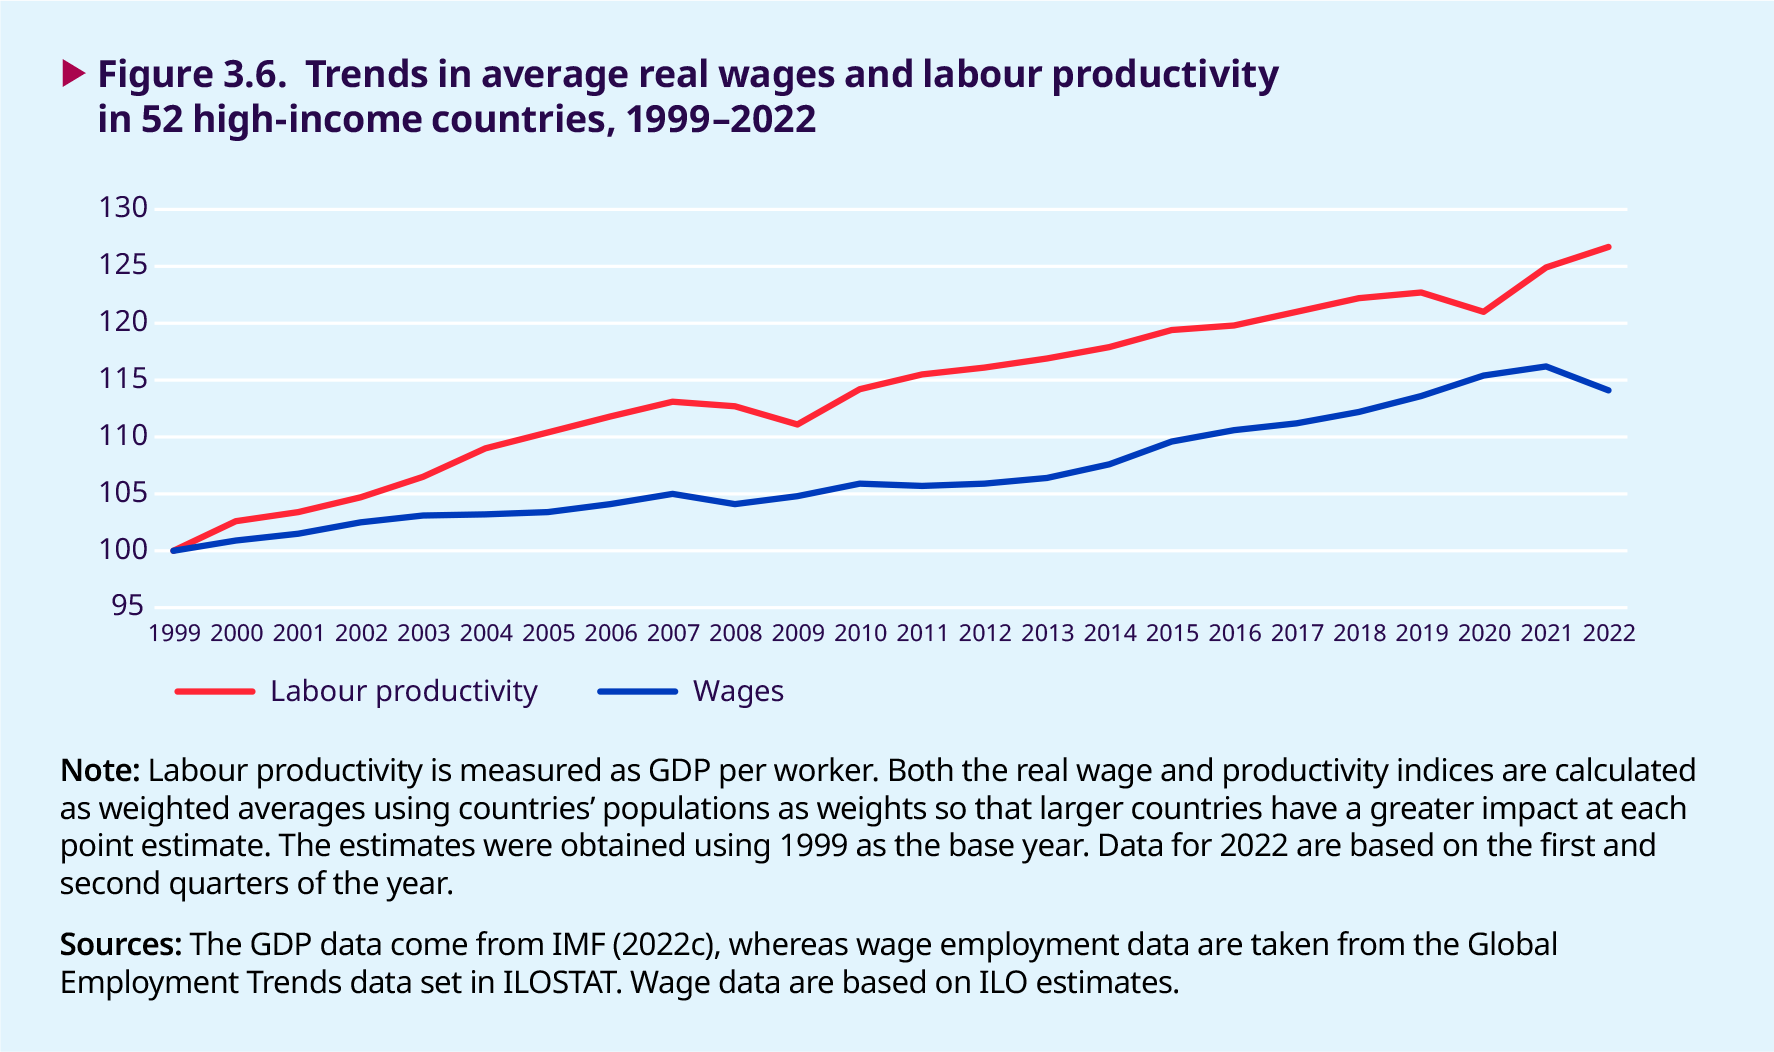
Productivity growth, and particularly real labour productivity growth, is a key factor in achieving real wage growth. As pointed out in previous editions of the Global Wage Report, average wage growth has lagged behind average labour productivity growth since the early 1980s in several large developed economies. Figure 3.6 shows that this continues to be true, on aggregate, in 52 high-income countries, where the gap between real productivity and real wage growth between 1999 and 2022 reached 12.6 percentage points in 2022, reflecting a further increase in the gap between the two series since 2019. Overall, figure 3.6 shows that, in real terms, labour productivity has increased more rapidly than wages over the past 22 years, with the former growing by 1.2 per cent annually and the latter by around 0.6 per cent annually. Moreover, the figure indicates that despite the shrinking of labour productivity during the global financial crisis of 2008–09 and during the pandemic (2020) the gap between the two series has continued to increase. Just before the onset of the COVID-19 pandemic, the gap showed signs of widening further. Although the decline in labour productivity growth during 2020 momentarily stopped the two series from growing farther apart, the sharp decline in real wage growth in the first two quarters of 2022 combined with positive productivity growth has, once more, increased the gap. In fact, the gap in 2022 is at its widest since the beginning of the twenty-first century.
Wage growth has lagged behind labour productivity growth in several large developed economies in recent decades.
Figure 3.6 shows labour productivity bouncing back strongly in 2021 and 2022, while wage growth rose by about 1 per cent between 2020 and 2021 and declined in the first half of 2022. One possible rea- son for the increase in labour productivity could be that the crisis has destroyed less productive enter- prises. Surviving enterprises are likely to have of- fered services and products at a higher added value per worker to costumers left behind by disappear- ing enterprises. According to a recent study by the US Bureau of Labor Statistics, this effect could ac- count for about two thirds of the observed product- ivity surge between 2020 and 2021 (Stewart 2022). Lopez-Garcia and Szörfi (2022) argue that the con- tainment measures imposed during the pandem- ic accelerated the digitalization of enterprises, thereby increasing the value added per worker in already high value-added sectors. They point out further that the speeding up of digitalization could explain why average growth in annual real GDP per hour worked rose to 1.7 per cent in the eurozone between the last quarter of 2019 and the first quar- ter of 2021 – an increase that is more than twice the average rate over the period 2014–19. It has also been observed that in the United States corporate profits soared in 2022 (Pickert 2022).
The sharp decline in real wage growth in the first two quarters of 2022 combined with positive productivity growth has, once more, increased the gap between real productivity and real wage growth.
Beyond averages: The greater impact of inflation on the purchasing power of low-wage earners
.3.5. The cost of inflation across the income distribution
In the previous sections of this report, the rise in inflation was discussed under the premise that the increase in the cost of living has been the same for all households. This section shows that such an as- sumption is incorrect and that households at the bottom of the income distribution face a greater cost-of-living burden when prices are high and ris- ing. Hence, even if nominal wages are adjusted for price inflation as measured by the consumer price index (CPI), the wages of earners in low-income households will suffer a greater loss in purchasing power than those of their counterparts in higher-in- come households.
Within countries, the spending pattern of households varies according to their location on the household income distribution. Low-income households – as measured on a per capita basis – have less leeway, since they spend a greater proportion of their smaller incomes on basic items such as food, housing and utilities. At the upper end of the income distribution, a larger income allows these households to cover their basic needs while at the same time leaving them with ample margin to spend on other items (such as health, education or culture) or to build up their savings with a view to protecting themselves against future uncertainties, including those arising from potential new crises. There are many studies that examine how the share of household expenditure on basic needs varies across income groups. For example, Whitmore- Schanzenbach et al. (2016) found that in the United States, low-income households, defined as the bottom 20 per cent of the income distribution, spend 82 per cent of their income on basic needs, including 41 per cent on housing and about 15 per cent on food. In contrast, middle-income households spend 78 per cent of their income on basic needs, including about 33 per cent on housing and 13 per cent on food. When households are fractioned grouped into smaller quantiles, the difference in spending patterns between households at the bottom lower and upper ends of the income distribution top households increases further. Similar observations seem to apply to all regions and countries in the world. Cross-country studies provide evidence suggesting that the ratio of spending on basic goods between high- and low- income households is higher in low- and middle- income countries than in high-income countries (see, for example, Clements and Theil 1996).
Households at the bottom of the income distribution face a greater cost-of-living burden when prices are high and rising.
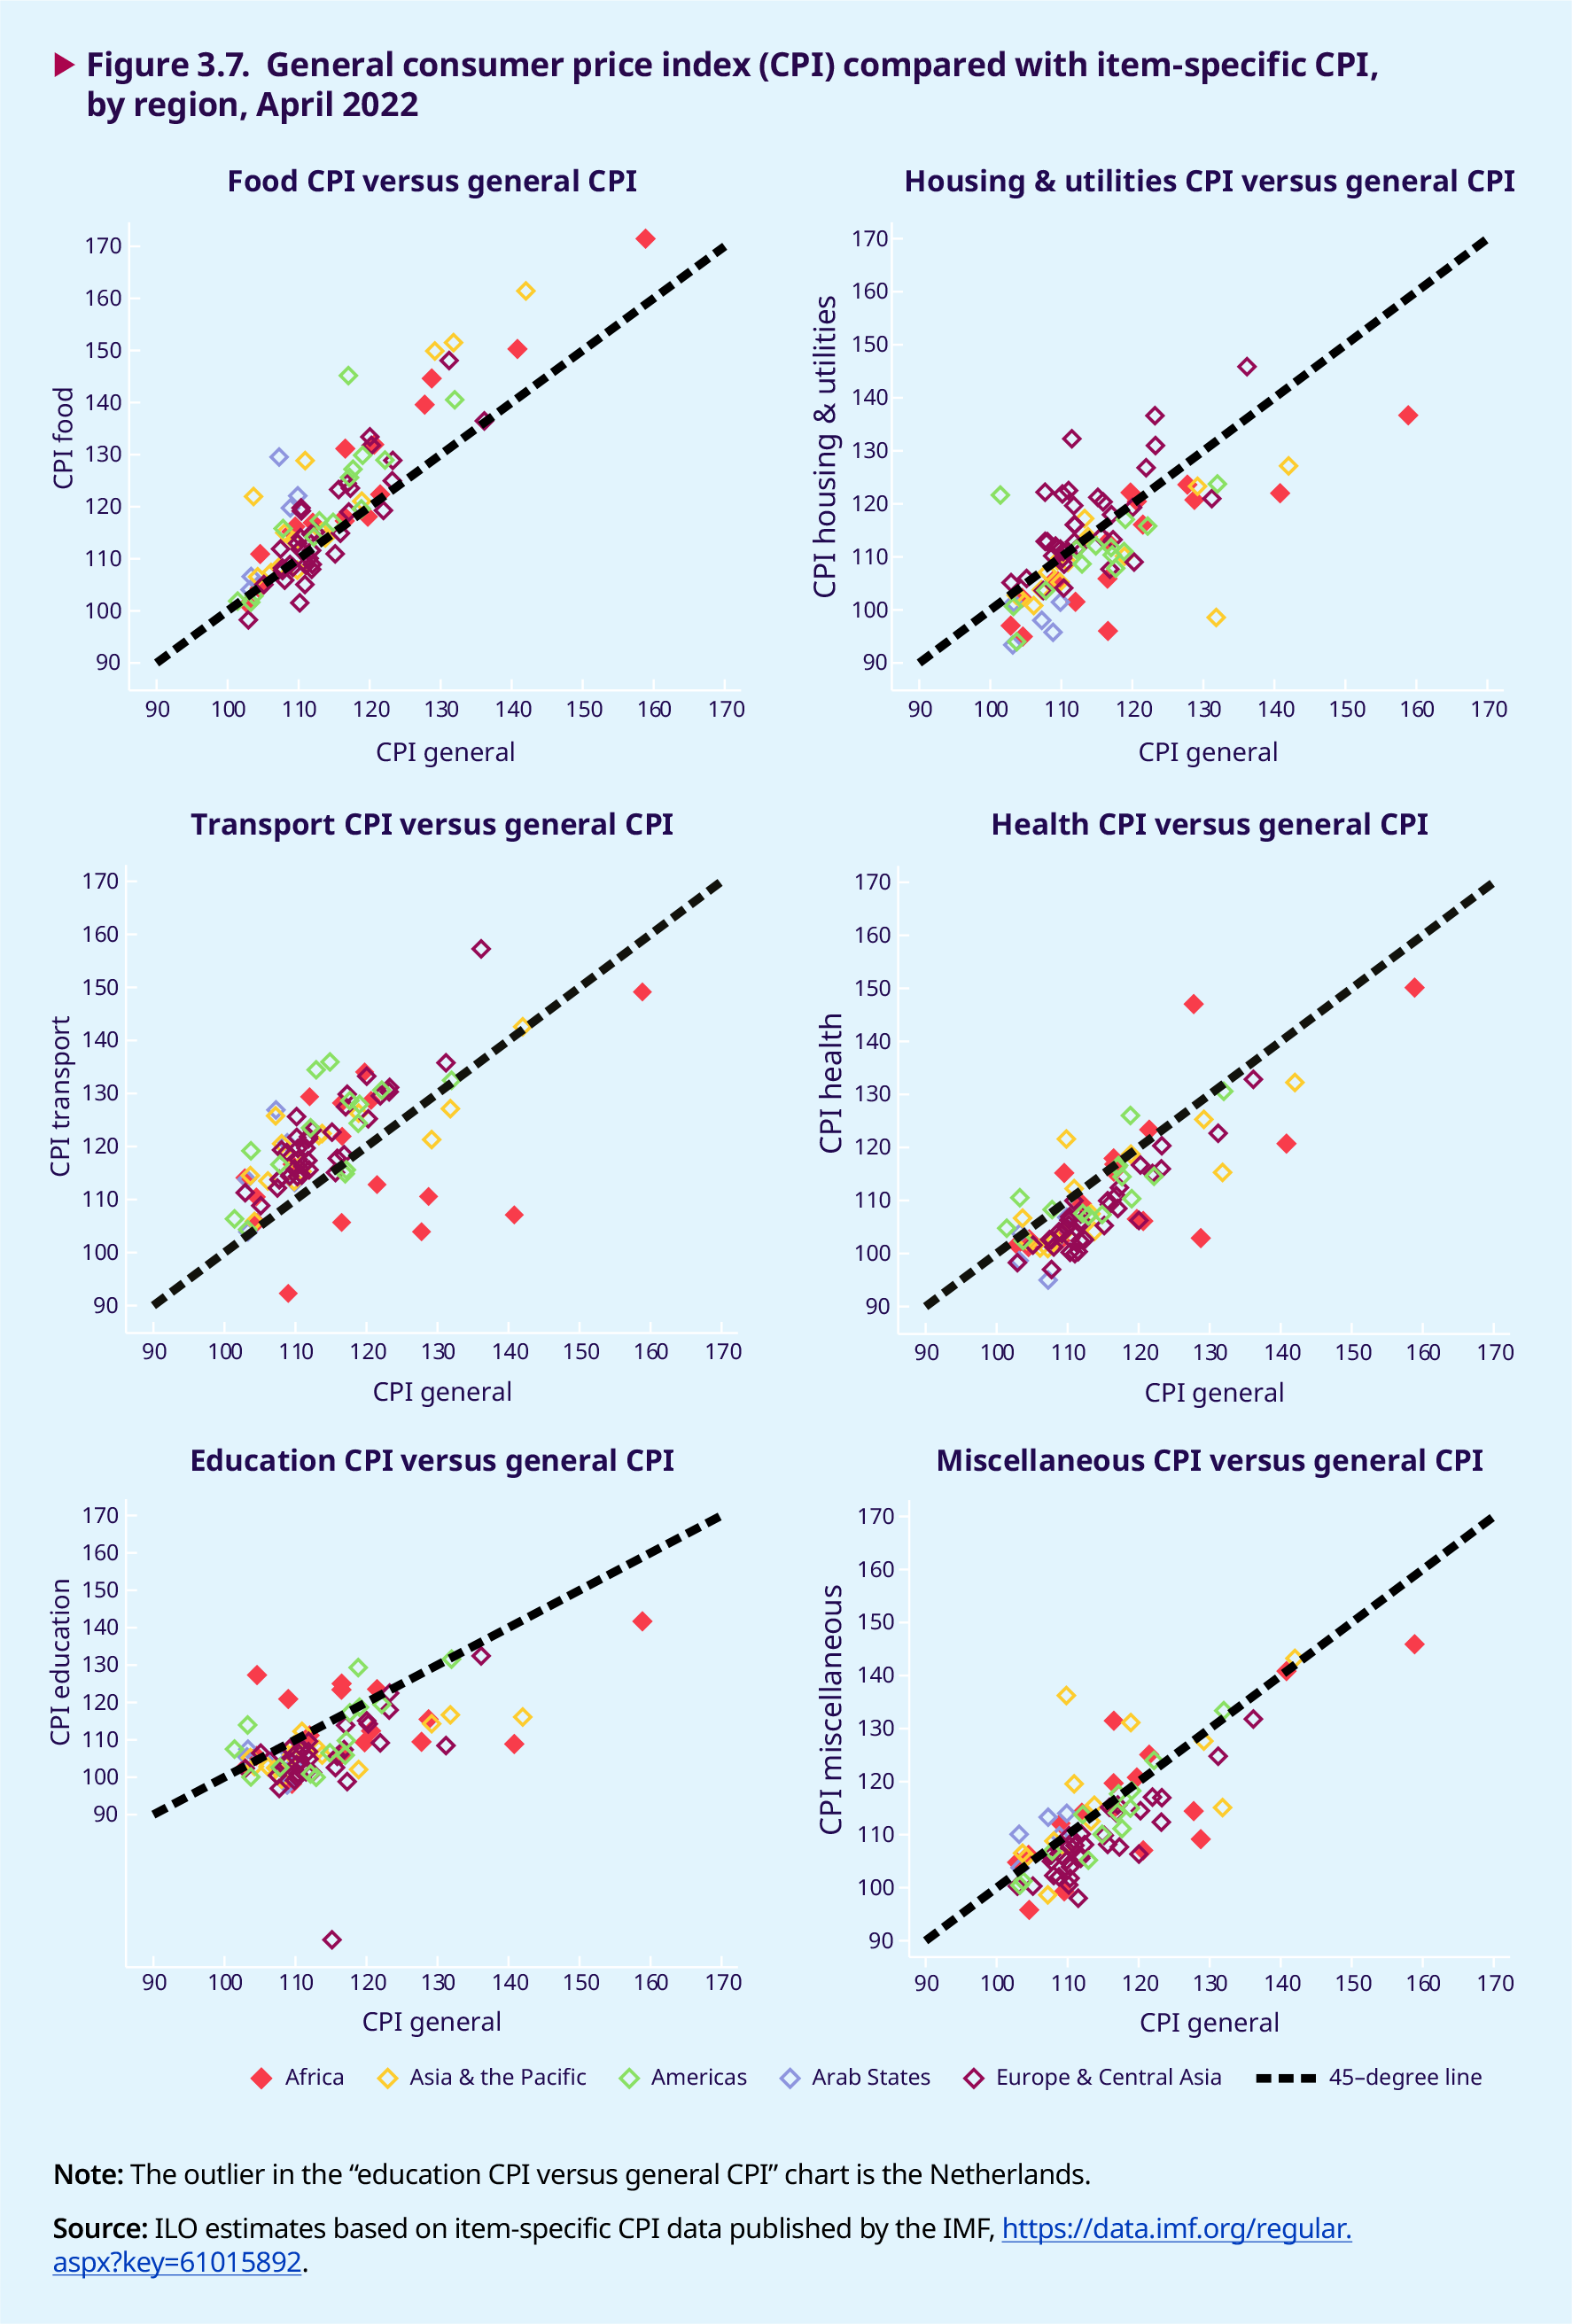
Different spending patterns have implications for the cost of living as measured by the CPI. Typically, the CPI is constructed using a basket of goods and services (including food, housing and transport) that reflects the average spending patterns of a large proportion of households in the population (see box 3.2). These patterns are captured by allocating weights to each item in the basket. For example, in 2022, the construction of the CPI in the United States gives a 13.4 per cent weight to the category “food” and a 32.4 per cent weight to the category “housing” (United States of America, BLS 2022). In France, the category “food” receives a weight simi- lar to that in the United States (14.7 per cent) but “housing” is assigned a much lower weight, name- ly 15.5 per cent (France, INSEE 2022). Changes in weights and in the prices of each of the items in-of weights, while the change in prices between periods is what drives the changing values of each item in the CPI basket. Since food, housing, energy and transport are essential items, demand for these goods and services does not diminish very much even when their prices increase: they are what is re- ferred to as “price-inelastic”. Likewise, many essen- tial items are susceptible to greater price volatility than other items in the CPI basket of goods and ser- vices.8 With the prices of these items rising faster, the CPI for them also rises faster and is often high- er than the CPI summarizing the general price level. Figure 3.7 compares the main groups of item-specif- ic CPI – food, housing, transport, education, health and miscellaneous – with the general CPI for about 100 countries drawn from all geographical regions. As can be seen there, food, housing and transport CPIs are all higher than the composite general CPI, which is generally used in discussions about wages. What is the implication of this for low-income households, in which low-wage earners are like- ly to be concentrated? When low-income house- holds spend a greater share of their income on items that exhibit a higher CPI, the composite gen- eral CPI underestimates the true increase in the cost of living faced by these households. Table 3.1 illustrates this for Mexico, where households in the bottom decile of the income distribution spend 42 per cent of their income on food, while top-income households spend only 14 per cent. Moreover, whereas the general price index in Mexico in June 2022 had experienced a year-on- year increase of 8.2 per cent, the price index for food had increased by 14.1 per cent. Taking these cluded in the basket ultimately determine how the CPI evolves. Like other indices, the CPI is expressed with a specific period as the reference base. For example, if the CPI is 110 in 2022 based on 2019 (with the index in that year equalling 100), this means that prices have increased, in general, by 10 per cent between 2019 and 2022.
The construction or adjustment of the CPI does not take into account differences in consumption pat- terns between households across the income dis- tribution. Weights and prices may reflect regional variations, but it is the average spending patterns at the population level that drive the construction of weights, while the change in prices between periods is what drives the changing values of each item in the CPI basket. Since food, housing, energy and transport are essential items, demand for these goods and services does not diminish very much even when their prices increase: they are what is referred to as “price-inelastic”. Likewise, many essential items are susceptible to greater price volatility than other items in the CPI basket of goods and services.8 With the prices of these items rising faster, the CPI for them also rises faster and is often higher than the CPI summarizing the general price level. Figure 3.7 compares the main groups of item-specific CPI – food, housing, transport, education, health and miscellaneous – with the general CPI for about 100 countries drawn from all geographical regions. As can be seen there, food, housing and transport CPIs are all higher than the composite general CPI, which is generally used in discussions about wages.
What is the implication of this for low-income households, in which low-wage earners are likely to be concentrated? When low-income households spend a greater share of their income on items that exhibit a higher CPI, the composite general CPI underestimates the true increase in the cost of living faced by these households. Table 3.1 illustrates this for Mexico, where households in the bottom decile of the income distribution spend 42 per cent of their income on food, while top-income households spend only 14 per cent. Moreover, whereas the general price index in Mexico in June 2022 had experienced a year-onyear increase of 8.2 per cent, the price index for food had increased by 14.1 per cent. Taking these
When low-income householdsspend a greater share of their income on items that exhibit a higher CPI, the composite general CPI underestimates the cost-of-living increases they face.
Box 3.2. How are inflation rates calculated?
Inflation is probably one of the economic terms with which individuals and households are most familiar because it captures the cost of living and is often mentioned in the news. In its basic form, inflation is defined as the measure, specific to a country,1 of how much more expensive a set of goods and services has become over a certain period. For example, if inflation has increased by 2 per cent between two consecutive years, this means that 2 per cent more nominal income will be needed in the second year to maintain the same consumption of goods and services as in the first year. To estimate the increase in the cost of living between two consecutive periods, national institutions in charge of producing inflation estimates2 construct a basket of goods and services that reflect the average consumption of households in the country. The institutions in question then monitor the evolution of the prices of the goods and services included in the basket.
Household surveys are used to determine the composition of the basket of goods and services, together with the weight that each item in the basket should be assigned. These surveys are commonly structured into nine parts: food and other perishables; clothes and footwear; furniture and household goods; housing costs, including utilities and energy; health; education; food consumption outside the house; culture and recreation; and other services purchased by the household, including the hiring of gardeners, domestic workers or secretaries. The weights assigned to each item in the basket reflect the average (or typical) spending patterns among the households surveyed. Thus, changes in the spending patterns of households across the income distribution are not necessarily taken into account when constructing such weights.3 Because these surveys are not repeated annually – there is usually a five- to ten-year interval between them – the items in the basket remain relatively constant over time. Since consumption patterns vary between countries, the weight assigned to each good and service that enters a basket also varies between countries, in many cases reflecting spending patterns at the country level (see figure 3.B2).
The prices of the goods and services included in the basket are updated much more frequently. This is done by means of standardized surveys that track the price of items at regular time intervals. Price surveys vary from country to country as well as in their frequency; they can be spot surveys conducted at retail outlets and markets or they can be based on “big data”.4 The change in the price of goods and services included in the basket, over some fixed period of time, is what determines the change in the consumer price index (CPI), thereby reflecting changes in the cost of living. For example, if the year 2020 is taken as the base year in a country (2020 = 100), and consumer price inflation between January and December 2021 is estimated at 2 per cent, the CPI would equal 102 for 2021. “Core inflation” is an alternative estimate that is often used to better understand underlying and persistent inflation in a given country. When calculating core inflation, items with volatile prices (such as food and energy) are excluded, as are those with prices regulated by the government.5
Measuring inflation allows for the adjustment of nominal incomes (such as wages) so that earners and their households can maintain a similar purchasing power over time. When nominal incomes are not adjusted upwards for inflation, real income falls and, with it, people’s living standards. Inflation is often used as a key indicator to adjust wages through pre-established contracts, collective bargaining agreements and tripartite negotiations (for example, on the minimum wage). While the prices of many goods and services can adjust quite quickly to changing circumstances, contractual arrangements take longer to adjust. That is why it is often said that “wages are sticky”. In fact, wage adjustment is often done on the basis of inflation expectations rather than actual inflation rates – that is, by considering expectations of future inflation (rather than current outcomes) when drafting contractual agreements.
1. Within a country, inflation may be calculated for specific regions, including urban and rural areas.
2. These are usually the national statistical offices, but in some countries the central bank is responsible (for example, in Mexico, Peru and several other mainly Latin American countries).
3. For example, in the United States, the Bureau of Labor Statistics considers the spending patterns of households in cities and towns with at least 10,000 inhabitants, thereby covering the spending patterns of 93 per cent of the US population. As a complement, the Bureau collects information on the spending patterns of urban wage earners and clerical workers to construct an estimate of the cost of living that can be used to adjust certain categories of federal spending, such as social security benefits and food stamps.
4. Big data requires automated processing, which comes with its own challenges, particularly when price inflation is based on a basket of goods and services that changes rapidly (Leclair 2019).
5. There are other weighted baskets used to measure price changes. For example, in the United States there are two different indices of inflation – the CPI and the personal consumption expenditure price index – which vary mainly in how they measure price changes and the basket of goods. Other indices used to measure price changes include broader categories of expenditure that are less closely linked to the consumption patterns of households, such as the GDP deflator, which includes military expenditure and other government consumption expenditures. For a discussion of different price indices see ILO (2014, box 4).
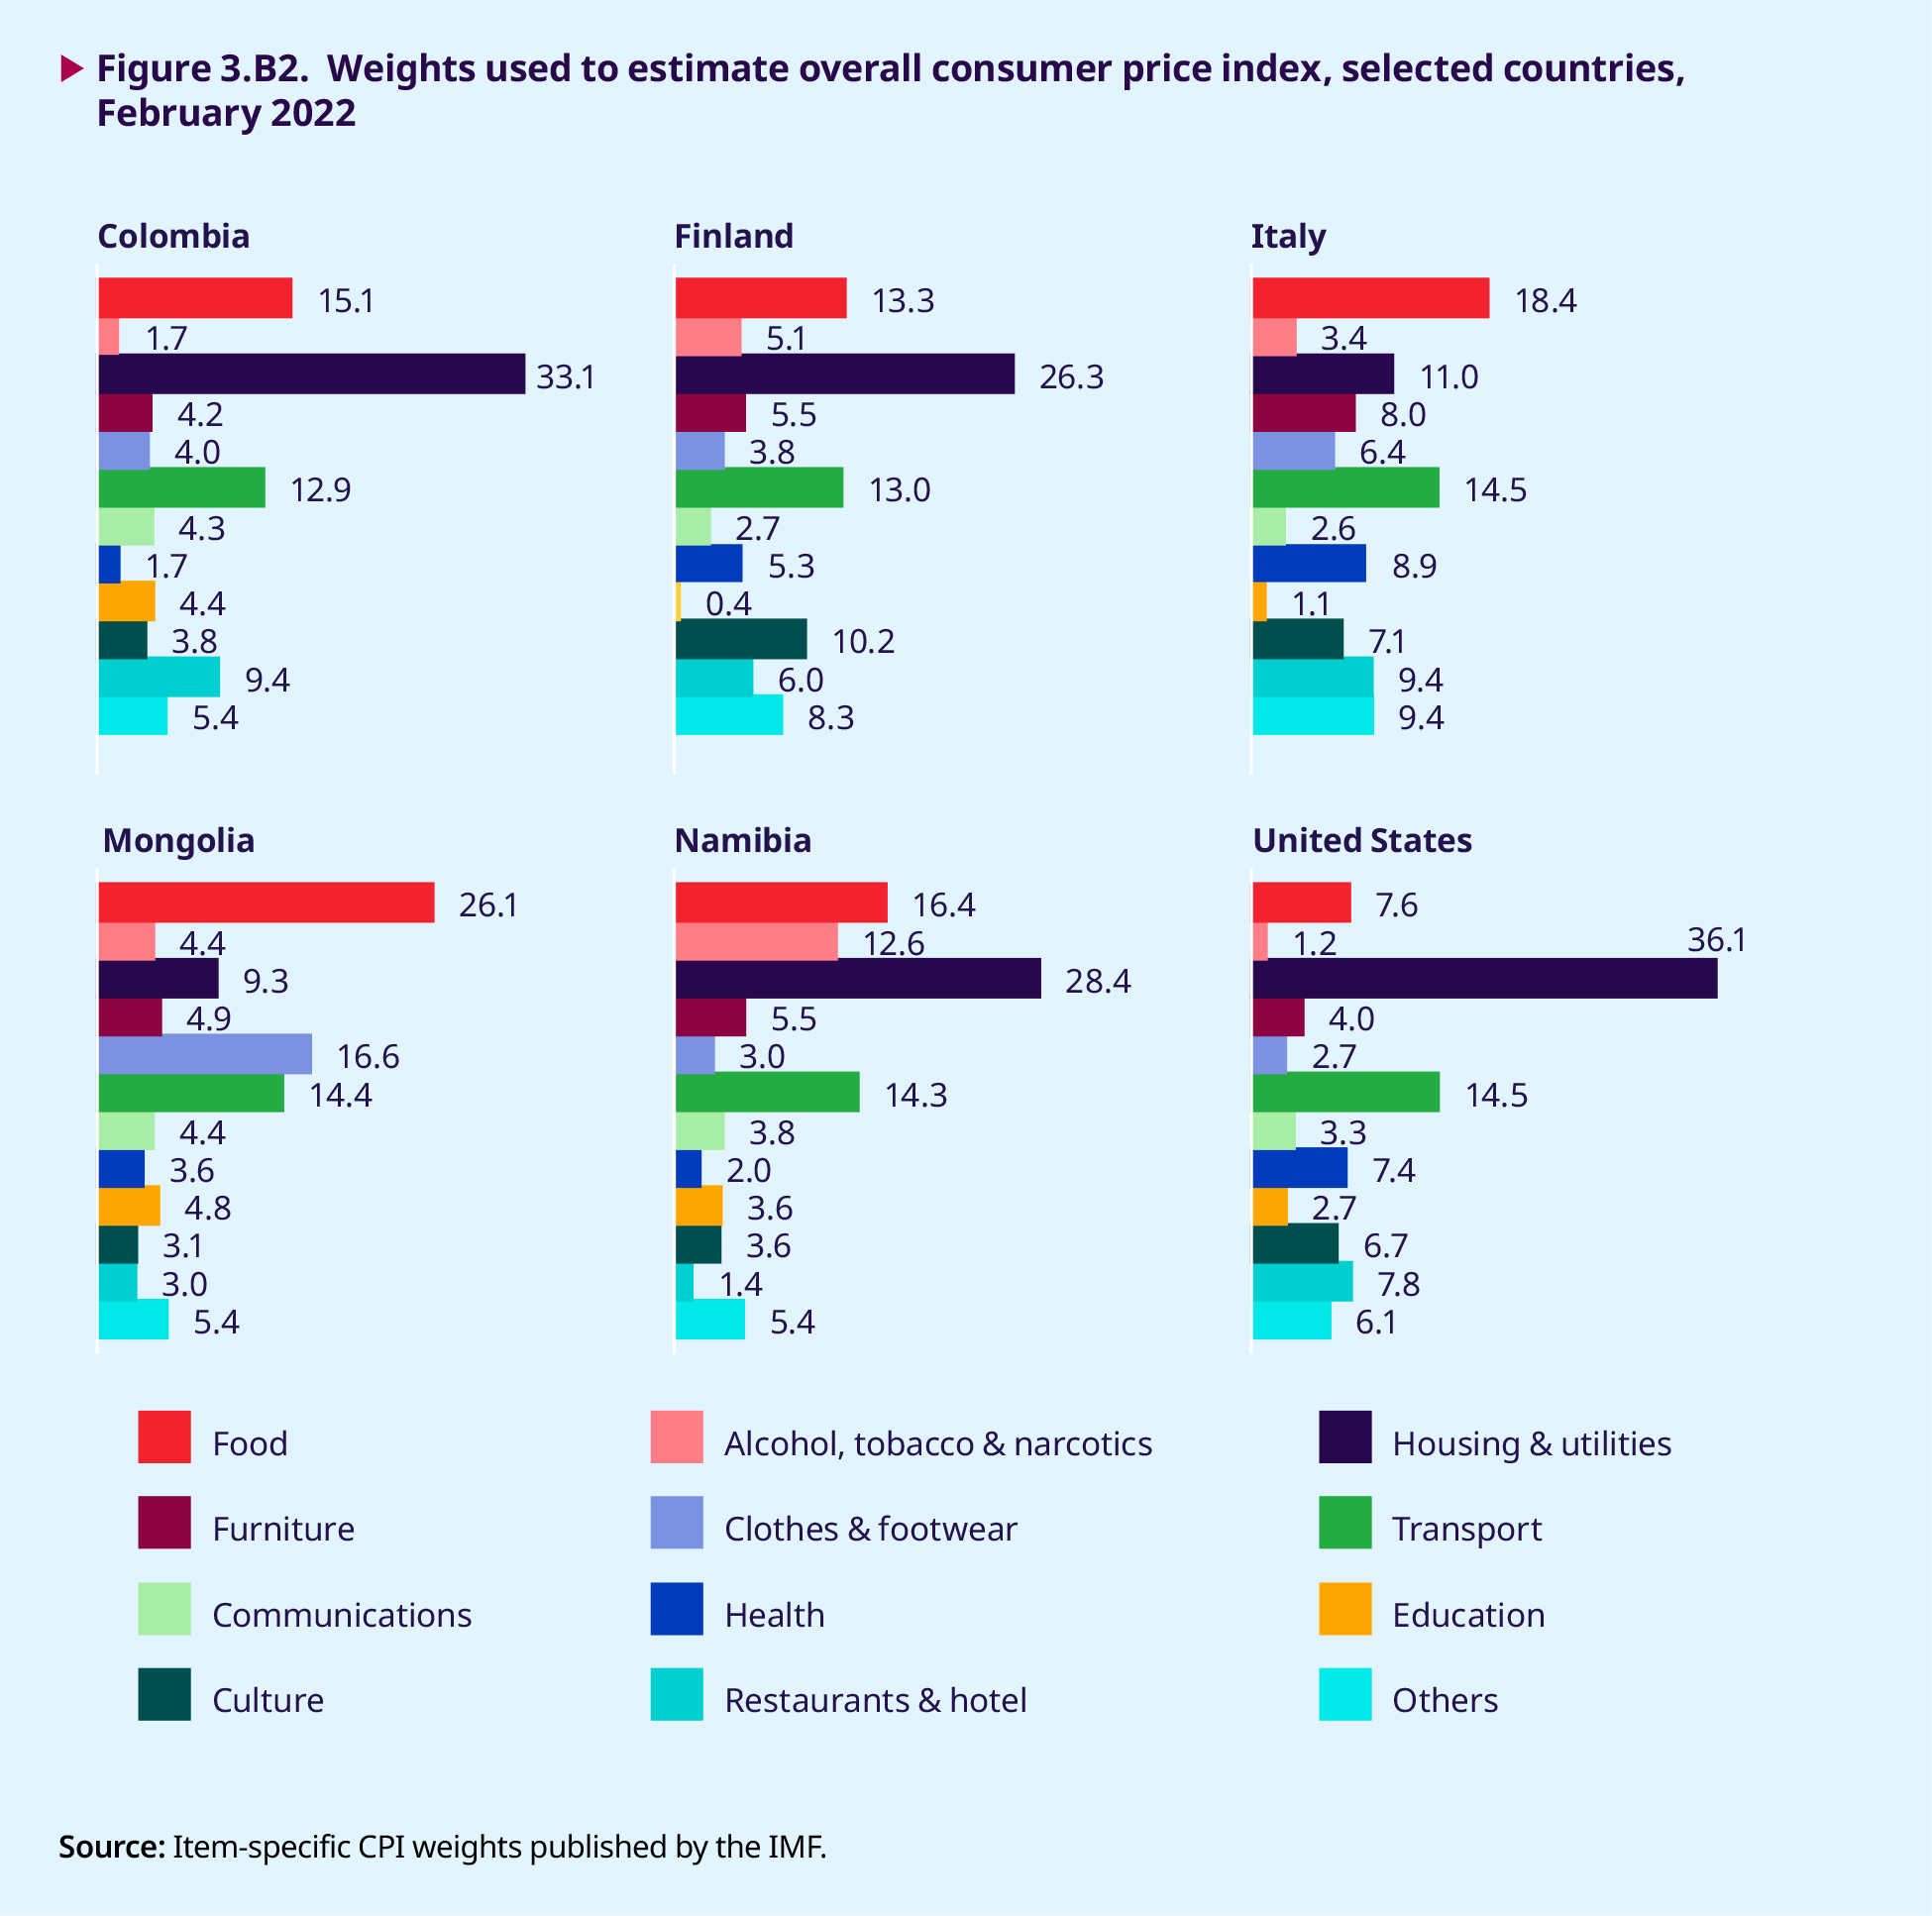
Table 3.1. Spending patterns in the top and bottom deciles of the household income distribution and changes in consumer price index (CPI), by item in CPI basket, Mexico and Switzerland, 2021–22
|
Mexico |
Switzerland |
|||||
|---|---|---|---|---|---|---|
|
Spending share of bottom decile (%) |
Spending share of top decile (%) |
% change in prices ( June 2021–June 2022) |
Spending share of bottom decile (%) |
Spending share of top decile (%) |
% change in prices ( June 2021–June 2022) |
|
|
Food and non-alcoholic beverages |
42.2 |
13.9 |
14.1 |
14.5 |
10.2 |
1.9 |
|
Alcoholic beverages, tobacco and narcotics |
3.8 |
1.6 |
8.2 |
2.3 |
1.7 |
1.6 |
|
Clothing and footwear |
3.8 |
4.9 |
5.6 |
2.8 |
4.6 |
2.0 |
|
Housing, water, electricity, gas and other fuels |
21.0 |
17.2 |
2.7 |
37.4 |
20.9 |
4.6 |
|
Furnishings, household equipment and routine household maintenance |
1.0 |
1.8 |
8.6 |
3.3 |
5.4 |
5.0 |
|
Health |
3.3 |
3.3 |
5.7 |
6.0 |
3.4 |
–0.4 |
|
Transport |
9.8 |
16.8 |
7.4 |
9.7 |
14.0 |
12.4 |
|
Communication |
2.1 |
4.6 |
–2.7 |
4.0 |
2.6 |
0.5 |
|
Recreation and culture |
n/a |
n/a |
6.1 |
8.0 |
13.7 |
1.5 |
|
Education |
5.6 |
14.9 |
3.3 |
n/a |
n/a |
0.7 |
|
Restaurants and hotels |
4.8 |
11.7 |
10.2 |
7.7 |
13.0 |
3.4 |
|
Miscellaneous goods and services |
2.6 |
9.2 |
9.1 |
4.3 |
10.5 |
0.7 |
|
% change in the cost of living in each country according to the general CPI ( June 2021–June 2022) |
8.2 |
3.4 |
||||
|
% change in the cost of living taking into account item-specific CPIs ( June 2021–June 2022) |
8.9 |
6.8 |
3.9 |
4.0 |
||
n/a = data not available
Source: ILO estimates. See Appendix I for the sources of data on spending patterns by household income deciles. Increases in item-specific CPIs were estimated using the IMF monthly CPI series.
For low-income households, even if wages were to be adjusted to reflect the general CPI, the real wage adjustment would fall short of the cost-of- living increases that they face.
differences into account, and using the increase in the price of each category of goods and ser- vices, table 3.1 shows the difference in the cost of living faced by bottom- and top-income house- holds during the period June 2021–June 2022. In Mexico, bottom-income households would have faced, on average, an 8.9 per cent increase in the cost of living between 2021 and 2022, whereas among top-income households the increase would have been, on average, 6.8 per cent. Thus, for low- income households, even if wages were to be ad- justed to reflect the general CPI, the real wage adjustment would fall short of the cost-of-living increases that they face.
Of course, the extent of the variations in cost-of- living increases across the income distribution differs between countries. Table 3.1 also provides data for Switzerland, where the shares of household income spent on essential goods by bottom- and top-income households are more similar, reflecting the fact that there is less income inequality than in Mexico. In Switzerland, the increase in the cost of living is approximately the same for the two deciles, at 3.9 per cent and 4.0 per cent for bottom- and top- income households, respectively.
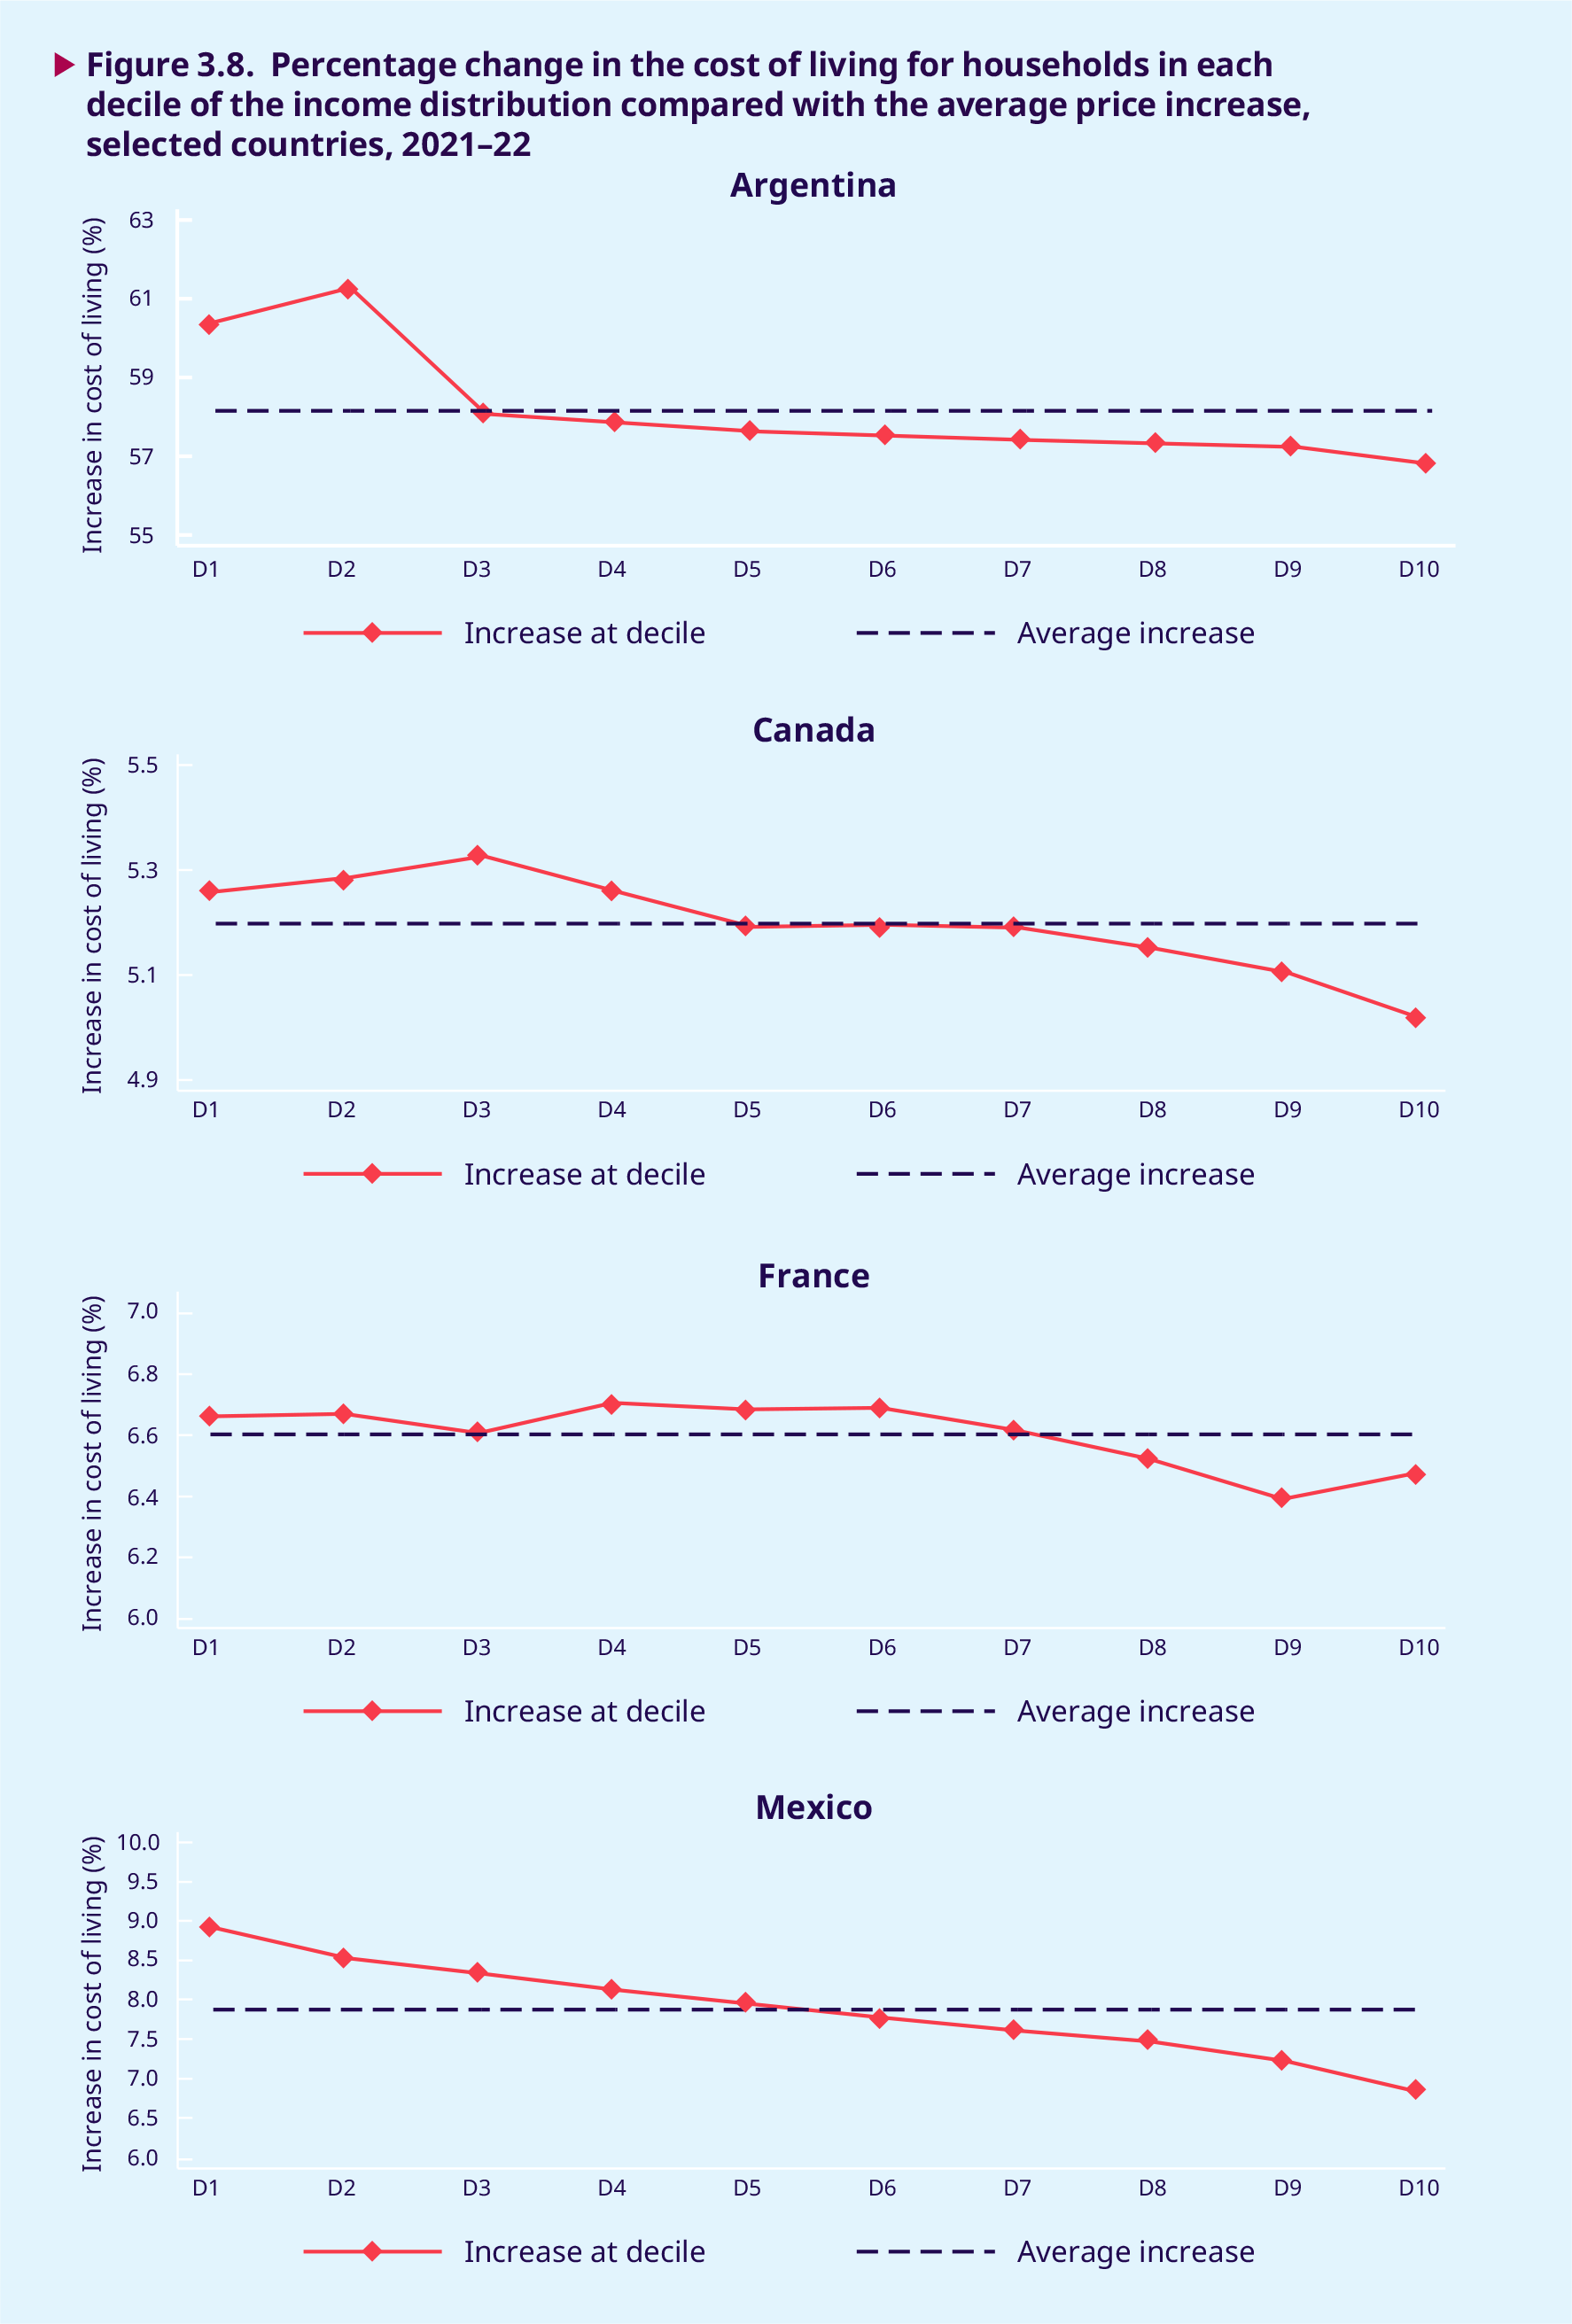
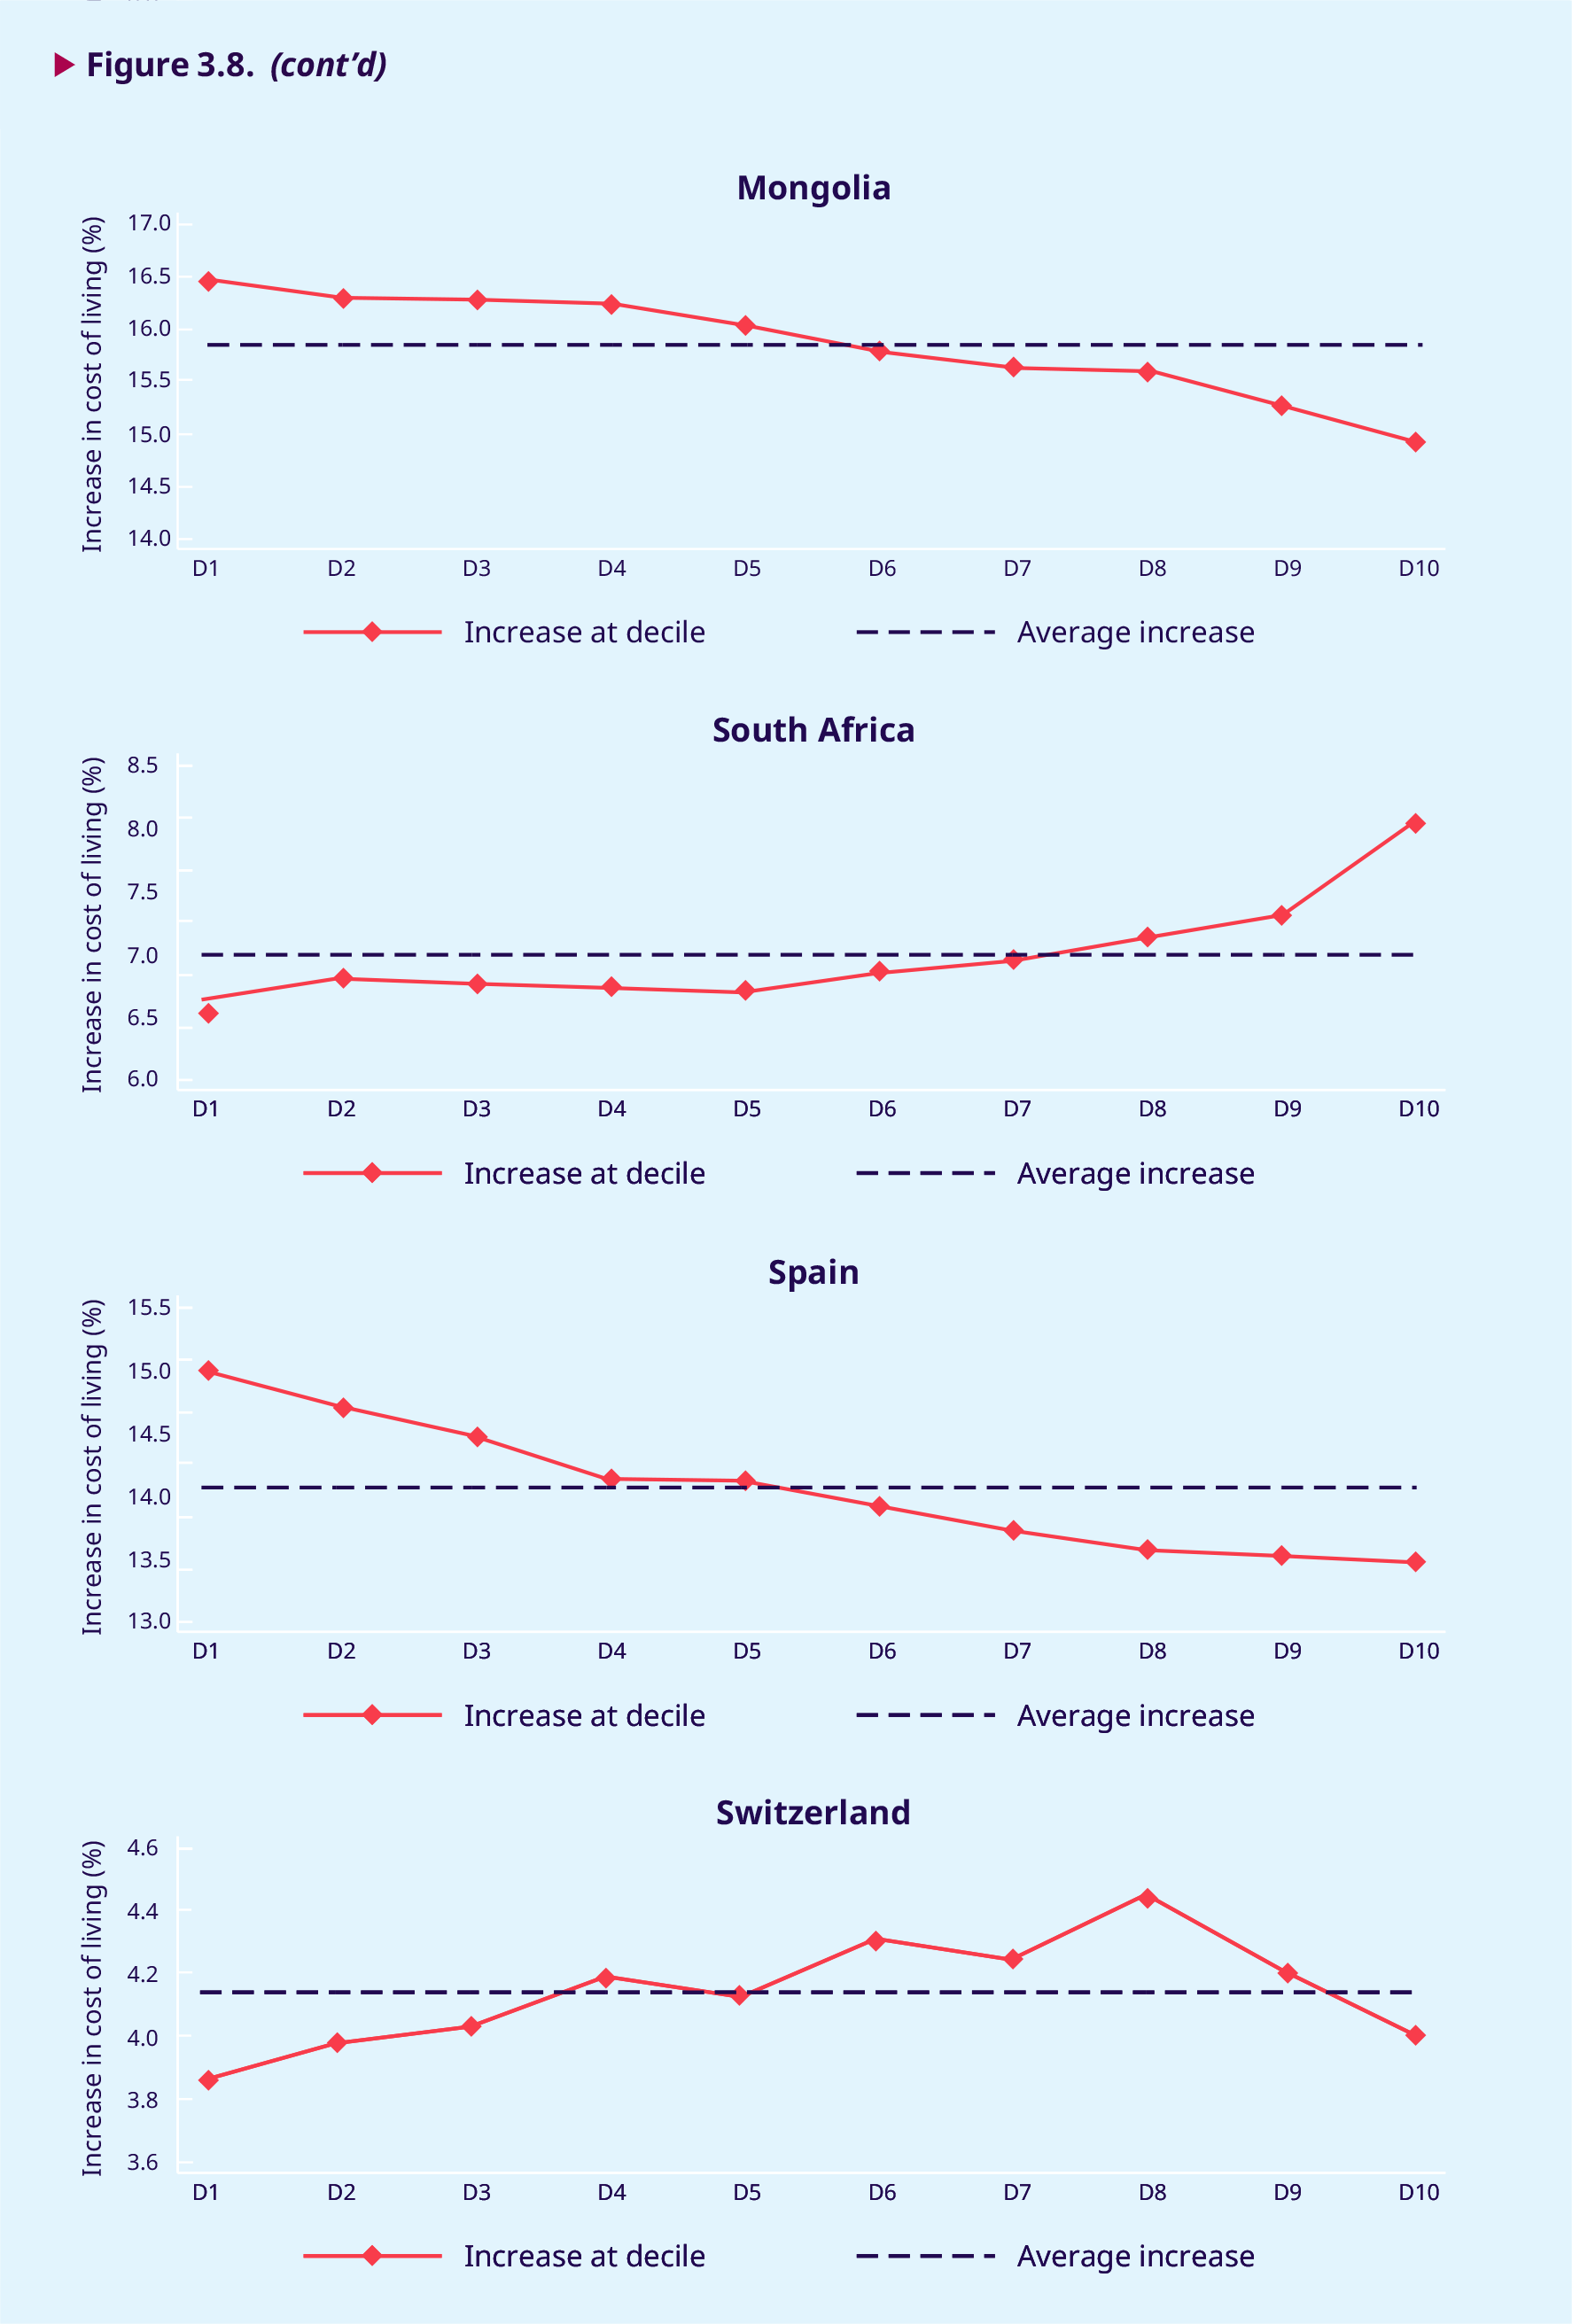
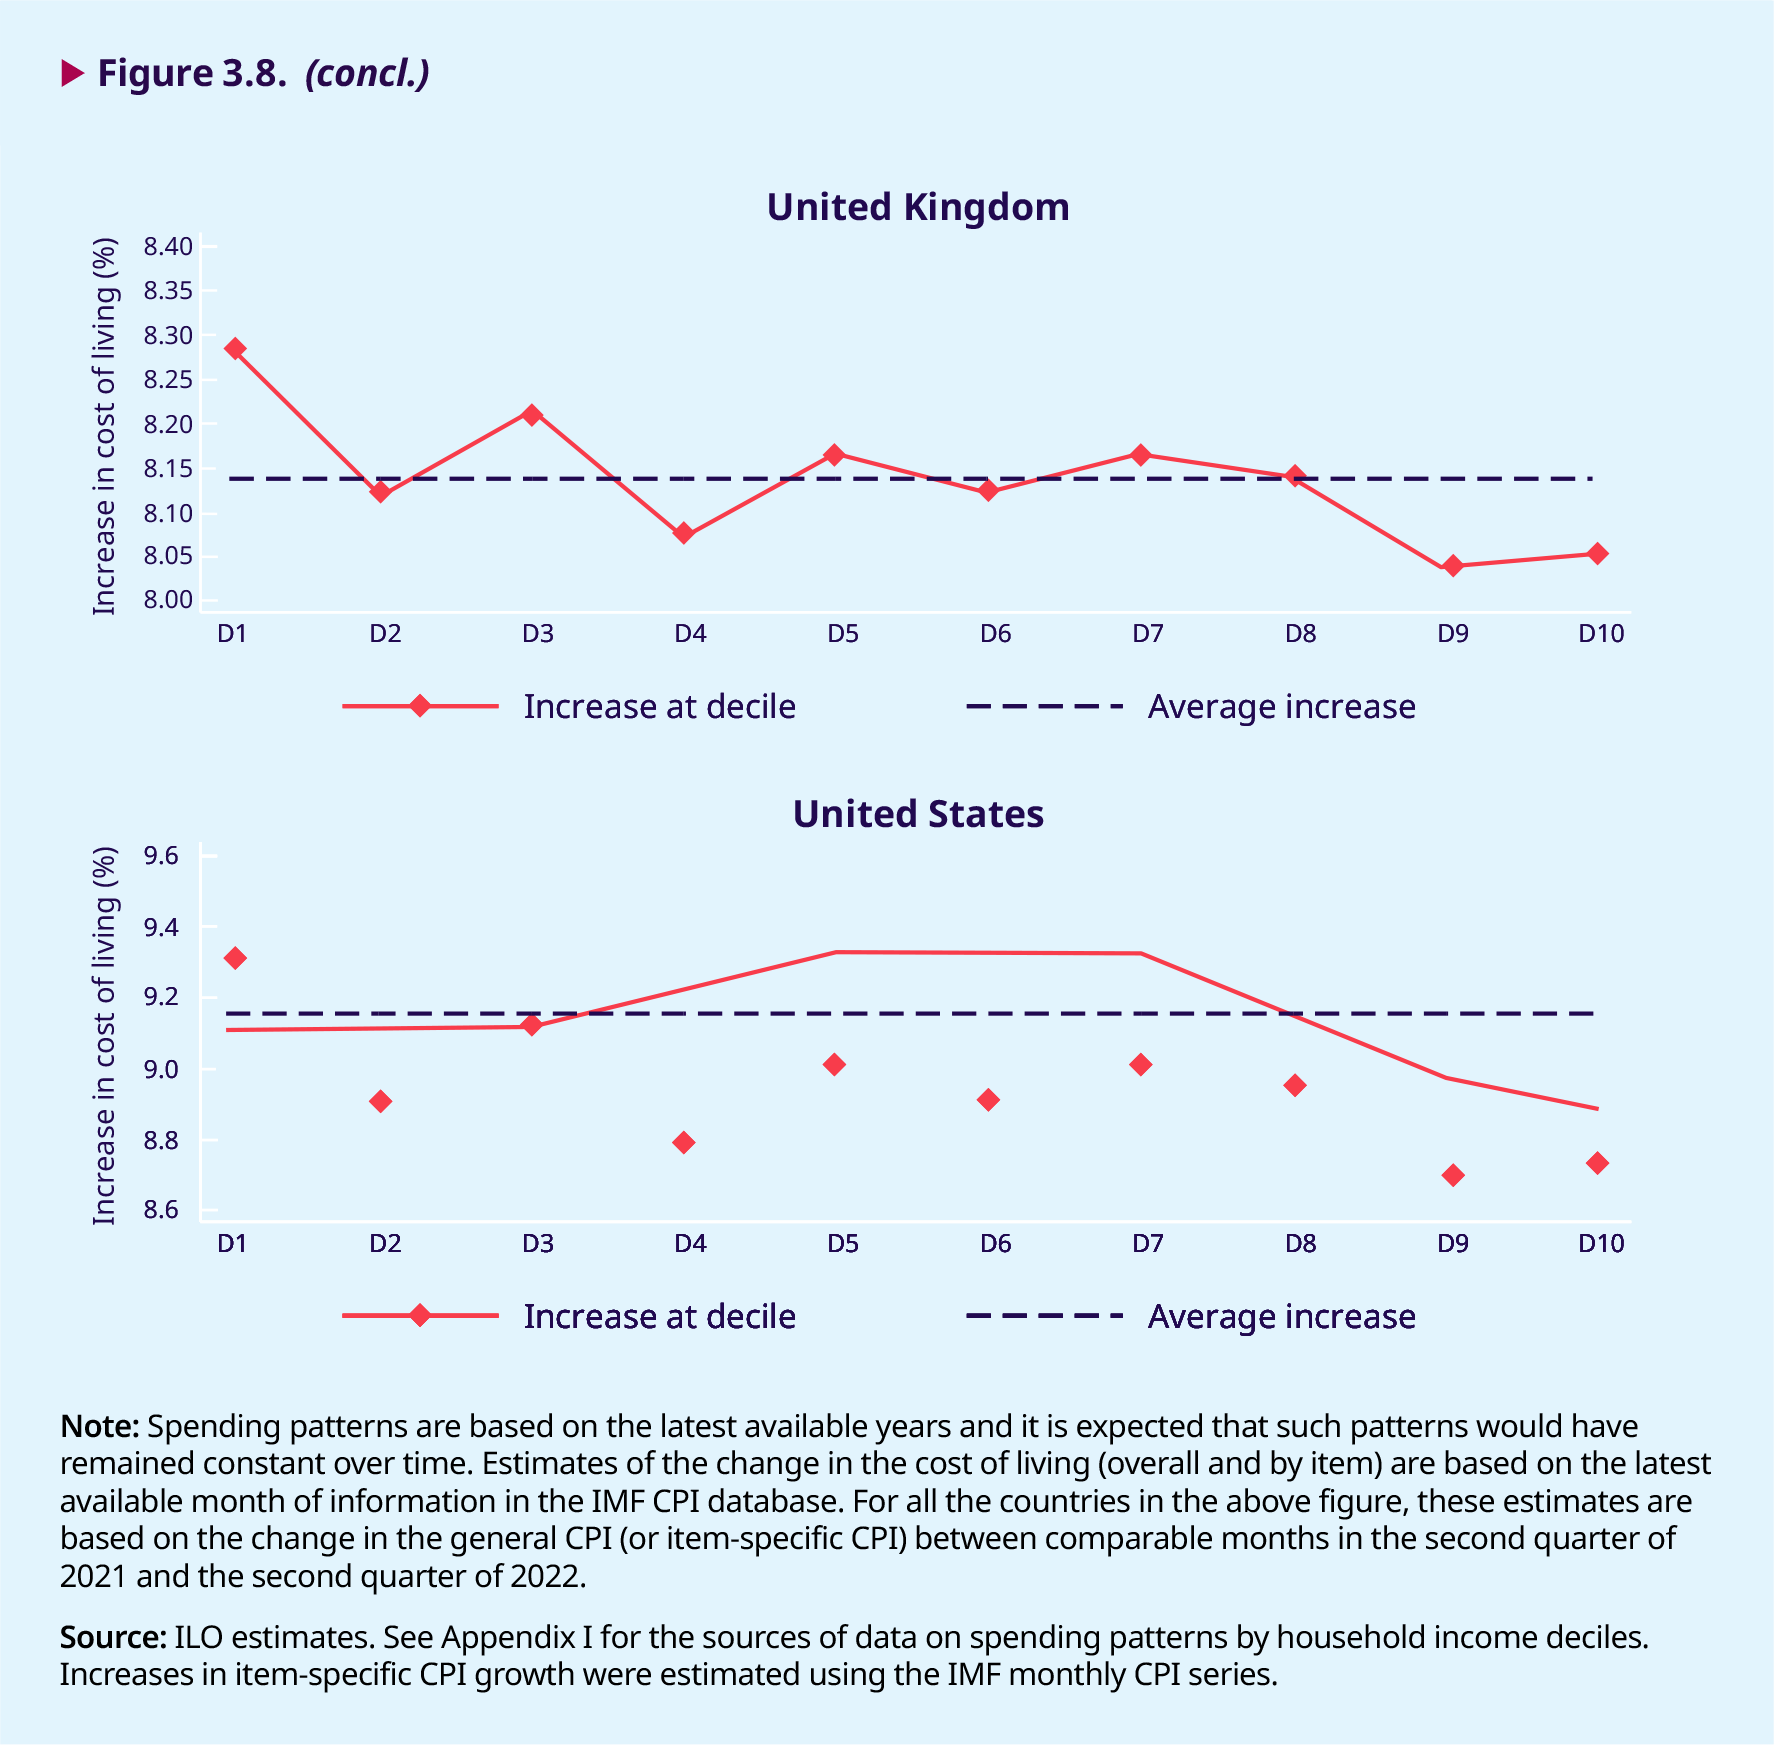
Applying a calculation similar to that in table 3.1, but this time to each decile of the household income distribution, figure 3.8 shows by how much the cost of living increased between 2021 and 2022 at each decile for countries with available data on spending across the income distribution. For a majority of countries, it can be seen that the increase in prices between 2021 and 2022 implied greater increases in the cost of living at the lower deciles of the income distribution, while the increase in the cost of living declines steadily at higher deciles. For example, in Spain, price changes in 2021–22 increased the cost of living by 15 per cent for households in the bottom decile, while the increase was 2 percentage points lower (at 13 per cent) among households in the top decile. In France, the difference is smaller across deciles (6.7 per cent at the bottom versus 6.4 per cent at the top), but price changes between 2021 and 2022 still meant that the increase in the cost of living for households at the bottom of the income distribution was 0.3 percentage points higher than the increase for the highest-earning households. Switzerland has more variation in spending patterns among households in the intermediate deciles of the income distribution, which explains the inverse U-shape in figure 3.8.
In South Africa, the increase in the cost of living is higher for high-income households – a finding that can be explained by the rise in the cost of transport. While transport accounts for less than 1 per cent of expenditure among bottom-income households in South Africa, this share increases to about 22 per cent among households in the top decile. Significantly, transport is the CPI basket item with the greatest price increases during 2021 and 2022 (19.2 per cent). It is followed by food, the prices of which increased by 8.9 per cent over the same period, and which accounts for about 50 per cent of all spending among households in the bottom decile. If food, housing and transport were the only items considered in the computation, bottom-income households would exhibit the greatest increase in the cost of living, even though the highest-earning households spend a significant proportion of their income on transport.
The increase in prices between 2021 and 2022 resulted in greater increases in the cost of living at the lower deciles of the income distribution than at higher deciles.
.3.6. Inflation rates biting into the purchasing power of minimum wages
Minimum wages are widely used around the world to protect the incomes and purchasing power of low-paid workers and their families. As discussed in the Global Wage Report 2020–21 (ILO 2020a), the adequacy of minimum wage levels depends crucially on the ability to review and adjust rates regularly. This requires a flexible adjustment mechanism that considers prevailing circumstances, the needs of workers and their families, and economic factors. In times of price inflation, if minimum wages are not adjusted – or if they are not adjusted sufficiently to keep up with rising prices – their real value diminishes. Furthermore, as pointed out in section 3.5, even where the minimum wage is adjusted for CPI increases, this may be insufficient to fully compensate for the rise in the cost of living faced by low-income households.
In times of price inflation, the real value of minimum wages diminishes if they are not adjusted to keep up with rising prices.
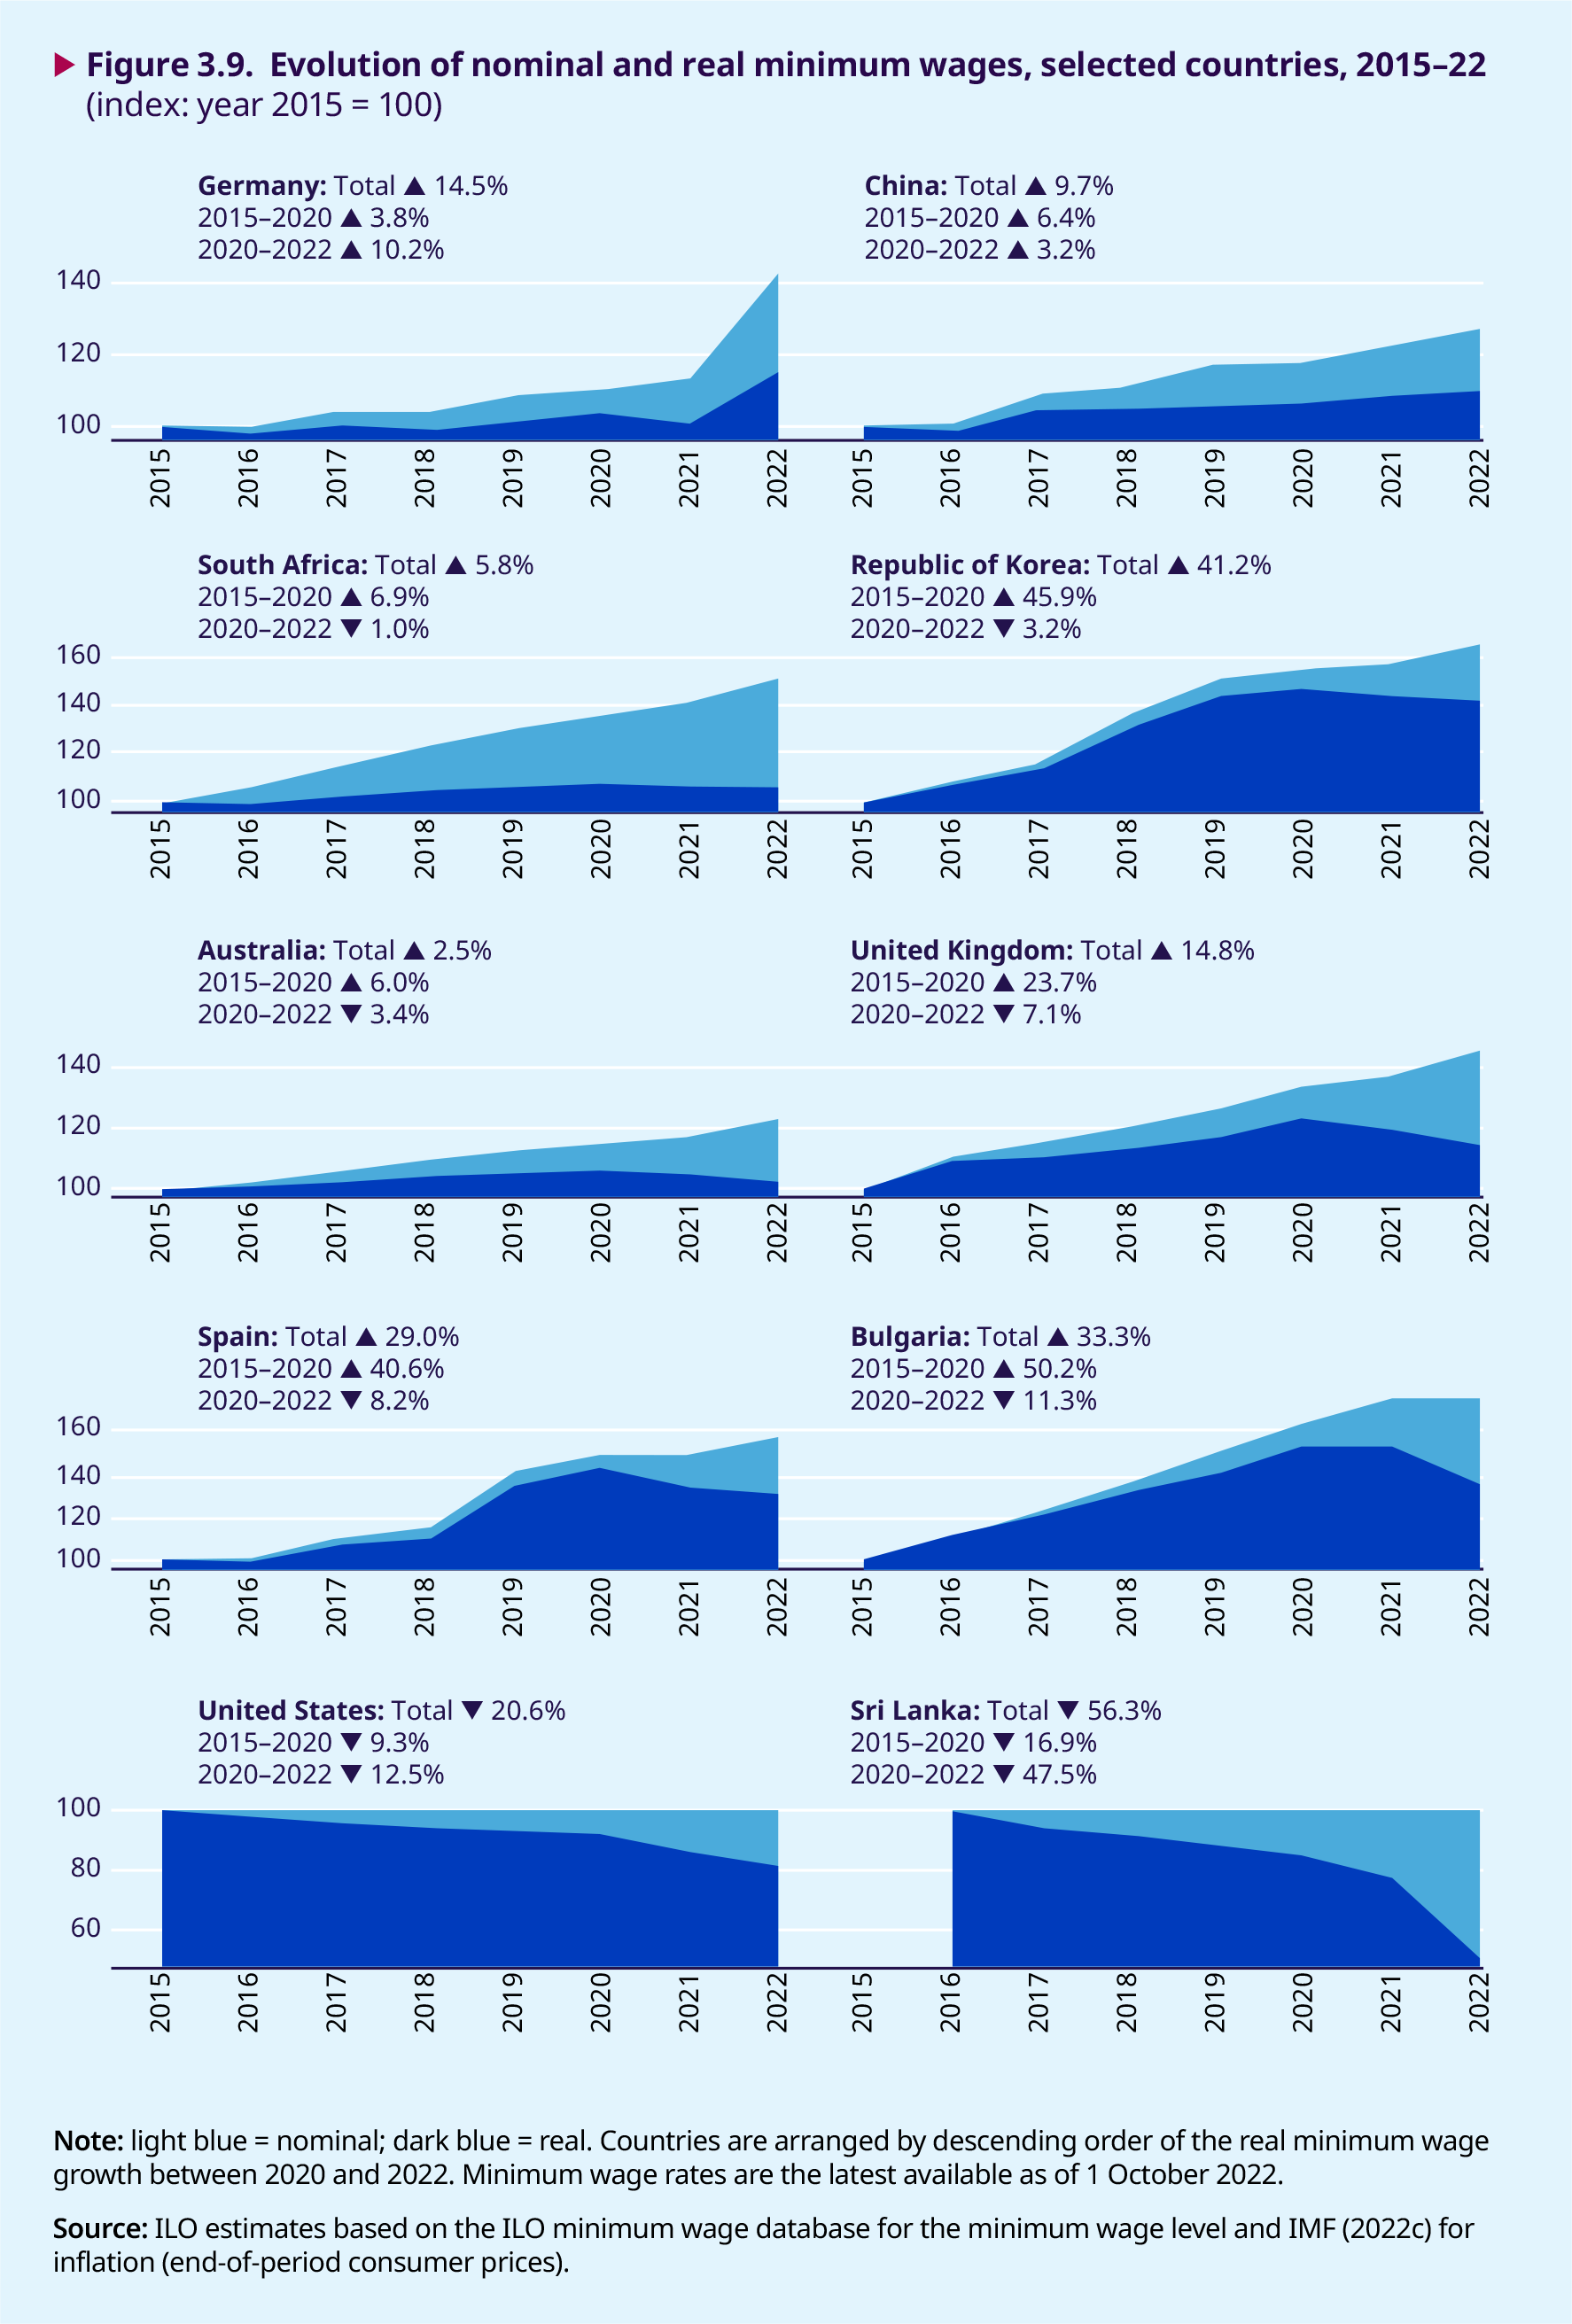
Figure 3.9 shows the relative evolution of nominal and real minimum wages (as measured by the CPI for the sake of simplicity) for seven G20 economies, two additional countries in Europe (Bulgaria and Spain) and one additional country in Asia (Sri Lanka). Among these ten countries, between 2015 and 2022, the nominal minimum wage increased in all but two countries (Sri Lanka and the United States). During 2020–22, the real minimum wage increased in four of the ten countries (Australia, China, Germany and South Africa), thus decreased owing to rising inflation in the remaining six countries displayed in the figure.
How have the total wages earned by women and men been affected by the COVID-19 crisis and inflation?
.3.7. Evolution of the total wage bill before and during the COVID-19 crisis
The recent erosion of real wages due to inflation comes on top of significant wage losses incurred by workers and their families during the COVID-19 crisis, which are not fully captured in the data on average wages presented in the previous sections of the report. This section therefore seeks to complement the earlier analysis by looking at changes in the total real wage bill. An analysis of total wage bills reveals how, during the lockdown months, the combination of job losses, shorter hours worked and adjustments to hourly wages resulted in an accumulation of lost earnings for wage employees and their families in many countries.
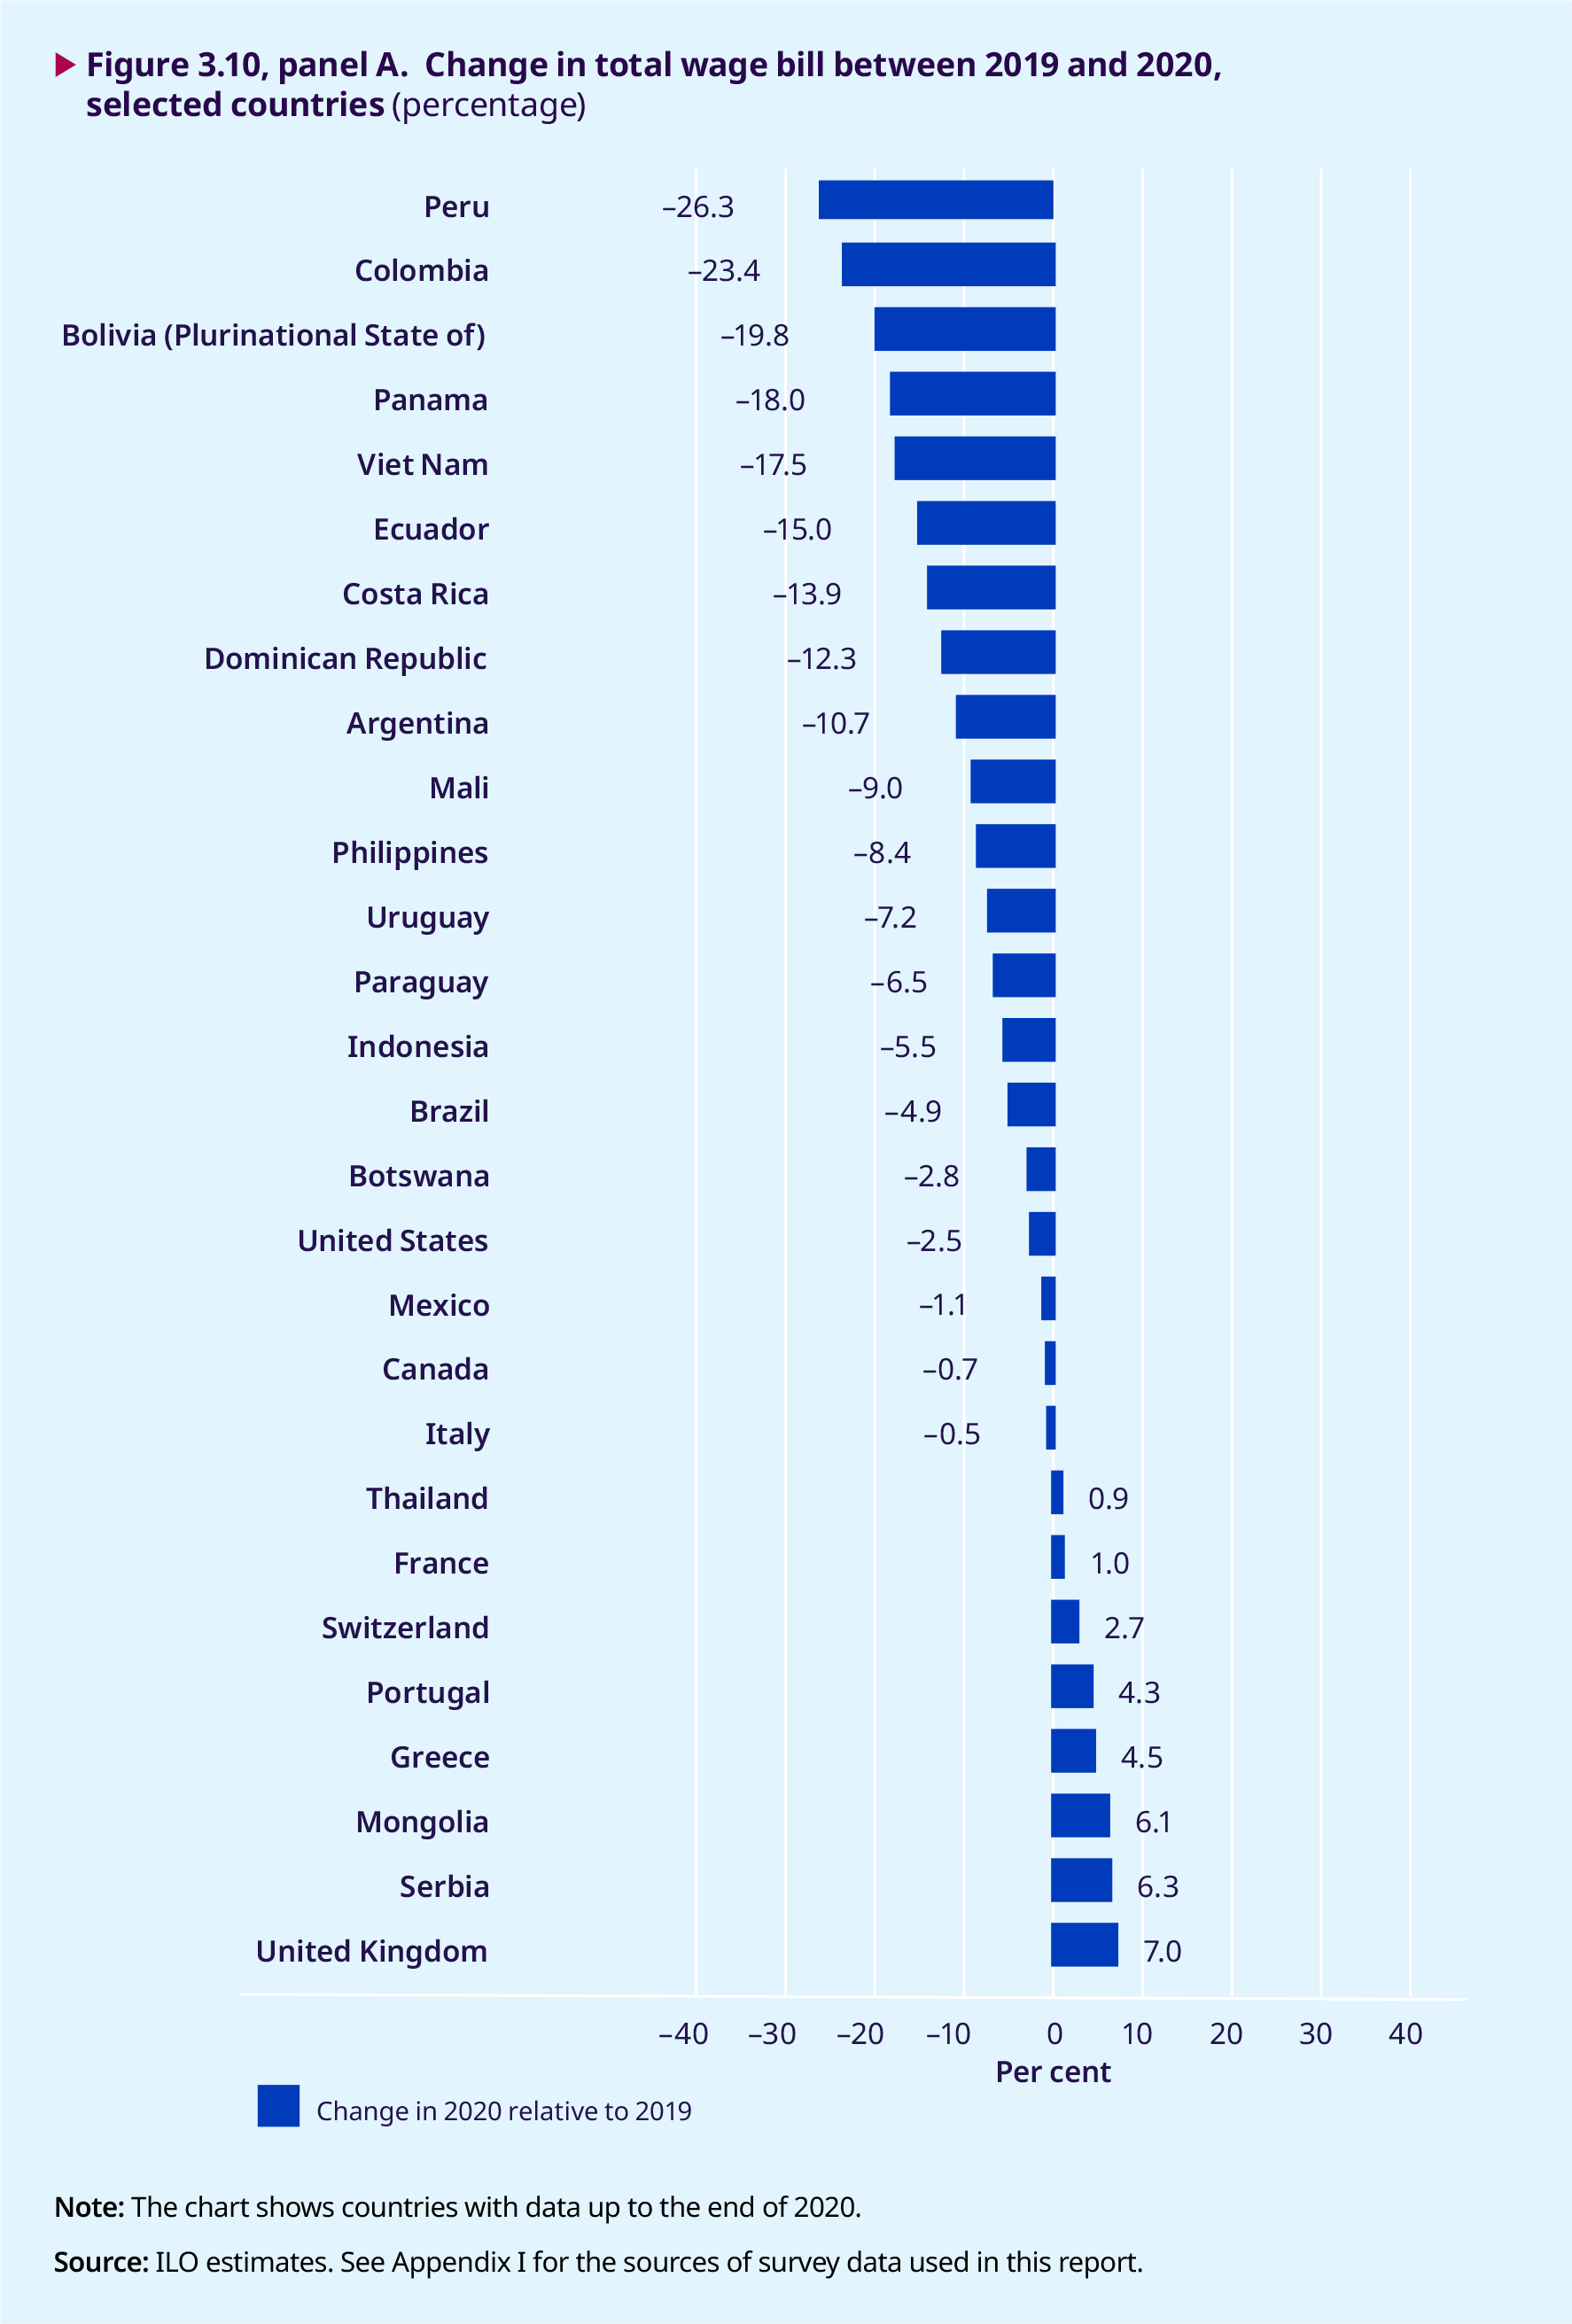
Drawing on quarterly survey data, figure 3.10 shows, for each country that provides such data, the change in the annual total real wage bill between 2019 (the base year) and each of the years up to the latest year, that is, 2020, 2021 and, for some countries, the first or second quarter of 2022. The annual total real wage bill equals the sum of real monthly earnings received by all wage employees in one year.
At the end of 2020, as may be seen in figure 3.10, panel A, 20 of the 28 countries shown in the chart had experienced a decline in the total real wage bill relative to 2019. The loss in total real wages ranged from about 1 per cent in Canada, Italy and Mexico to above 20 per cent in Colombia (23 per cent) and Peru (26 per cent). Considering all 28 countries in the chart, the average decline in the total wage bill was 6.2 per cent per country, which is equivalent to the loss of three weeks of earnings, on average, for each wage employee represented in these 28 countries. Out of the eight countries in which the total real wage bill increased, six are in Europe and two in Asia. In the European countries this was probably driven by stimulus packages (wage subsidies and job retention schemes) that helped to keep wage employees in the labour market during 2020. Wage subsidies are included in the sum of the total wage bill.
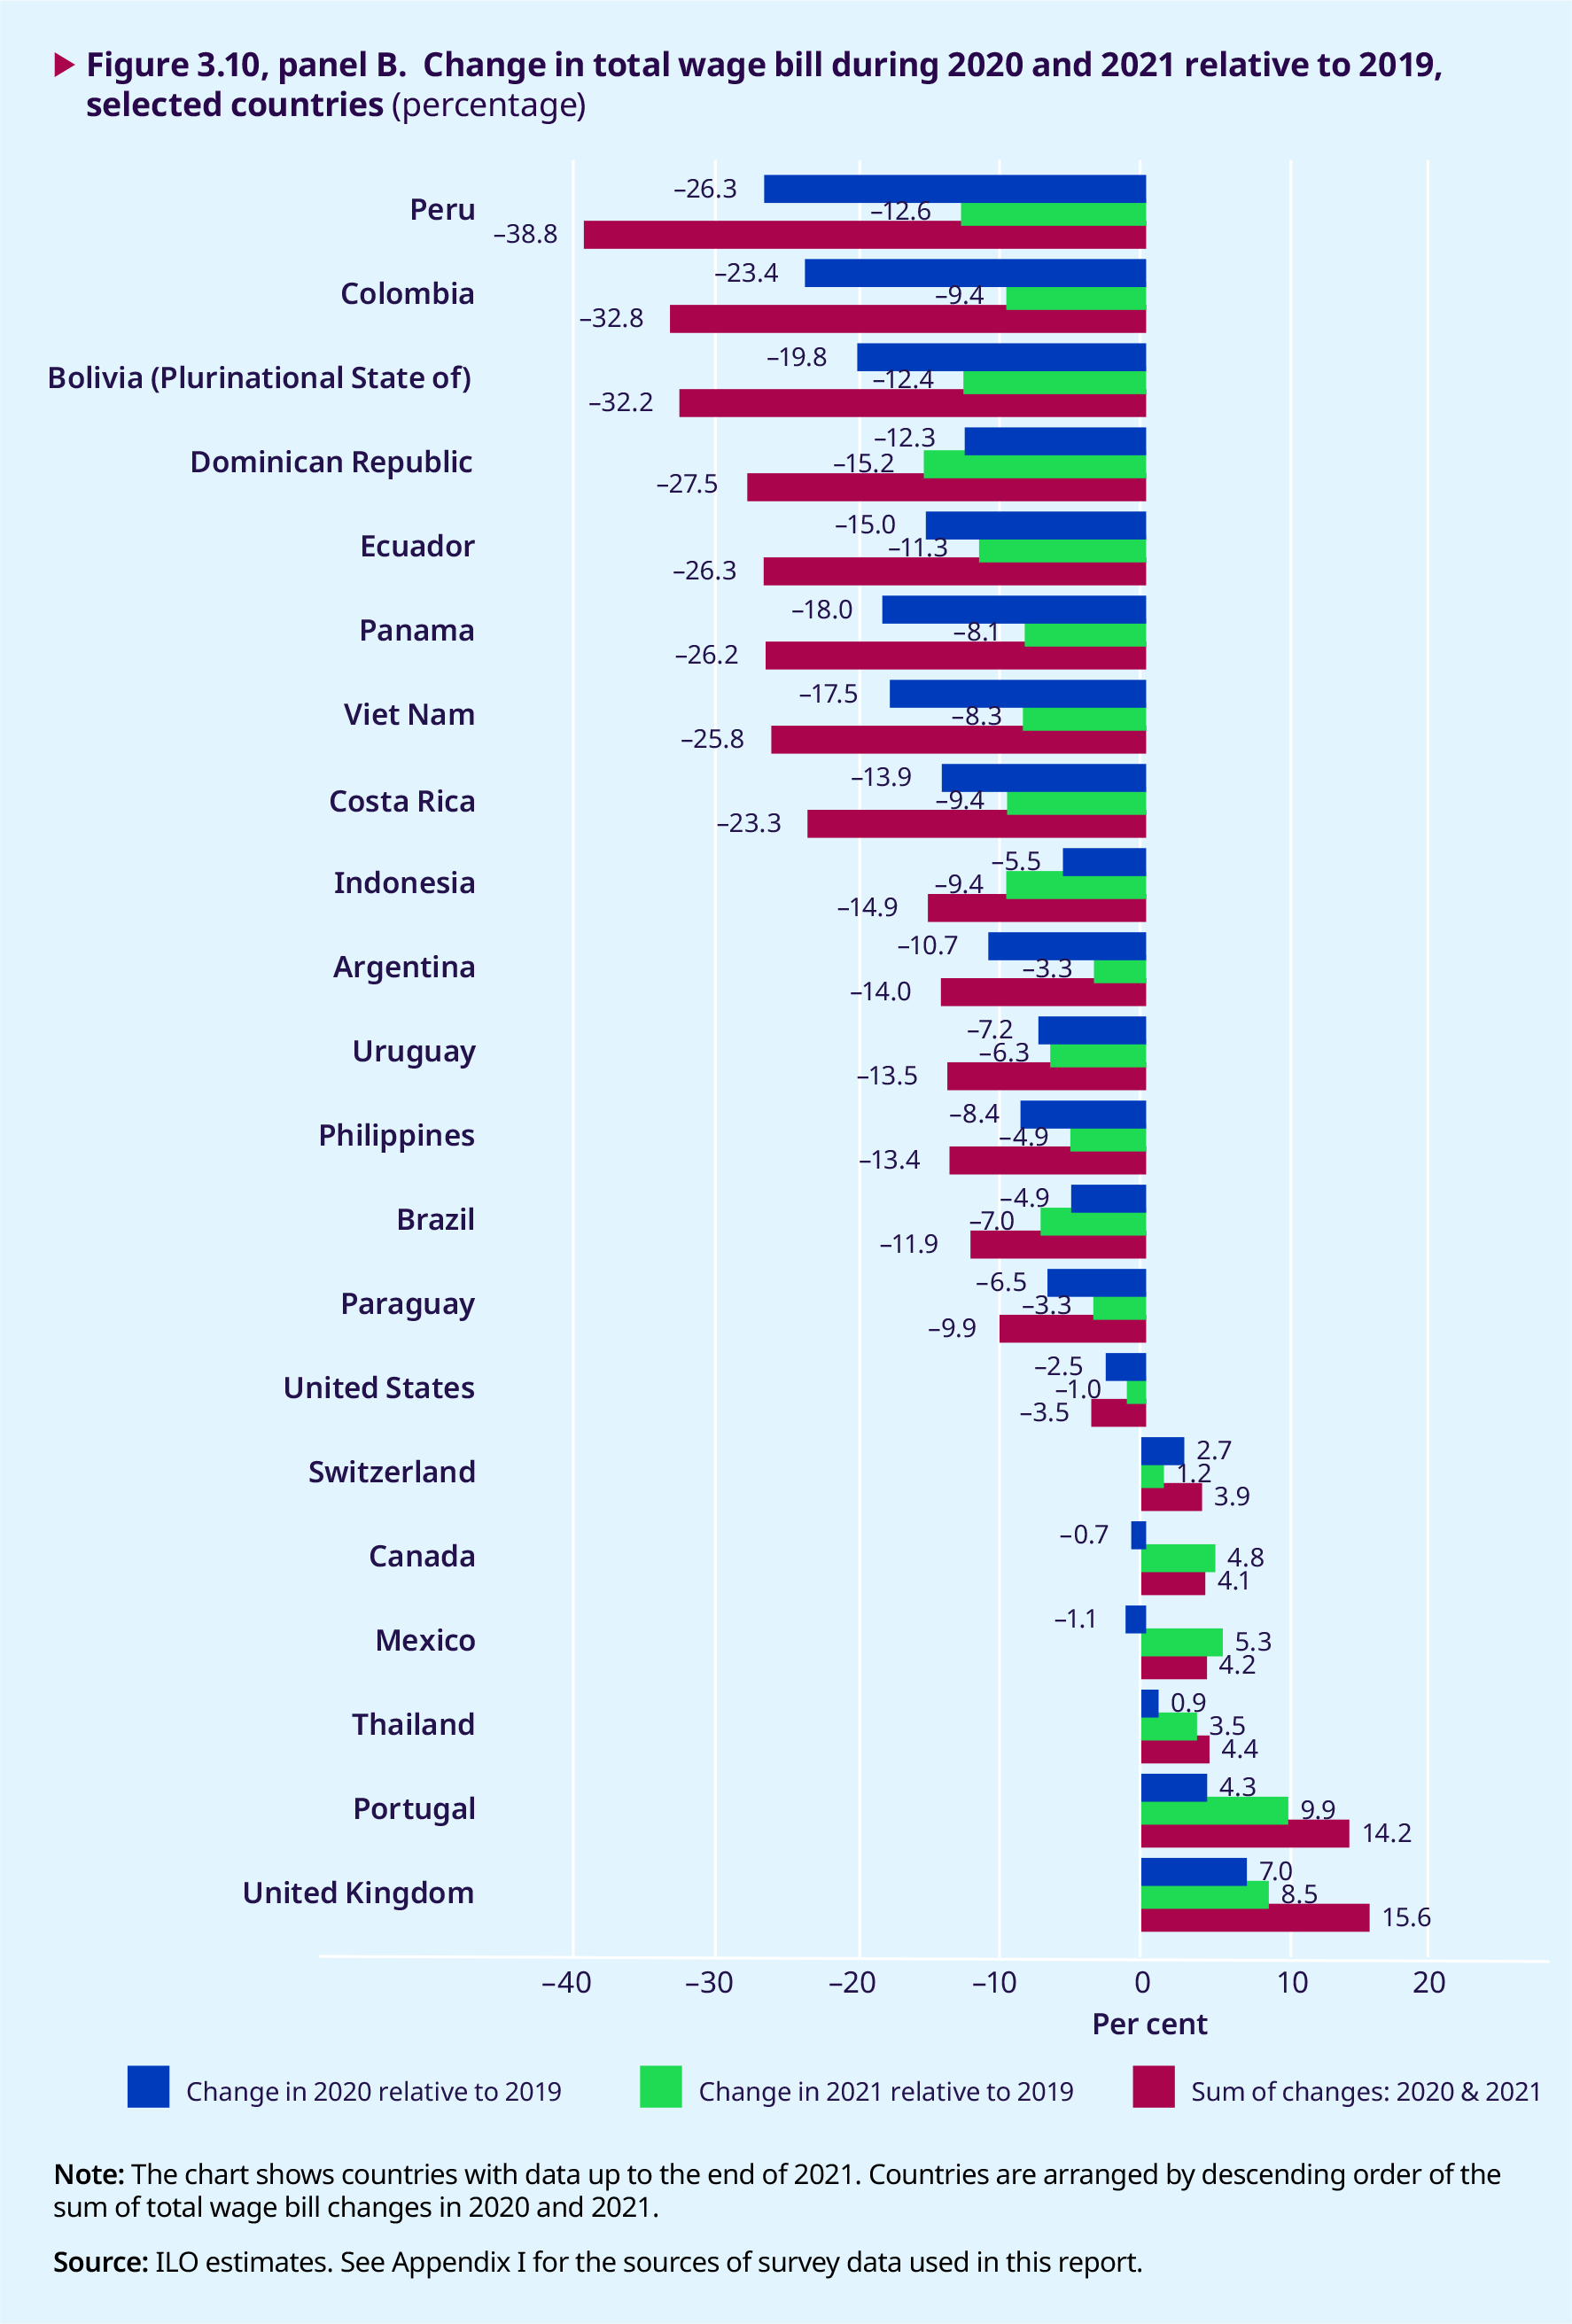
Panel B in figure 3.10 adds information from 2021: that is, it shows the change in the total real wage bill in 2020 relative to 2019, the change in 2021 relative to 2019 and the (cumulative) overall change between 2019 and 2021.9 As can be seen, out of the 21 countries with data up to 2021, 15 continued to experience a lower total real wage bill in 2021 relative to 2019. However, the upswing in the labour market compared to 2020 is clearly visible: except in 3 of these 15 countries, namely Brazil, the Dominican Republic and Indonesia, the loss in the total real wage bill is considerably smaller in 2021 than in 2020. For example, in Peru, Colombia and the Plurinational State of Bolivia, the three countries with the greatest losses in panel B, the total real wage bill losses in 2021 relative to 2019 were 12.6 per cent, 9.4 per cent and 12.4 per cent, respectively, whereas in 2020 they exhibited, respectively, losses of 26.3 per cent, 23.4 per cent and 19.8 per cent. Moreover, during 2021, two countries – Canada and Mexico – reported increases in the total real wage bill relative to 2019, after having experienced losses in 2020. The average loss in the total real wage bill among all 21 countries in the chart was 8.6 per cent in 2020, whereas in 2021 this loss was reduced to 6.3 per cent, which remains considerable. In other words, among the 21 countries with data available for both 2020 and 2021, the decrease in the total wage bill is equivalent to four weeks of wages in 2020 and two weeks in 2021, implying a cumulative loss of six weeks of wages over these two years.
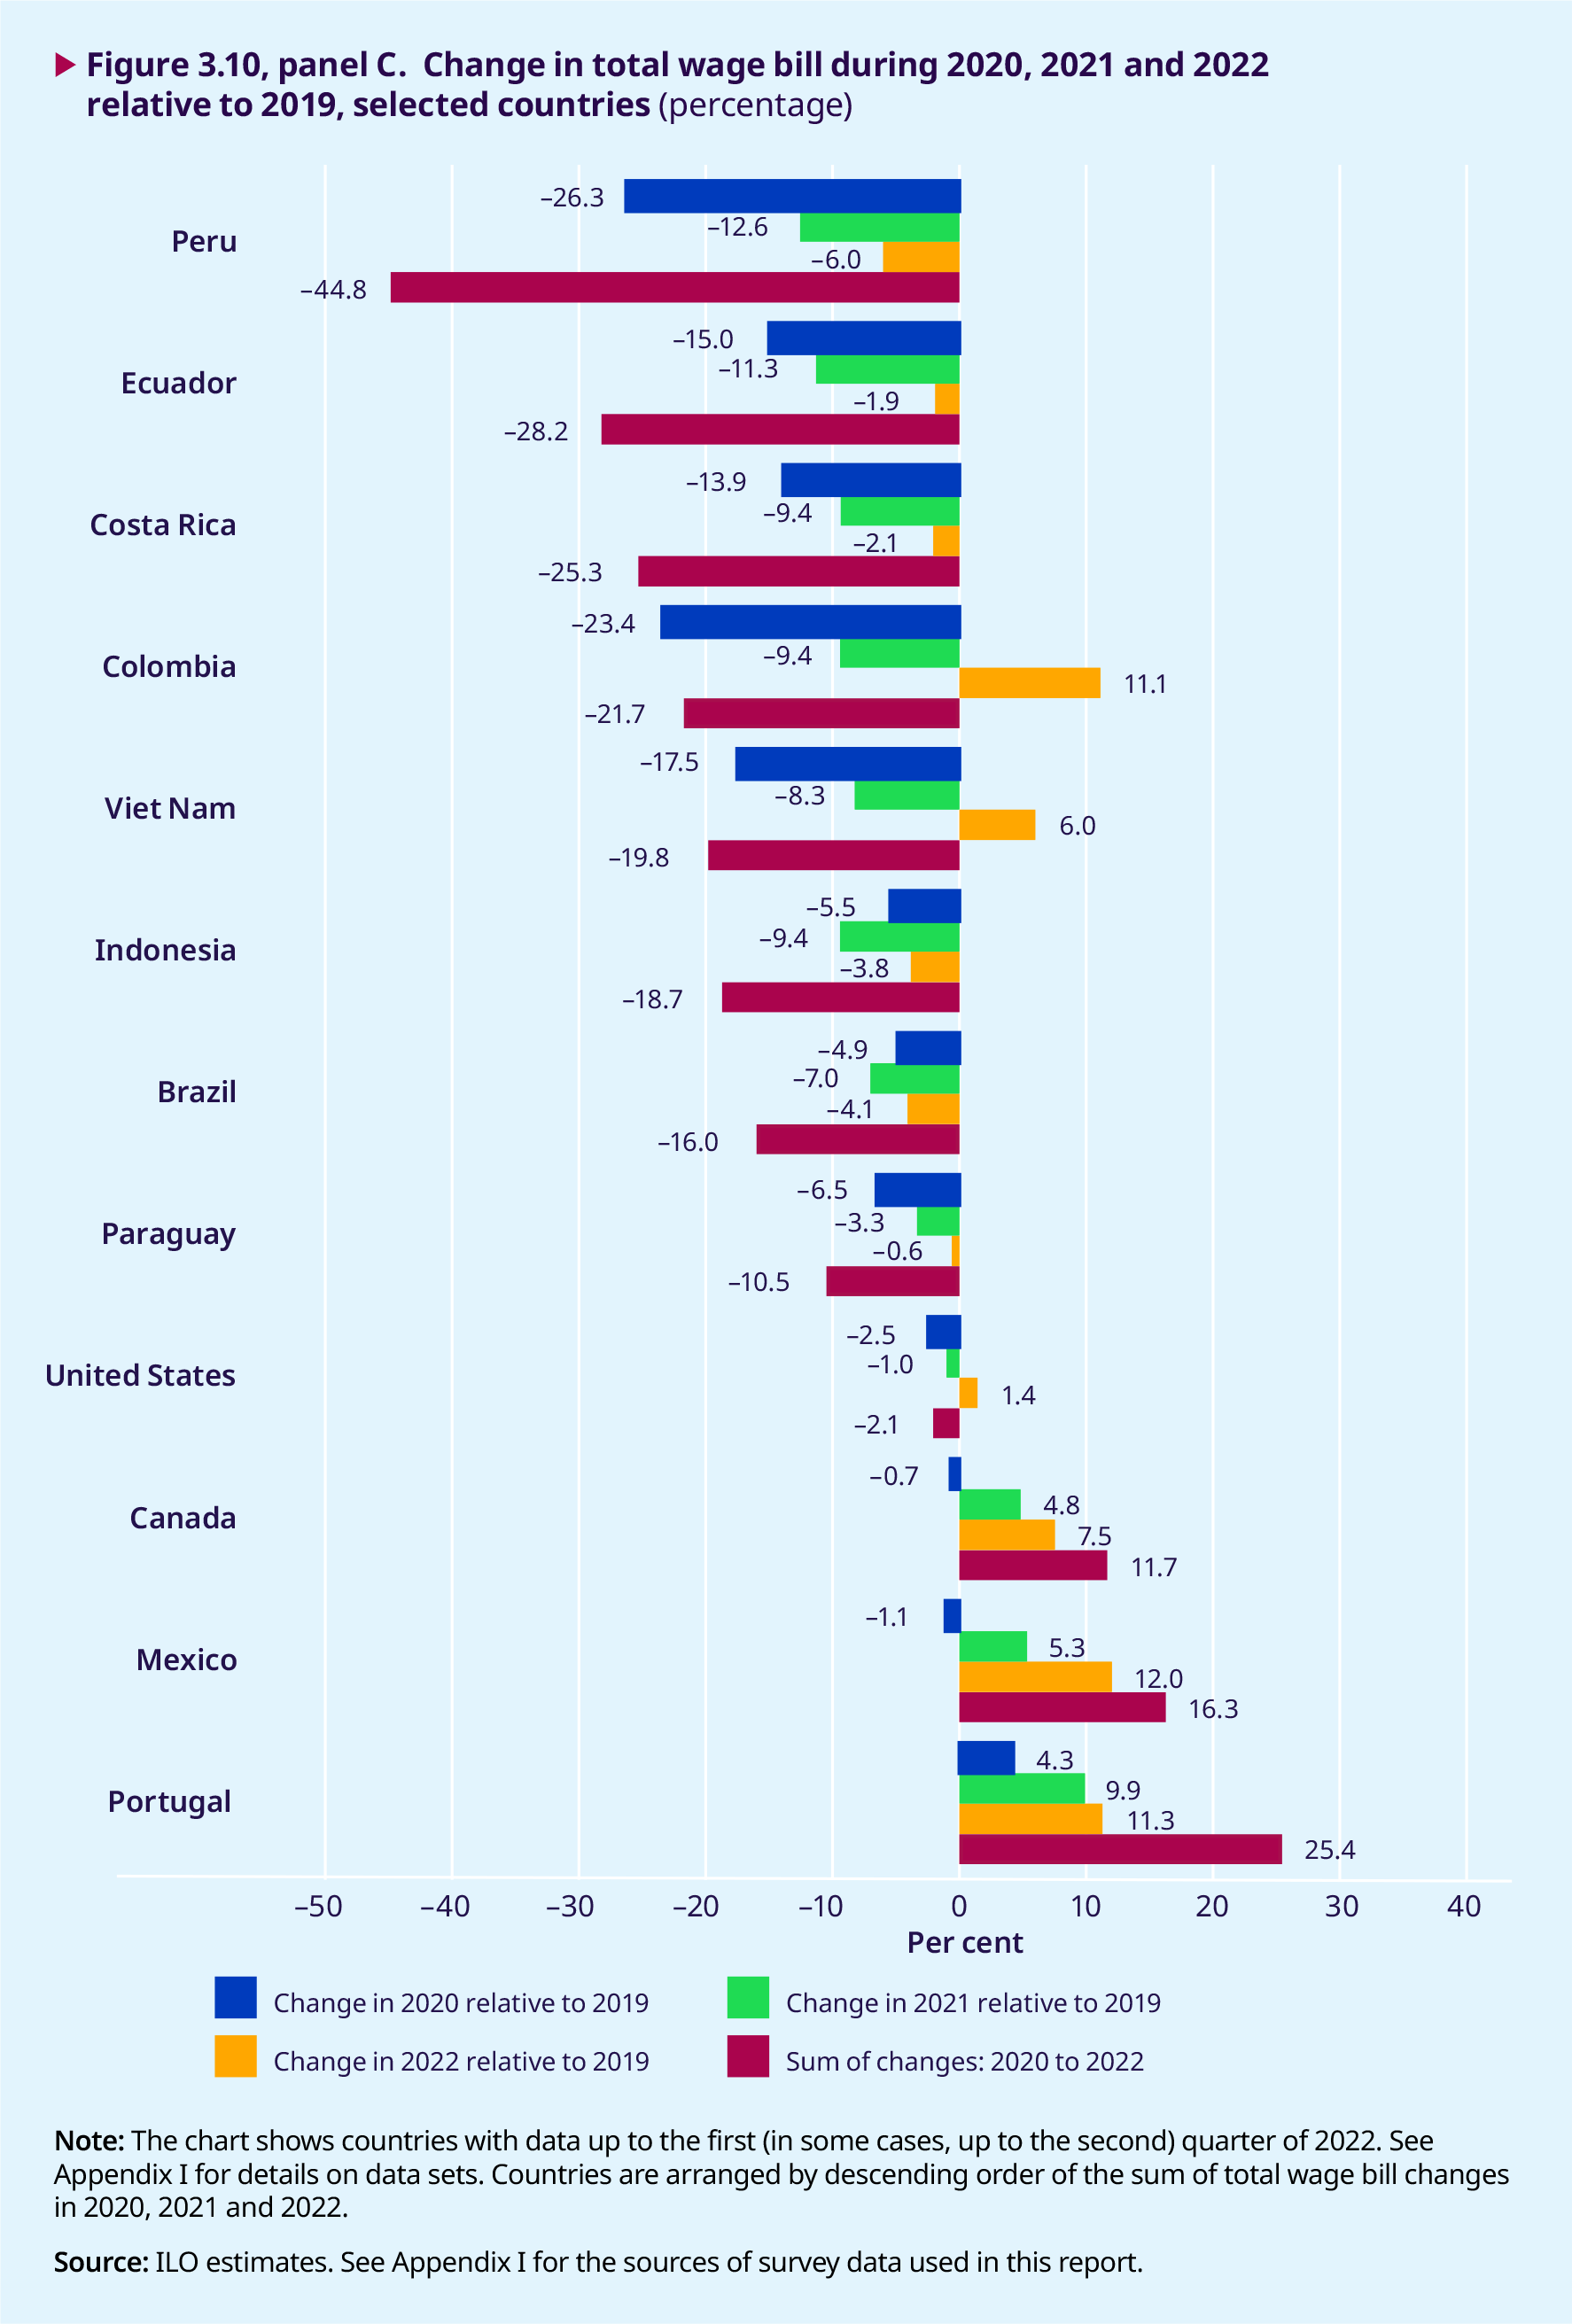
Finally, panel C in figure 3.10 adds information on the total wage bill loss in the first quarters of 2022 compared with (the first two quarters of 2019, and the cumulative loss between 2020 and 2022 in relation to the same period in 2019.10 Only 12 countries out of the original 28 in panel A have data covering the period 2020–2022. Considering estimates for 2022 only, panel C attests to the gradual recovery of labour markets across regions: in only 6 of the 12 countries is the total real wage bill in the first two quarters of 2022 lower than that estimated for 2019. However, despite the improvement in the most recent quarters (2022), the cumulative change (2020–22) is negative in 9 of the 12 countries, which means that the losses caused by the COVID-19 crisis had not been fully recouped yet by mid-2022. Except in the United States, the cumulative losses over a period covering approximately 30 months since 2020 amount to the equivalent of 11 to 45 per cent of the total wages paid out in 2019. This earnings loss is likely to have translated into a decline in living standards or increasing debts, or both, for households in these countries and the corresponding regions of the world. In section 3.9 it will be shown that wage bill losses have a more negative impact among low- wage earners (and their families) than among their higher-paid counterparts.
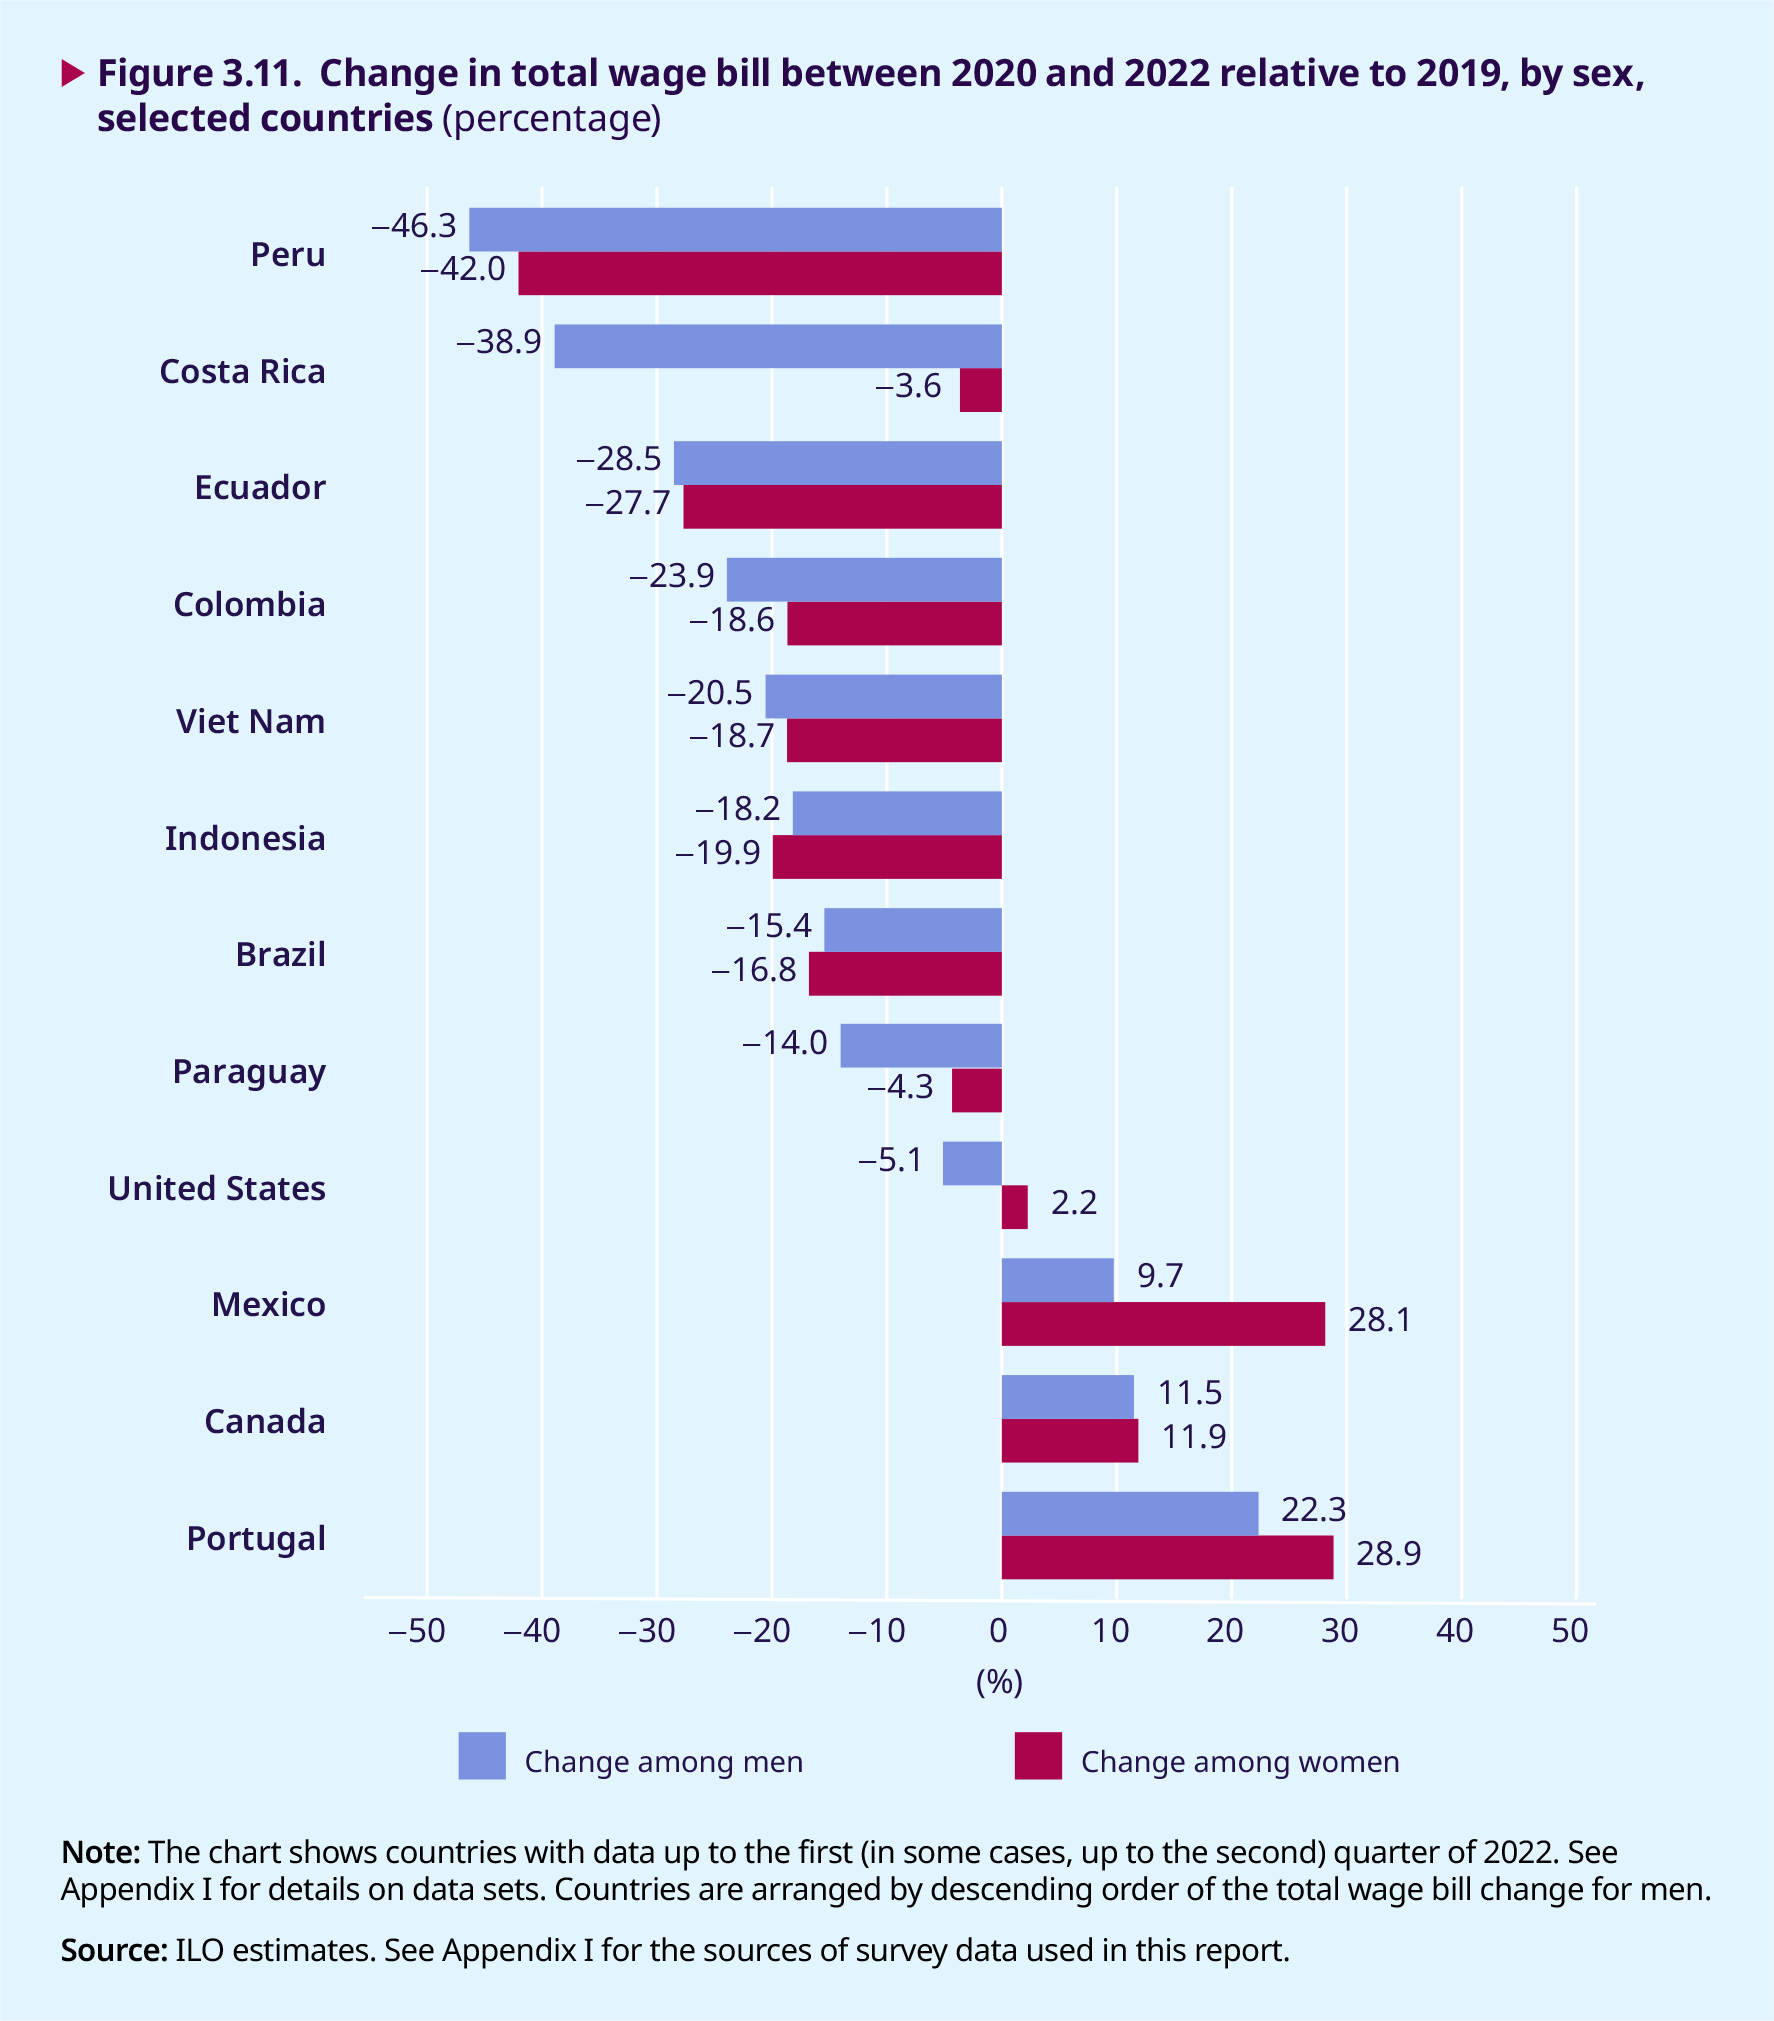
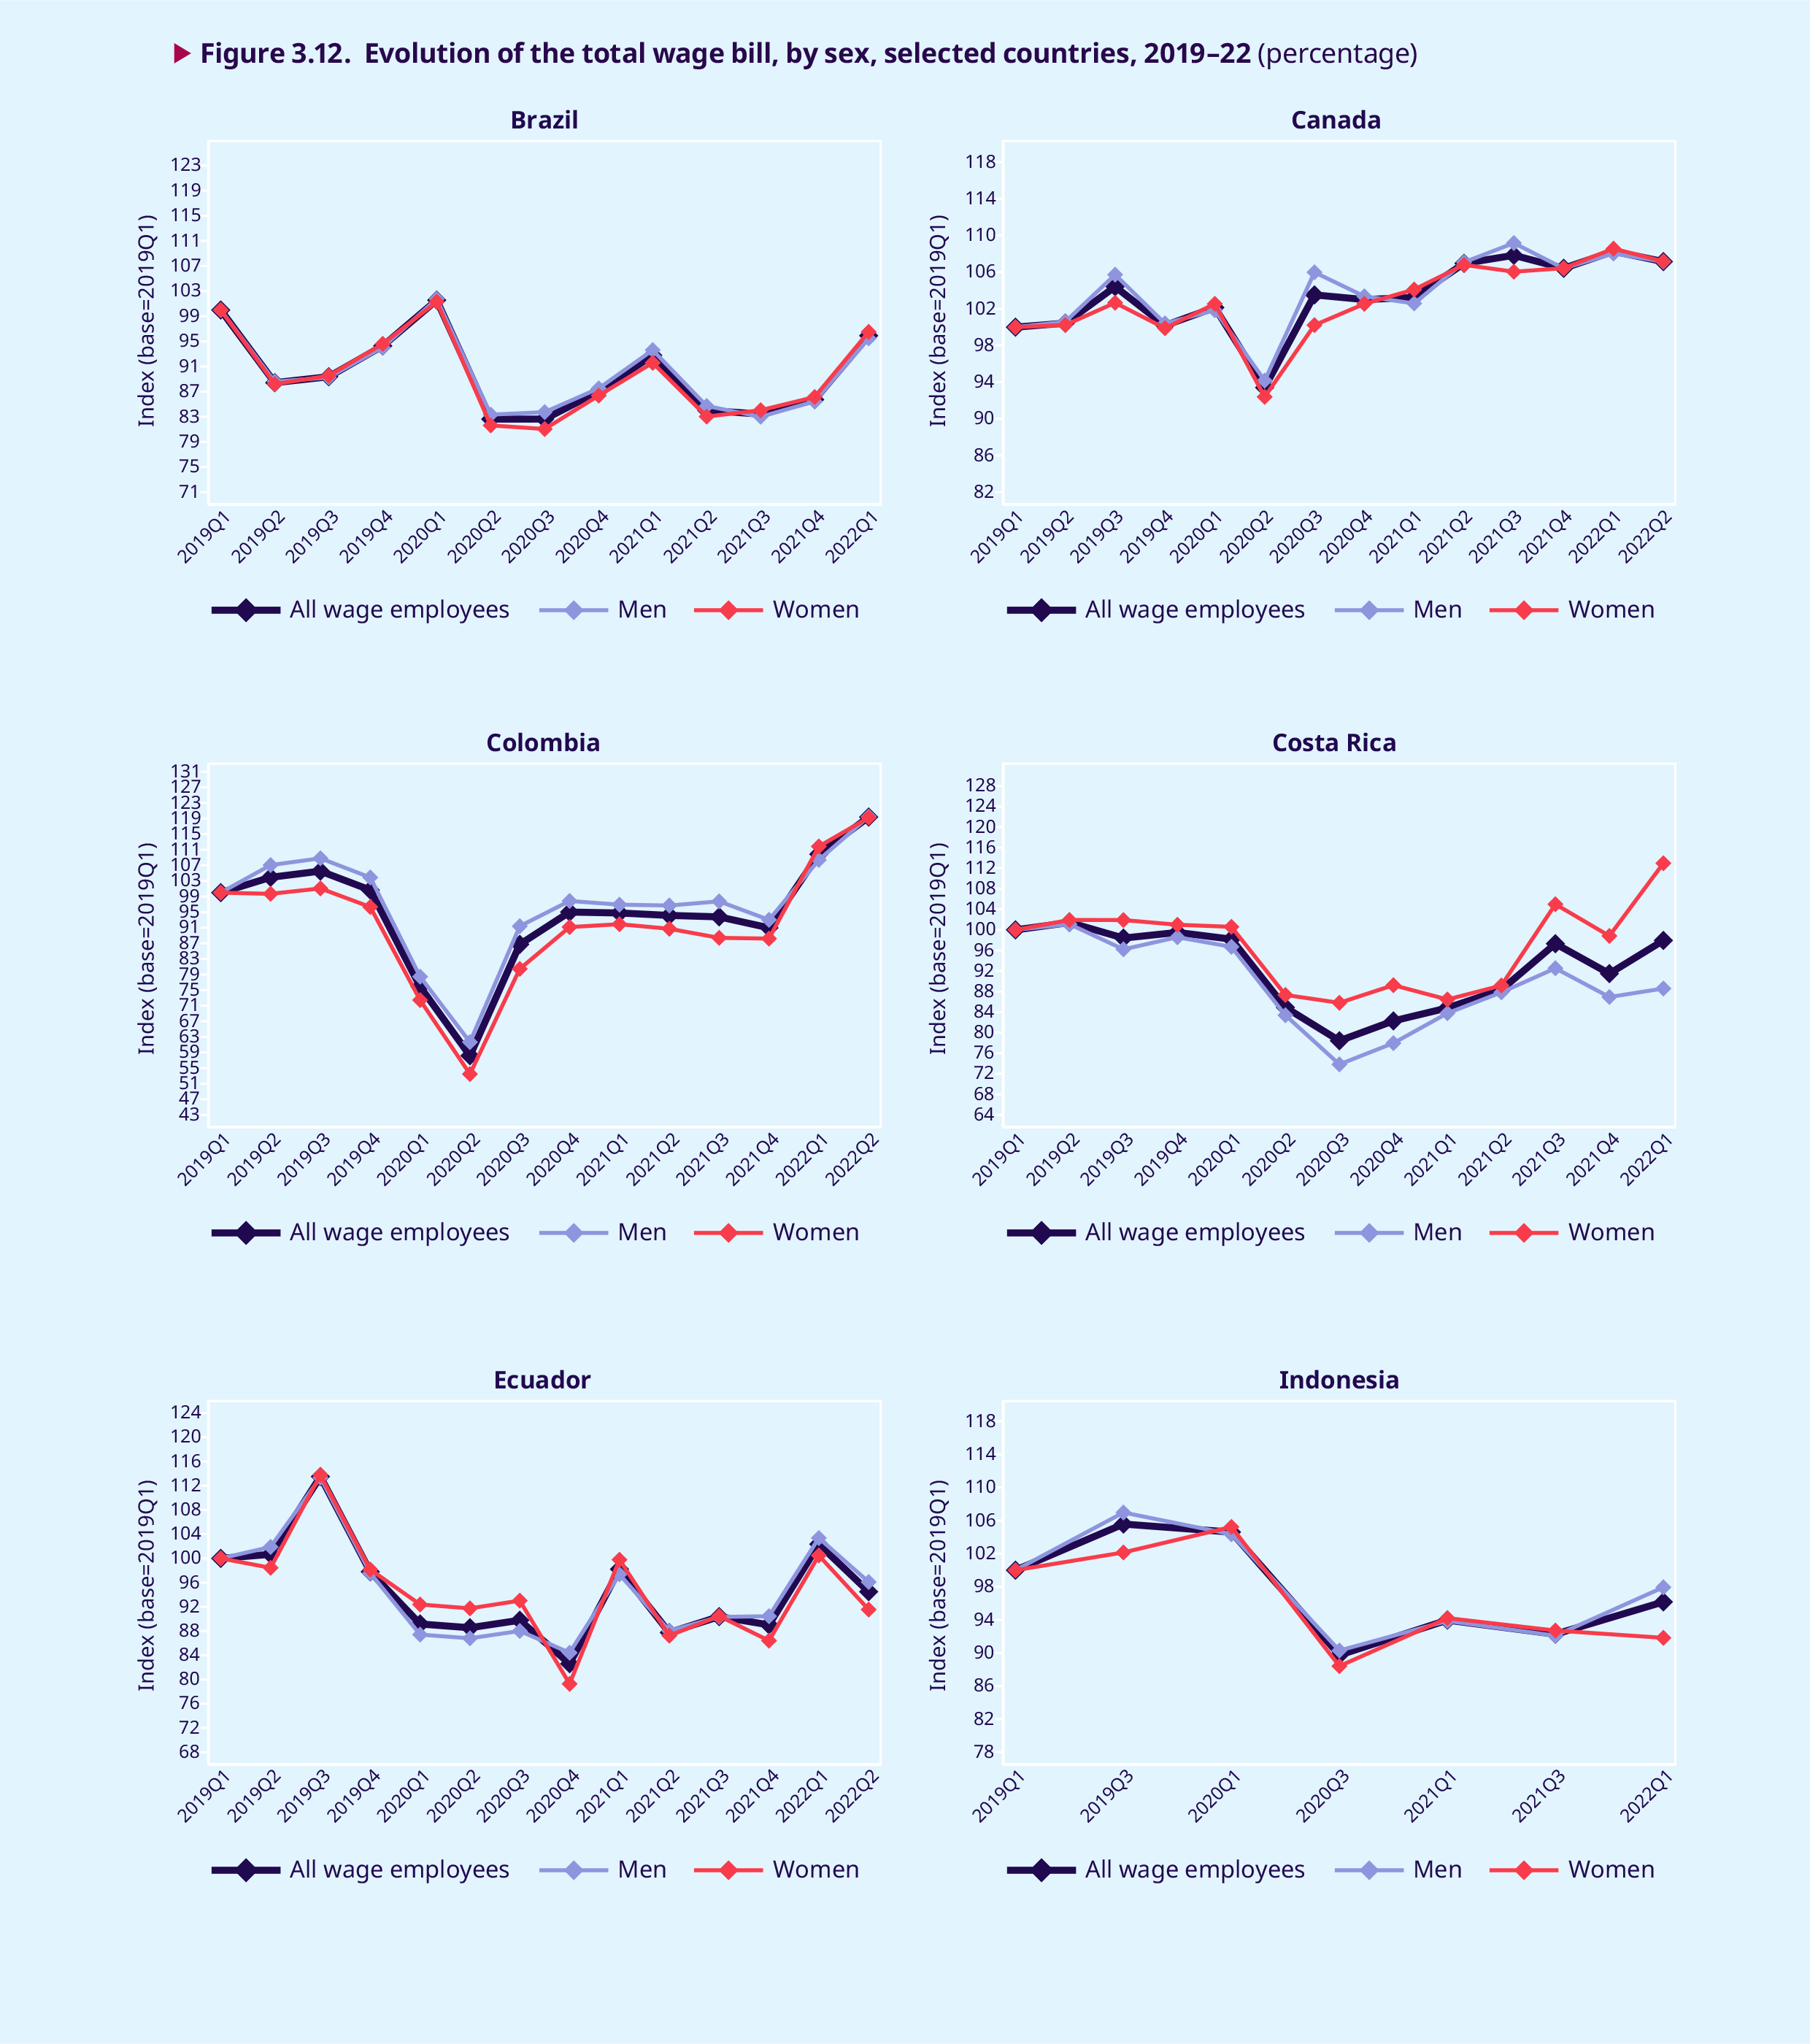
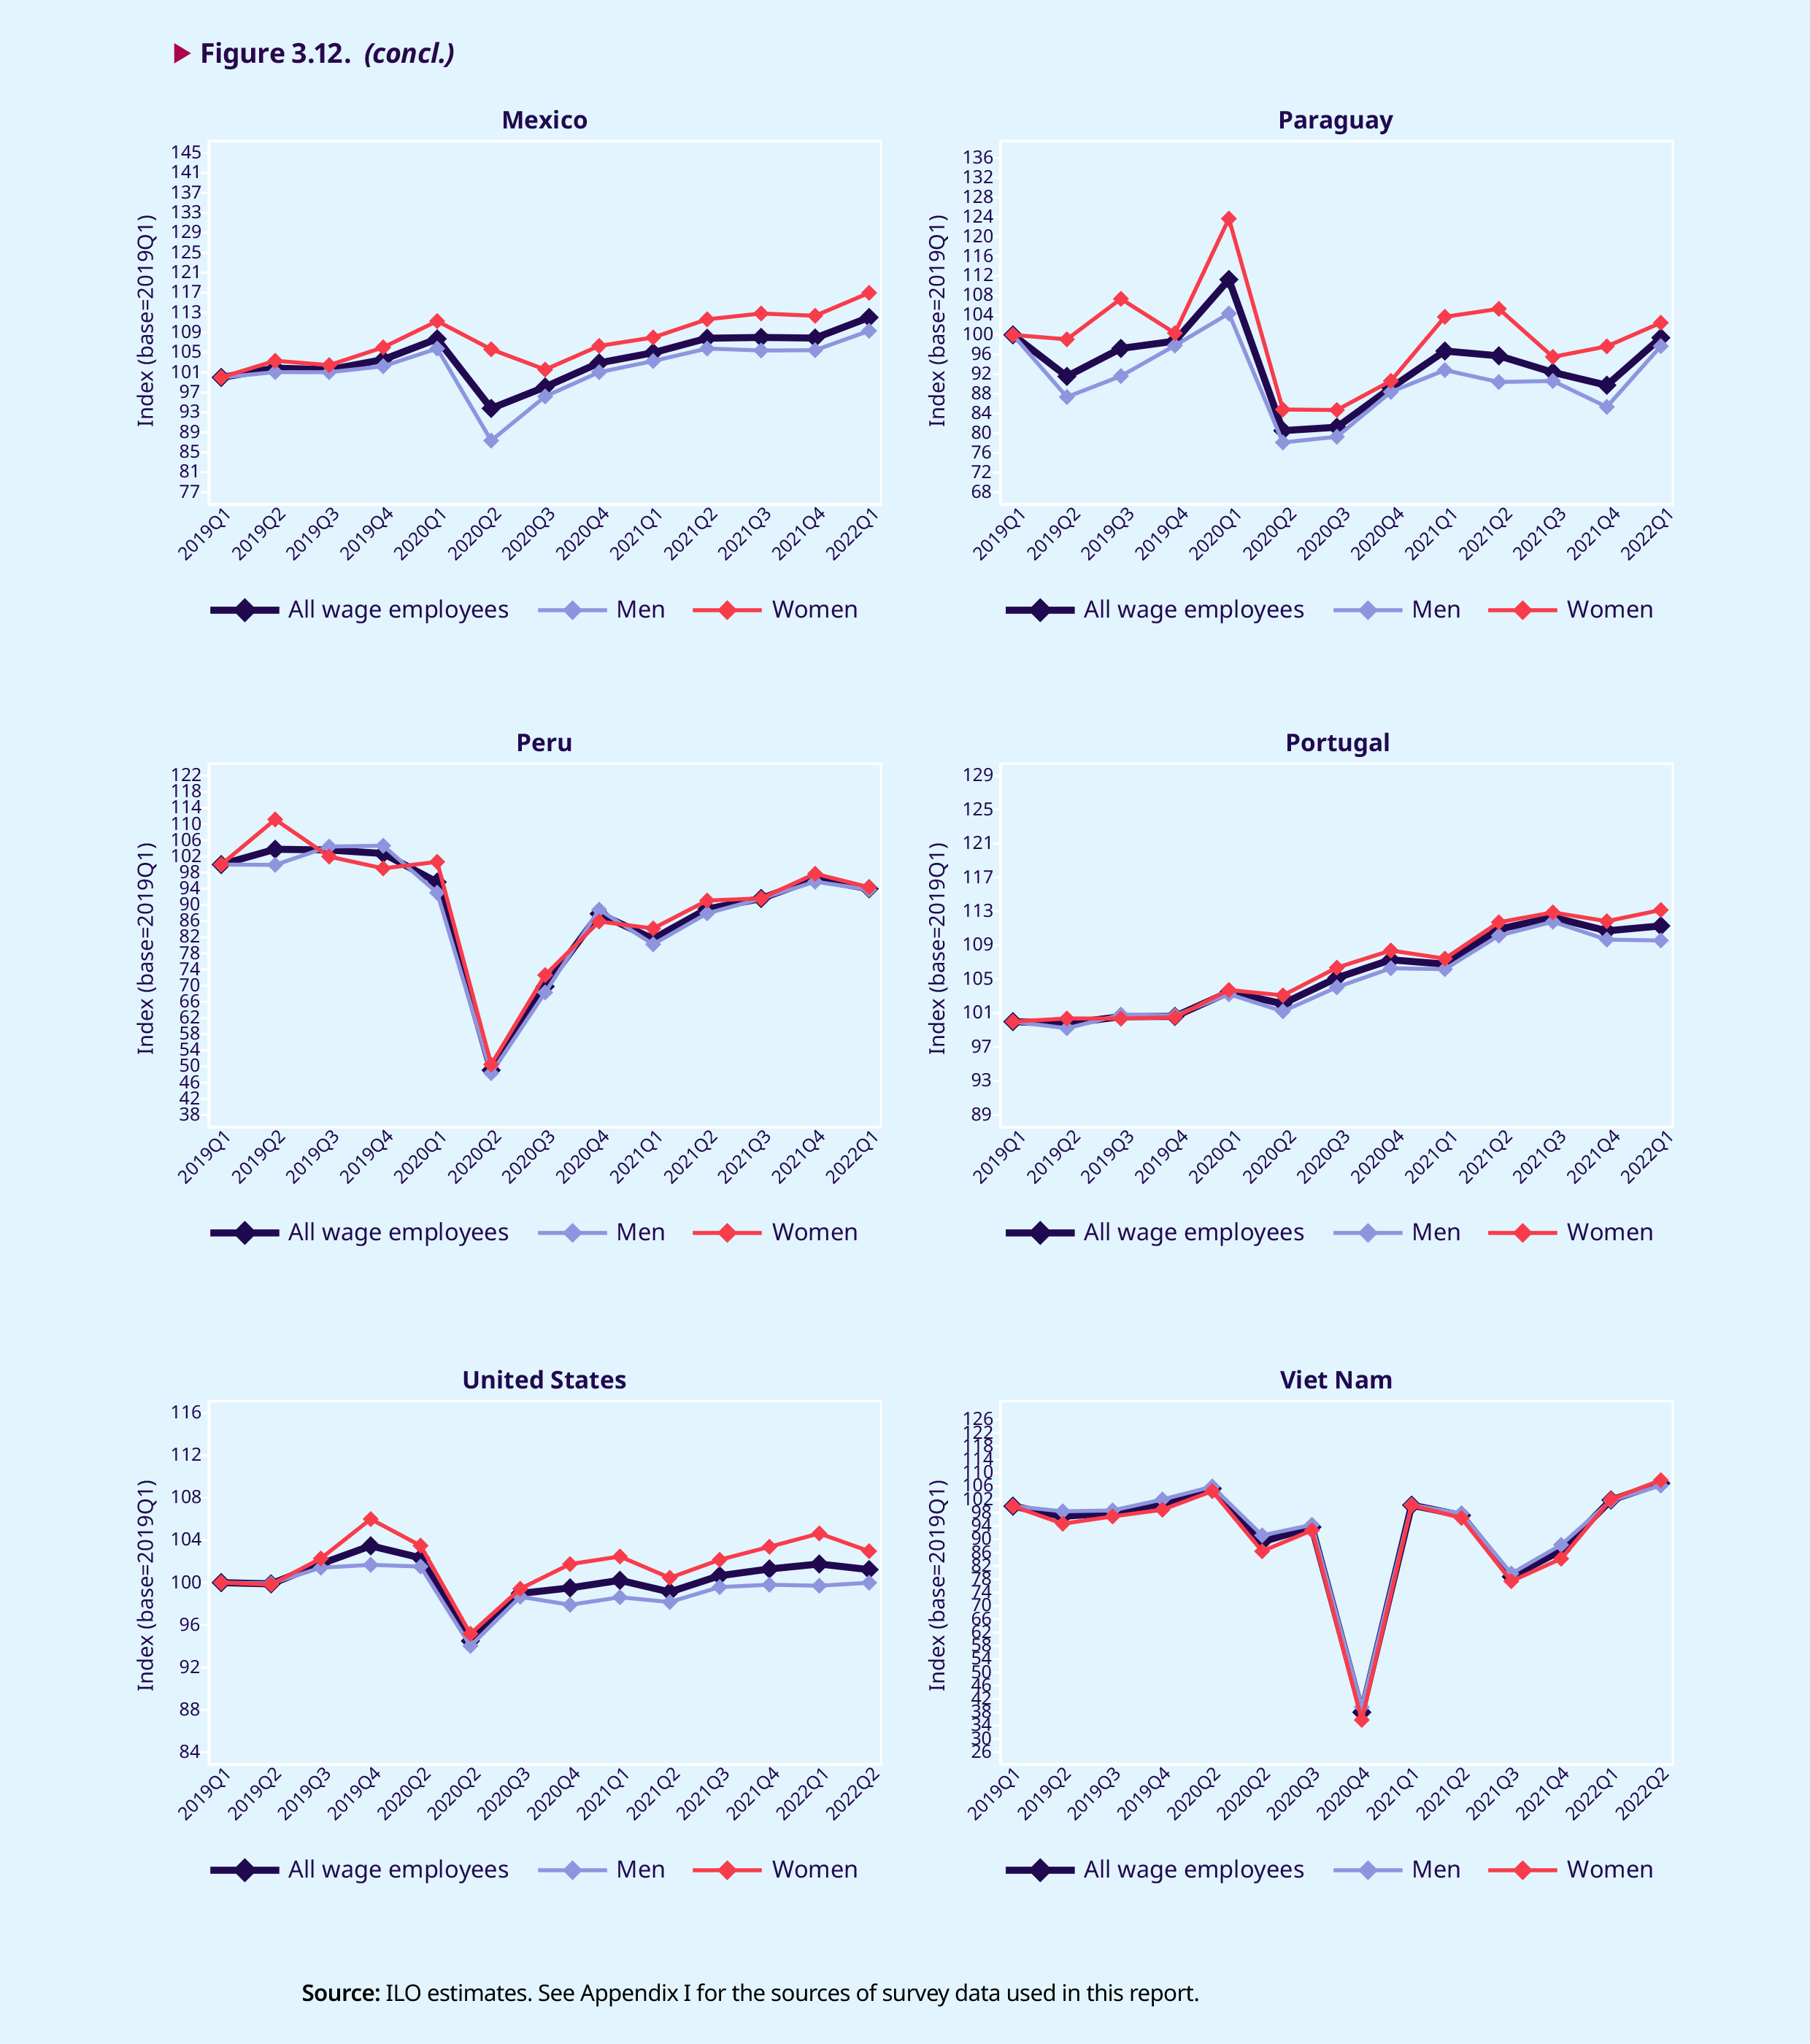
Figure 3.11 offers a similar analysis to that underlying figure 3.10, but distinguishing between women and men and showing only the cumulative losses, rather than annual changes, in the total real wage bill up to the first quarters of 2022 relative to 2019. As can be seen, in 8 of the 12 countries there is a cumulative loss in the total real wage bill for both women and men, while in 3 countries the total real wage bill increased for both women and men. Among countries with a cumulative loss, in all but two – Brazil and Indonesia – the loss was greater among men, while in countries with a cumulative gain, the increase was higher among women. Figure 3.12 complements figures 3.10 and 3.11 by tracing the evolution of the total wage bill – for all wage employees, as well as for women and men separately – from the first quarter of 2019 up to the last available quarter in the data, which may be the last quarter of 2020, the last quarter of 2021 or the first or second quarter of 2022.11 This figure, too, reveals considerable heterogeneity in the evolution of the total wage bills of women and men since the onset of the pandemic, with men incurring greater losses than women in several countries. However, these estimates should not be taken to imply that the concurrent labour market crises have hit men harder than women. The next section will discuss some of the complex ways in which these crises are impacting differently on women and men.
.3.8. Decomposing the change in the total wage bill over time, and a comparison between women and men
The change in the total real wage bill over a given period – say, between 2019 and 2020 – is the result of changes in total employment (including changes in the number of jobs and in the number of hours worked) and both real and nominal changes in hourly wages. This section analyses the contribution of each of these components to the change in the total real wage bill between 2020 and up to the first or second quarter of 2022. In so doing, it sheds light both on how the COVID-19 crisis has contributed to the reduction in the total real wage bill documented in the previous section and on how the ongoing cost- of-living crisis is also eroding wages. Appendix III describes the methodology used to decompose the change in the total wage bill.
Figure 3.13 shows the decomposition of the change in the total wage bill for 2020, 2021 and 2022, for each of the 12 countries that provided data up to the first or second quarter of 2022.12 In 10 of the 11 countries where the wage bill decreased in 2020 relative to 2019, the decline in employment was the dominant negative factor. In some of these countries – Brazil, Canada and the United States – disentanglement of the factors behind the change in the total real wage bill in 2020 provides clear evidence of the effect of employment composition on wages that was described in box 3.1. The jobs lost during 2020 in these countries reduced the total real wage bill, but average nominal earnings increased as higher earners remained in wage employment, thereby mitigating the impact of employment losses on the decline of the total wage bill. Costa Rica, Mexico and Paraguay also exhibit some, albeit weaker, signs of a composition effect on wages when the changes in the total real wage bill are decomposed.
Viet Nam is the only country in the small sample covered by figure 3.13 where falling nominal wages were the main factor behind the decline in the wage bill in 2020, but it may be representative of other countries in Asia and other regions in which the COVID-19 crisis translated into wage cuts rather than job losses. In Ecuador, Indonesia and Peru, wages also declined in nominal terms and contributed to a reduced wage bill, but this effect was smaller than the employment effect. Portugal is the only country in the sample where the total wage bill increased in 2020. As in other European countries, wage subsidies and job retention schemes probably played their part in alleviating the impact of the crisis on wage employment there. However, even with the help of stimulus packages, there was a 1.6 per cent decrease in the total wage bill of Portugal due to employment losses. On the other hand, nominal wage increases were sufficiently large to increase the total real wage bill in 2020 by 4.3 per cent relative to 2019.
The decomposition in figure 3.13 shows that in 2021, the second year of the pandemic, employment outcomes – and the total real wage bills – were on the whole starting to improve. A few countries recovered from their total wage bill losses in 2020 and reported increases in 2021 relative to 2019 (for example, Canada and Mexico). In most other countries, although the total real wage bill in 2021 continued to be lower than in 2019, the loss in 2021 was smaller than that registered in 2020. However, the most striking finding from the decomposition in figure 3.13 is the strong irruption of inflation as the main factor impacting negatively on the total real wage bill across countries from 2021 onwards. The year 2021 is, therefore, when the effects of the two crises – the COVID-19 crisis and the cost-of-living crisis – overlap and interact to shape changes in the total real wage bill. In 2022, inflation is the dominant negative factor in most countries. Nowhere is this more visible than in Brazil, where the contribution of inflation to the reduction of the total real wage bill in the first quarter of 2022 relative to the first quarter of 2019 was as high as 18.2 per cent.
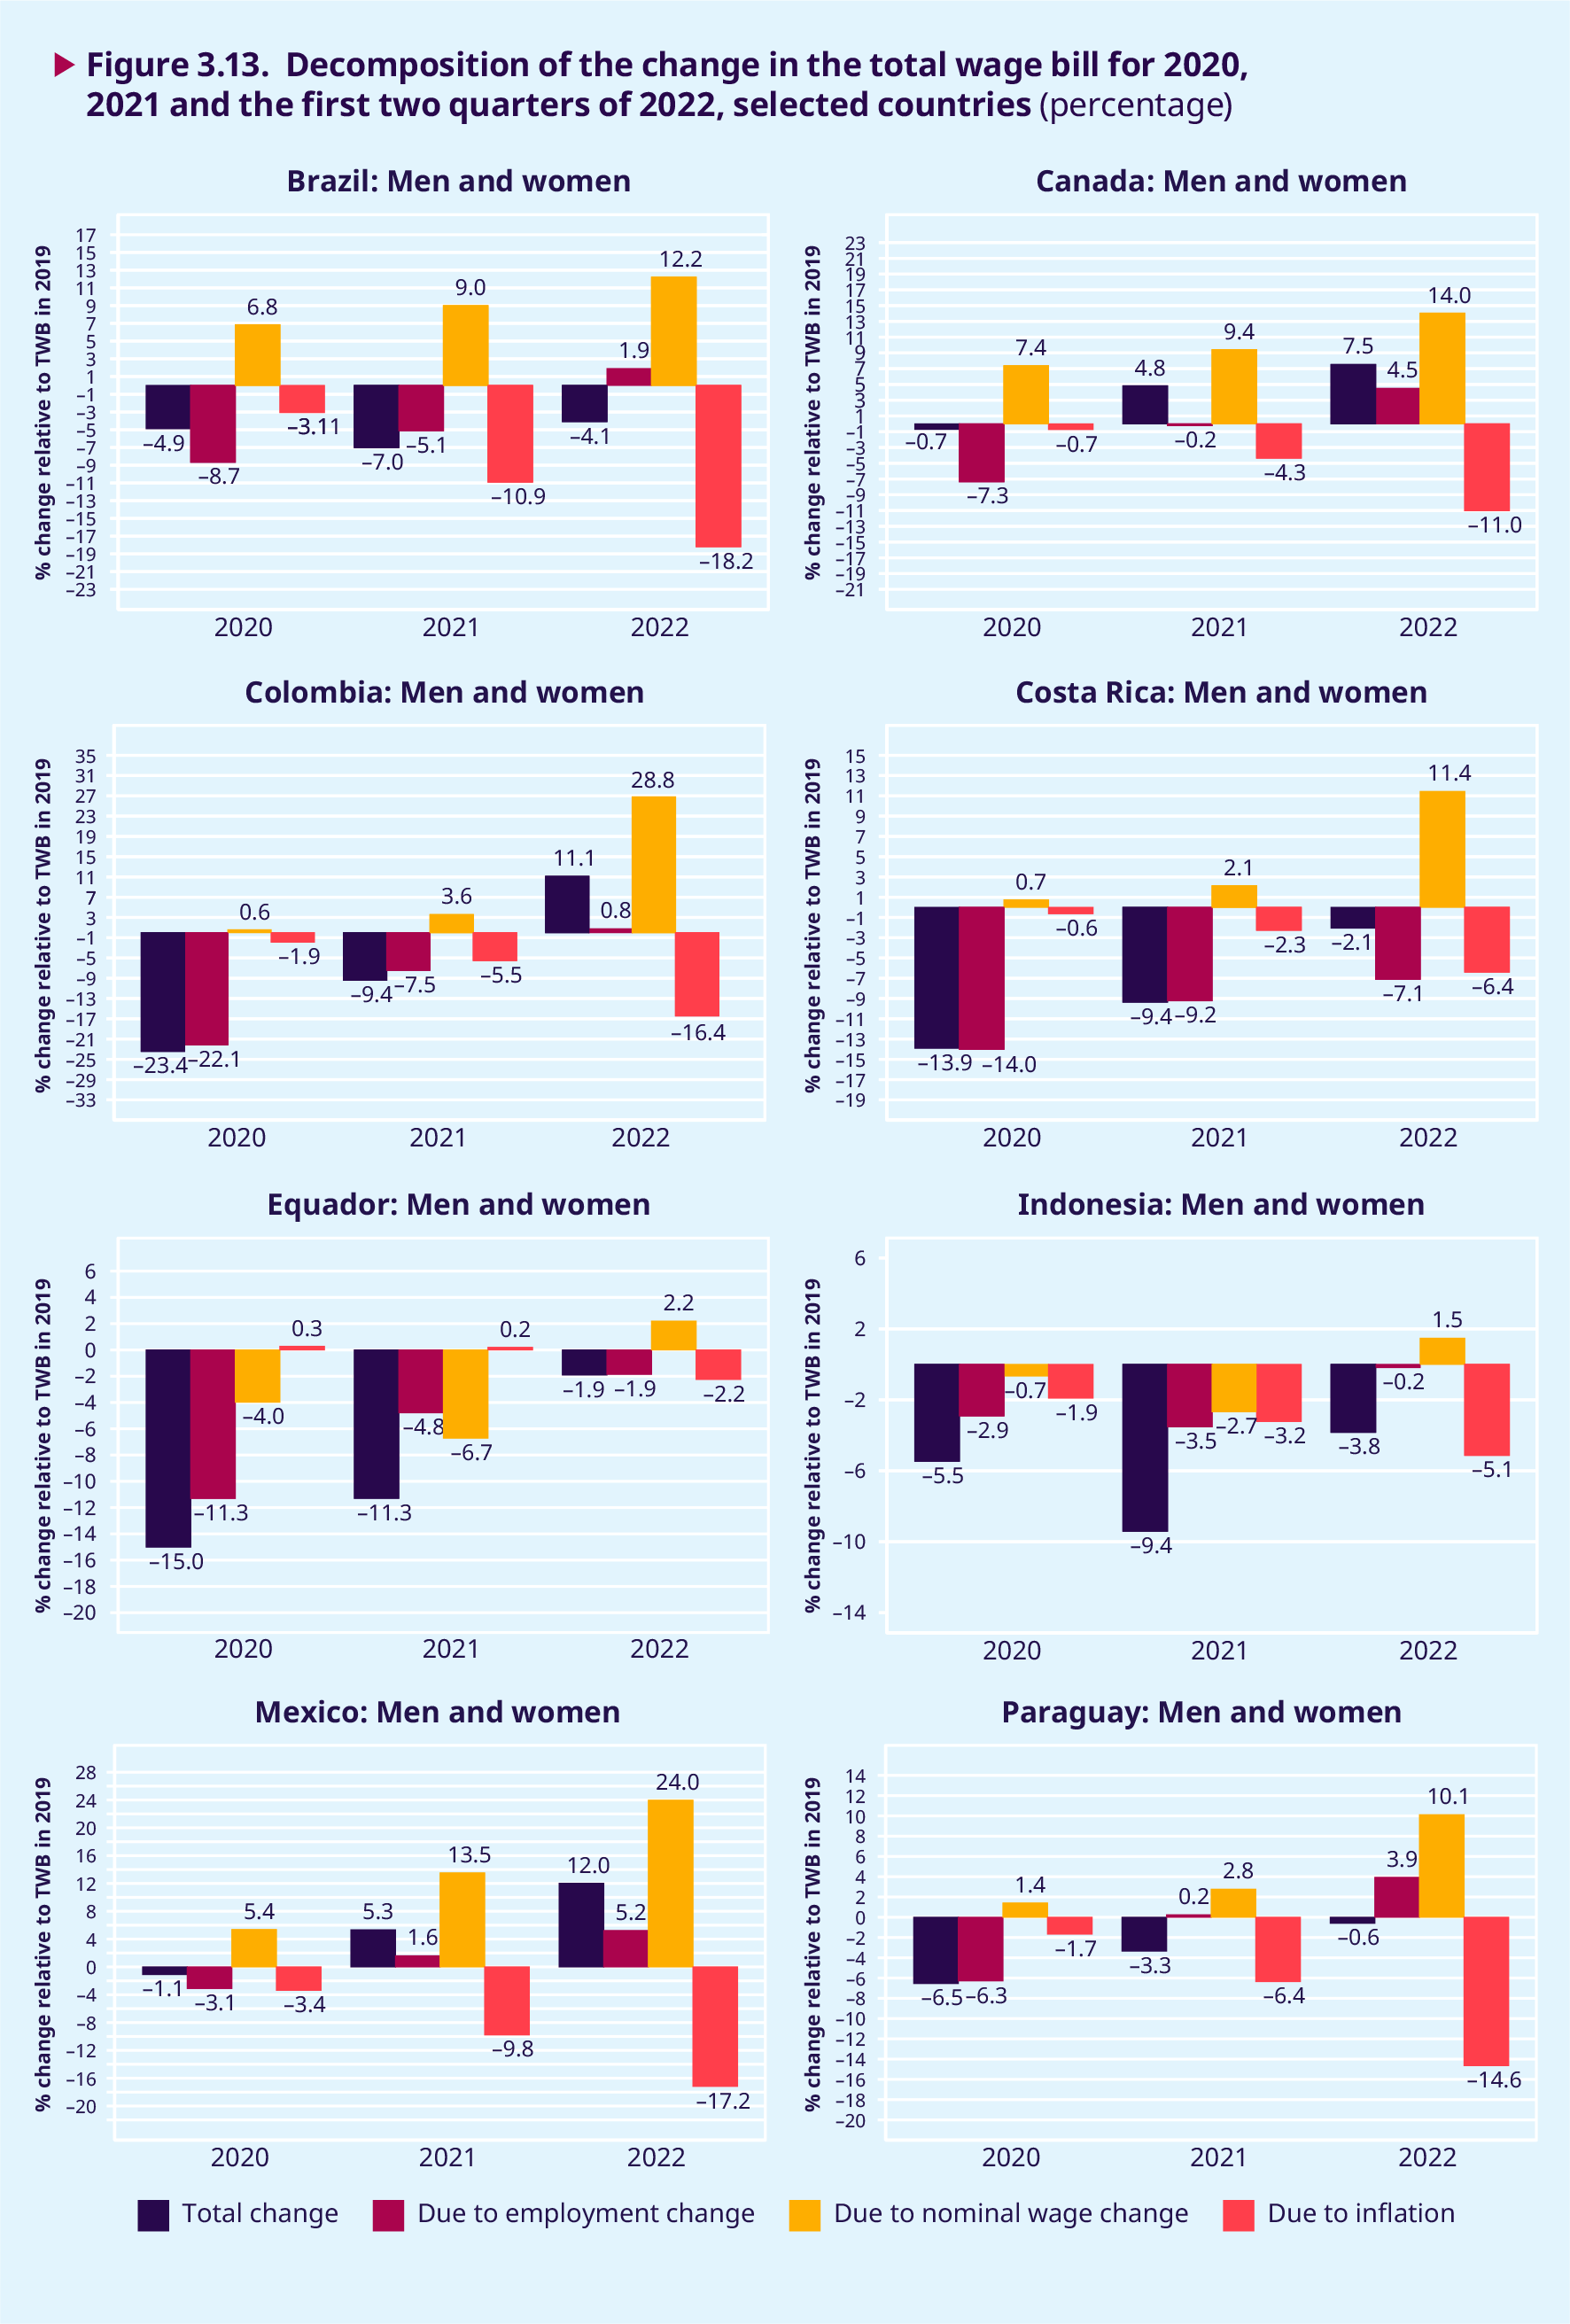
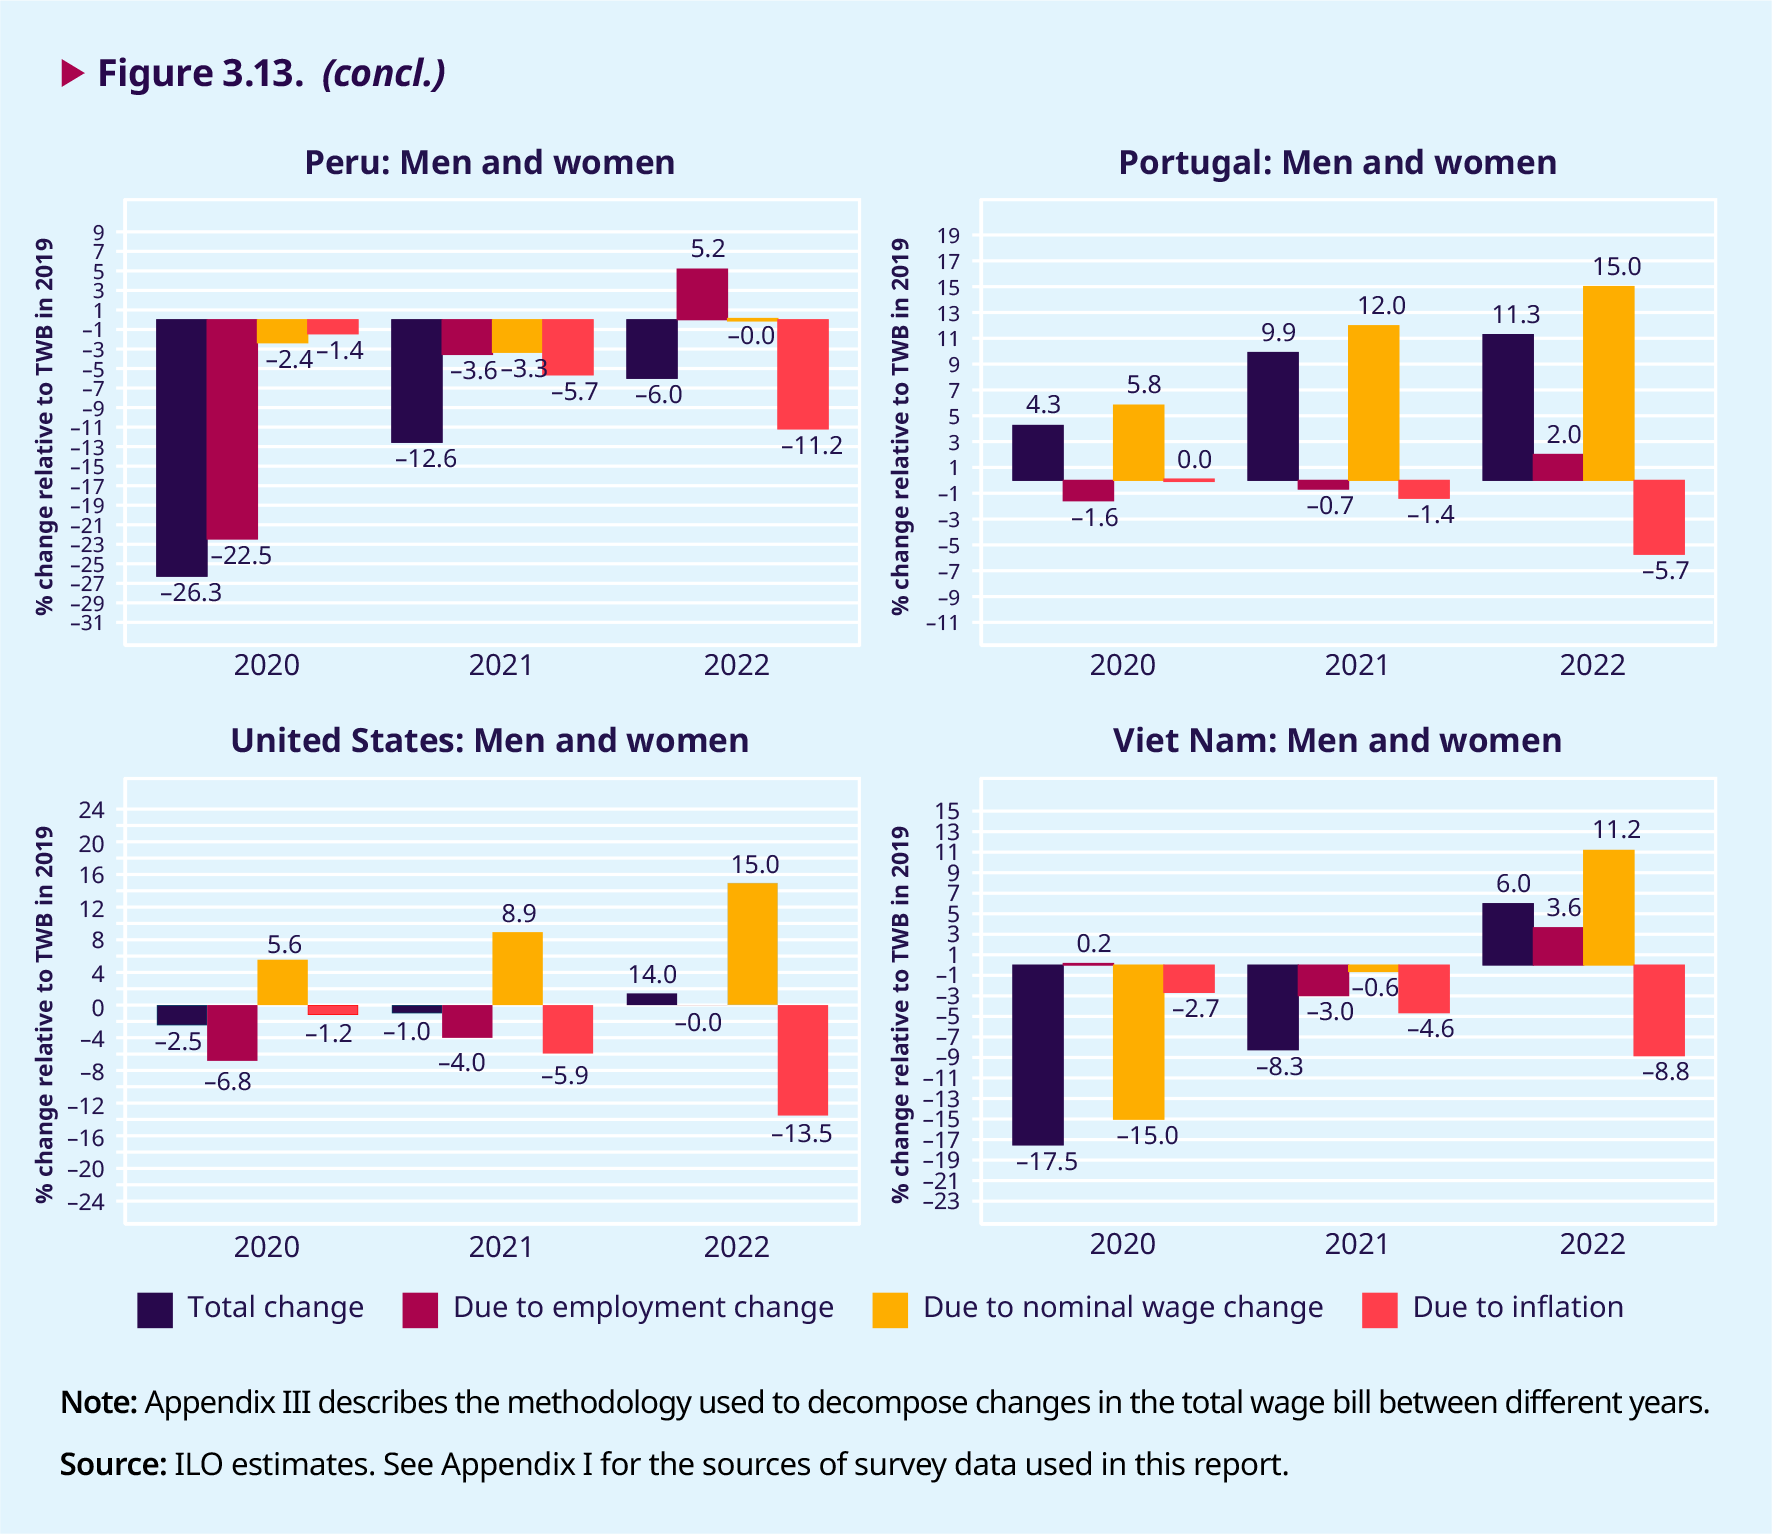
Figure 3.14 presents a decomposition of the change in the total wage bill similar to that in figure 3.13, but with disaggregation by sex. This helps one to understand what may lie behind the larger decrease in the wage bill of men compared with that of women in many countries that was documented in the previous section. The striking picture that emerges for 2020, the year when the composition effect of wage employment had its greatest impact on average wages, may be interpreted as follows. In 2020, employment losses (including jobs and hours of work) were greater among women than among men in a majority of countries. At the same time, in 2020, increases in average wages were greater among women in all countries. These two observations taken together suggest that the composition effect, particularly in 2020, was far more pronounced among women. In other words, women lost more employment than men at the onset of the COVID-19 crisis and, at the same time, this employment loss had a greater impact in terms of increasing the average nominal wage of those women who remained in wage employment. This suggests that employment losses for women were even more concentrated among low-paid workers than for men.13
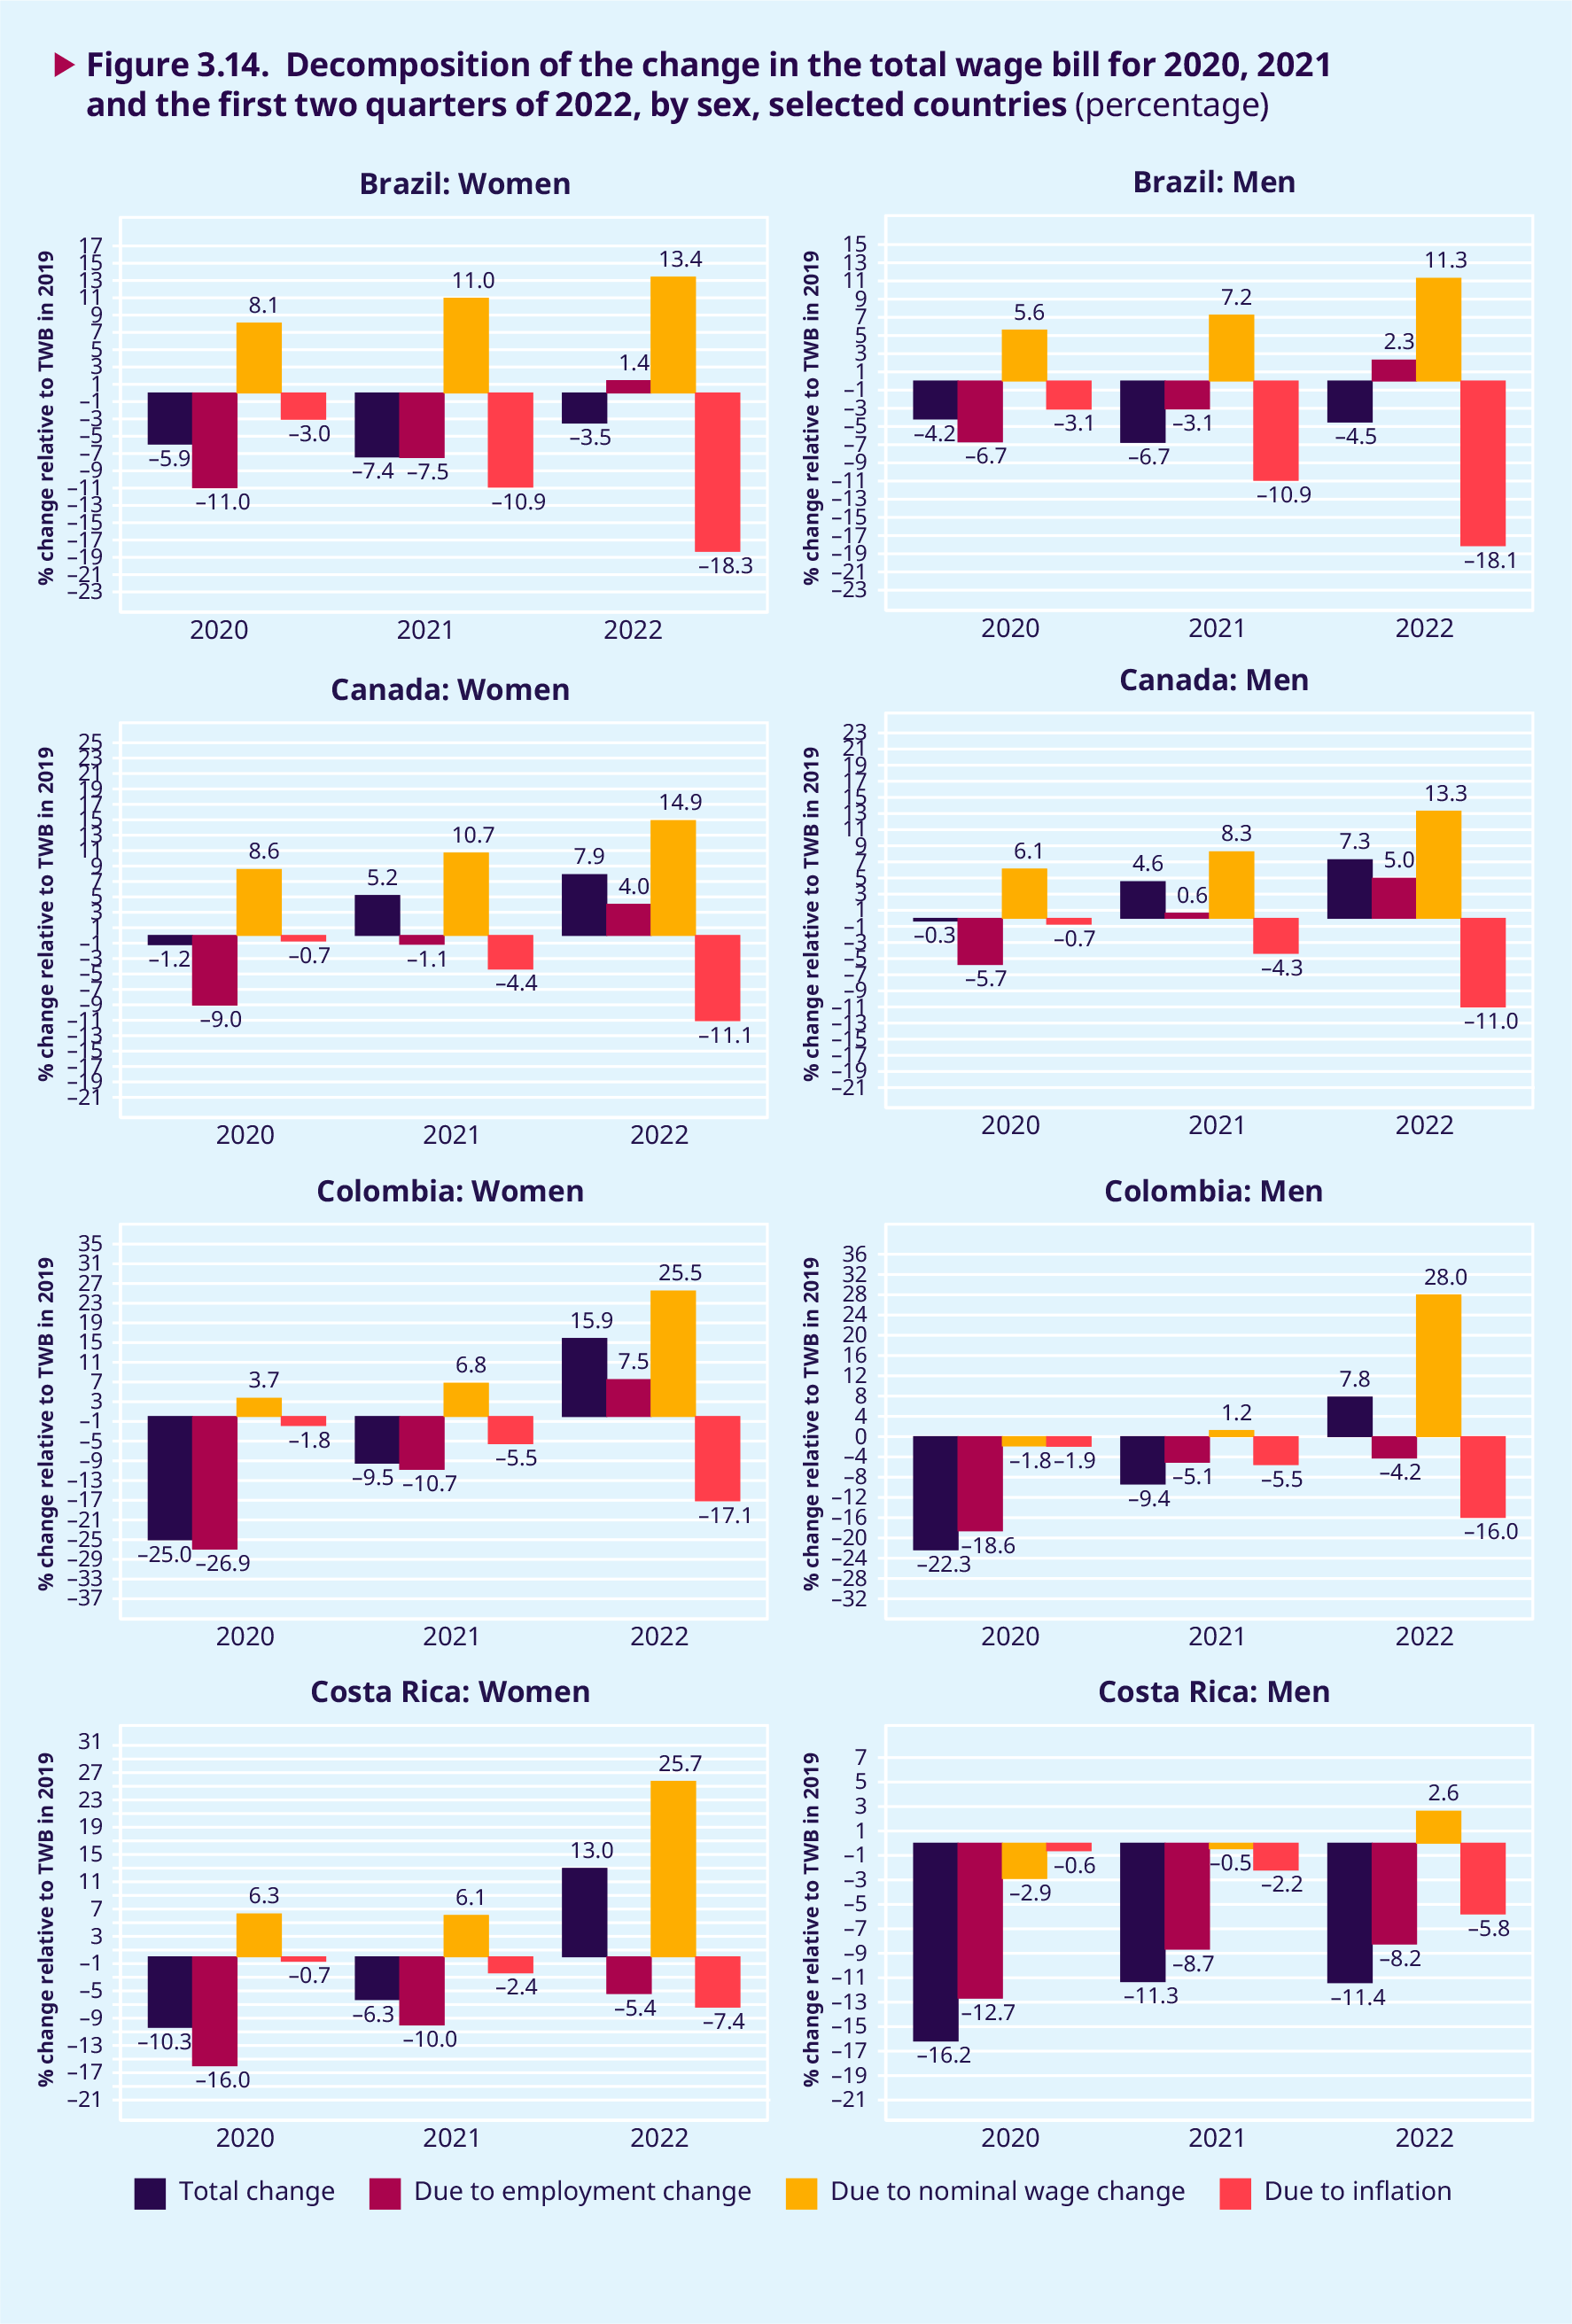
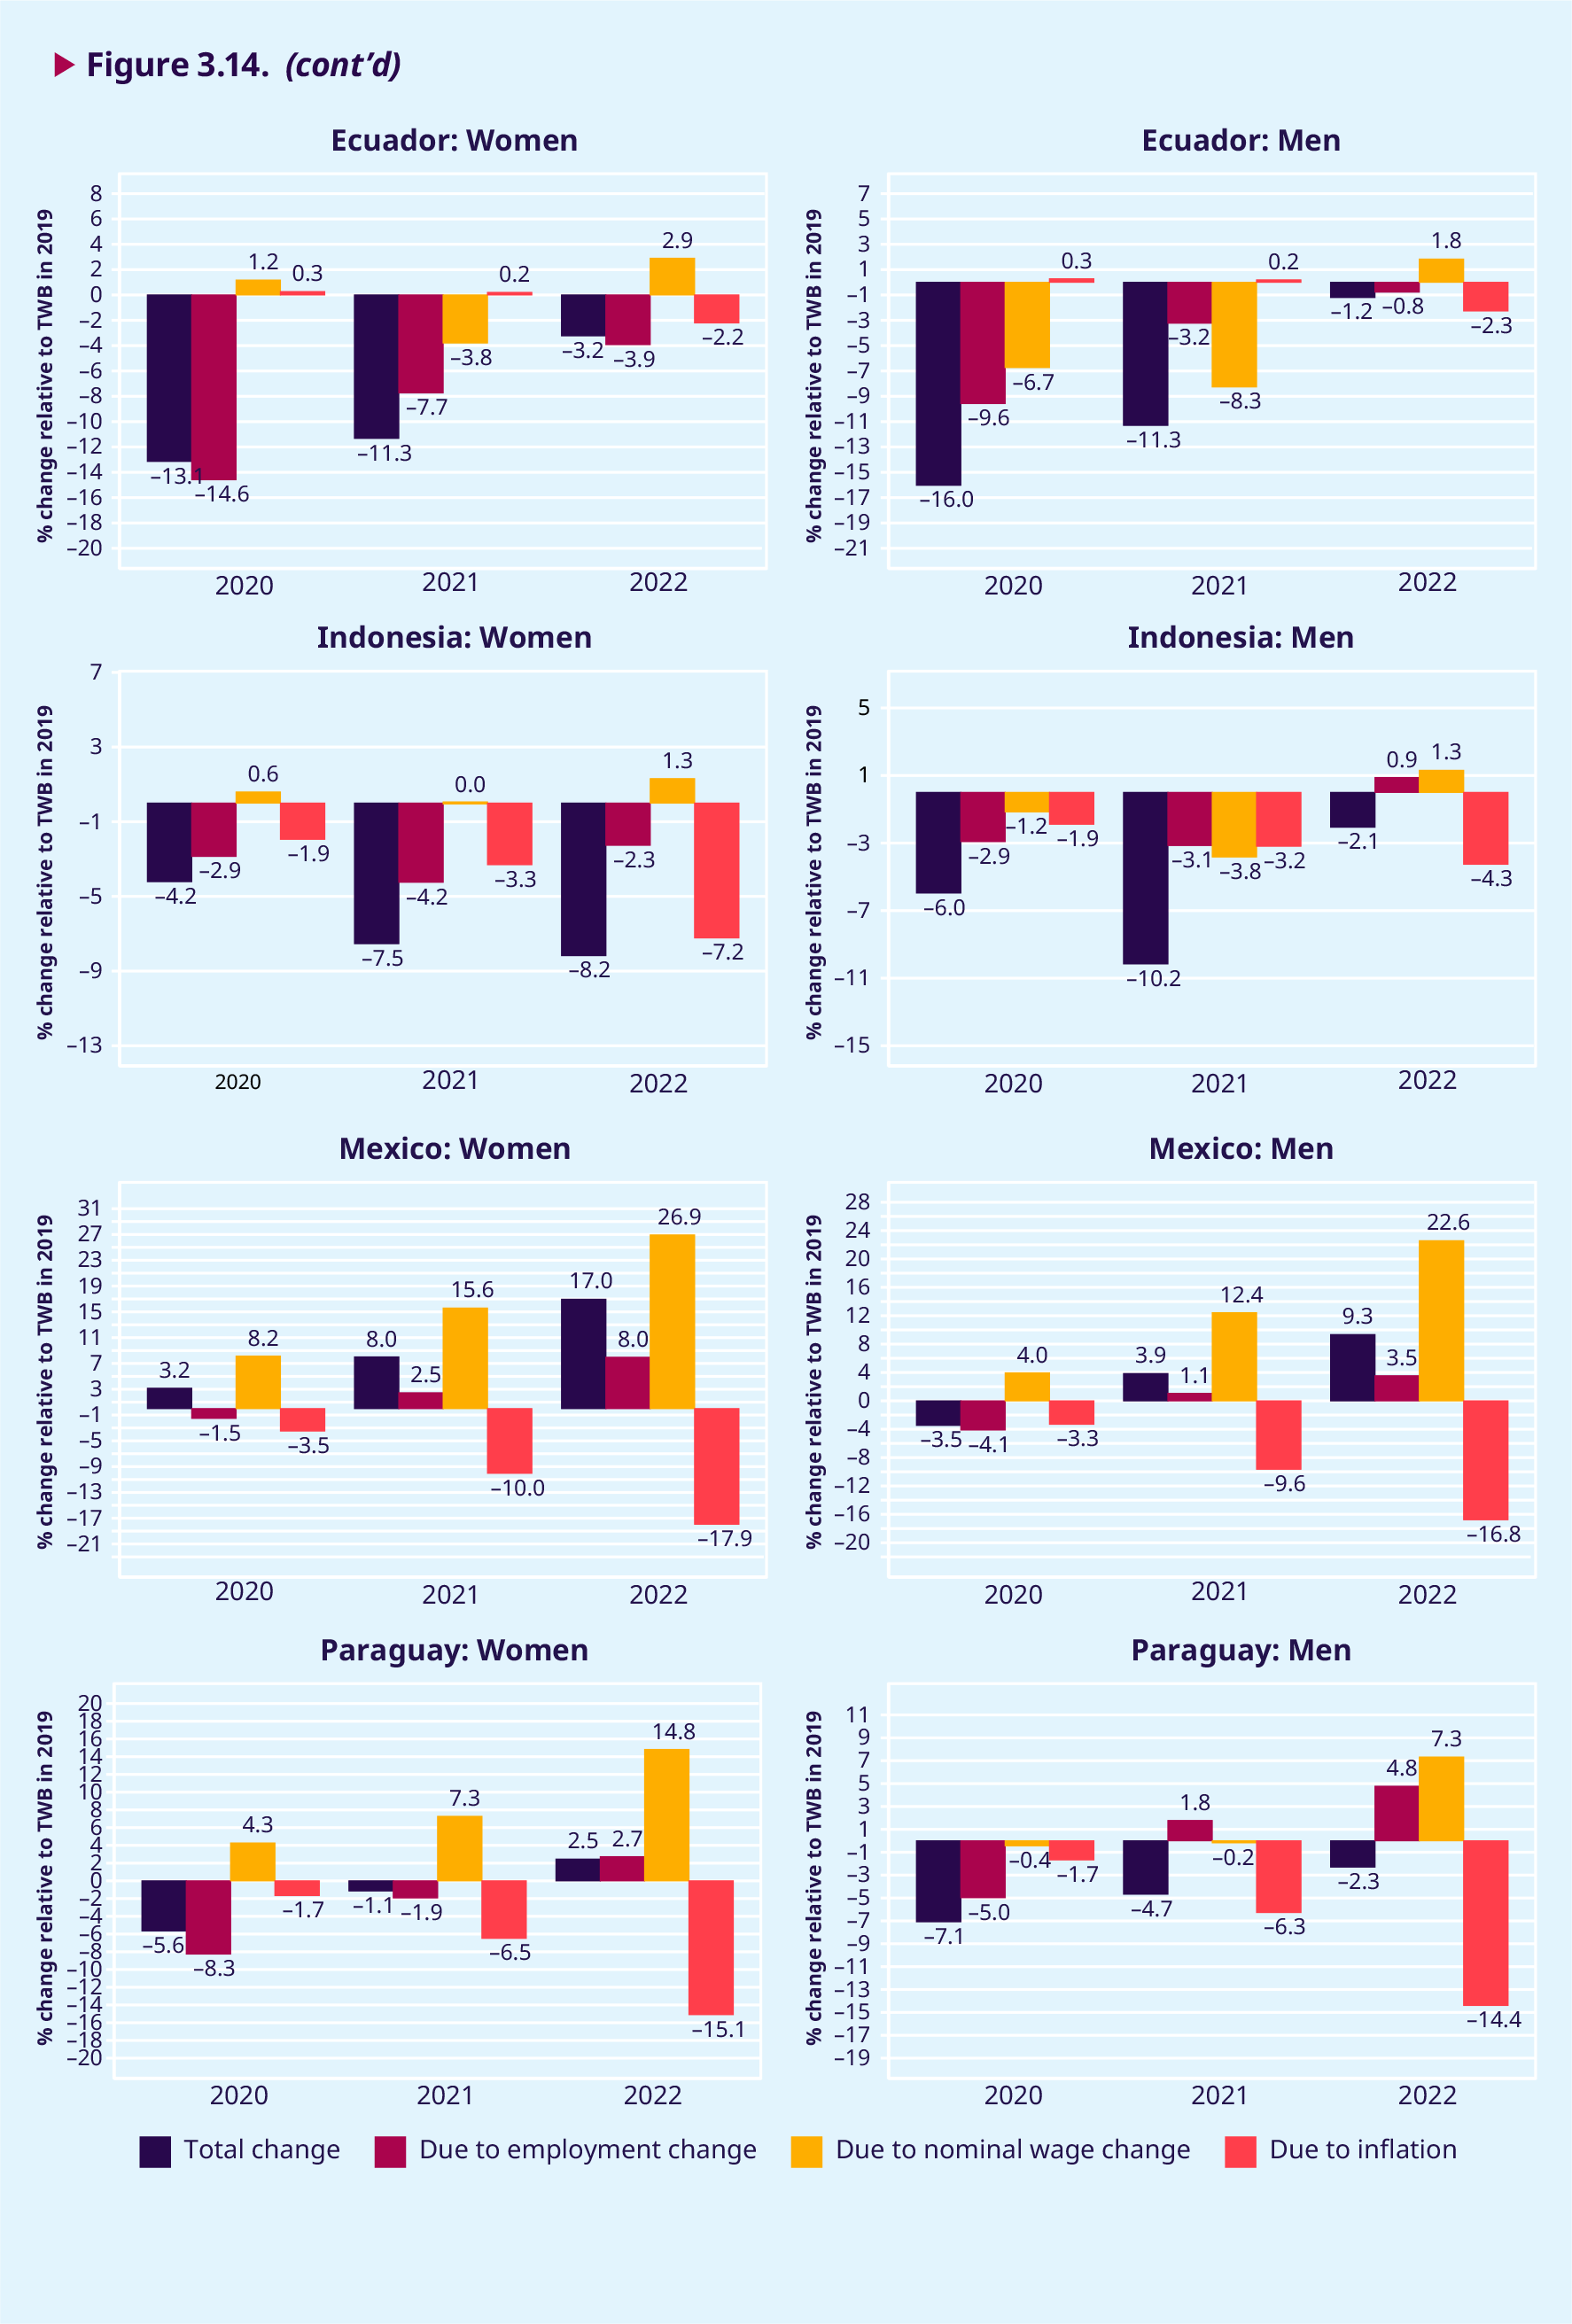
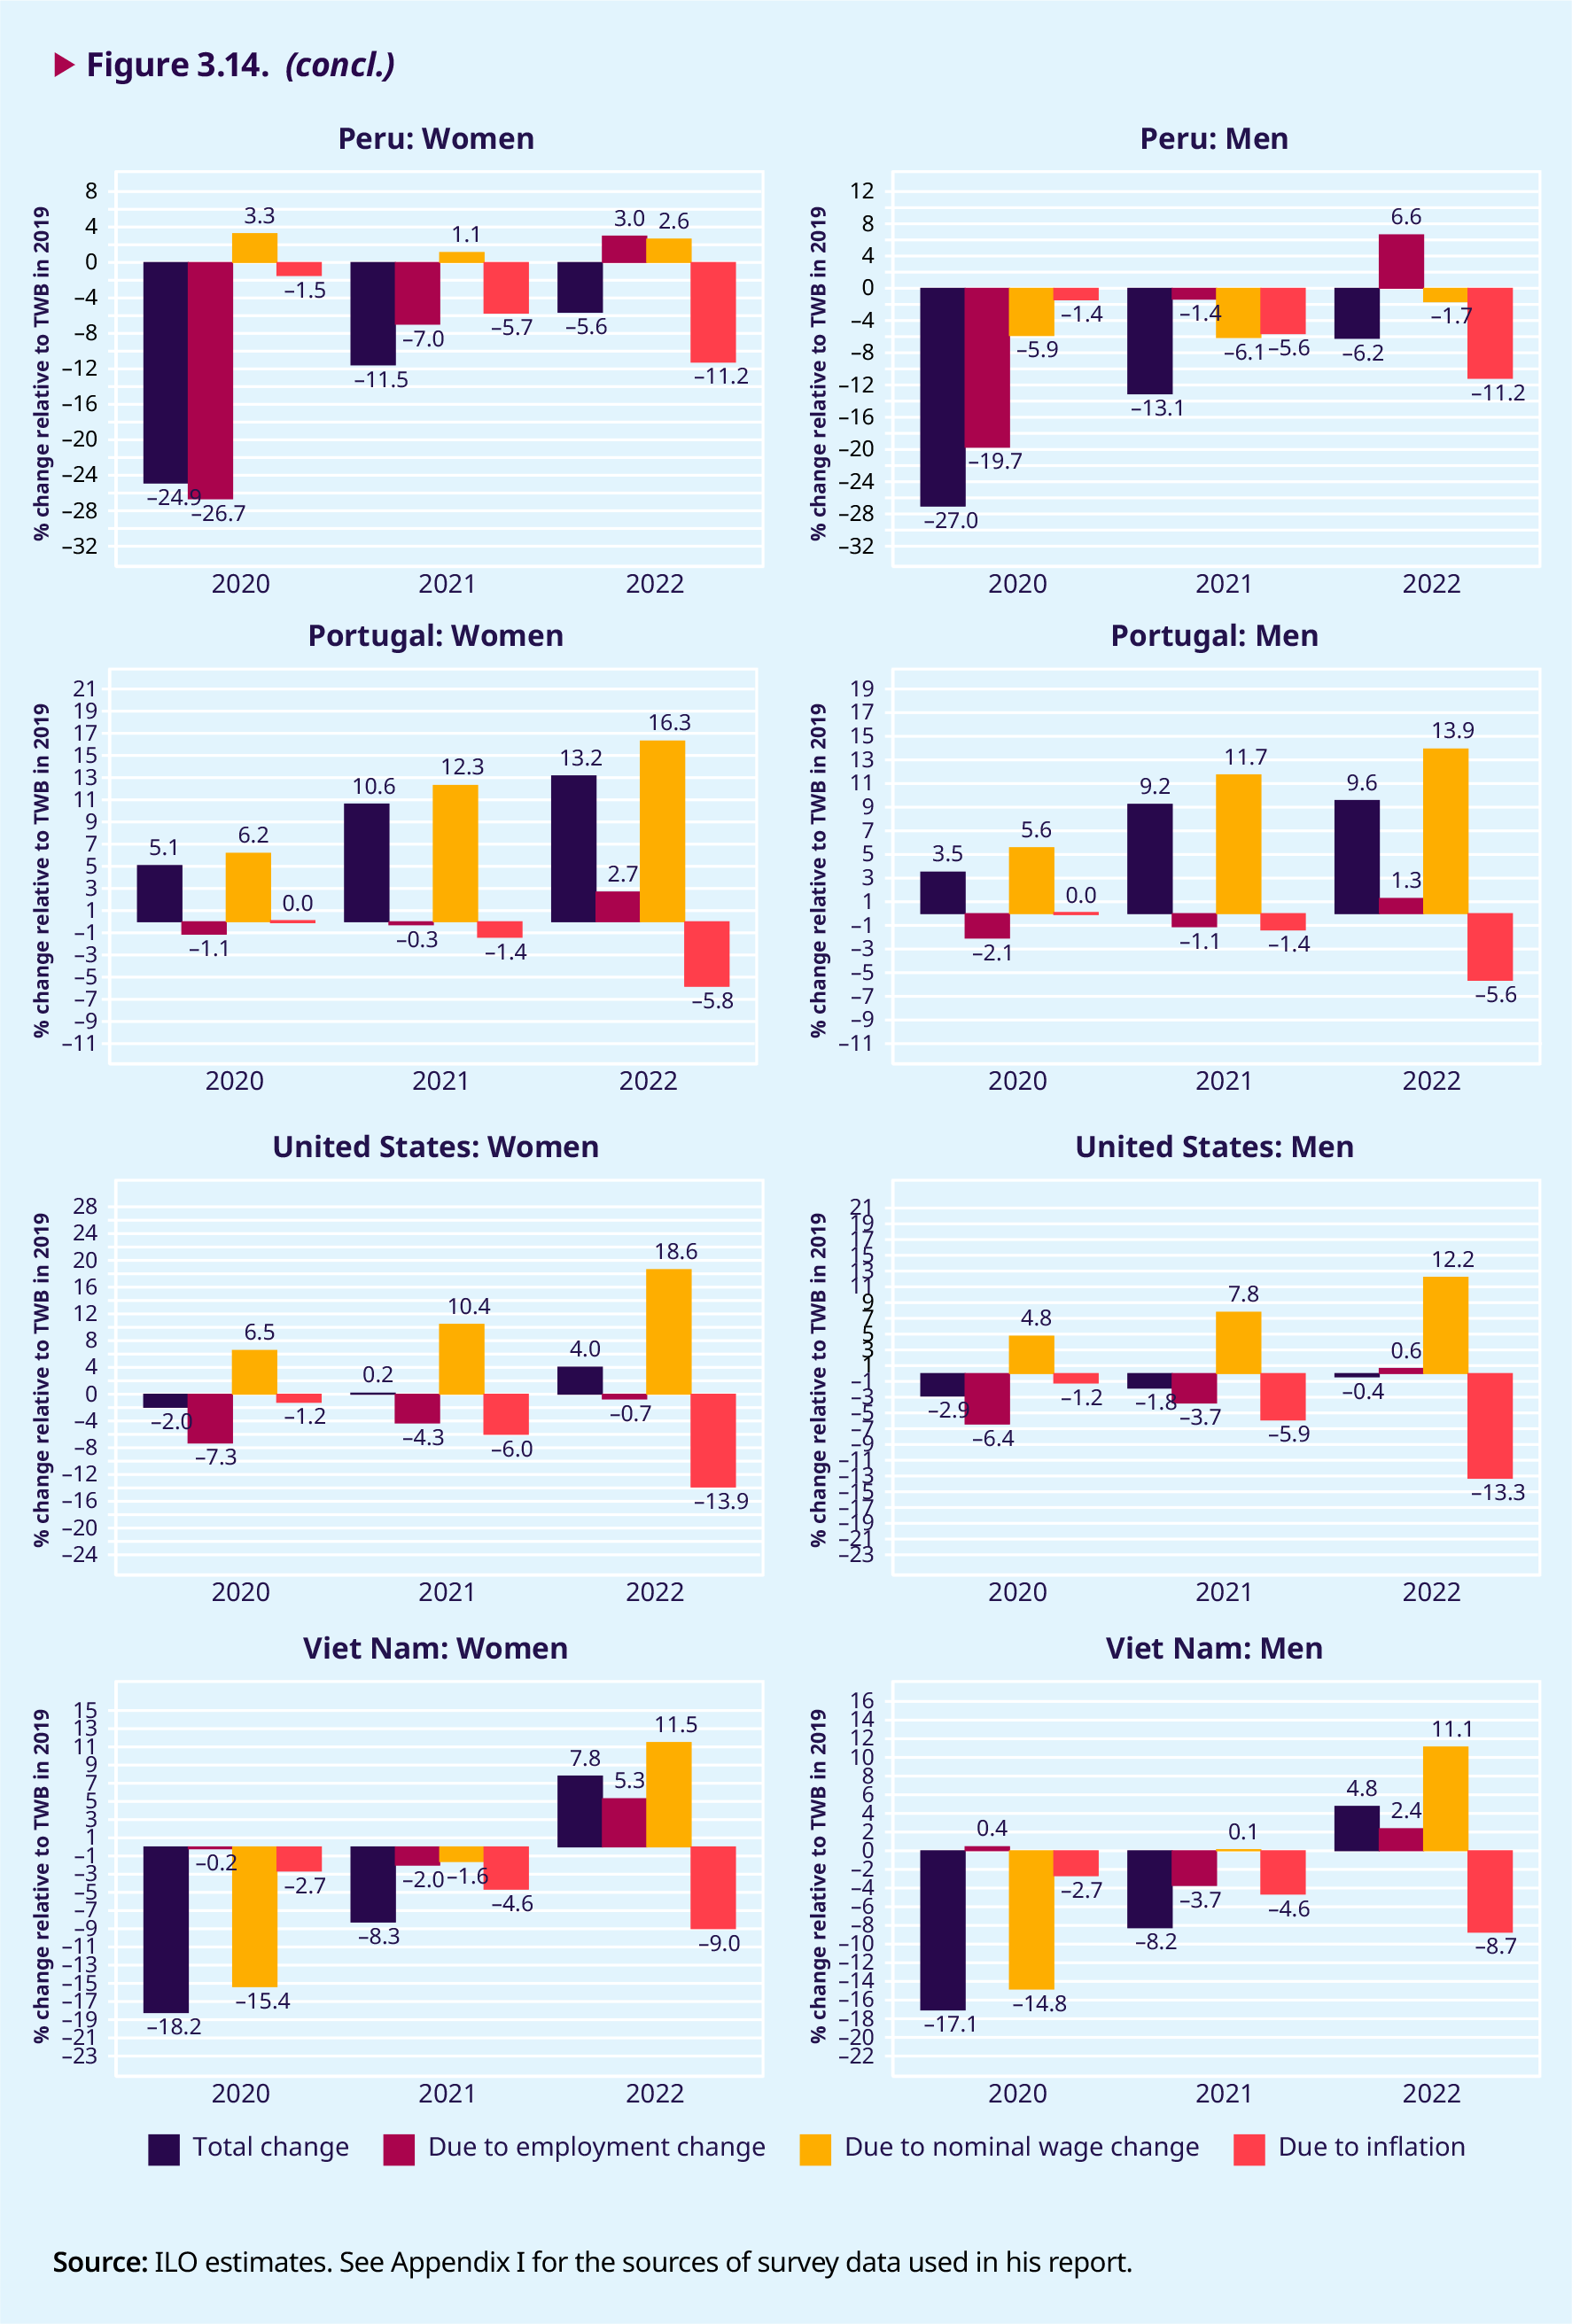
This differentiated composition effect among women and men is probably due to the clustering of women and men at different points along the wage distribution, a phenomenon that was already highlighted in the Global Wage Report 2018/19 (ILO 2018). Thus, in many countries – particularly in low- and middle-income countries, where women’s participation in wage employment is often lower than that of men – women tend to be concentrated in specific sectors and occupations, often at the two extremes of the wage distribution, while male wage employees, who often dominate in number, are more likely to be spread across the distribution. When a crisis wipes out low-paid jobs, as was the case in 2020, the effect among women, who are over- represented at the low end of the wage distribution, as demonstrated in the Global Wage Report 2020/21 (ILO 2020a), is greater than that among men. At the same time, since the women remaining in wage employment are likely to be at the upper end of the wage distribution – whereas the men who remain employed tend to be more evenly spread across that distribution – the increase in nominal wages among women is likely to be higher than that observed among men. Paradoxically, therefore, the gender pay gap as measured by comparing the average wages of men and women may have diminished in some countries during the COVID-19 crisis. However, this most likely reflects the concentration of job losses among low-paid women, and hence a stronger composition effect, rather than an improvement in the average wages of working women.
.3.9. Changes in employment and wages across the wage distribution in the formal and informal economies
The decomposition of changes in the total wage bill in figures 3.13 and 3.14 provides insights into the impact of the two ongoing crises on all wage employees, and on the different effects that they have had – and continue to have – on women and men. However, neither figure sheds light on whether the crises have affected workers differently depending on their position along the wage distribution. By way of complementing the findings presented in section 3.8, this section therefore examines changes in employment and wage outcomes (nominal and real) across the wage distribution from 2020 to 2022 for a selection of countries, and for paid workers in both the formal and the informal economy. The analysis shows how the employment and wages of low-paid workers and workers in the informal economy have been disproportionately impacted by the ongoing crises, and in particular by the COVID-19 crisis.
Based on a selection of countries representing various regions of the world,14 figure 3.15 shows the changes in employment, nominal wages and real wages over time and at five different pos- itions on the wage distribution.15 These five pos- itions are identified as follows: in 2019, wage workers were ranked according to their month- ly earnings and grouped into quintiles, that is, the bottom 20 per cent of wage employees, the top 20 per cent and three intermediary groups, each also comprising 20 per cent. The threshold values defining the five groups in 2019 were used to sub- divide the population of wage employees in subse- quent years after converting the thresholds into real values using a given country’s CPI.16 Thus, whereas each of the five groups includes exactly 20 per cent of wage employees in 2019, the share of each group in subsequent years can vary depending on how the dynamics in the labour market, and in particu- lar the ongoing crises, are impacting on the distri- bution of wage employment and workers’ monthly earnings in subsequent years. Therefore, when re- porting changes in employment and wages during 2020–22, instead of “quintiles”, it is more appropri- ate to refer to the five groups using ordinal terms: the lowest-paid group, the second-lowest and so on until the highest-paid group.
The employment and wages of low-paid workers and workers in the informal economy have been disproportionately impacted by the ongoing crises.
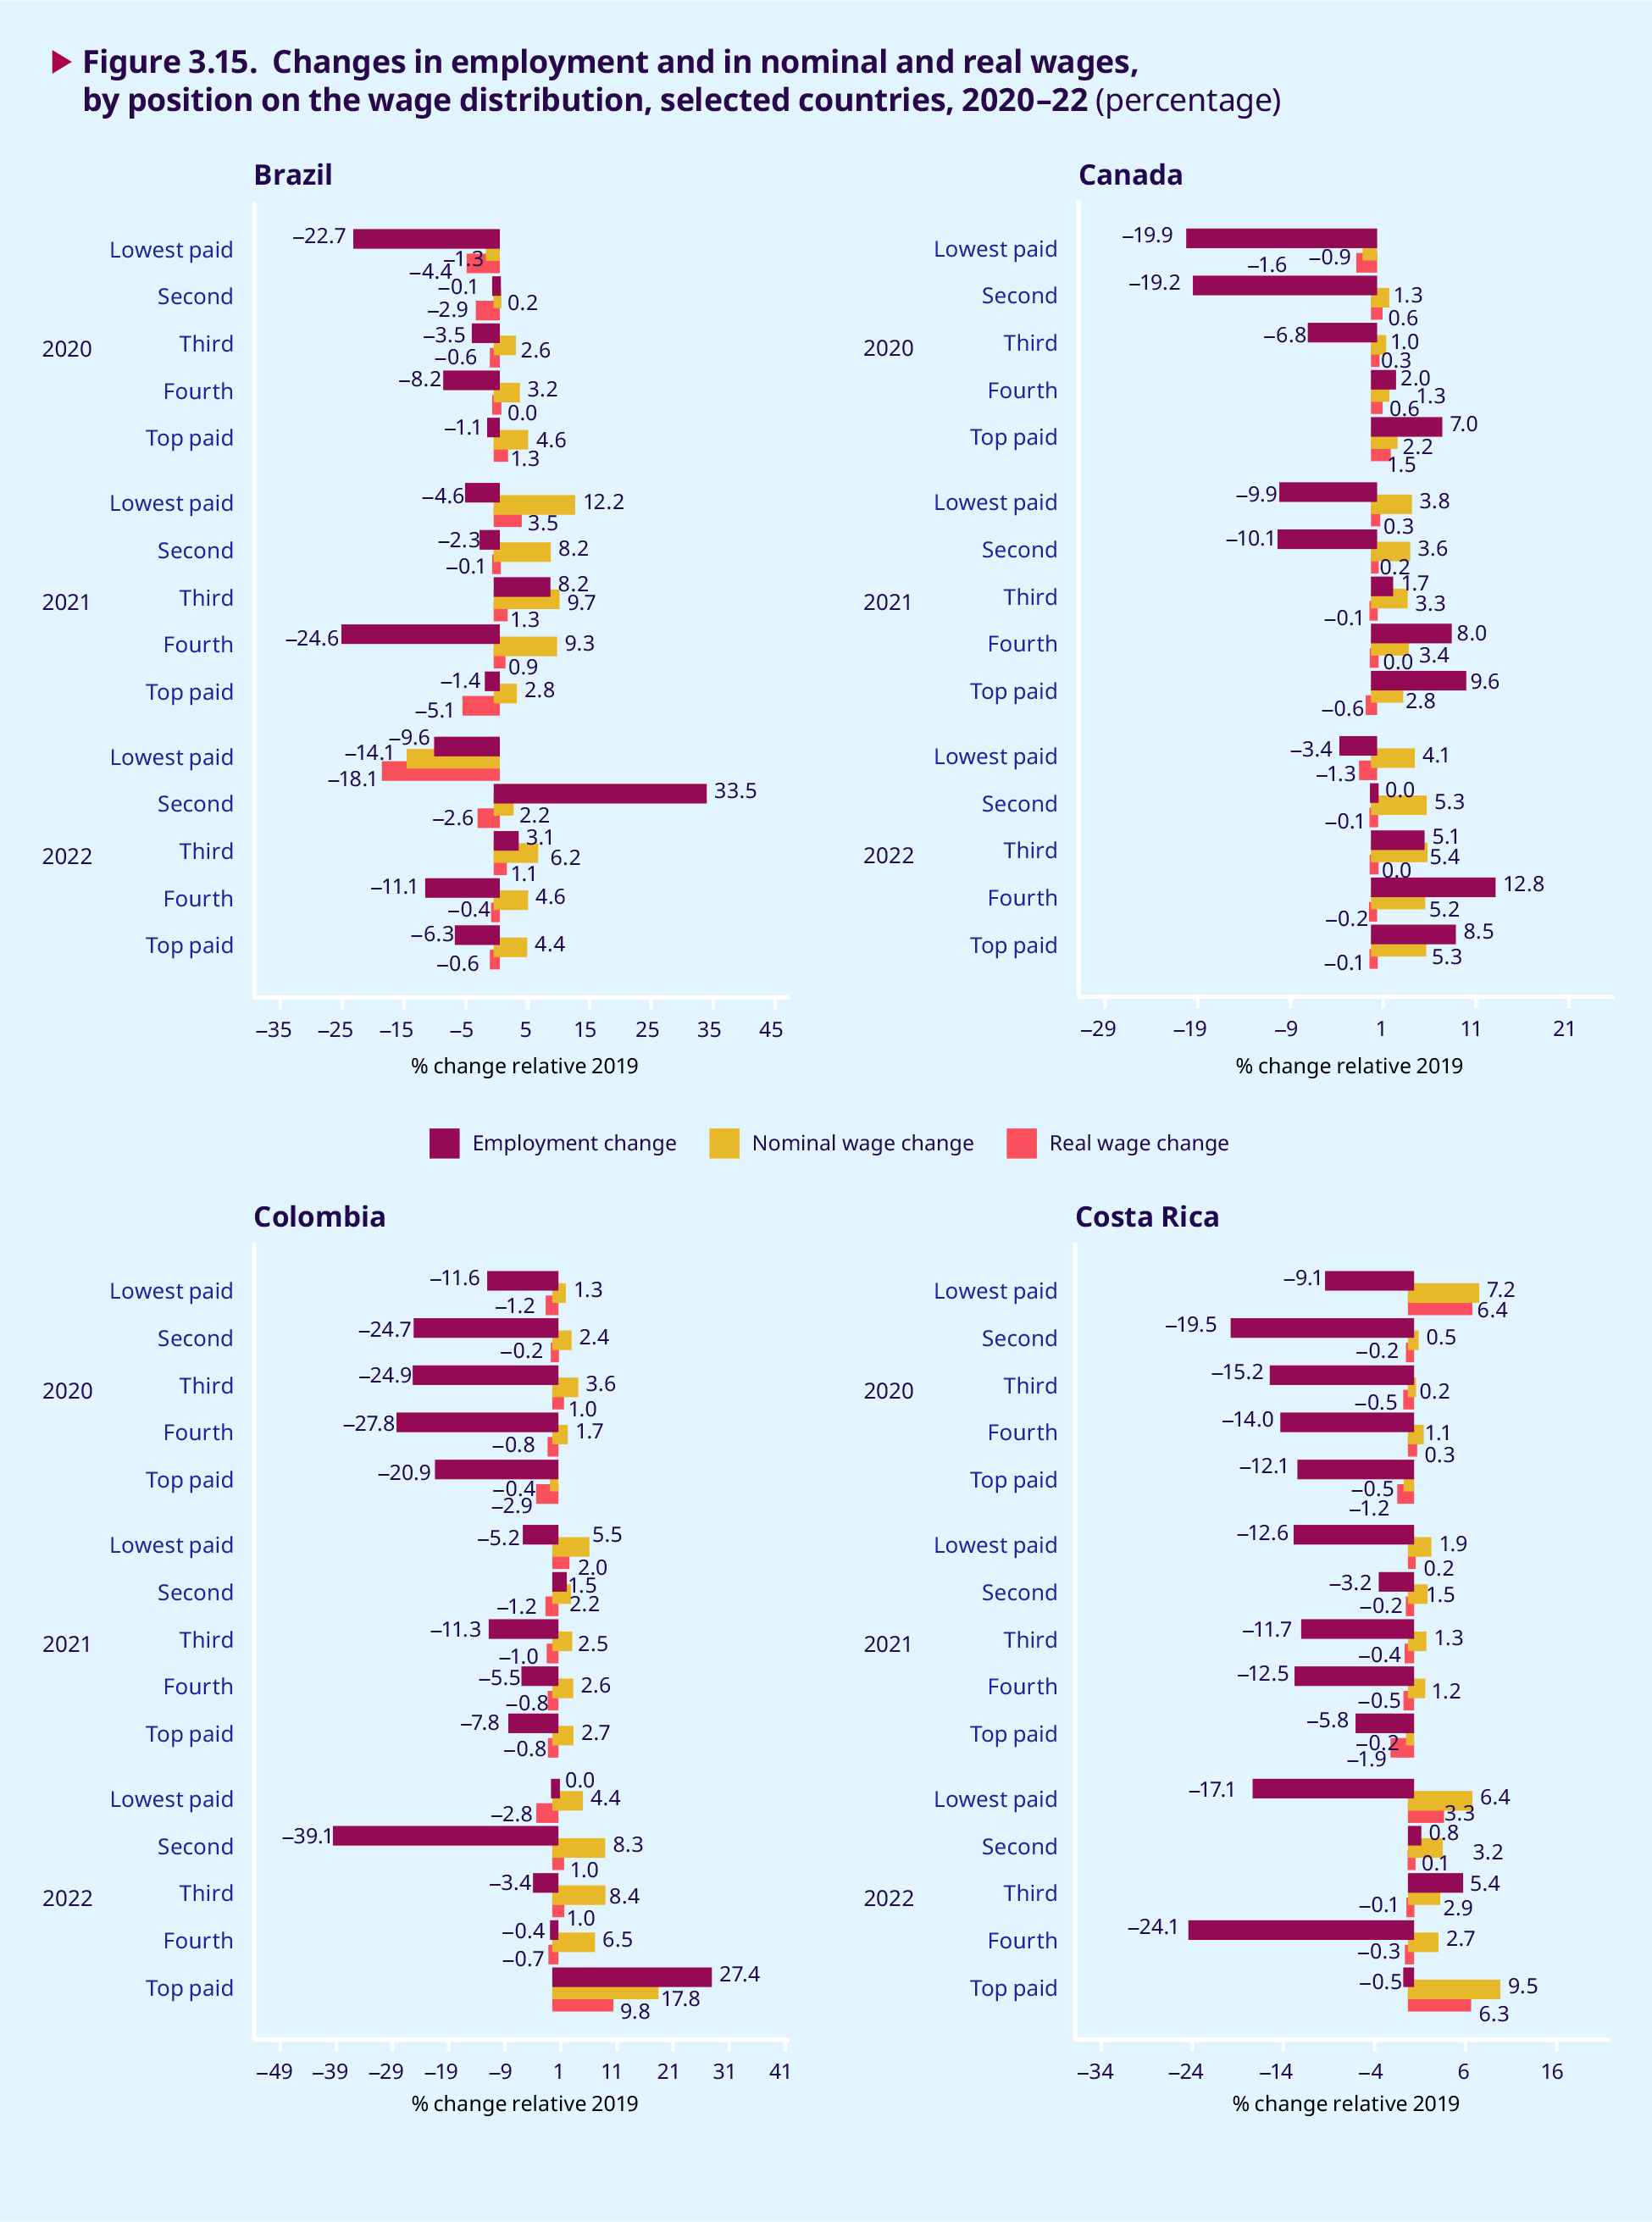
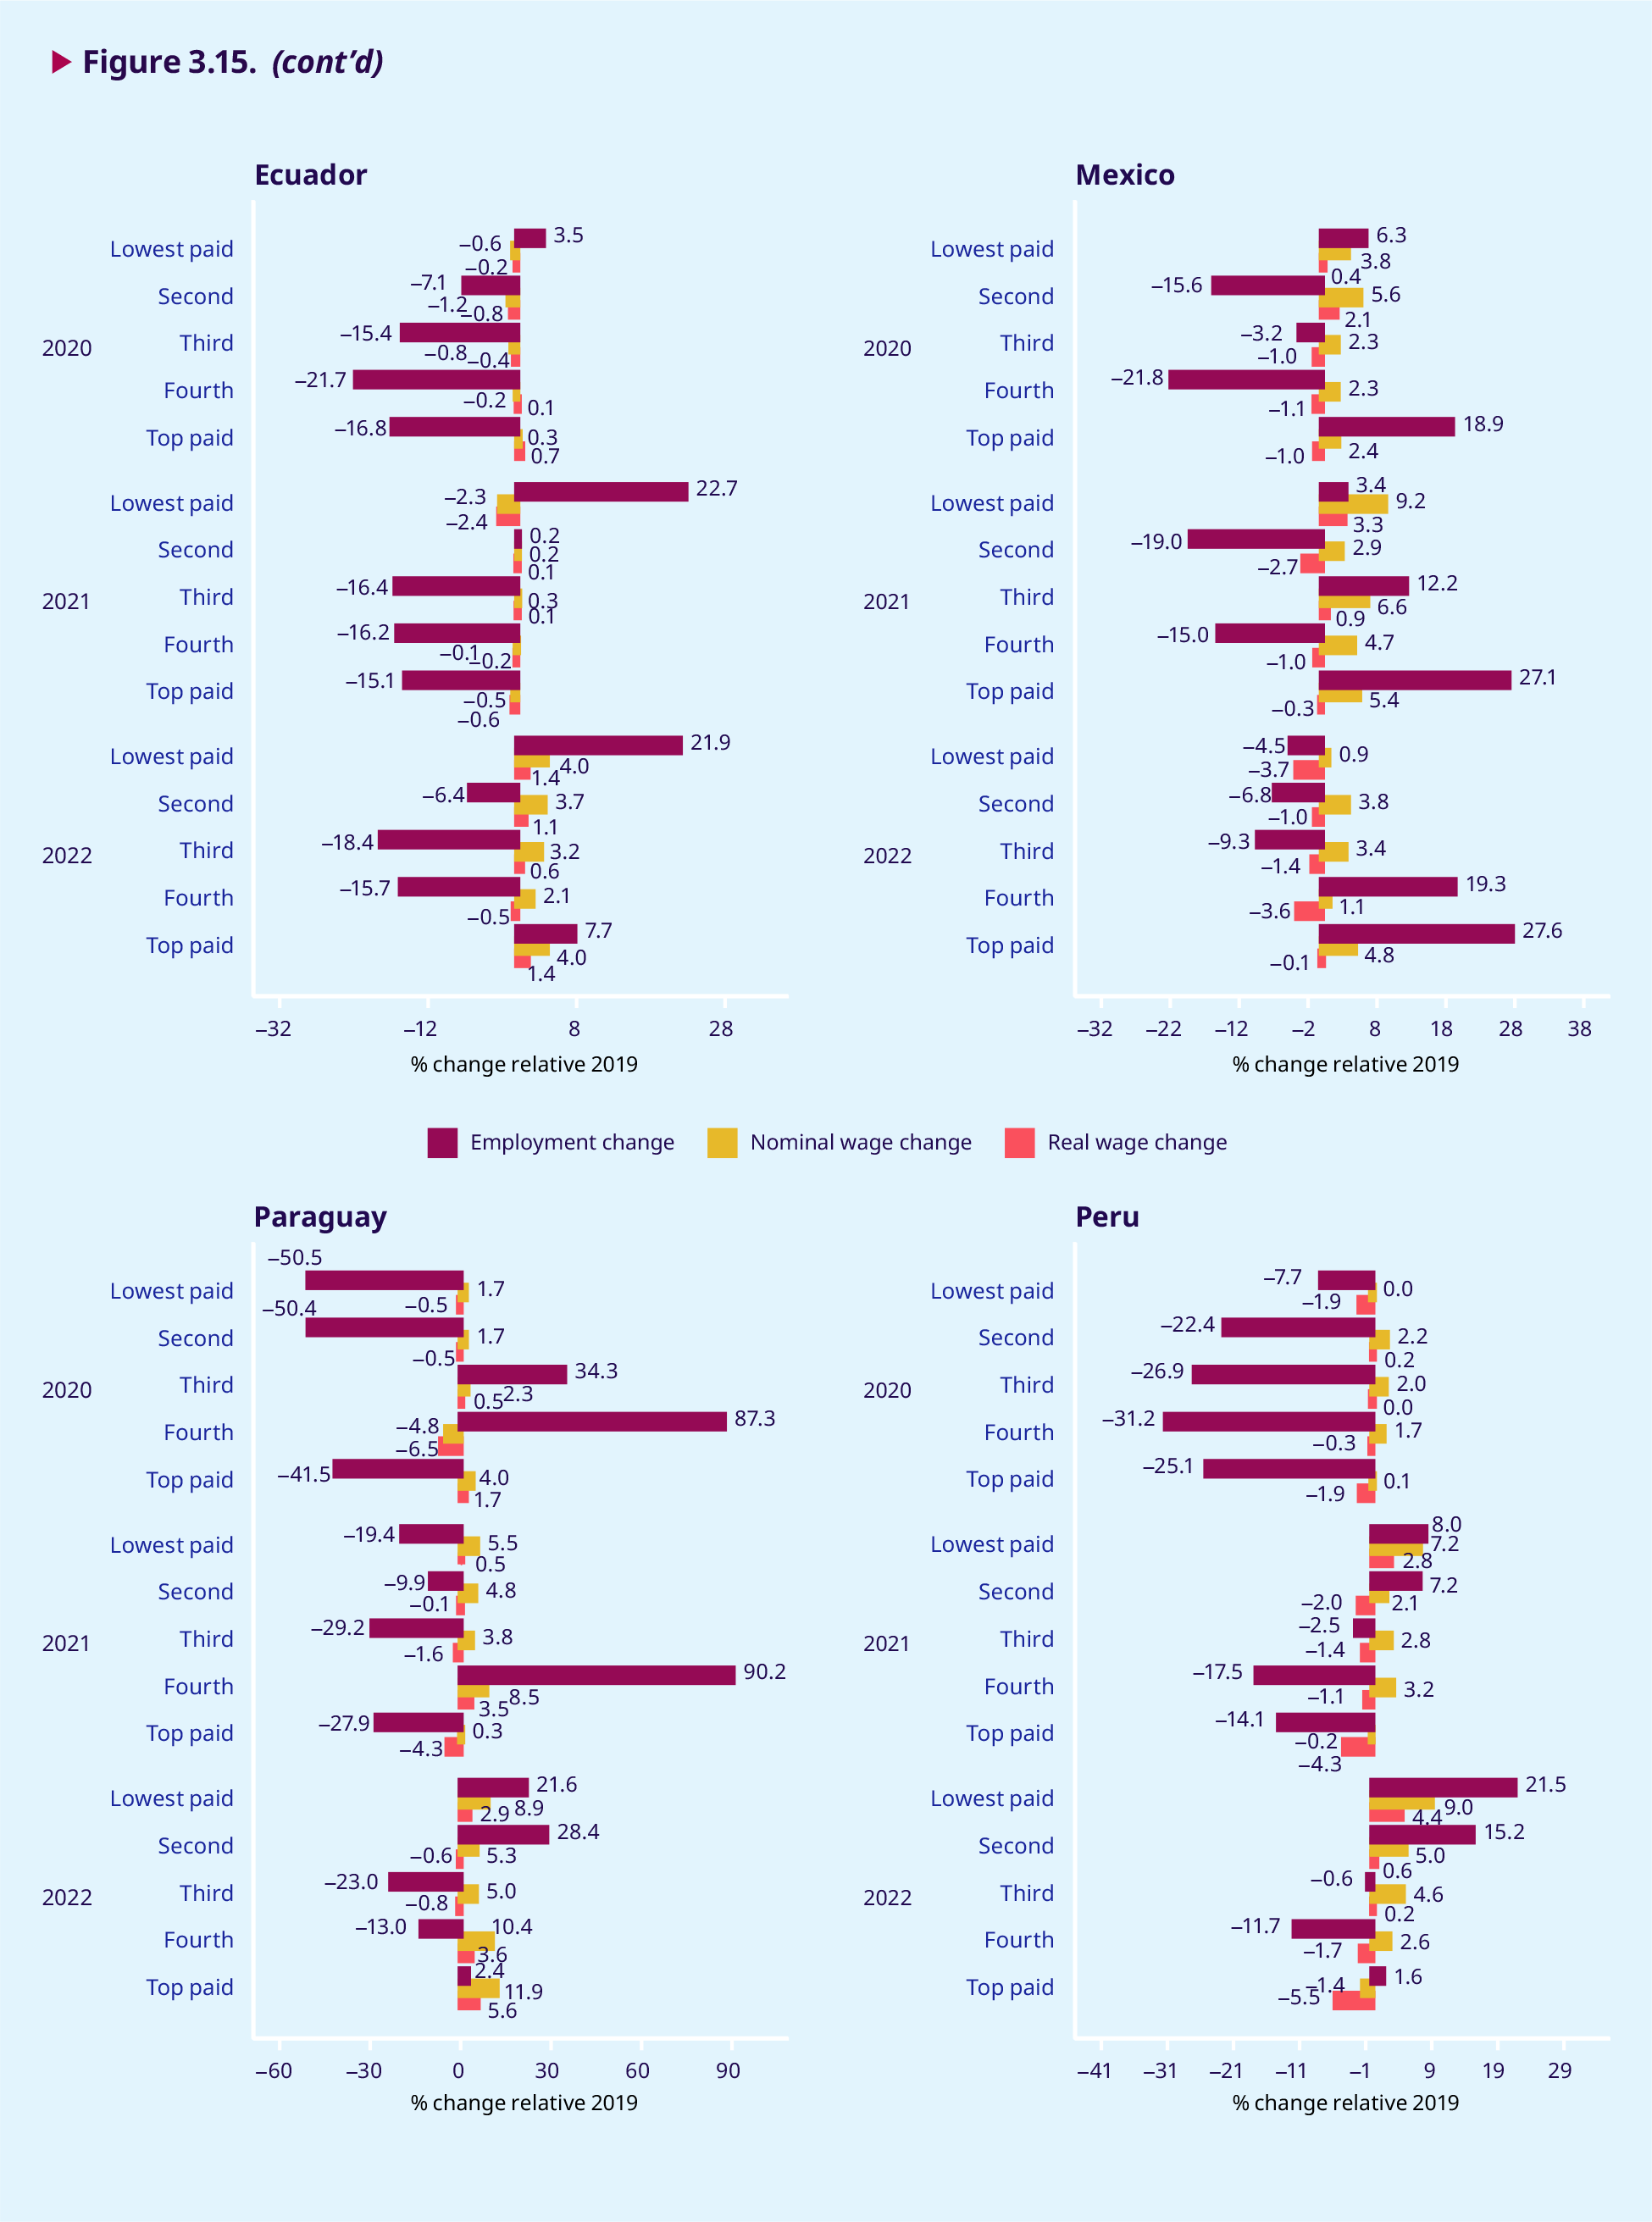
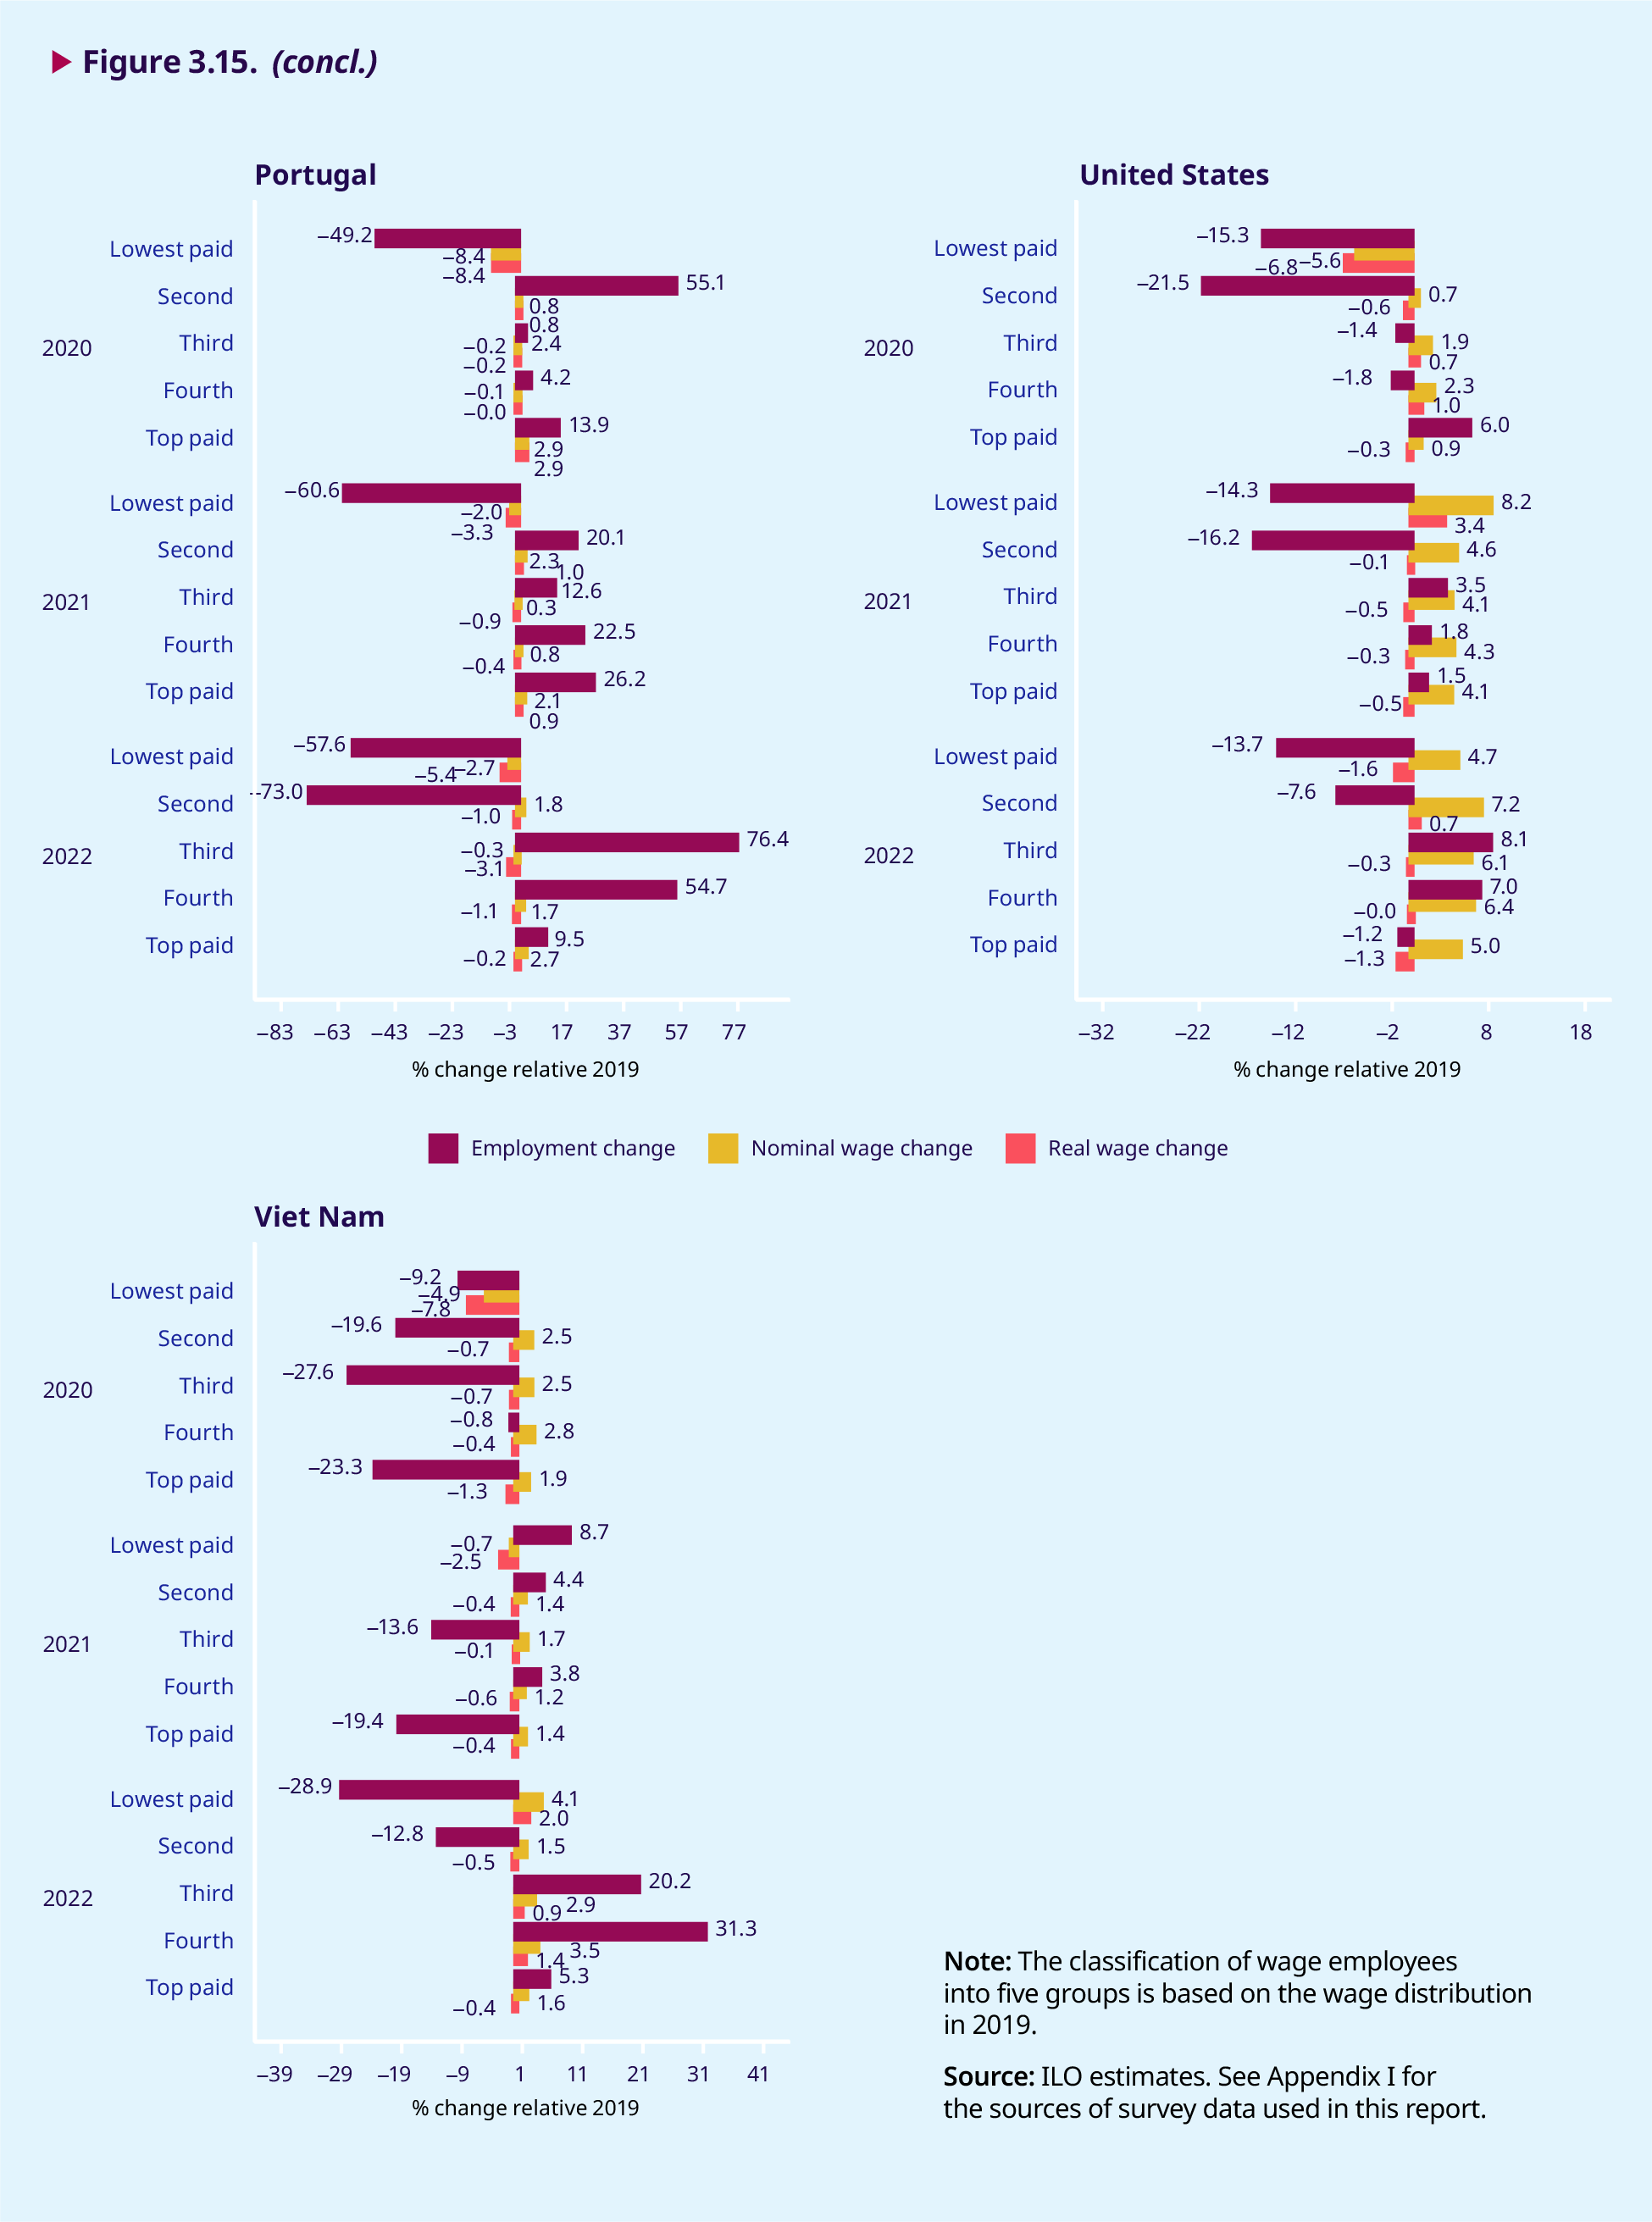
Figure 3.15 shows that all five groups across the wage distribution in almost all countries suffered employment losses during 2020, the first year of the COVID-19 crisis. In 8 of 11 countries, the losses were greatest among the lowest-paid and second- lowest-paid groups. For example, in Brazil, the group at the bottom lost almost 23 per cent of wage employment relative to 2019, whereas employment losses in the higher-paid groups ranged from 3 to about 8 per cent. In Portugal, the employment loss of the lowest-paid group was 49 per cent, whereas employment in the second-lowest-paid group increased by 55 per cent in 2020. This could be because some workers in the third-lowest-paid group received lower earnings, which would have pushed them into the second-lowest-paid group, but also because of an increase in earnings above inflation, which would have pushed some of the lowest-paid into the next group. An interesting contrast between groups in 2020 may be observed in relation to nominal wage increases. In most countries, nominal wages increase – alongside a decline in employment – for earners in the second- lowest-paid and all higher-paid groups, but not among the lowest-paid group. This means that there is no composition effect among the lowest- paid. In fact, in 2020, in 7 of 11 countries those in the lowest-paid group received lower nominal (and real) wages relative to 2019.
Turning to 2021 and 2022, employment in most countries recovers to levels similar to those seen in 2019. Nevertheless, in 7 of 11 countries, the employment level among the lowest-paid group in 2022 remains below that of 2019, while most other higher-paid wage groups have recovered to their pre-crisis levels. For example, in the United States, the lowest-paid and second-lowest-paid groups have shrunk in size by, respectively, 13.7 per cent and 7.6 per cent in 2022 relative to 2019. The lowest-paid group is also the one that generally has recovered the least in terms of nominal earnings. In Brazil and Portugal, the lowest-paid group receives nominal earnings in 2022 that are, respectively, 14.1 per cent and 2.7 per cent below the estimated average in 2019, whereas the highest-paid group receives nominal earnings that are, respectively, 4.4 per cent and 2.7 per cent higher than the averages in 2019. In most other countries, the lowest-paid have recovered nominal earnings, but at a lower rate than higher-paid groups. For example, in Colombia, Costa Rica and Mexico, nominal monthly earnings among the lowest-paid have increased by, respectively, 4.4 per cent, 6.4 per cent and 0.9 per cent, whereas among the highest-paid group they have increased by, respectively, 17.8 per cent, 9.5 per cent and 4.8 per cent. This means that, with inflation rates rising fast, the real wage increase at the bottom of the wage distribution lags behind that among top wage earners. For example, in Canada the lowest-paid have lost 1.3 per cent of the purchasing power of their earnings, whereas the nominal gains among top earners help them to (almost) keep up their purchasing power relative to 2019: they have experienced a real wage decline of just 0.1 per cent.
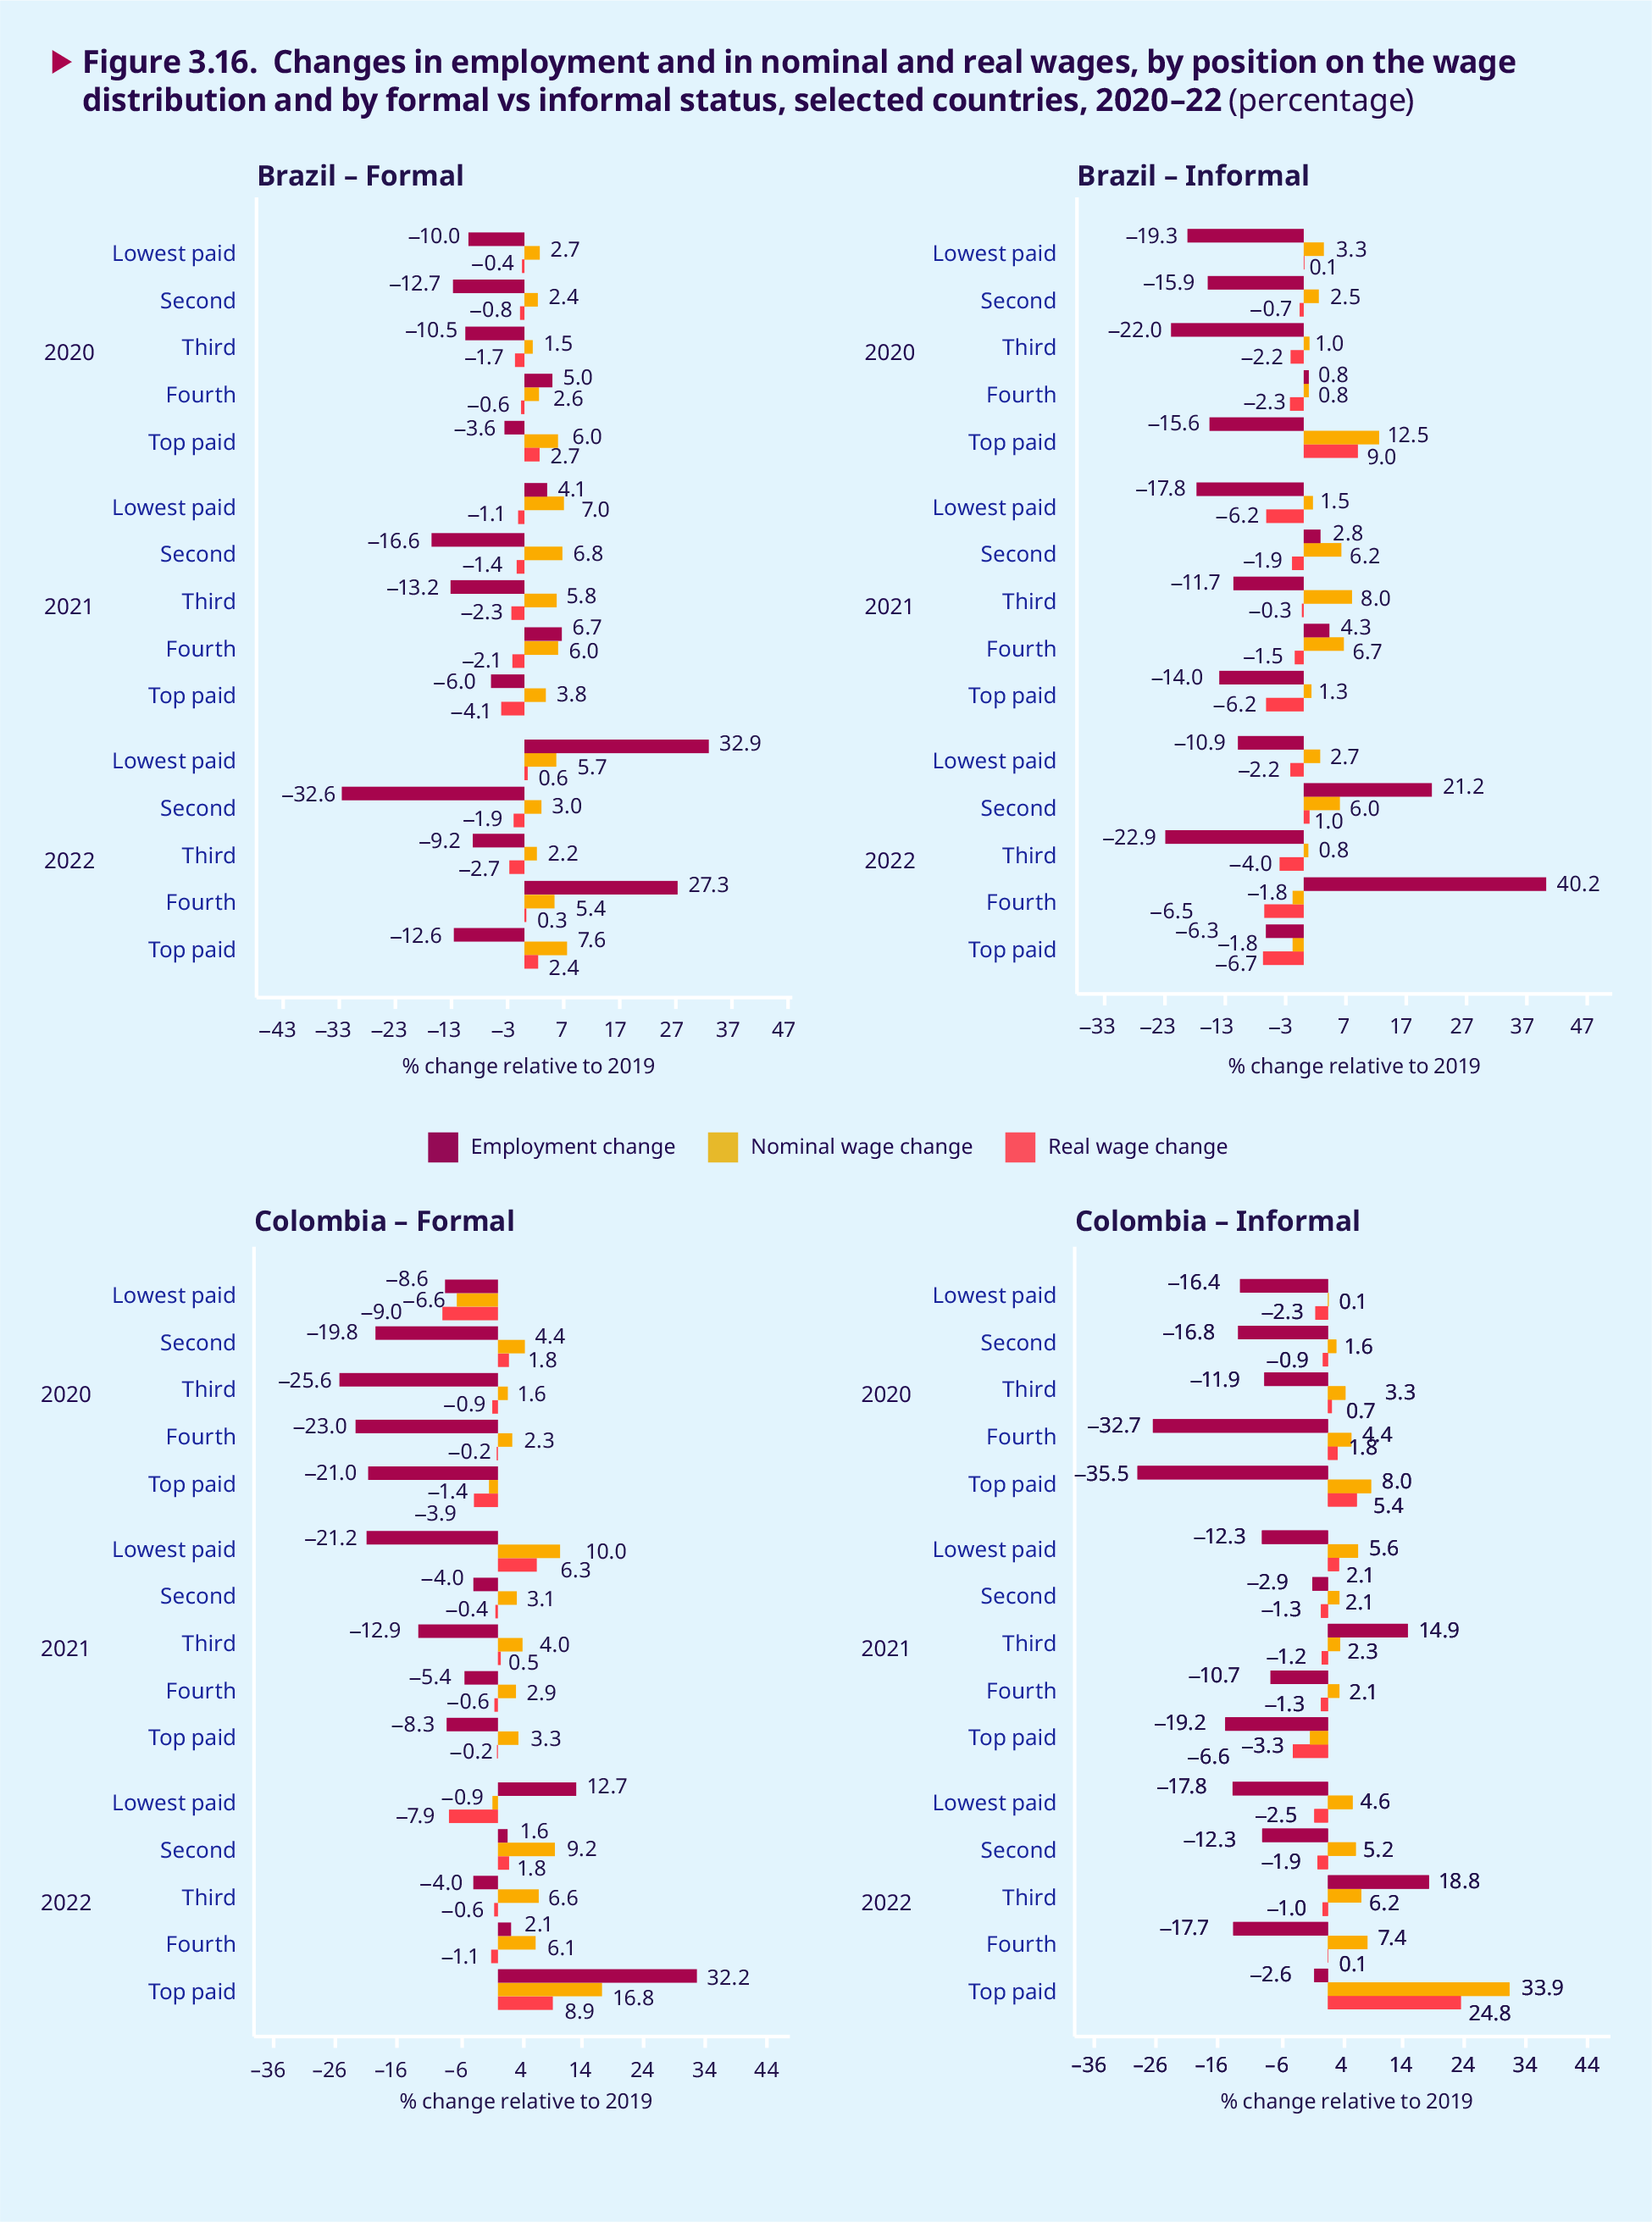
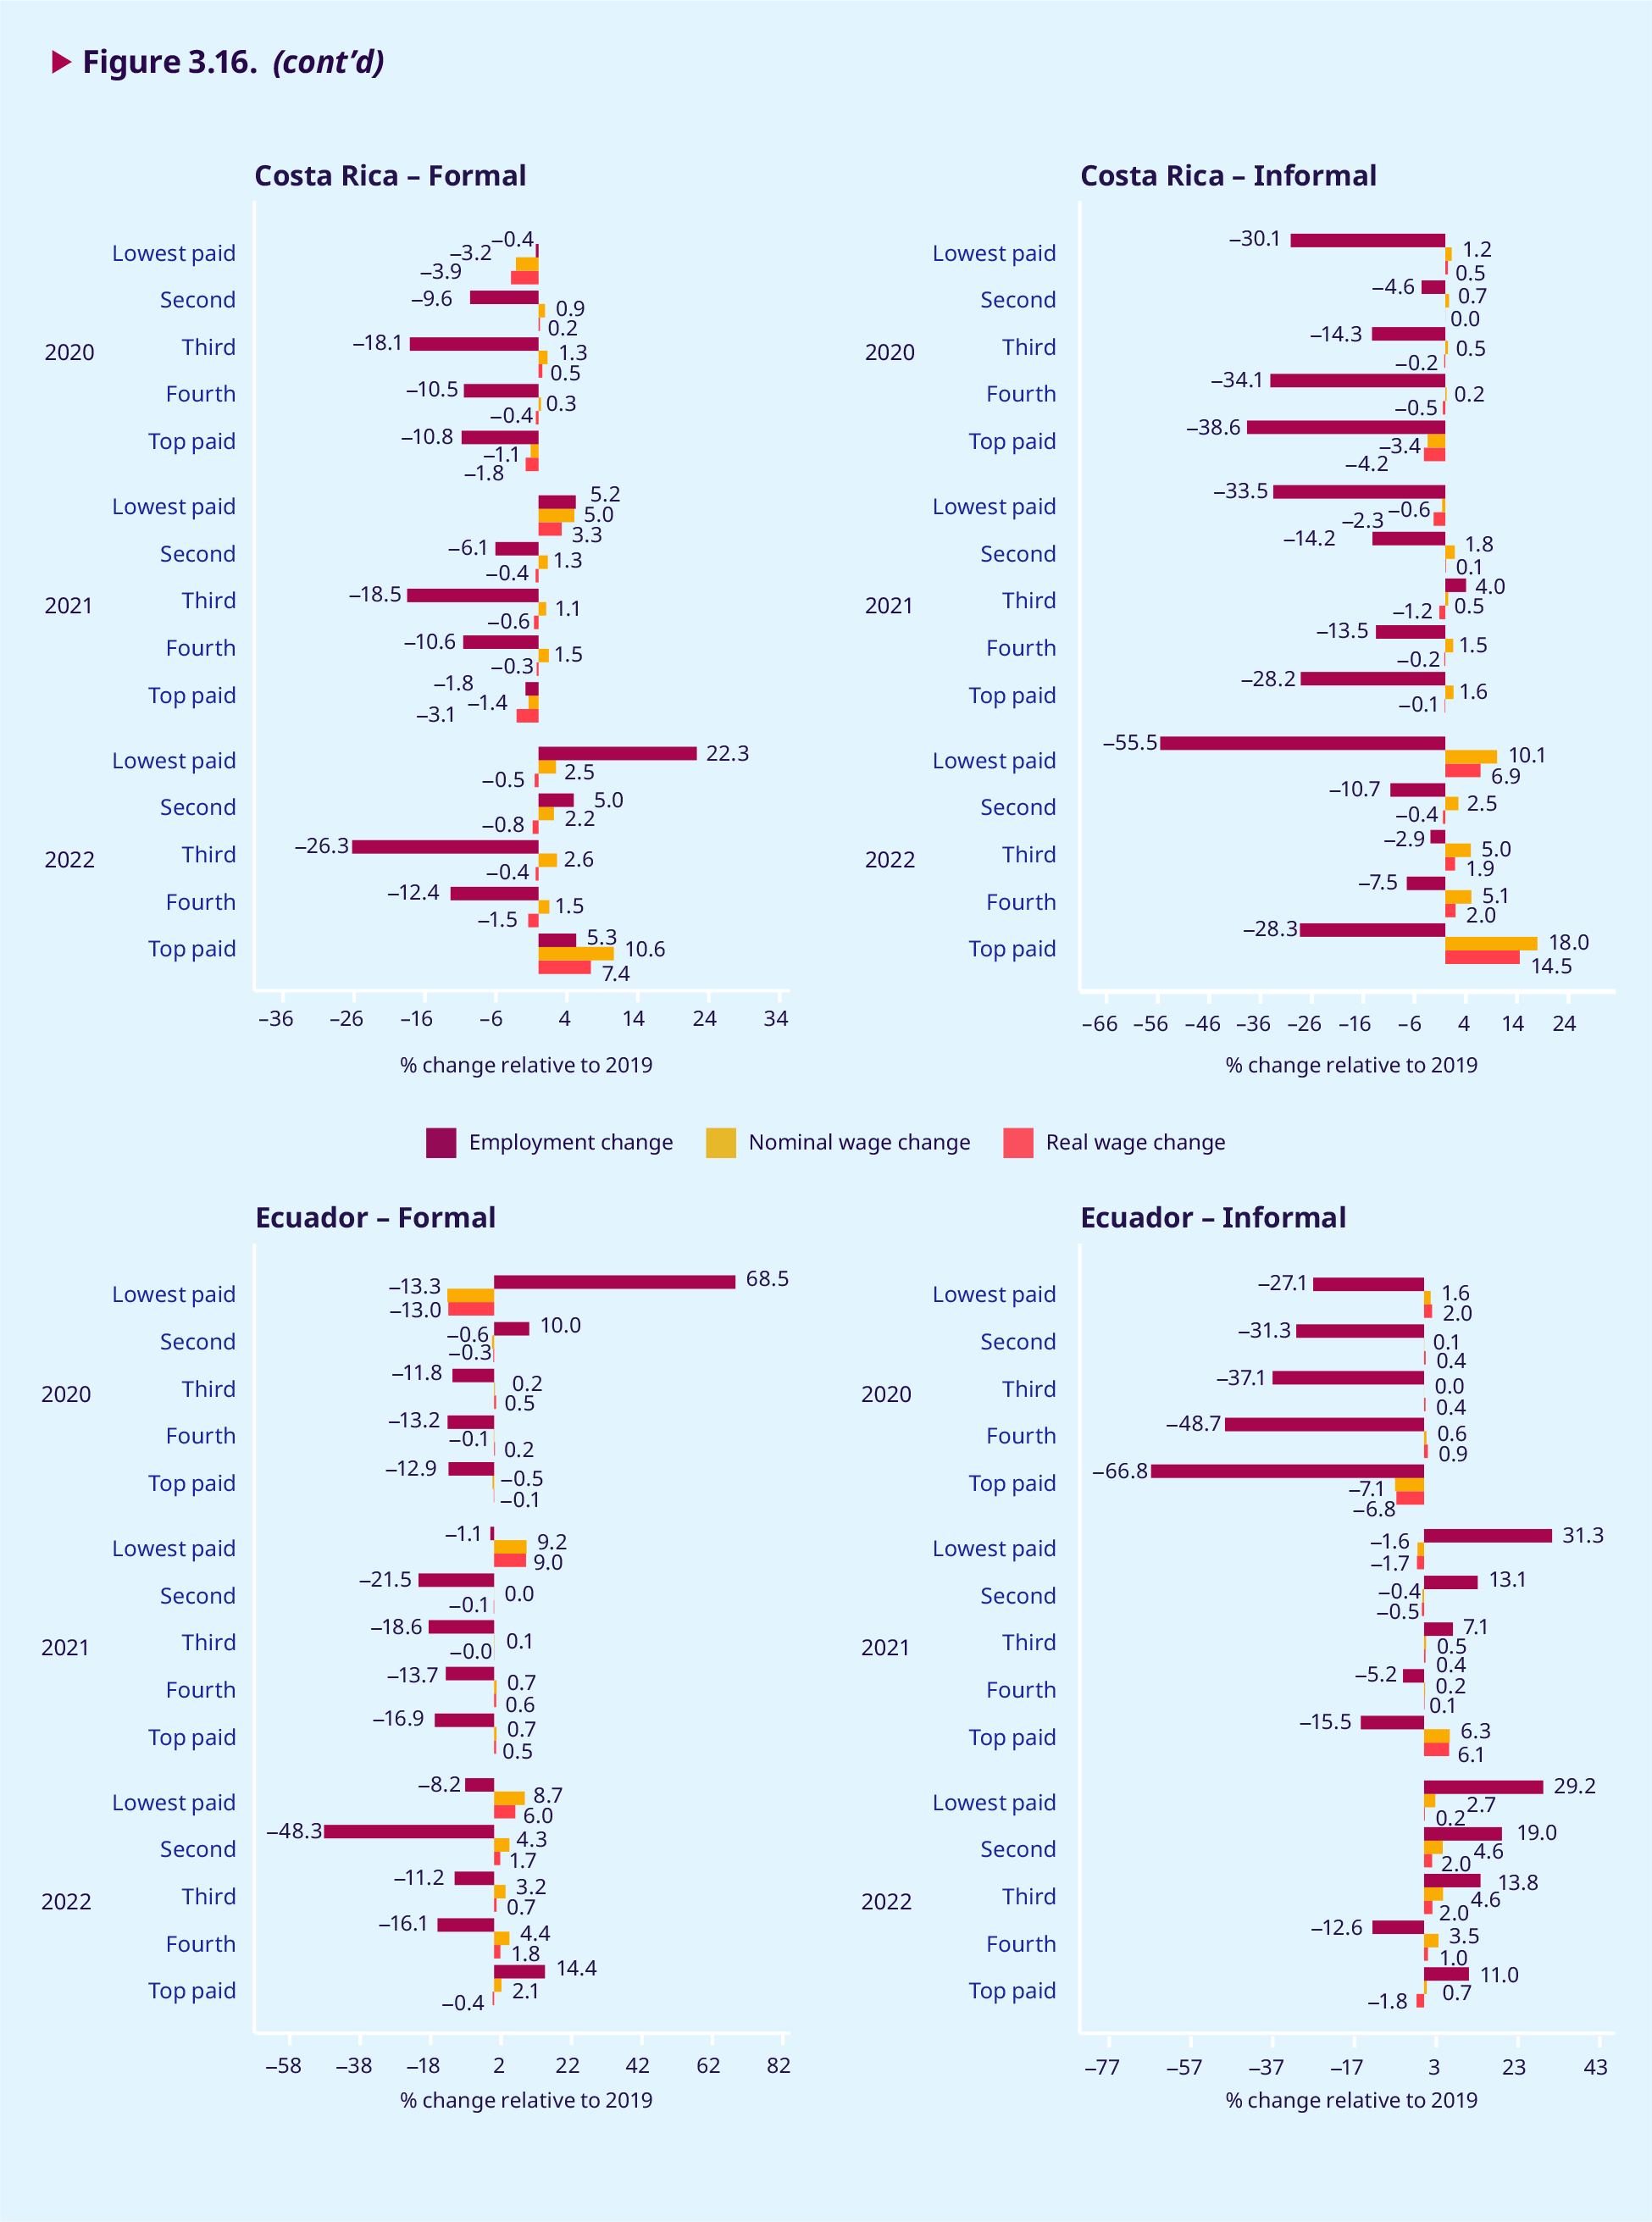
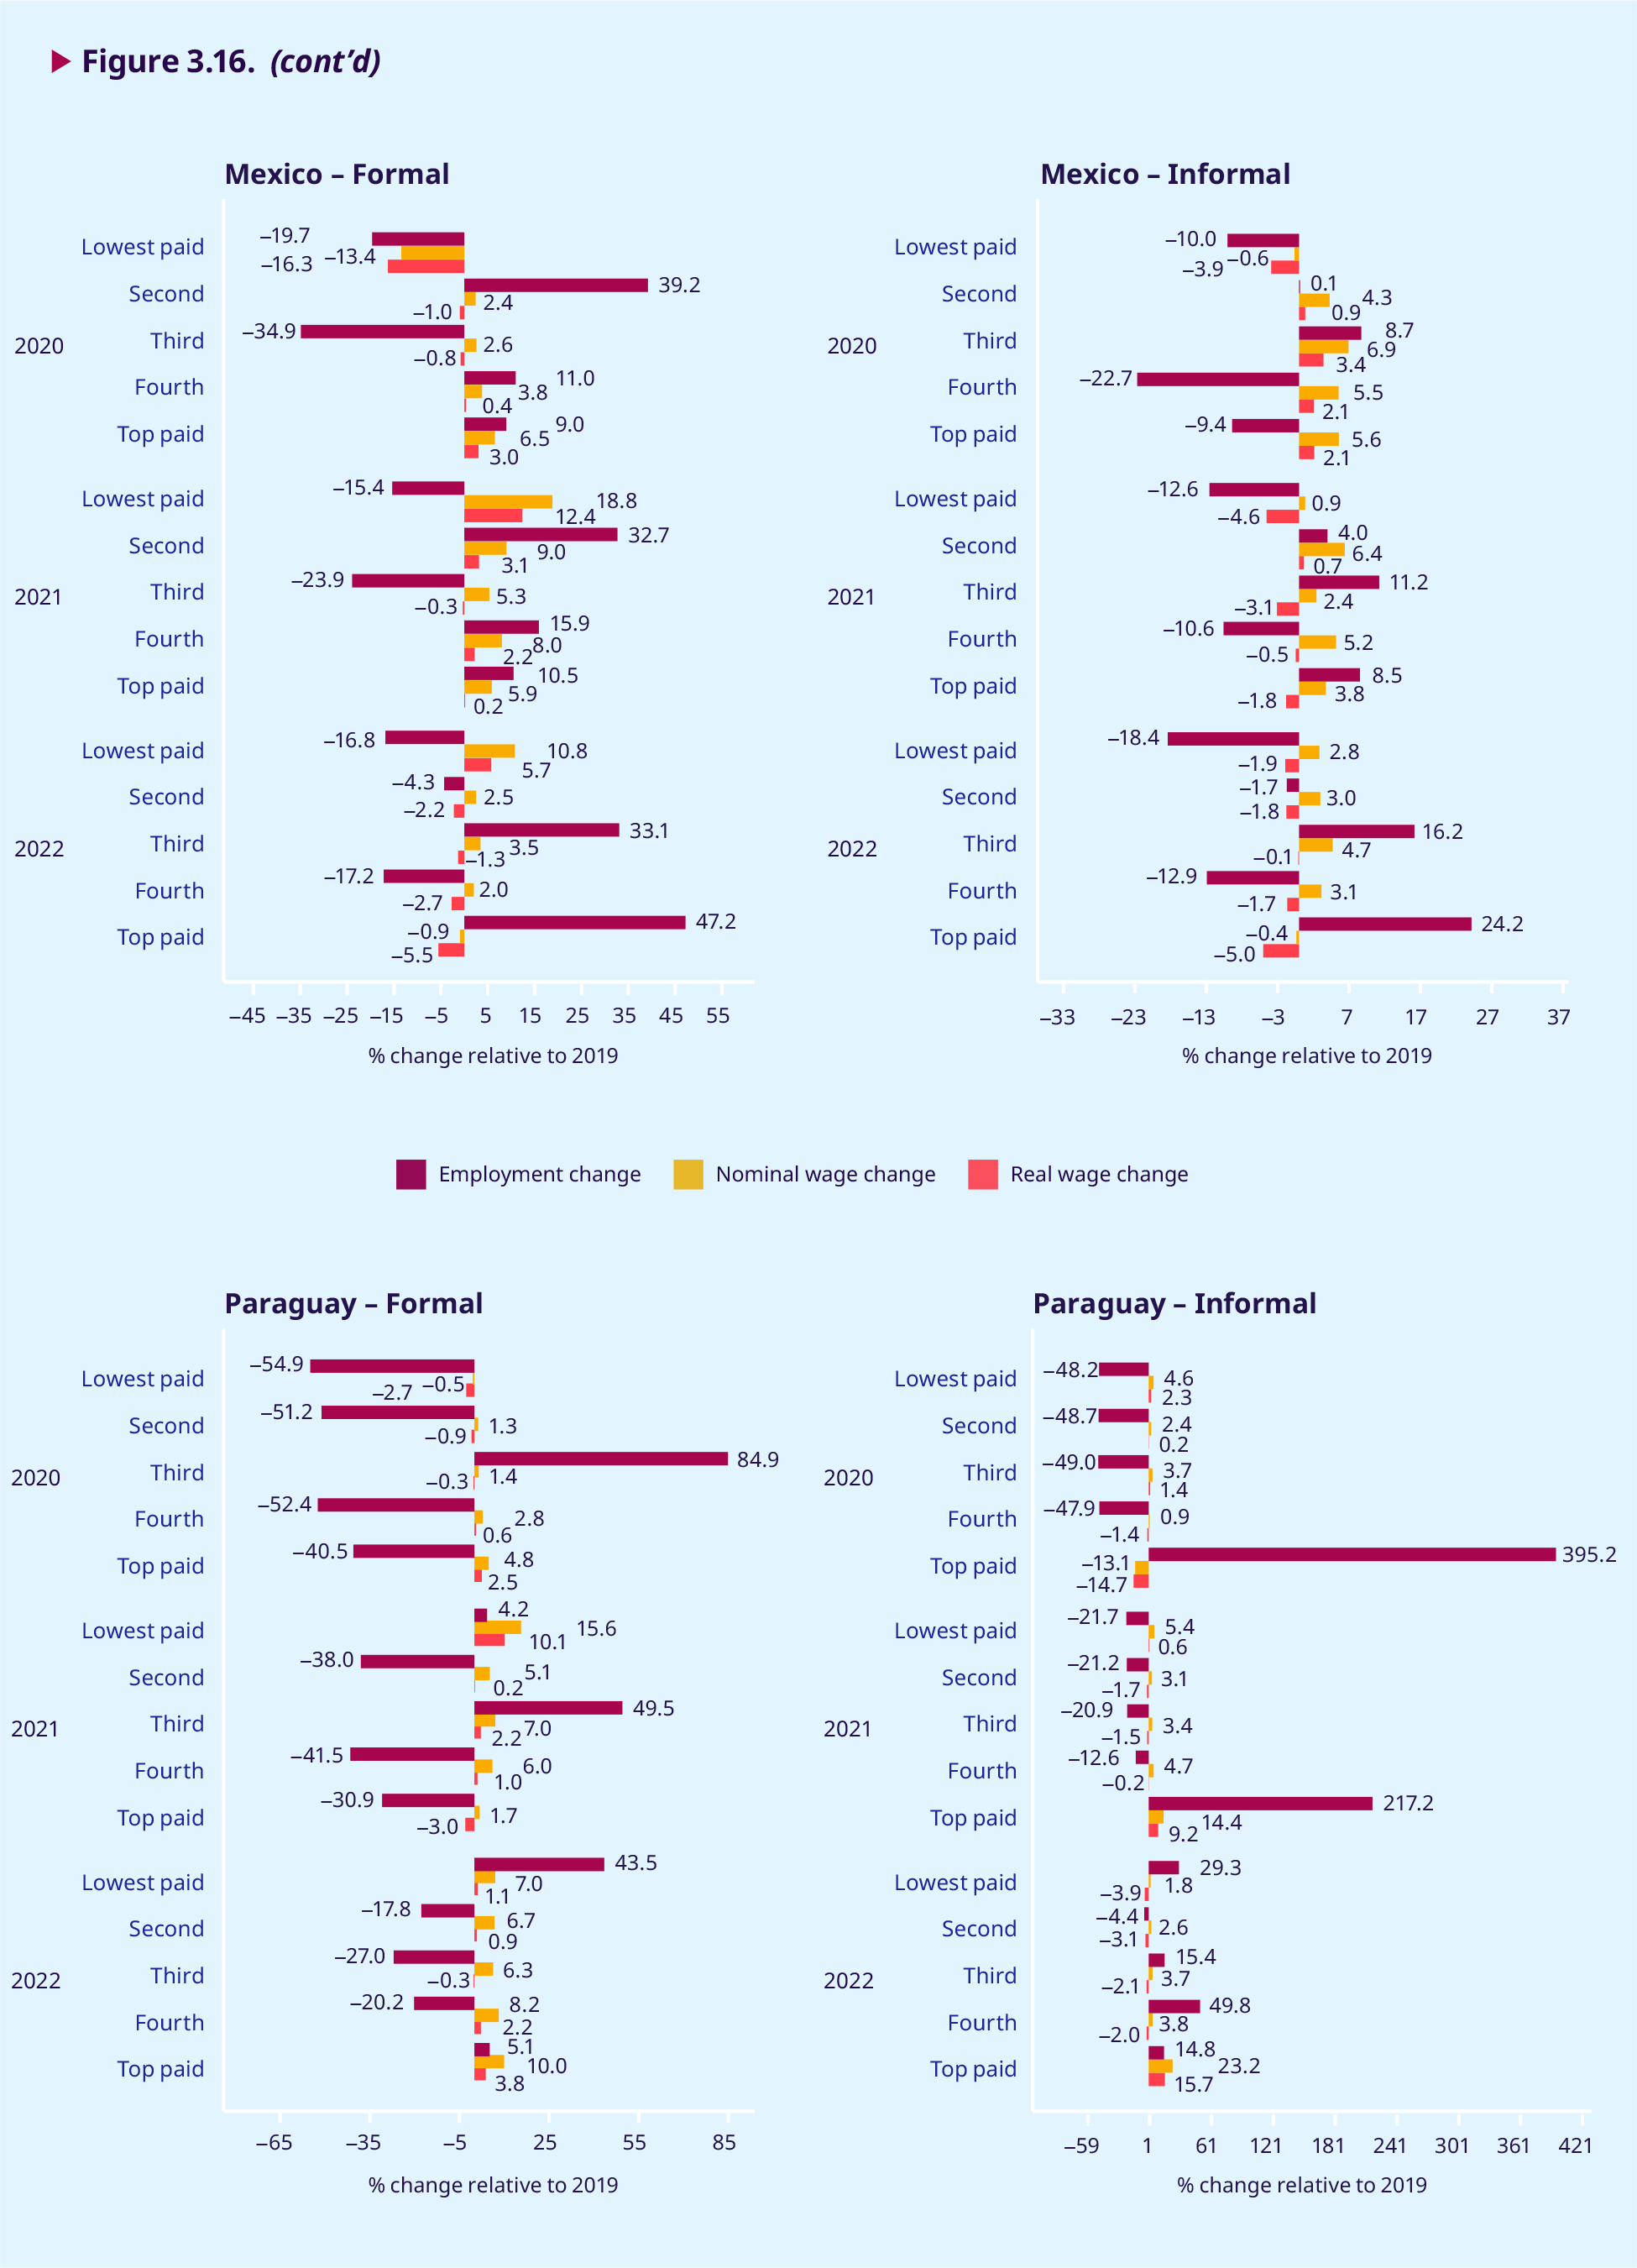
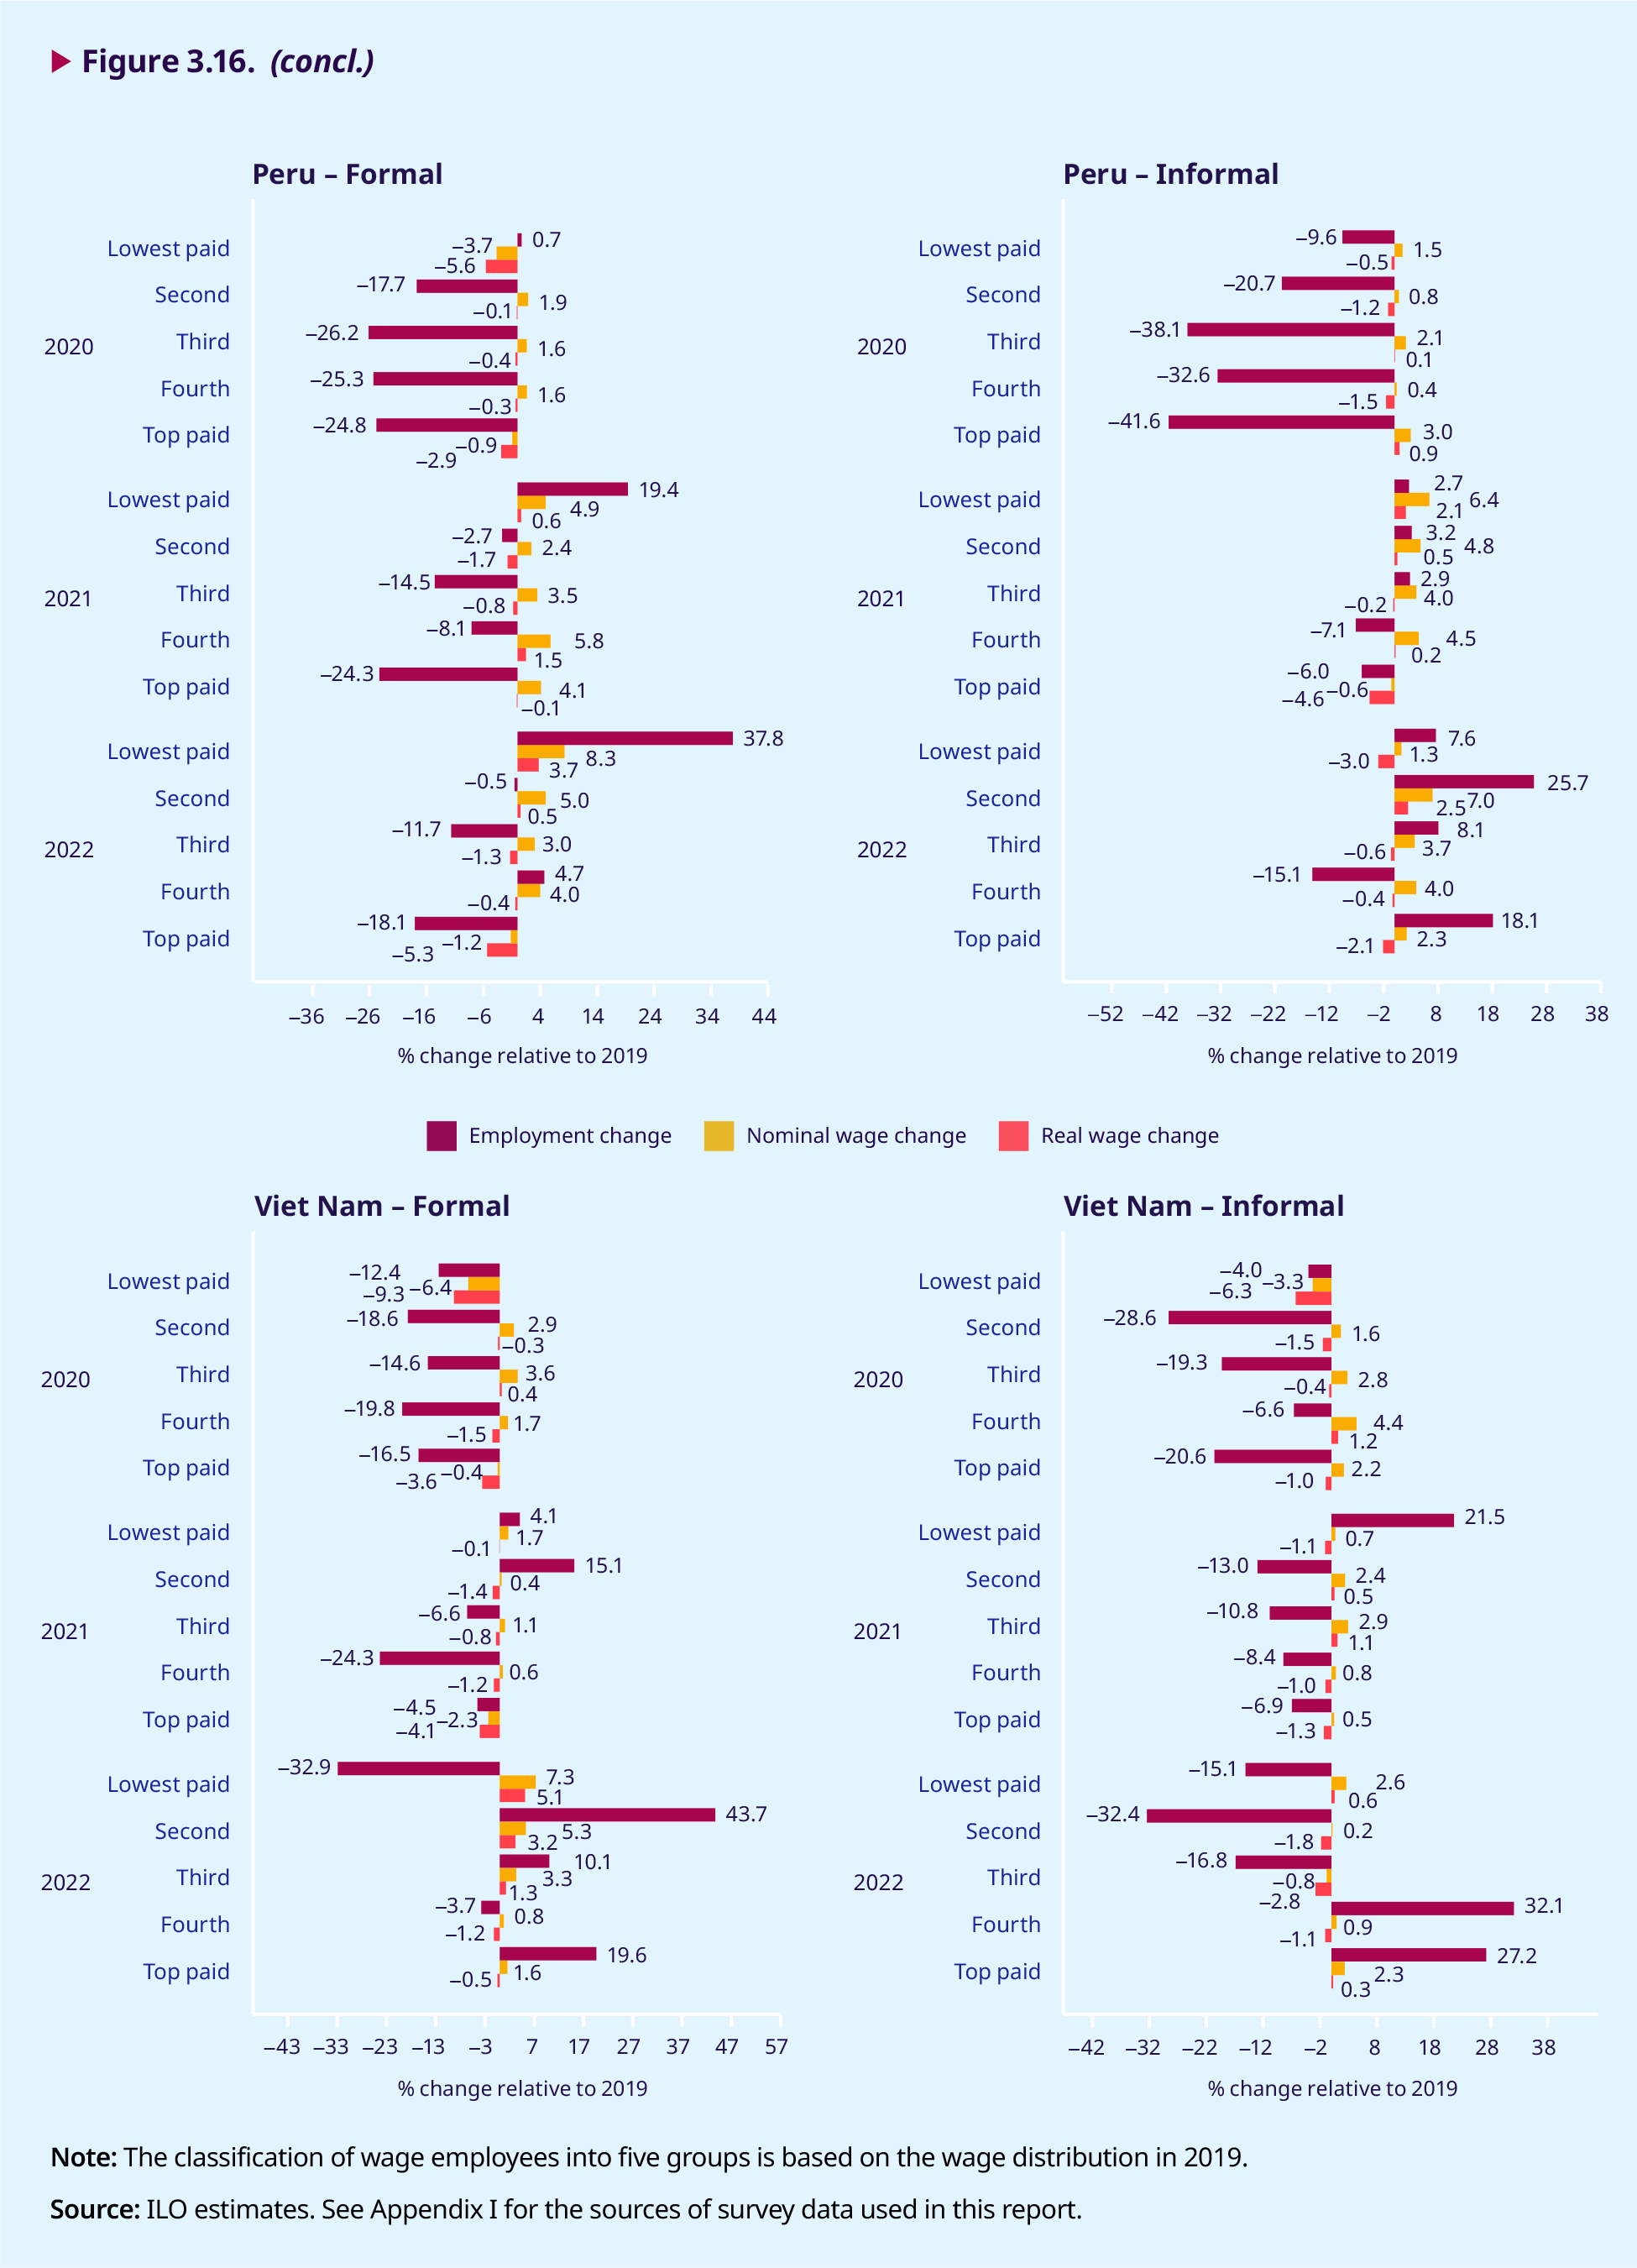
Low- and middle-income countries are often characterized by a high degree of informal employment, including informal wage employment. Were the losses of wage employees in the informal economy comparable to those of their formal counterparts? Did wage employees in the formal and informal economies recover at different speeds during 2021 and 2022? To answer these questions, figure 3.16 disaggregates wage employees by formal and informal employment. As can be seen there, in almost all countries the employment loss among wage employees in informal wage employment during 2020 was greater than that among their counterparts in formal employment. For example, in Brazil, the employment loss among the lowest-paid formal wage employees was 10 per cent, compared with 19 per cent among the lowest-paid informal employees. Similarly, in Colombia and Costa Rica, employment losses among the lowest-paid formal employees in 2020 were, respectively, 9 per cent and –0.4 per cent, whereas losses among the lowest-paid informal employees were, respectively, 16 per cent and 30 per cent.
With regard to employment recovery during 2021–22, the picture is mixed. In some countries, formal wage employment has recovered to a greater extent than informal employment (for example, Colombia and Viet Nam), but in others the opposite is true (for example, Ecuador). It is worth noting that during a crisis there can be shifts between formal and informal employment, with informal employment increasing at the expense of formal employment. Some studies suggest that in emerging market and developing economies the recovery of informal employment has been faster and stronger than that of formal employment, which would point to “scarring” of the labour market as a result of the COVID-19 crisis (ILO 2022b). This could be driving some of the patterns in figure 3.16. As regards earnings, the nominal wage increases observed in 2022 in each of the income groups among formal employees are almost always greater than those of the corresponding groups among informal employees. Among other things, this may reflect the reduced bargaining power of informal wage employees across the entire wage distribution in the aftermath of the COVID-19 crisis.